1. Introduction
Miniature circuit breakers (MCB) are constructed in accordance with current standards (e.g., European standards; IEC 60947). These requirements concern low voltage circuit breakers (LVCB; MCB). Despite the small sizes of the mentioned devices, they are adapted to effectively switch off the overload and short-circuit currents and protect the other elements of the electrical systems, such as cables and wires [
1,
2,
3]. During the process of extinguishing the electric arc in the circuit breaker, complex physical phenomena occur, such as heat released in the arc channel and the formation of electrodynamic forces, causing stress, affecting the contacts of the circuit breaker [
4]. These phenomena also affect the structural elements the device is made of (copper; steel; ferromagnetic; bimetals; aluminum; polymers, etc.). These occurrences can cause damage to the breaker after exceeding the critical values of electrical durability or temperature [
5].
The crucial element of the circuit breaker construction is the current path of the circuit breaker. During the switching off of the short circuit current, the current path is exposed to the thermal and mechanical influences, which can lead to the permanent damage of the element or even the whole circuit breaker [
6,
7]. The current paths vary in shape and size of electrical contacts. The greater the rated current of a circuit breaker, the stronger (more massive) the electrical contacts are in the current path [
8].
When the breaker contacts are closed, the operating current flows through the circuit breaker [
9,
10]. This results in Joule losses in current circuit elements that have very low resistances, such as contacts (transition resistance), short circuit breaker coils, and flexible connections of bimetal. Therefore, the breaker must effectively dissipate the heat generated in it by these elements [
11,
12].
In order to verify the construction guidelines and necessity of chosen solutions, many tests and simulations have been carried out that allow detection of defects and optimization of the current path at the project stage [
13]. These measures are essential to determine the appropriate cross-section of the main current path inside the circuit breaker (
Figure 1) and to check how the heat is dissipated from the current circuit by means of conduction, convection, and radiation [
14].
The usage of finite element method (FEM) coupled simulations is very effective for running a multiple analysis concerning electrical, thermal, and material durability aspects. The huge advantage of this method is the ability to check complicated scenarios employing various boundary conditions [
15,
16].
It is worth referring to the groundbreaking and important document “Grid 2030”. The United States, through the Department of Energy (DOE), envisions the future power grid as a fully automated power transmission network with the ability to monitor and control each network node, ensuring a two-way flow of information and energy between all nodes in the transmission and distribution process from the power plant to the end user [
17,
18,
19,
20]. Optimization of the operation of the air circuit breaker (MCB) and the compact circuit breaker (MCCB) is currently being conducted [
21]. Much of the research is focused on the optimization of extinguishing chambers [
22,
23,
24,
25]. Less frequently, the tests concern single and two-point contact systems, reducing the transition resistance [
25,
26,
27,
28]. In order to be able to fully prepare modular electrical devices for digitization understood as linking functions with intelligence in action, it is necessary to build, among others, FEM models and appropriate described electronics [
28,
29,
30].
As mentioned, research works in the field of modular electrical devices are carried out, some of them quite advanced. The authors present dynamic voltage models [
31,
32] and CFD models [
33,
34,
35,
36,
37,
38,
39].
The paper presents an advanced dynamic thermal model supporting research on:
Current carrying capacity;
Selection of the release system (short-circuit and overcurrent module);
Shaping the contact system;
Materials used.
The originality of the work is related to the capabilities of the model and its functionality (some of which is written above):
Proper modeling of the current path, including the routing of the arc channel;
Shaping the contact system, the entire transition resistance;
Selection of materials;
Introduction of a detailed, realistic model with exact physical properties;
The studied models can be used to calculate power losses and energy dissipation during operation under various conditions;
Shortening the design and implementation time of new electrical devices by solving the validated FEM model, in this case MCB;
A transparent and elastic method to describe thermal physical phenomena, which results in a reduction concerning the number of prototypes, increasing economic efficiency and reducing the impact on the natural environment;
The publications available so far are vital, and the authors of the manuscript have used them for analysis. However, the available literature does not deal with issues related to an organized and formalized approach concerning construction of thermal models of fuse-links. The study may be used in scientific and research institutes in the process of designing or enhancing the structure of electrical devices.
2. Assumptions for Theoretical Thermal Model
The thermal energy in the current path of MCB is generated by the rated current or short circuit current flowing through the current circuit, which is the main part of the circuit breaker construction with wires connected to its terminals. The thermal energy from the current path is dissipated into the environment by convection, conduction, and radiation.
The value of the electric power generated on a given breaker current path length is the aftermath of current and resistance, described below by means of the equation:
where
P is power dissipated per unit length (
W),
I is current in the conductor (
A), and
R is resistance per unit length of the conductor (Ω).
All calculations related to the current flow in the current path are possible using the following Maxwell equations:
where
is curl operator,
is divergence operator,
is magnetic field intensity vector,
is total current density vector,
is applied source current density vector,
is induced eddy current density vector,
is velocity current density vector,
is electric flux density vector,
t is time,
is electric field intensity vector,
is magnetic flux density vector, and
is electric charge density.
For the calculation concerning the coupled heat transfer process between the carrier fluid (air) and the solid domains, the Navier–Stokes equation is used alongside the energy equations; these are described below:
Energy equation:
where
are the Cartesian coordinates;
u,
v,
w are the velocities in
x,
y,
z directions;
is the velocity vector;
p is the pressure;
ρ is the density; μ is the dynamic viscosity;
is the body force vector;
is the temperature;
is the thermal conductivity of air;
is the viscous shear stress; and
cp is the specific heat.
During heat transfer from current paths, the following types of heat transfer to the environment can be distinguished:
Through radiation (radiation);
By convection (natural or forced);
By conduction (conductivity).
In the case of performing calculations for the current paths of electrical apparatus, all types of heat dissipation may occur.
The heat transferred by the conductive material or the insulating material is carried out by conduction. On the other hand, in the case of a heated current path placed in the air, e.g., an unenclosed switchgear (in an open version), heat is transferred to the environment by both radiation and convection.
When calculating the thermal (thermal) current paths of electrical apparatus for the rated load, the share of heat transfer by radiation, and natural convection is similar (for a temperature difference of several dozen Kelvin).
The conditions of heat transfer to the environment in thermal calculations are often determined using the heat transfer coefficient k, which defines the total amount of heat given off to the environment from a given surface per unit time from the cooled body to the surroundings.
The coefficient for the current path placed in the air is, therefore, the sum of the coefficients of heat transfer to the environment by convection and radiation, which is illustrated by the following dependence:
where
kr is the coefficient of heat transfer by radiation and
kk is the coefficient of heat transfer by convection.
where
Qo is a wave reflection coefficient,
Qw is a wave absorption coefficient, and
Qp is a wave transmission coefficient.
Using the Stefan–Boltzman law, it is possible to determine the radiation power
Ppr in relation to the surface of the radiating body:
where
is a black radiation coefficient of the given body,
is a Stefan–Boltzman coefficient, and
is radiating body temperature expressed in Kelvins.
During radiation from a given current path, electromagnetic waves of different lengths are sent. However, not all of them are capable of transferring thermal energy. Depending on the wavelength, they radiate thermal energy to a greater or lesser extent. The wavelengths that most effectively transfer heat energy to the environment are the waves in the range 0.4–10 µm, lying in the so-called reddened area.
The energy that is radiated from a given body is partially reflected, partially absorbed, and passed through another body; this phenomenon is described by the following formula:
where
dQ is the amount of heat energy transferred by conduction through the surface
S over time
dt, grad
ϑ is the temperature gradient normal to the surface
S,
λ is the material’s thermal conductivity coefficient,
Pc is the total heat power that has been transmitted through the section
S by conduction, and
P is the heat power transferred by a unit area by conduction.
The value of the λ coefficient for all bodies depends on their temperature. In addition, in the case of solids, it depends on the structure of the material, specific weight, pressure, and humidity. In the case of electrically insulating materials, the thermal conductivity is several orders of magnitude lower in relation to, for example, the copper current path.
Energy exchange between adjacent surfaces or between a surface and its surroundings can have a large impact on the overall heat distribution. Hence, although the radiation effects generally affect the heat transfer solution only through the boundary conditions, the coupling is particularly strong due to the non-linear temperature dependence of radiation. For this reason, the starting points are the equations below.
Extending the Stefan–Boltzmann law for the n-surface system, the energy balance for each surface can be described by the Siegal and Howell equation, which relates energy losses to surface temperatures:
where
n—number of surfaces,
δji—Kroneckers delta,
εi—emisivity,
Fji—radiation factor,
Ai—surface area,
Qi—energy losses,
σ—Boltzman factor, and
Ti—absolute temperature.
From the first law of thermodynamics, which speaks about conservation of energy, it is possible to find the physical basis in the form of the equation for conduction and convection:
where
ρ—density, c
p—specific heat,
T—temperature,
t—time, {
L}—vector operator, {
v}—velocity vector, {
q}—heat flux vector, and
—the rate of heat generation.
The heating of the contacts of the circuit breaker is generally considered by means of tests and calculations for two cases:
In the first case, the tested current paths reach the state of thermal equilibrium when the amount of heat released in the current path corresponds to the amount of heat given off to the environment. The duration of the temperature settling is five times the constant T.
In the case of heating of the current paths by the flow of instantaneous short-circuit currents, the amount of heat given off to the environment at the moment of their duration is negligibly small. The temperature achieved depends mainly on the amount of heat released during the passing short-circuit current.
In both considered cases, a very important parameter is the permissible temperature values of individual elements of the circuit breaker circuit. It is worth paying attention to the fact that the value of the permissible temperature during short-term heating in short-circuit current conditions may be higher than in the case of long-term heating with rated current. This is due to the fact that the effects of short-term thermal action, despite the higher value of the current, are smaller (not exceeding the permissible value).
Permissible temperatures for current paths are determined by taking into account the following factors:
The increase in temperature of the conductive material reduces its mechanical strength. In the case of copper, under continuous rated load conditions, the temperature rises in the range of 20–100 °C, the tearing strength decreases by approx. 10%, for 150 °C by approx. 15%, and for 200 °C by 25%. However, in the case of heating the current path with a short-circuit current from the ambient temperature of 20 °C to 300 °C, it reduces the tear strength by 15%.
Taking into account the factors described above and on the basis of tests, the permissible limit temperature increases for the external parts of overcurrent switches were defined in the IEC 60898-1: 2015 standard.
3. Design Assumptions for Circuit Breaker 3D Model
Currently, designing electrical apparatus is based on the use of tools (programs) for computer-aided design and prototyping of computer-aided design (CAD) and computer-aided engineering (CAE) types. These programs perform complex computational operations allowing the distribution of electromagnetic induction density, temperatures, stresses, and other physical quantities in the prototype device (3D model) to be determined.
In order to perform the above-mentioned computer simulations, a 3D model of the overcurrent switch was made.
All the individual structural elements of the switch were modeled in the “SpaceClaim Geometry” software. The elements of the current circuit were made with the maximum possible precision, maintaining their dimensions, shape, and position in relation to each other inside the circuit breaker. The main components of the circuit breaker are:
Short-circuit release coil combined with the switch’s fixed contact;
Moving contact;
Thermobimetal combined with the “arc runner”—the element along which the electric arc is led to the extinguishing chamber;
Arc chamber;
Upper and lower terminal of the switch.
The modeled elements of the current path are shown in
Figure 2 below. These are selected elements of the considered overcurrent circuit breaker.
After all the elements of the switch were made, it was possible to make a 3D assembly of the entire switch, as shown in
Figure 3 below.
The 3D model of the circuit breaker prepared in this way was ready to be loaded into solvers in ANSYS Workbench, which allowed for the performance of coupled analysis, which, after complex computational iterations, allowed us to check how different physical phenomena influence each other.
4. FEA Simulations
4.1. Simulations Assumptions and Settings
Coupled analysis was performed by coupling two solvers: Maxwell 3D and transient thermal. The computational simulations were performed for three cases: 0.8 × In, 1 × In, and for 2 × In. The results of coupled analysis for all three cases have been collected in
Section 5.1,
Section 5.2, and
Section 5.3, where they have been thoroughly presented and described.
In the transient thermal module, as in the Maxwell module, material properties were assigned from the material library, a mesh was generated (densified, for example, on contacts), and then “loads” were imported from Maxwell in the form of Ohm losses, which allowed for the temperature distribution in transient thermal. Material data are presented in
Table 1 below.
Table 2 presents computational iterations for executed simulations:
The simulation calculation error can be related to the error described as “energy error”, which in ANSYS Maxwell is reduced during the automatic compaction of the mesh during subsequent computational iterations by the function—“adaptive mesh refinement”—in areas where fields are of interest or the field gradients are high. The obtained convergence of calculations below 1% is a satisfactory result for this type of simulation; it often happens that the simulation cannot achieve convergence despite many computational iterations and a powerful generated computational mesh consisting of several million Tetrahedra elements.
Table 3 presents exemplary settings (transient thermal module) for executed simulations:
Moreover, it is worth mentioning the mesh size with the number of nodes amounting to 1,193,962 and number of elements amounting to 738,634. Ambient temperature in Maxwell 3D and transient thermal was set as 22 °C.
Forcing in Maxwell 3D Module was set as solid with current value of 32 A and phase equal to 0 degrees.
4.2. Current Flow Simulation for 0.8 × the Rated Current—25.7 A
The first coupled analysis performed with the ANSYS Workbench using paired Maxwell 3D and transient thermal environments allowed for obtaining precise results related to 0.8 × In current flow through the overcurrent circuit breaker.
The current density in the circuit breaker current path was highest in the part consisting of a movable contact and a fixed contact, as shown in
Figure 4a below. The effect of the current flow through the circuit breaker current path was the generation of losses in the form of released heat, which is presented below (
Figure 4b).
Calculations related to the current flow were performed, and on their basis, a thermal analysis was executed. Temperature distribution on the circuit breaker’s current path was obtained in form of graphical representation. The highest temperature value was reached on the solenoid release coil; it was equal to 47.37 °C. The higher temperature value on the coil in relation to the contact of the current path was caused by the high current density witnessed in the coil. Moreover, the presence of an aluminum housing inside the coil and a metal trigger pin, in which eddy currents were generated, caused additional losses in the form of generated heat. The temperature difference between the coil and the contact was less than 2 °C. The temperature distribution on the current path of the overcurrent circuit breaker is shown in detail in
Figure 5 below.
For validation of the obtained simulation results with experimental tests, the time courses of heating the contact, coil, and upper and lower terminals were generated using the “temperature probe” option. All the obtained waveforms were consolidated into one chart using the “chart plot” function. Temperature charts are presented in
Figure 6.
4.3. Current flow Simulation for 1 × Rated Current—32 A
For the second coupled analysis, precise results were obtained related to the flow of In (32 A) through the overcurrent circuit breaker. The current density in the circuit breaker current path was highest in the contact, as shown in the following
Figure 7a.
In this computational case, the value of generated losses related to the flow of rated current is similar in value both for the contact and for the coil. On the other hand, the total losses in the coil are greater, as shown in
Figure 7b above.
As in the previous case, after performing the calculation operations related to the current flow, a thermal analysis was performed for the circuit breaker during the flow of the rated current where the highest temperature value was also reached on the short-circuit release coil. The exact temperature distribution is shown in
Figure 8.
Additionally, for the purposes of the experimental validation, graphs concerning heating of current path elements were generated for the rated current, as shown in
Figure 9 below.
4.4. Current Flow Simulation for 2 × Rated Current—64 A
The third coupled analysis was performed for a double rated current of 2 × In (64 A). The current density in the circuit breaker circuit was much higher than in the previous cases; it achieved the highest value in the contact, as shown in
Figure 10a below.
As in the previous calculation case, the value of the generated losses related to the flow of rated current, in terms of value, was slightly higher for the contact than for the coil. On the other hand, the total losses in the coil were greater; this dependency is shown in
Figure 10b above.
From the obtained calculation operations related to the current flow and the performed thermal analysis for the circuit breaker during the flow of double rated current, the highest temperature value was reached on the short-circuit release coil, which was equal to 196.41 °C. The temperature difference between the coil and the contact was 8.61 °C. The exact temperature distribution is shown in
Figure 11.
As in the previous cases, additionally, for the experimental validation, plots of heating of the current path elements for double rated current were generated, as shown in
Figure 12 below.
Thermal analysis of the current path of the overcurrent circuit breaker were performed on a carefully prepared 3D model in ANSYS software, coupling two solvers: Maxwell 3D and transient thermal.
Each simulation performed in the first stage required calculations related to the flow of a given current through the current path (Maxwell 3D), which made it possible to determine the density of the current flowing through the current path and Ohm’s losses. Then, it was possible to import the data into another solver (transient thermal), which made it possible to determine (after performing a certain number of computational iterations) the temperature distribution on the circuit breaker current path.
The analysis performed in this way for the currents: 0.8 × In, In, and for 2 × In and the results of the temperature distribution obtained in this way were the basis for the experimental validation of the heating concerning the current path in real conditions at the above-mentioned currents, which is presented in the next subsection of this work.
5. Experimental Work
Currently, preliminary prototypes of electrical devices are designed using 3D computer software and coupled analysis programs for performing mechanical, thermal, electrodynamic analyses, etc. At a time when such tools did not exist, designers constructed electrical devices on the basis of mathematical calculations, experience, and employing the standards in force.
Currently, the miniature circuit breakers are also designed by the manufacturers in accordance with the standards. One such standards is the European standard IEC 60898-1: 2015. The scope of the standard includes standardized methods of testing overcurrent circuit breakers that are used in accredited laboratories to conduct type tests and tests of conformity of the manufactured devices with the given requirements of the standard. The performed tests allow manufacturers to check the operation and construction of the apparatus, which was previously designed in 3D software, the simulation analyses of which could include some simplifications. Additionally, type testing is necessary to obtain a certificate for the product that the manufacturer wants to introduce to the market.
In this work, an overcurrent circuit breaker with a rated current of 32 A was subjected to tests in order to check the temperature rise on the current circuit elements. This made it possible to carry out measurements in accordance with the above standard, which states that, during the measurements, no cover of the switch housing may be removed or unscrewed as in
Figure 13.
Type K thermocouples were glued with a special thermally conductive glue to the elements of the current path: coil, fixed contact, and upper and lower terminal. The spots of installation of the thermocouples depended on the previously performed computational analysis for the 3D model of this circuit breaker in order to juxtapose the obtained results. The glued thermocouples on the circuit breaker current path elements are shown in
Figure 14.
After the thermocouples were glued, the switch was put back to its original state before disassembly, and the glued thermocouples did not affect the switch mechanism, which did not cause any problems during its operation. Apart from the technological openings for inserting the thermocouples, no other openings and changes were made in the switch, which allowed for the correct measurements of the temperature rise.
Characteristics of thermocouples are standardized, and the values of the thermoelectric force for individual materials and permissible deviations are included in the international standard IEC 60584 and ITS 90. The afore-mentioned standard IEC 60584 defines the formulas for calculating permissible measurement errors. Therefore, for the “K” type thermocouple (NiCr-Ni—this was used in the validation process), the errors are presented in the
Table 4 below:
The measurement sensitivity for such a thermocouple is 41 μV/°C, hence, the SEM dependence in the temperature range used, −200 to 1200 °C, was almost linear. It is shown in
Figure 15 below.
In order to perform the tests, it was necessary to prepare a test stand for recording the temperature rise of the circuit breaker current path elements for specific currents: 0.8 × In, In, and for 2 × In. For this purpose, a single-phase autotransformer was used, to which a single-phase high-current transformer was connected. The autotransformer was used to regulate the current at the output of the high-current transformer. In order to measure the current, a clamp meter (ammeter) was installed on the cable supplying the tested object—an overcurrent switch. In order to collect data from installed thermocouples in the switch, a four-channel temperature recorder with an accuracy of 0.1 °C was used, the sampling time of which was set to 1 s (temperature was measured every second on four thermocouples). Data from the recorder, via the USB communication interface, were sent online to the recorder software on a PC, where the heating charts of the tested elements for the overcurrent circuit breaker were generated. The diagram of the measuring system is presented below (
Figure 16).
The length of the power supply cables to the circuit breaker is precisely defined in the standard and those are, respectively, equal to 1 m from the bottom of the circuit breaker and 1 m from the top of the circuit breaker. These recommendations were followed during the tests; the actual layout is shown in
Figure 17 below.
The ambient temperature was measured by means of two other thermocouples immersed in the oil reservoir—the temperature oscillated around 23 °C.
During the experimental tests, in order to illustrate the temperature distribution on the circuit breaker path and to, additionally, verify the obtained simulation and experimental results, at the end of the heating tests, photos were taken with a thermal imaging camera for each tested current.
5.1. Measurements of the Temperature rise Concerning the Circuit Breaker Current Path for 0.8 × In
During the test of the temperature rise of the contact and the remaining elements of the circuit breaker, the current of 0.8 × In (25.7 A) was set using an autotransformer.
The temperature recorded on the switch contact after its determination amounted to slightly over 44.9 °C. The highest temperature value was recorded for the electromagnetic release coil, which was heated to 46.8 °C after the temperature stabilized. Similar temperatures were recorded on the switch terminals: the lower terminal temperature was equal to 34.7 °C and the upper terminal to 35.0 °C. All recorded measurements are presented below in
Figure 18 in the form of a graph.
The obtained results of experimental tests were additionally compared with the measurement made with the use of a thermal imaging camera. Taking a photo with a thermal imaging camera allowed us to register the temperature distribution on the circuit breaker’s current path elements for the tested value of the current flowing through the current circuit.
Figure 19 shows and confirms that the highest temperature was released on the coil of the electromagnetic trigger. Measurements made with the use of a thermal imaging camera were consistent with the results obtained from tests with thermocouples.
5.2. Measurements of the Temperature Rise Concerning the Circuit Breaker Current Path for In
The tests of the temperature rise concerning the contact and the remaining elements of the circuit breaker for the current of In (32 A) were performed in the same way as in the previous point, giving the appropriate voltage value from the autotransformer to the high-current transformer in order to obtain the rated current of the circuit breaker.
The highest temperature value was recorded for the electromagnetic trigger coil, as in the previous measurement; following the test, it was determined to be equal to 64.1 °C. The temperature recorded on the switch contact, after it was established, amounted to slightly over 62.5 °C. The temperatures were recorded on the terminals: the lower terminal measured at −41.9 °C and the upper terminal −41.6 °C. All recorded measurements are presented in
Figure 20 in the form of a graph.
The obtained results of experimental tests, as in the previous case, were additionally compared with the measurement made with the use of a thermal imaging camera. Measurements made with the use of a thermal imaging camera were also consistent with the results obtained from tests with thermocouples (
Figure 21).
5.3. Measurements of the Temperature Rise Concerning the Circuit Breaker Current Path for 2 × In
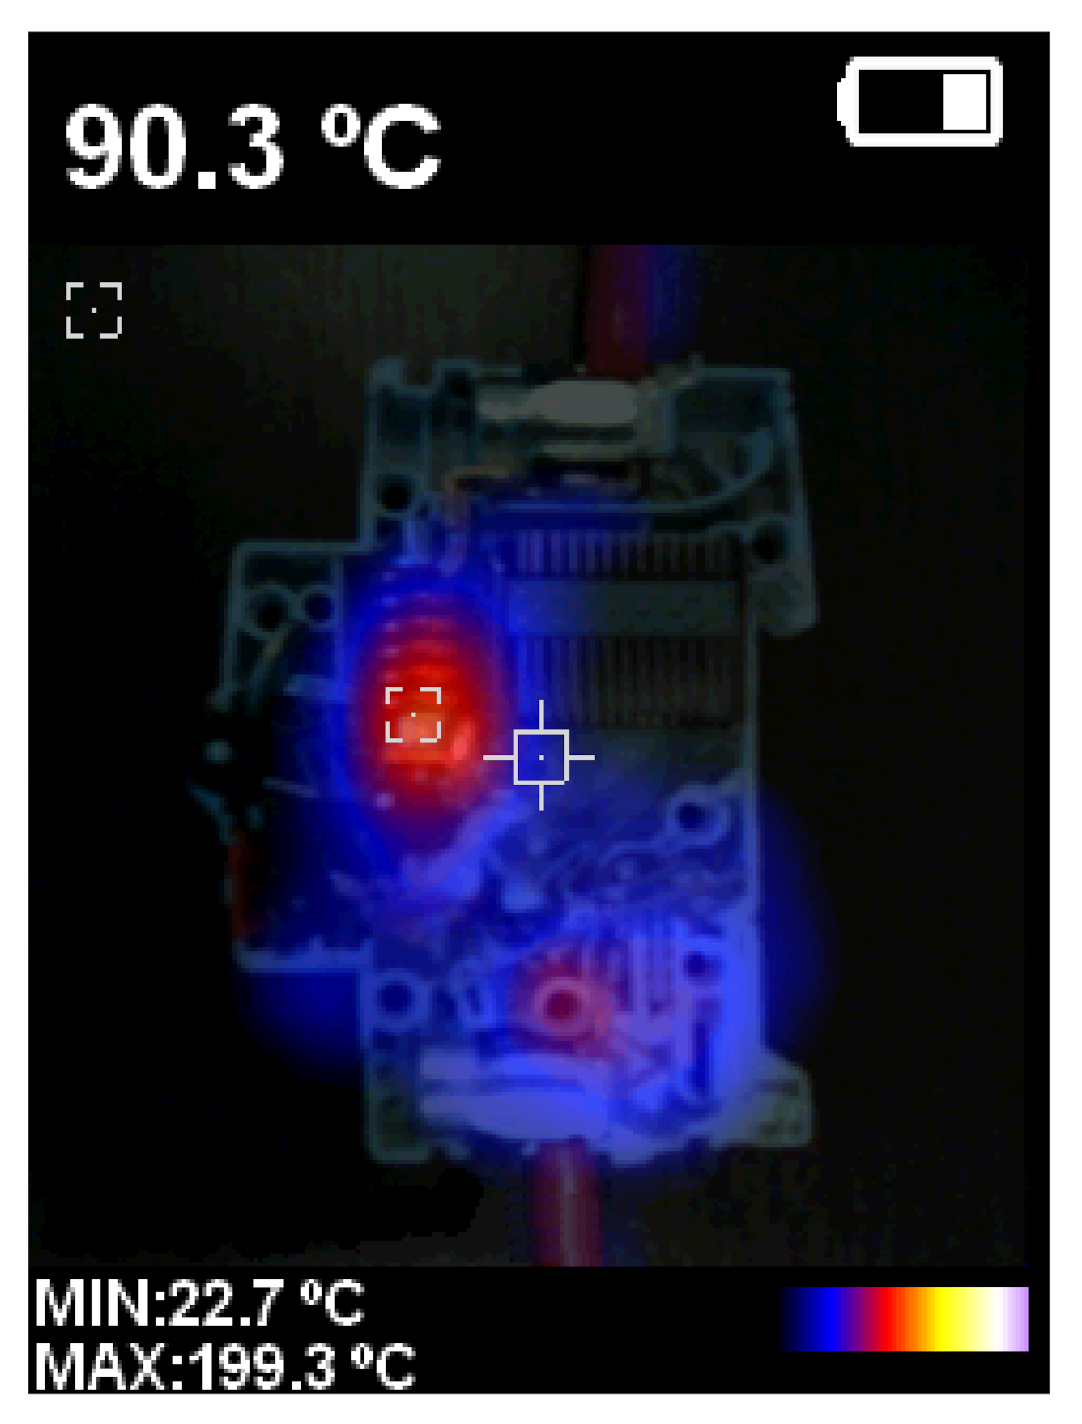
The temperature rise tests performed for the current of 2 × In (64 A) were performed similarly to the previous tests. In this case, the temperatures of the contacts and elements of the circuit breaker exceeded the allowable values of the temperature rise specified in the standard.
The highest temperature value was achieved on the electromagnetic release coil as in the previous measurements; following the test, it was determined to be 202.3 °C. The temperature recorded on the switch contact, after it was established, amounted to slightly over 192 °C. The temperatures were recorded on the switch terminals: the lower terminal measured at 93.9 °C and the upper terminal 96.8 °C. All recorded measurements are shown in
Figure 22 in the form of a graph:
The results of experimental tests for the double rated current have also been additionally correlated with the measurement made with a thermal imaging camera. Taking a photo with a thermal imaging camera allowed us to check the exact temperature distribution on the circuit breaker current circuit elements for the tested value of the current flowing through the current circuit.
Figure 23 shows and confirms that the highest temperature value evolved on the electromagnetic trigger coil. The measurements made with the thermal imaging camera were similar to the measurements made with the thermocouples. The temperature difference in the measurements taken, for example, on the trigger coil was almost 3 °C.
6. Results Summary
The performed experimental tests in the form of measurements concerning the heating of the circuit breaker current path elements allowed us to determine the actual temperature values of the individual circuit breaker parts depending on the current flowing. The recorded results were collected in the form of plotted heating curves for the currents: 0.8 × In, In, and for 2 × In.
The overload release of low voltage modular circuit breakers is located in the main circuit of the electrical apparatus. Regardless of the type of time–current characteristic, the current of this release is between 1.13 and 1.45 of the rated current (In). Moreover, in accordance with the standard for testing and certification of circuit breakers IEC 60989, the overload element can conduct 2.8 × In for up to 60 s. Hence, it was decided to use this current range to validate the simulation model. An additional argument was the willingness to check the model due to the non-linear dependence of resistivity as a function of temperature. Having such a selected and wide research schedule, it was possible to obtain correct validation.
The temperature values in the case of the current 0.8 × In and In did not exceed the permissible values of temperature increases and the permissible long-term temperature. In the case of a current of 2 × In, the above-mentioned values were exceeded.
For a current of 0.8 × In (25.7 A), the maximum temperature was reached on the short-circuit release coil −46.8 °C and on the contact −44.9 °C. 34.7 °C was noted on the lower terminal of the switch and 35.0 °C on the upper terminal of the switch.
In the recorded results for the rated current In = 32 A, despite the increase in current by only 6.3 A compared to the previous measurement, a significant increase in temperature was noted on the elements of the current circuit. The highest value, as before, was recorded on the electromagnetic trigger coil and amounted to 64.1 °C. The temperature at the switch contact, after it was established, was slightly over 62.5 °C. The following predetermined temperature values were reached at the switch terminals: lower terminal −41.9 °C and upper terminal −41.6 °C.
In the case of the last measurement for the double rated current of the circuit breaker, equal to 64 A, the temperature on the coil increased more than three times compared to the measurement for the rated current and amounted to 202.3 °C. A similar temperature value was recorded for the switch contact −192.5 °C. On the terminals, the value of the recorded set temperature more than doubled and amounted to, respectively, −93.9 °C on the lower terminal, and −96.8 °C on the upper terminal.
The switch during and after measurements was still fully functional. The achieved high temperature value of 202.3 °C did not affect the structure (housing) and other elements of the circuit breaker in any way—no part of it was melted or deformed.
The experimental tests, carried out using thermocouples in the form of K-type thermocouples coupled online with a temperature recorder and a PC, were additionally validated using photos taken with a thermal imaging camera. Measurements made with the use of a thermal imaging camera were made for the set temperature value just before the end of each measurement. The obtained results, in the form of photos from the thermal imaging camera, are consistent with the measurements made with thermocouples.
7. Conclusions
This article presents the construction of the current path of a modular circuit breaker that protects low voltage network circuits against short-circuits and overloads.
The main purpose of the work was the thermal analysis of the current path of the overcurrent circuit breaker, which was performed with the use of computer simulations and validated by the performed experimental tests.
In order to perform simulation coupled analyses, an accurate 3D model of individual parts of the current path, as well as the entire circuit breaker with power cables, was developed. The ANSYS software was used to carry out simulation calculations, which enabled direct connection of various types of solvers, creating couplings that were enabling data import from one solver to another and vice versa, e.g., from Maxwell 3D to transient thermal.
The simulation tests were performed for three currents: 0.8 × In, In, and for 2 × In. During the simulation, the values of the current density and Ohm losses in the current path were determined, which in turn, allowed us to determine which elements heat up the most and how the heat spreads in the modeled current path of the circuit breaker. From the data obtained during the coupled analyses, the heating courses of selected elements of the circuit breaker were generated, which, in the subsequent stages of work, allowed for the comparison of the obtained courses with the experimental tests performed.
To perform the experimental tests, a specially prepared switch was used with installed (glued in) K-type thermocouples inside that did not affect the mechanical and electrical operation of the switch. They allowed for precise temperature measurements of selected elements: short-circuit release coil, contact, and terminals. From the data collected by means of a temperature recorder, exact heating courses of the above-mentioned elements were generated. In order to verify the obtained results, photos were additionally taken with a thermal imaging camera for each of the three tested currents after reaching the set temperatures.
The obtained results of simulation tests and experimental tests were similar. The temperature distributions in the circuit breaker current path in the calculation simulations made in the transient thermal solver were consistent with the performed thermal imaging measurements. In addition, the generated waveforms of heating the circuit breaker part in the simulation calculations were very similar to those obtained during experimental tests with thermocouples.
The conducted analyses allowed us to conclude that the development of accurate 3D models and the performance of advanced coupled analyses can be successfully used during the construction and prototyping of new devices by designers of electrical apparatus. Thanks to this type of analysis, it is possible to make more elaborate designs of switches and electrical devices. In addition, it allows for significant reduction of the costs associated with the production of prototypes and the performance of tests and research in laboratories, which are often time-consuming.
The knowledge acquired during the implementation of the above issue allowed the authors to understand in detail and learn about the processes related to the flow of current through the current paths of electrical devices.


