Article

Analysis and Optimization of a Novel Hexagonal Waveguide Concentrator for Solar Thermal Applications

by
Karunesh Kant
1,2,
Karthik Nithyanandam
2 and
Ranga Pitchumani
2,*
1
Institut Pascal, Université Clermont Auvergne, CNRS, Clermont Auvergne INP, F-63000 Clermont-Ferrand, France
2
Advanced Materials and Technologies Laboratory, Department of Mechanical Engineering, Virginia Tech, Blacksburg, VA 24061-0238, USA
*
Author to whom correspondence should be addressed.
Energies 2021, 14(8), 2146; https://doi.org/10.3390/en14082146
Submission received: 19 February 2021 / Revised: 14 March 2021 / Accepted: 1 April 2021 / Published: 12 April 2021
(This article belongs to the Special Issue Thermal Energy Storage and Solar Thermal Energy Systems)

Abstract

:
This paper analyzes a novel, cost-effective planar waveguide solar concentrator design that is inspired by cellular hexagonal structures in nature with the benefits of facile installation and low operation and maintenance cost. A coupled thermal and optical analysis of solar irradiation through an ideal hexagonal waveguide concentrator integrated with a linear receiver is presented, along with a cost analysis methodology, to establish the upper limit of performance. The techno-economic model, coupled with numerical optimization, is used to determine designs that maximized power density and minimized the cost of heat in the temperature range of 100–250 °C, which constitutes more than half of the industrial process heat demand. Depending on the incident solar irradiation and the application temperature, the cost of heat for the optimal design configuration ranged between 0.1–0.27 $/W and 0.075–0.18 $/W for waveguide made of ZK7 glass and polycarbonate, respectively. A techno-economic analysis showed the potential of the technology to achieve cost as low as 80 $/m2 and 61 $/m2 for waveguide made of ZK7 glass and polycarbonate material, respectively, which is less than half the cost of state-of-the-art parabolic trough concentrators. Overall, the hexagonal waveguide solar concentrator technology shows immense potential for decarbonizing the industrial process heat and thermal desalination sectors.

Graphical Abstract

1. Introduction

Concentrated solar thermal (CST) technology utilizes focused sunlight to heat liquids or gases for process heat or power generation applications. State-of-the-art solar concentration systems employ flat mirrors (heliostats) or parabolic troughs integrated with active sun-tracking mechanisms [1,2,3]. The drawbacks that limit the widespread implementation of these focusing technologies include tracking errors; high capital, operational and maintenance costs related to drive systems, support structures, wirings, etc.; massive form factor of sun-tracking mirrors; and, large land area requirement [4,5]. A reduction in solar field cost while maintaining high optical efficiency is identified as a critical path to realizing the technoeconomic targets of the U.S. Department of Energy (DOE) [1]. Therefore, solar collection technologies based on non-imaging and fixed-optics are gaining significant attention [6,7].
The total internal reflection (TIR) based approach using waveguides for solar concentration is a promising alternative method. Waveguide concentrators have been investigated well in the area of concentrating photovoltaics, as it minimizes the quantity of expensive semiconductor material for a given power density [8,9,10,11,12]; however, the concept is new for CST applications. Total internal reflection in waveguides concentrator is realized using (a) luminescent solar concentrators [13,14,15,16,17,18] or (b) micro-optics based solar concentrators based on coupling topography [8,9,11,19,20], which is the focus of the present study. In a TIR based micro-optics solar concentrator, the incoming sunlight is focused by a micro-lens onto one or more localized scatterers in the waveguide, which guides the light waves towards the periphery via TIR, where the concentrated radiation is converted to heat on the surface of the receiver tube and transferred to the flowing heat transfer fluid. The cost effectiveness of the waveguide solar thermal concentration approach is primarily attributed to the reduction or exclusion of tracking cost that makes the system compact, and the flat planar form factor that enhances land-use efficiency as the collectors can be spaced closely (with no shading concerns), leading to increased power generation capability for a given land area. The light weight, simple installation protocol and structural design due to the flat planar form factor could leverage advances in the photovoltaics market for low-cost installation. Furthermore, the waveguides could be placed closer to ground, thereby eliminating or minimizing the heavy metallic structures that are currently needed to support troughs and heliostats against wind loading.
Nithyanandam et al. [21] recently conducted a coupled optical and thermal analysis on a planar waveguide solar concentrator for CST applications. The study was further extended for the radial waveguide concentrator [22]. In the present study, the analysis has been conducted for the hexagonal waveguide solar concentrator coupled to a linear receiver. The design is inspired by cellular structures in nature that are often hexagonal honeycombs. Hexagons allow for perfect regular tessellation that fills a flat space and has the least perimeter-to-area ratio, which minimizes the length of the receiver tubing for maximal thermal power delivery per unit cost. Further, as compared to other designs (planar or radial), the hexagonal waveguide decreases the absorption of sunlight in the waveguide materials by reducing the path of sun rays approaching the receiver surface. Because the absorption of sunlight is reduced, the heating of the waveguide material is reduced, which results in increased heat collection efficiency and waveguide material lifespan. The hexagonal waveguide concentrator is a potential solution for a broad range of applications that comprises industrial process heating, water and space heating, thermal desalination, etc. [5,23,24,25,26]. The aim of the present study is to design and analyze a hexagonal waveguide concentrator made of different waveguide materials through numerical simulations with the overall objective of maximizing realizable performance and identifying cost-effective designs for different process application requirements.
In this study we developed a TIR-based coupled thermal and optical model of an ideal hexagonal waveguide concentrator system. Numerical simulations have been conducted based on the developed thermal and optical model to evaluate the temperature distribution in the hexagonal waveguide concentrator and net solar irradiation reaching the receiver for the different operating and design parameters. An approach to estimating the cost of waveguide per aperture area ($/m2) and the cost of heat (COH) in $/W is discussed. The study has been conducted for two different waveguide materials namely, ZK7 glass and polycarbonate (PC), based on the design of experiments using standard L 16 orthogonal array [27]. The orthogonal array is used to correlate the waveguide length ( L w g ), waveguide thickness ( t w g ), receiver radius ( R r ), solar radiation intensity ( I 0 ), and heat transfer fluid temperature ( T F ) to the power density ( P o ) and maximum operating temperature ( T m a x ) of the waveguide for both materials. Feasible design and operating windows of the hexagonal waveguide concentrator system are presented while considering the maximum operating temperature and maximum thermal stress as constraints in applications. Further, the study is extended to finding the optimal combination of design parameters of the hexagonal waveguide concentrator-receiver system that maximizes the power density and minimizes the cost of heat (COH) for different operating conditions, subjected to constraints mentioned above.
The article is structured as follows: the optical, thermal, and cost analysis models and the numerical optimization problem formulation are presented in Section 2; the results of the parametric study, Taguchi analysis, cost analysis, and optimization study are discussed in Section 3, and Section 4 concludes with the key findings from the study.

2. Model Development

Figure 1a (top view) shows the geometric configuration of the hexagonal waveguide solar concentrator integrated with the receiver. The heat collection element (HCE) consists of a black chrome coated steel receiver pipe carrying heat transfer fluid (HTF). The dashed box in Figure 1a represents the periodic finite volume domain that is considered for the numerical simulations. Because of the periodic symmetry in the geometry, only one-sixth (red dotted line in the lower part of Figure 1a) of the hexagonal waveguide concentrator domain as shown in Figure 1b is considered for the analytical optical model derivation in Section 2.1. The length and thickness of the waveguide are denoted by L w g and t w g , respectively, and the radius of the receiver pipe is represented by R r as shown in Figure 1b. An air gap of thickness t g is assumed between the receiver pipe and waveguide (Figure 1b) to account for thermal expansion during operation. The top and bottom of the heat collection element are insulated to minimize heat loss to the ambient. In an actual waveguide-based solar concentration system, the incident solar rays are focused using an array of cylindrical lenses (not shown in Figure 1) on to a coupling structure engraved on the bottom surface of the waveguide similar to the configuration that was described by Karp et al. [8,9]. The rays reflected by the coupling feature at angles exceeding the critical angle would undergo total internal reflection (TIR), such that it is directed to the heat collection element positioned at the periphery of the waveguide (Figure 1b). Because of the compactness and lightweight of the system, sunlight can be focused on the waveguide throughout the day with just a few centimeters of lateral movement as demonstrated by Hallas et al. [28,29]. Because the objective of this study is to determine the theoretical maximum performance of an ideal hexagon waveguide concentrator configuration, it is assumed that all the incident rays undergo TIR through the perfect focusing of the rays onto the coupling feature. Further assumptions that were used in the derivation of the optical and thermal models are discussed below.

2.1. Optical and Thermal Model

The goal of the modeling is to obtain an upper limit on the performance of the waveguide concentrator that is depicted in Figure 1 for various application requirements. To this end, the numerical model is developed based on the following assumptions: (1) solar irradiation is perfectly focused by the lenses on to the coupling structure; (2) perfect TIR exists in the waveguide without escape cone losses; (3) during the TIR, no waveguide decoupling loss occurs because of the propagating rays hitting a coupling feature; (4) thermophysical properties of the waveguide materials are homogeneous and isotropic over the operating temperature range; and (5) the incident light is monochromatic, and the optical properties are invariant of wavelength.
Within the solid waveguide domain, the heat transfer is governed by conduction with volumetric heat generation corresponding to the absorption of solar energy by the material of the waveguide. The resulting temperature profile, T ( x , y , z ) , is given by the steady-state heat diffusion equation with internal heat generation, q [30].
( k T ) + q = 0
where k represents the thermal conductivity of the waveguide material. The volumetric heat generation, q , is obtained by considering the irradiation that is absorbed by the waveguide due to the extinction coefficient of material that attenuates the radiation reaching the HCE.
When considering that rays only propagate along x-direction (Figure 1b) and the light incident on the waveguide concentrator disperses homogeneously over 0 ϕ π 2   (Figure 1b), the incident solar radiation through an angle d ϕ is I 0 ( 2 3 x d x ) d ϕ π / 2 . The intensity of solar irradiation reaching the HCE depends on the path length and absorption coefficient of the waveguide material. The path length of light incident at x via d x is λ = L w g x sin ϕ . The total irradiation reaching the HCE can then be stated as:
I t 2 L w g 3 t w g = I 0 ϕ = 0 ϕ = π 2 x = 0 x = L w g ( 2 3 x d x ) e α λ ( d ϕ π / 2 )
which, when integrated, results in the following expression:
I t = 2 I 0 π L w g t w g ϕ = 0 ϕ = π 2 [ L w g sin ϕ α ( sin ϕ α ) 2 ( 1 e α L w g sin ϕ ) ] d ϕ
The net irradiation that is absorbed in the waveguide is calculated from the difference between the total irradiation incident on the waveguide ( I 0 A t ) and total irradiation reaching the receiver ( I t A c ), where A t = L w g 2 / 3   is the area of the cross-section of the waveguide at y   =   0 and A c = 2 t w g L w g / 3 is the cross-sectional area at x   =   L w g in Figure 1b. It is assumed that the volumetric heat generation is uniformly distributed within the volume of the waveguide, and can be expressed as:
q = I 0 A t     I t A c A t t w g = I 0 L w g 2 3     2 I t L w g t w g 3 L w g 2 t w g 3 = I 0 L w g 2 I t t w g L w g t w g
Note that the concentration factor of the waveguide concentrator is the ratio of the waveguide planar area ( A t ) to the cross-sectional area, where the rays are concentrated ( A c ), which is simply L w g / 2 t w g . The concentration ratio can be tailored through the appropriate choice of L w g and t w g . For the range of parameters explored in this study, the concentration factor ranges from 2 to 100.
The heat loss from the top surface of the waveguide depends on its surrounding and sky temperature, and it can be represented as:
k T y | y = 0 = ( h o + h f ) ( T ( x , 0 , z ) T ) + ε σ ( T 4 ( x , 0 , z ) T s k y 4 )
where h o and h f are the natural and forced convection heat transfer coefficient, respectively, obtained using correlations from the literature [30,31,32], T represents the ambient temperature and its value is considered as 30 °C in the present study, ε is the emissivity of the waveguide, and T s k y is the sky temperature. The sky temperature depends on variables, such as altitude, humidity, cloud cover, and the presence of other particles in the air such dust or pollution, and its value can obtained from the following relation: T s k y = 0.037536 T 1.5 + 0.32 T [31]. Similarly, the heat lost from the bottom waveguide surface to the ground at ambient temperature is given by:
k T y | y = t w g = ( h o + h f ) ( T ( x , t w g , z ) T ) + ε σ ( T 4 ( x , t w g , z ) T 4 )
On the lateral faces of the triangular unit of the waveguide in Figure 1b, symmetry boundary conditions are imposed, i.e., T n ( x , y , ± x 3 ) = 0 .
At the center of the waveguide, x = 0 , the temperature is finite, whereas the boundary condition at the outer edge of the waveguide segment, x = L w g , is governed by the heat transfer between the waveguide surface facing the receiver and the receiver surface, as given by:
k T x | x = L w g = U ( T F T ( L w g , y , z ) )
where T F is heat transfer fluid temperature, assumed to be nearly constant in the receiver section within the unit cell, and U is the overall heat transfer coefficient given by:
U = 1 t w g L w g ( F + g + r a d + w )
in which F ,   g ,   r a d , and w are the thermal resistance of the heat transfer fluid, air present in the gap, radiation heat loss from the HTF tube, and the HTF tube wall, respectively. The value of these thermal resistances are given by [30]:
F = 1 h r A c ;   g = t g k a i r A c ;   r a d = 1 h r a d A c   ; w = ln ( R r , i / R r , o ) 4 π L w g k r / 3
where h r is the convection heat transfer coefficient of HTF flowing in the receiver tube, t g is the air gap between the receiver and waveguide, R r , i and R r , o are, respectively, the inside and outside radii of the receiver tube, k r and k a i r are the thermal conductivity of the receiver tube wall and air, respectively, and h r a d is the radiative transfer coefficient from waveguide edge to the receiver tube that is obtained from: h r a d = ε F σ ( T F + T ( L w g , y , z ) ) ( T F 2 + T 2 ( L w g , y , z ) ) , in which F is the view factor given by [33]:
F = tan 1 [ t w g / 2 ( R r + t g ) ] t w g / 2 R r
The governing equation, Equation (1), and the associated boundary conditions that are given above, are solved for the temperature profile in the waveguide domain (Figure 1) using the heat transfer module of the finite element analysis software, COMSOL 5.3 [34]. The computational grid was built of structured four node free tetrahedral elements with an optimal mesh size, and totaled 625,164 elements, that was determined based on a systematic grid refinement study. A residual convergence of 10 6 was used to obtain the temperature field in the waveguide domain.
Every single receiver segment is attached to two hexagonal waveguides on either side (Figure 1a), and assuming all of the propagated radiation is transferred as heat to the HTF in the HCE at a thermal efficiency of η r , the net thermal power ( P t ) delivered to the receiver in the periodic domain is as follows:
P t = 24 I t L w g t w g 3 · η r
where η r is the receiver efficiency given in terms of the absorptivity of the receiver, β , as:
η r =   β U ( T F T ( L w g , y , z ) ) I t

2.2. Cost Model

An economic model was also developed to assess the optimum design configurations based on minimizing cost per unit aperture area and the cost of heat delivered. The total cost of the waveguide-receiver system per unit aperture area ( C ) can be expressed as:
C =   C r + C i n s + C c o a t + C r , s u p L w g   C r + C ¯ w g ρ t w g + C w g , s u p C w g
where C r ,   C i n s , C c o a t , and C r , s u p are the cost per unit length ( $ / m ) of the HTF pipe, insulation, black chrome coating, and receiver support, respectively, C r is the total receiver cost divided by the aperture area ( $ / m 2 ). The HTF pipe was assumed to be made of carbon steel, which is typically used in industries for steam or hot oil transport and the cost information was obtained from Ref. [35]. The HTF pipe was assumed to be insulated with 4-inch ( t i n s = 0.102 m) thick foam glass insulation. The insulation cost per unit pipe length is then calculated as C i n s = 4 ( R r , o + t g ) t i n s C i n s , where C i n s is the cost per unit volume of the insulation, which is estimated to be 356 $ / m 3 [36]. The black chrome coating cost per unit pipe length is calculated from C c o a t = 2 π R r , o C c o a t , where the coating cost per unit surface area ( C c o a t ) equals 15.1 $ / m 2 [37]. The cost of the receiver support structures per unit pipe length is calculated as C r , s u p = 2 π R r , o C r , s u p , where the cost of receiver support per unit surface area, C r , s u p , is assumed to be the same as that estimated for SkyTrough [38], C r , s u p = 113.5   $ / m 2 . C w g is the waveguide cost per unit aperture area ($/ m 2 ) with contributions from the material cost and the cost that is associated with waveguide support structures ( C w g s u p ). In Equation (13), C ¯ w g is the cost of waveguide material per unit mass ($/kg) and ρ is the density. The cost per unit mass of ZK7 glass and polycarbonate are taken to be 2.5 $/kg and 4.05 $/kg, respectively [39,40]. The cost of waveguide support for ZK7 glass was assumed to be the same cost as reflector supports ( C w g s u p = 5   $ / m 2 ) of the SkyTrough technology [38]. For polymeric waveguides, the support structure cost was scaled by the ratio of polymer to glass density to account for the cost reduction that is associated with supporting light-weight elements ( C w g s u p = 2.4 $/ m 2 ).
Additionally, the cost of heat (COH) delivered is assessed to find designs that yield minimum cost, while simultaneously increasing the net thermal power transport to the HCE. The cost of heat (COH in $/W) delivered is represented as:
COH =   C η C I o
where η C is the collection efficiency that is defined as η C = I t A c / I 0 A t . It is noted that the cost of the foundation, motor drives, structures, pylons, etc., which are the main cost elements of a parabolic trough collector [38], is small for the waveguide concentrator because of its closely-packed, lightweight, and potential non-tracking implementation. Consequently, the established model for cost calculation is a reasonably precise interpretation of a full-scale hexagonal waveguide solar concentrator system.

3. Results and Discussion

The model developed in the previous section couples the analytical optical model (Equation (3)) to a simple conduction model that solves for the temperature distribution within the waveguide using commercial computational software. Verification of the analytical optical model predictions is critical to ensure model accuracy. To the authors’ knowledge, there is no investigation of the concept for concentrated solar thermal applications. Nevertheless, the optical model that was developed in this study was based on the methodology presented by Nithyanandam et al. [22], which was verified through a comparison of the analytical results alongside the results that were obtained from the ray-tracing simulations performed using TracePro [41]. In addition, the analytical solution obtained for I t in Equation (3) is verified with physical consistency checks. For instance, if there is no volumetric absorption coefficient ( α = 0 ) in the waveguide, then it is expected that all of the incident irradiation ( I 0 ) will be concentrated on the HCE, such that I t = I 0 A t A c = I 0 L w g 2 t w g . Starting from Equation (3) and defining α * = α sin ϕ , it can be shown that the equation reduces to the following:
I t = 2 I 0 π L w g t w g ϕ = 0 ϕ = π 2 [ L w g α * 1 + e L w g α * α * 2 ] d ϕ
In the limit of α 0 (i.e., α * 0 ), and using the L’Hospital rule, the above expression reduces to the physically expected solution of all incident irradiation reaching the edge of the waveguide as shown below:
I t = lim α * 0 { 2 I 0 π L w g t w g ϕ = 0 ϕ = π 2 L w g 2 e L w g α * 2 d ϕ } = I 0 L w g 2 t w g
Similarly, for very large volumetric absorption coefficient as α , I t in Equation (3) reduces to zero as physically expected, because all incident irradiation will be absorbed within the waveguide. The verification checks discussed here furnish the assurance to use the modeling framework for detailed systematic parametric studies of a hexagonal waveguide concentrator made of different materials.

3.1. Parametric Analysis

Based on the models presented, the study first evaluates the influence of design parameters, namely, receiver radius ( R r ) , absorption coefficient ( α ) , waveguide thickness ( t w g ) and waveguide length ( L w g ) , and operating parameters namely, incident irradiation ( I 0 ) , HTF temperature ( T F ) , on the steady-state temperature distribution. Further, the influence of HTF temperature ( T F ) on net thermal power delivered ( P t ) , maximum operating temperature ( T m a x ) , and collection efficiency ( η c ) are investigated at different values of I 0 , R r , t w g , and L w g . The gap between the waveguide and receiver ( t g ) and the convective heat transfer coefficient of the HTF flow in the receiver ( h r ) are considered to be 0.003 m and 500 W / m 2 K , respectively. From the Dittus–Boelter equation [30], the assumed convective heat transfer coefficient for thermal oil-based HTF flow in the receiver corresponds to a Reynolds number of ~15,000, which is typically observed in solar thermal systems [42]. The value for absorptivity ( β ) of the receiver surface is considered as 0.95 [21,22]. The feasible design space for waveguide is dictated by the maximum allowable temperature in the waveguide due to irradiation absorption during operation. The maximum temperature in the waveguide will be observed when the convective heat transfer loss from the waveguide to the ambient is at its lowest. Hence, the value of forced convection heat transfer coefficient ( h f ) from waveguide to ambient is assumed as 0 W/m2-K to obtain a conservative design, as it represents the worst-case scenario in terms of the maximum temperature that occurs in the waveguide. The natural convection heat transfer coefficient from the planar horizontal waveguide to ambient ( h o ) was obtained from the well-established correlation in the literature [30] that evaluates to ~2.5 W/m2-K. Further, the thermophysical properties of the two materials considered in the study, ZK7 and polycarbonate (PC), are given in Table 1.
Figure 2 represents the temperature contours in a ZK7 hexagonal waveguide solar concentrator element at different T F and I 0 for t w g =   0.025   m , R r = 0.02   m , and L w g =   0.25   m . The maximum temperature within the waveguide is governed by volumetric heat generation rate, because of the incident solar irradiation absorption, HTF temperature that affects the heat exchange between the waveguide edge facing the HCE and the receiver pipe surface, and the heat loss to ambient in the form of convection and radiation (Equations (5) and (6)). Figure 2a presents the temperature contour for T F = 150 ° C , 200 ° C , and 250 ° C at I 0 = 1000   W / m 2 . The temperature of the hexagonal waveguide solar concentrator is higher near the HTF tube as the HTF tube loses heat from its outer surface and transfers to the waveguide by convection and radiation. Consequently, the temperature of the waveguide increases with an increase in HTF temperature. Figure 2b depicts the temperature contours of the waveguide at different I 0 while considering T F = 250 ° C . The waveguide temperature increases with an increase in I 0 , because higher incident solar irradiation leads to higher irradiation absorption and higher temperature excursion in the waveguide. The highest temperatures in the hexagonal waveguide ( T m a x ) were observed at the corners, as seen in Figure 2. These maximum values will limit the design of the optimal waveguide/receiver configurations as discussed later in this section.
Figure 3a–f present the effect of different operating and design factors on the spatial distribution of the temperature increase ( T w g T ) inside the waveguide (ZK7 material). The non-dimensional distance is labeled as x * = x 0.5 L w g L w g , such that x * = 0 represents the center and x * = ± 0.5 represents the corner of the hexagonal waveguide, as sketched in Figure 3e. The temperature increase is calculated at the mid-height ( y   = t w g / 2 ) of the waveguide. The default values of I 0 ,   T F ,   R r ,   α ,   t w g and L w g in Figure 3 are 1000 W / m 2 , 250 ° C , 0.02 m , 1.4 m 1 , 0.025 m , and 0.25 m , respectively, unless specified otherwise. For all of the parameters, the temperature increase is the highest at the outer edge of the hexagon as compared to the center of the waveguide, because the waveguide is heated by the HTF receiver pipe. Figure 3a demonstrates the effects of the incident solar irradiance on the temperature profile inside the waveguide concentrator. It is observed that an increase in the incident irradiation increases the magnitude of the steady-state temperature distribution in the waveguide solar concentrator, because the increase in ray absorption results in higher volumetric heat generation. The temperature rise for the solar radiation of 250 W/m2 is nearly zero at the center of the waveguide because the heat generated due to irradiation absorption is compensated by the heat lost to the ambient.
Figure 3b presents the influence of HTF temperature on waveguide temperature rise. The temperature of the waveguide increases with an increase in HTF temperature, mirroring the trend shown in Figure 2a. Further, Figure 3c depicts the effects of the receiver radius on the temperature rise of the waveguide. The temperature of the waveguide rises with an increase in the receiver radius due to an increase in surface area that leads to enhanced heat transfer interaction between the HTF receiver pipe and waveguide. Further, the study has been conducted at five different absorption coefficient values, and Figure 3d presents the obtained temperature rise. The increase in the absorption coefficient of waveguide materials leads to increased attenuation of rays and results in higher temperature rise, as contrasted with a lower absorption coefficient. For the absorption coefficient of 0.1 m 1 , the waveguide material absorbs a very small fraction of the incident radiation and, therefore, the temperature rise of the waveguide is negligible at the center of the waveguide. However, with an increase in the absorption coefficient, the operating temperature increases consistently. Furthermore, increase in waveguide thickness causes an increase in the temperature of the waveguide because of the increase in path length for the ray propagation that results in higher irradiation absorption, leading to higher operating temperature, as shown in Figure 3e. Figure 3f presents the influence of waveguide length on the temperature rise of the waveguide. The path length of solar rays to reach the receiver surface increases with an increase in waveguide length, which leads to increased absorption and results in a higher temperature rise within the waveguide (Figure 3f). Although the temperature rise at the center of the waveguide for L w g = 0.1 m is higher than that obtained for L w g = 0.25 m, the maximum temperature rise that is observed at the corner for L w g = 0.25 m is higher than that observed for L w g = 0.1 (Figure 3f).
Figure 3. Influence of (a) incident solar radiation ( I 0 ), (b) HTF Temperature ( T F ), (c) Receiver radius ( R r ), (d) absorption coefficient ( α ), (e) thickness of waveguide ( t w g ), and (f) length of waveguide ( L w g ) on the spatial temperature rise distribution in a hexagonal waveguide solar concentrator.
Energies 14 02146 g003
Figure 4 presents the influence of HTF temperature on the net thermal power delivered and the maximum operating temperature of the waveguide for different parameters. Figure 4a depicts the variation of net thermal power delivered and T m a x with T F for five different   I 0 . The maximum thermal power delivered ( P t ) is obtained for the highest incident solar radiation i.e., 1250 W / m 2 because the total irradiation that reaches the end of the waveguide is directly proportional to I 0 . The absorbed irradiation in the waveguide increases with an increase in I 0 , resulting in higher volumetric heat generation and T m a x in the waveguide. Further, the net thermal power delivered decreases with an increase in the HTF temperature because of higher heat loss from the HTF receiver pipe. In addition, the heat exchange between the HTF receiver pipe and waveguide also increases with an increase in T F , which results in higher T m a x . The increase in T m a x with an increase in T F can be observed in all of the plots depicted in Figure 4. Figure 4b presents the variation of net thermal power delivered and T m a x with T F for five different values of R r . The net thermal power delivered decreases with an increase in both the HTF temperature and receiver radius. The increase in surface area with an increase in receiver pipe radius leads to higher heat loss from the receiver surface and subsequently, lower net thermal power delivery. Because part of the heat lost from the receiver surface interacts with the waveguide, T m a x increases with an increase in receiver pipe radius (Figure 4b). The difference in the temperature rise, as well as the net thermal power delivered between the different receiver radius, is small at a lower HTF temperature. This is explained by the decrease in temperature difference between the HTF receiver pipe, ambient air, and waveguide temperature, which limits the heat exchange. As expected, at higher HTF temperatures, the converse is observed, such that the differences in T m a x and P t are large (Figure 4b).
Figure 4c presents the net thermal power delivered and T m a x as functions of T F for five different waveguide lengths. The smallest waveguide length delivered a very small amount of net thermal power to the HCE because of the smaller collection area for incident solar radiation. For L w g = 0.1   m and T F = 50   ° C , a larger fraction of the collected irradiation in the waveguide is lost as heat to the ambient and, therefore, the net thermal power delivered is closer to zero, as shown in Figure 4c. The maximum temperature of the waveguide increases with the length of the waveguide because of an increase in the path length of light rays in the waveguide that consequently increases the heat generation rate within the waveguide, owing to higher irradiation absorption. Figure 4d shows the effect of waveguide thickness and HTF temperature on net thermal power delivered and the maximum waveguide temperature. The net thermal power delivered decreases while the maximum waveguide temperature increases with an increase in the waveguide thickness. This is attributed to the longer path length and higher absorption of total internally reflected light rays that result in lower thermal power output and higher waveguide temperature. Similar to that observed in Figure 4c, at the lower HTF temperature, the difference between the net thermal power delivered for different waveguide thicknesses is minor; however, its value increases with an increase in the HTF temperature.
Figure 5 presents the variation in collection efficiency with the HTF temperature for different operating and geometrical parameters of the waveguide solar concentrator. The collection efficiency decreases with an increase in the HTF temperature for all parameters, because a higher HTF temperature results in higher heat loss from the receiver surface. Figure 5a represents the variation of collection efficiency with HTF temperature for different incident solar radiation. The collection efficiency is higher for higher incident radiation as the thermal power transferred to the receiver from the waveguide increases with an increase in the intensity of incident solar radiation. Figure 5b presents the effect of the receiver radius on collection efficiency. The collection efficiency is higher for a smaller radius of the waveguide because of lower conductive and radiative heat loss from the receiver surface. Figure 5c presents the variation in collection efficiency with HTF temperature for different L w g . With an increase in the length of the waveguide from 0.25 m to 1 m, the collection efficiency decreases for all HTF temperature range due to an increase in ray absorption; however, this behavior is different for an increase in L w g from 0.1 m to 0.25 m. As expected, the collection efficiency is highest for L w g = 0.1   m up to HTF temperature of 135 ° C , however, beyond that, the collection efficiency decreases and reaches the lowest value at 250 ° C HTF temperatures. At high temperatures, the heat loss from the receiver pipe increases and, since, for L w g = 0.1   m , the solar collection area and the concentrated irradiation intensity are small, the net thermal power that is delivered to the HTF decreases drastically. For longer waveguides, the magnitude of the concentrated irradiation is much higher than the heat loss from the receiver that this phenomenon is not observed for the HTF temperature range studied here. Figure 5d shows the effect of waveguide thickness on collection efficiency. The collection efficiency of the waveguide solar concentrator reduces with an increase in the waveguide thickness because of the higher absorption of incident solar radiation in the waveguide.

3.2. Design of Numerical Experiments

Figure 3, Figure 4 and Figure 5 present the effects of the different parameters on the waveguide temperature and thermal power delivered, by changing one parameter each time. It is of interest to understand the interactive effects of the different parameters on the power density and the maximum temperature waveguide, so as to design the waveguide concentrator for maximizing the power density while limiting the operating temperature to within acceptable values. To this end, an orthogonal array based design of experiments was conducted, from which a response surface was derived to obtain a functional relationship for the power density and the maximum temperature in terms of the governing parameters. For each waveguide material with its corresponding absorption coefficient ( α ) specified in Table 1, a standard L 16 orthogonal array constituting the design of numerical experiments that spans a range of L w g , t w g , R r ,   I 0 , and T F was constructed, as presented in Table 2. For each of the waveguide materials, numerical simulations were conducted to investigate the power density ( P o ) and maximum operating temperature ( T m a x ) in the waveguide for all of the experiments presented in the L 16 orthogonal array. Here, the power density is the ratio of the thermal power delivered, P t , to the planar area of the waveguide in a unit cell identified by the dashed rectangle shown in Figure 1a; i.e., P o = 3 P t 12 L w g 2 .
Based on the results that were obtained for the power density ( P o ) and the maximum temperature ( T m a x ) from each experiment of the L16 orthogonal array, empirical correlations were developed for the performance metrics in terms of L w g , t w g , R r , I 0 and T F , which are expressed in the following general form:
P o ,   T m a x = { C 1 + C 2 L w g + C 3 t w g + C 4 R r + C 5 I 0 + C 6 T F +   C 7 L w g 2 + C 8 t w g 2 + C 9 R r 2 + C 10 I 0 2 + C 11 T F 2 +   C 12 L w g t w g + C 13 L w g R r + C 14 L w g I 0 + C 15 t w g R r
where C i , i = 1 15 , are the coefficients for each of objective functions namely, power density, P o , and maximum temperature, T m a x , determined from the Taguchi orthogonal array analysis, as summarized in Table 3 for the two different waveguide materials. Figure 6 compares the accuracy of the correlations with the numerical simulation results on the power density (Figure 6a) and the maximum temperature in the waveguide material (Figure 6b). The presented results cover both materials PC and ZK7 depicted by the circle and the square markers, respectively. The developed correlations and the simulation results are in close agreement for both P o (Figure 6a) and T m a x (Figure 6b), where 85% of predicted power density and the maximum temperature fall within ± 10% (dashed lines) of the line of exact agreement (solid line diagonal to the plot frames) for both of the waveguide materials. The validated correlation is used to understand the effect of the various parameters on the power density and maximum temperature and to develop design windows, as discussed below.
Figure 7a depicts the variation in net thermal power density ( P o ) delivered to the receiver as functions of both waveguide length and incident irradiation for the waveguide concentrator made of ZK7 glass for an application requiring HTF temperature at 100 ° C , receiver radius of 0.01 m, and waveguide thickness of 0.02 m. Figure 7a shows that the net thermal power density decreases with an increase in waveguide length due to an increase in path length of rays within the waveguide leading to higher attenuation, as explained earlier. The thermal power density that is collected at the receiver is directly proportional to the incident irradiation. The same trend is observed for the PC waveguide material in Figure 7d. For a given incident irradiation, the intensity of rays propagated to the periphery of the waveguide is higher for PC (Figure 7d) than ZK7 glass (Figure 7a) due to its lower absorption coefficient. For higher application temperature requirements, the increase in thermal losses from the receiver decreases the power density concentration, as observed from comparing Figure 7a,g. The temperature rise within the waveguide is dependent on the absorbed irradiation intensity and hence, the maximum temperature follows the inverse trend of power density (Figure 7b,e,h). Specifically, the maximum temperature in the waveguide increases with an increase in waveguide length and an increase in incident irradiation. When comparing Figure 7b,e,h, it is observed that the larger attenuation coefficient (Figure 7b,e) and higher HTF temperature (Figure 7b,h) increases the maximum temperature in the waveguide.
Table 3. Values for the coefficients of Taguchi correlations expressed by Equation (16).
Constants P o T m a x
ZK7PCZK7PC
C 1 −58.37−51.1422.1313.33
C 2 143.50164.6212.2522.33
C 3 −13,04112,007−962.2−2432
C 4 −22,116−20,196.5−1047.1−987
C 5 1.1401.1370.0140.023
C 6 1.3561.1570.1660.360
C 7 0.430−18.1072.60376
C 8 −72,941−51,614−349−1302
C 9 −501,458−397,740 5.29 × 10 3 8.07 × 10 3
C 10 2.20 × 10 4 1.89 × 10 4 94,082163,405
C 11 4.93 × 10 3 4.26 × 10 3 0.02970.608
C 12 −579−651.52.6127.056
C 13 −367−838.60.3590.231
C 14 −0.324−0.296−1.521−3.803
C 15 1,562,1081,391,251 3.5 × 10 5 1.08 × 10 4
Figure 6. Comparison of numerical simulation and Taguchi correlation predicted values for ZK7 and PC waveguide material: (a) power density and (b) maximum waveguide temperature.
Energies 14 02146 g006
Figure 7c shows the cost of heat delivered (Equation (14)) as functions of ZK7 glass waveguide length and incident irradiation for application temperature requirement ( T F ) of 100 ° C . For a given waveguide thickness and receiver radius, the cost per unit area asymptotically decreases with an increase in the waveguide length (Equation (13)). For smaller waveguide lengths, the COH is high due to the high cost per unit aperture area of the waveguide-receiver system. The trade-off between the asymptotic decrease in cost power unit area and the decrease in power density with an increase in waveguide length results in a critical L w g (Figure 7c), where COH is minimized. The COH decreases with an increase in incident irradiation as higher net thermal power is delivered to the receiver. Similar trends are observed in Figure 7f, which shows the COH for PC. The low cost of PC polymer combined with their high net thermal power density (Figure 7d) as a result of their low absorption coefficient leads to a lower COH than ZK7 glass. The COH decreases with an increase in T F (compare Figure 7c,i) due to a decrease in net thermal power density delivered. For conciseness, the trends that were observed for PC material at T F = 250   ° C are not shown here, but the optimal design for the complete HTF temperature spectrum is discussed in Section 3.3.
Figure 7. Variation of power density ( P o ), maximum waveguide temperature ( T m a x ) and cost of heat (COH) with waveguide length ( L w g ) at different I 0 for (ac) ZK7 at T F =100 °C, (df) PC at T F =100 °C, (gi) ZK7 at T F = 250 °C. The receiver radius is 0.01 m and waveguide thickness is 0.02 m.
Energies 14 02146 g007
Figure 8 represents the design windows for ZK7 and PC with maximum permissible temperature ( T m a x ) as a constraint. Figure 8a represents the design window for ZK7 waveguide material considering I 0 = 1000 W/m2, R r = 0.01 m, and t w g = 0.025 m. For ZK7 glass, the tensile strength constrains the maximum recommended operating temperature to about 86 ° C [22], which is shown by the red line depicted in Figure 8a. The solid lines represent the iso-contour lines for various power density values. The unshaded area is the feasible design and operation window, such that the operating temperature of the waveguide is below the critical threshold of about 86 ° C for any combination of T F and L w g . For T F value of 250 ° C , the maximum permissible waveguide length is around 0.68 m and, for larger values of L w g , T m a x exceeds the maximum permissible operating temperature ( T c ). Similarly, the design and operation envelope is plotted for PC waveguide material in Figure 8b. The maximum permissible operating temperature ( T c ) for PC waveguide materials is 120 ° C (Table 1). For the selected range of parameters, the maximum permissible HTF temperature is around 235 ° C , and its value decreases with an increase in L w g . The waveguide lengths for achieving a specific power density can be determined while using the power density iso-contour lines for various application temperature ( T F ) requirements. For a given design configuration and HTF temperature requirement, the power density with PC waveguide is higher when compared to ZK7 because of its lower absorption coefficient that transfers higher incident solar radiation to the receiver.

3.3. Optimal Design of Waveguide Concentrator

The empirical correlations obtained from the Taguchi L 16 orthogonal array analysis were further used to determine the optimum design of the waveguide and receiver configuration for different application considerations. The objective is to establish the optimal parameters of the waveguide-receiver design for different operating conditions. In the present study, two different optimization objectives are considered: (1) maximizing power density ( P o ) and (2) minimizing the cost of heat (COH) that is delivered for different combinations of application temperature requirements and incident irradiation. The optimization is subject to constraints on the maximum permissible temperature in the waveguide for fail-safe operation. Optimal values are sought for the receiver radius ( R r ) , waveguide thickness ( t w g ) , and waveguide length ( L w g ) . The optimization problems can be mathematically expressed as:
max R r , t w g , L w g P o   and   min R r , t w g , L w g COH   ( subject   to :   T m a x T c 0 )
where T m a x is the maximum temperature in the waveguide that is obtained from the numerical model and T c is the maximum permissible waveguide temperature that is constrained by either the tensile strength constraint or the maximum operating temperature constraint. The maximum continuous operating temperature limit constrains the maximum permissible temperature for PC to T c = 86.3   ° C , whereas the tensile strength constrains the maximum permissible temperature for ZK7 to T c = 120   ° C [21,43]. The optimization problem that is presented in Equation (17) was solved using MATLAB by means of sequential quadratic programming [44], a nonlinear programming technique. The functional relationships in Equation (16) and the related coefficients in Table 3 were used to develop an objective function. The convergence of the optimization was determined using the Karush–Kuhn–Tucker criterion [44,45,46].
Figure 9 shows the optimal design configuration and corresponding performance metrics obtained from the numerical optimization for the objective of maximizing power density. The optimization runs were performed using 10 different arbitrarily selected initial parameter values to avoid solutions in local optima. For both of the objective functions, the optimal receiver radius and waveguide thickness values were obtained at the lower bound of 0.005 m and 0.01 m, respectively. Thinner waveguide incurs lower thermal energy loss due to absorption, while a smaller receiver radius results in lower thermal losses due to reduced surface area and, hence, the highest power density was obtained for lower values of R r and t w g . For both of the investigated waveguide materials, the highest power density (Figure 9a,d) was obtained for applications requiring low HTF temperature, due to a decrease in heat loss from the receiver. The maximum power density increases with an increase in incident irradiation, as noted in the previous section. For ZK7 and PC waveguides, the maximum power density was obtained for the lower bound of waveguide length value ( L w g = 0.25   m ) used in the numerical optimizer (Figure 9c,f), as a smaller waveguide reduces the absorption losses of the concentrated irradiation within the waveguide. Because the optimal design values for both ZK7 and PC waveguides were constant for varying T F and I 0 , the installed cost of the system, C (Equation (13)) was also constant at 96.1 $ / m 2 and 79.6 $ / m 2 for ZK7 and PC, respectively. Hence, the cost of heat trends shown in Figure 9b,e are only influenced by the power density variations in Figure 9a,d. The inverse dependence of COH on P o (Equation (14)) is clearly observed in Figure 9, in that the COH decreases with an increase in incident irradiation and the lowest COH value was obtained for applications requiring low HTF temperature. The highest power density was obtained for the PC waveguide as compared to ZK7 due to its low absorption coefficient.
Figure 10 shows the numerical optimization results for the objective of minimizing the cost of heat (COH) which represents a combined consideration of maximizing power density and minimizing cost. The optimal receiver radius and waveguide thickness values for least COH were obtained at the lower bound of 0.005 m and 0.01 m, respectively, since power density increases with decrease in R r or t w g and the installed cost also decreases. In addition, lower R r and t w g result in a lower temperature excursion in the waveguide (Figure 4), which ensures the maximum temperature in the waveguide does not exceed the critical threshold for most of the design and operating parametric combinations. The optimal waveguide length values for ZK7 and PC glass that are shown in Figure 10c,f are observed to decrease with increase in incident irradiation. The optimal waveguide length obtained for minimum COH is based on the trade-off between a decrease in installed cost ( C ) with an increase in L w g , which is sought to be minimized (Equation (13)), and a decrease in power density with an increase in L w g , which is sought to be maximized.
Because the power density decreases with decrease in I 0 (Figure 10b,e), the optimizer predicts higher waveguide length values to lower the installed cost and compensate for the decrease in power density. The corresponding cost of heat shown in Figure 10a,d decreases with an increase in I 0 due to higher power output in spite of the increase in installed cost due to the lower optimal L w g values predicted for higher I 0 (Figure 10c,f). For incident irradiation between 650–1250 W / m 2 , it is observed from Figure 10c,f that the optimal waveguide length value reduces with an increasing T F , owing to the increase in maximum waveguide temperature with increase in T F that can extend beyond the maximum permissible temperature at higher T F (compare Figure 7b,h for ZK7). Hence, the numerical optimizer predicts a smaller optimal waveguide length for higher T F to ensure the critical temperature constraint is satisfied, while the COH is minimized. Correspondingly, the COH for ZK7 and PC waveguide shown in Figure 10a,d is observed to increase with an increase in T F . The optimal waveguide length ranged between 0.5–1.0 m for ZK7 glass and 0.62–1.0 m for polycarbonate, depending on the incident irradiation and application temperature requirement (Figure 10c,f). PC and ZK7 are both applicable for the entire temperature range studied here, and PC is superior in performance to ZK7 both in terms of cost and power density.
Figure 10. Numerical optimization results obtained for the minimum cost of heat objective function: Optimal waveguide length and the corresponding performance metrics obtained from numerical optimization for (ac) ZK7 and (df) PC waveguide for various incident irradiation and application temperature requirement represented by T F .
Energies 14 02146 g010
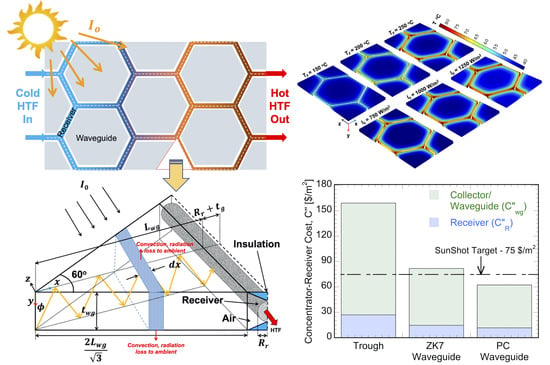
Figure 11 compares the total cost per unit aperture area that was optimized for the least cost of heat (Figure 10) for the application temperature requirement of T F = 250   ° C against the state-of-the-art parabolic trough cost that was obtained from Ref. [38]. Accordingly, the waveguide length, L w g used for the cost comparison are 0.49 m and 0.62 m for ZK7 and PC material, respectively. The waveguide thickness is 0.01 m for both the materials that represents a concentration ratio of 25 for ZK7 and 31 for PC waveguide. The breakdown of the receiver ( C R ) and waveguide ( C w ) cost per unit aperture area (Equation (13)) are also shown. It is observed that the major cost benefits of the waveguide-receiver system result from the reduction in cost that is associated with the solar collector component, which is very high for troughs due to massive and heavy form aspects of solar tracking mirrors and the associated structures to support them. Among the two waveguide materials investigated, the PC waveguide has a high potential to surpass the US DOE SunShot target of 75 $ / m 2 [1], due to the combination of the low cost of polymeric waveguide material and low absorption coefficient that leads to high thermal power density transport. Although the cost comparison is based on some ideal assumptions of the waveguide performance, as stated in Section 2.1, the concept shows potential to be cost-competitive than conventional parabolic troughs, especially for low to medium temperature applications.
The results of this study establish the best realizable performance to guide practical system development. Future studies will focus on the experimental investigation of the proposed waveguide-receiver thermal and optical performance to validate the model predictions, and system level techno-economic analysis while considering both capital and operational expenses to optimize the overall design for different application requirements. Future work should also consider the long-term durability and stability of the waveguides.

4. Conclusions

A combined thermal and optical transport model for solar concentration inside a hexagon-shaped waveguide was developed to analyze its feasibility for concentrated solar thermal applications. The optical model is derived from an analytical framework that is based on a perfect total internal reflection of incident irradiation within the waveguide with no optical losses (escape cone loss, decoupling loss) while accounting for ray attenuation due to absorption in the waveguide. Systematic parametric studies for two different waveguide materials (polycarbonate and ZK7 glass) were conducted to examine the effects of operating and design parameters on the efficiency of the hexagonal waveguide concentrator integrated to a linear receiver. The power density delivered to the receiver was used as the metric to evaluate the performance and variation in maximum temperature of the waveguide during steady-state operation is also analyzed. The results show that the power density delivered to the receiver decreases with an increase in waveguide length and thickness primarily due to increased ray absorption in the waveguide. On the other hand, the power density is increased with a reduction in the receiver radius due to reduced thermal losses that result from a decrease in the surface area.
An economic optimization analysis was also conducted to derive the optimal design configuration that minimizes the cost of heat delivered from the hexagon waveguide solar thermal concentrator for different application temperature requirements and incident irradiation. Optimal values were obtained at the minimum receiver radius and waveguide thickness considered, due to the dual effect of the increase in power density and a decrease in cost. When optimized for the least cost of heat delivery, the optimal hexagonal waveguide length was based on the trade-off between decrease in the installed cost and power density with increase in waveguide length. The optimal waveguide length ranged between 0.5–1.0 m for ZK7 glass and 0.62–1.0 m for polycarbonate for incident irradiation in the range of 500–1250 W/m2 and application requiring HTF in the temperature range of 100–250 ° C . The collection efficiency corresponding to the optimal configuration ranged between 56–67% for ZK7 glass and 64–74% for polycarbonate waveguide. The study serves as a design guideline for waveguide-based solar thermal concentrator for applications that require heat in the temperature range of 100–250 ° C , which constitutes more than half of the industrial process heat demand.

Author Contributions

Conceptualization, Data curation, Formal analysis, Investigation, Methodology, Software, Validation, Visualization, Writing (K.K., K.N., R.P.); Funding acquisition, Project administration, Resources, Supervision (R.P.). All authors have read and agreed to the published version of the manuscript.

Funding

The authors acknowledge funding from the U.S. Department of Energy through Award Number DE-EE0008537.

Institutional Review Board Statement

Not applicable.

Informed Consent Statement

Not applicable.

Data Availability Statement

Not applicable.

Conflicts of Interest

The authors declare no conflict of interest.

Nomenclature

A c area [m2]
c specific heat [ J / kgK ]
C cost [ $ ]
COH cost of heat [ $ / W ]
h convection heat transfer coefficient [ W / m 2 K ]
I irradiance [ W / m 2 ]
k thermal conductivity [ W / mK ]
L length [m]
P t net thermal power delivered to receiver [ W ]
R r receiver radius [ m ]
thermal resistance [ K / W ]
t thickness [ mm ]
T temperature [ ° C ]
T c maximum permissible temperature [ ° C ]
U overall heat transfer coefficient [ W / m 2 K ]
xposition along the waveguide [ m ]
Subscripts and Superscripts
*non-dimensional quantity
0incident
ambient
Ccollection
ofree natural convection
fforced convection
maxmaximum
HTF heat transfer fluid
rreceiver
ttotal or top
wgwaveguide
Greek Symbols
α absorption coefficient
γ thermal expansion coefficient [K−1]
β absorptivity of receiver glass envelope
η efficiency
ρ density [kg/m3]
λ path length of light [m]
ϕ angle of incidence [rad]
τ transmissivity of receiver glass envelope
Acronyms
HCEheat collection element
CSTconcentrated solar thermal
HTFheat transfer fluid
TIRtotal internal reflection

References

  1. Mehos, M.; Turchi, C.; Jorgenson, J.; Denholm, P.; Ho, C.; Armijo, K. On the Path to SunShot: Advancing Concentrating Solar Power Technology, Performance, and Dispatchability; NREL/TP-5500-65688, SAND2016-2237 R; National Renewable Energy Laboratory: Golden, CO, USA, 2016; pp. 1–66. [Google Scholar]
  2. Pitchumani, R. Challenges and Opportunities for Cost-Competitive Concentrating Solar Power. In Proceedings of the Light, Energy and the Environment 2015, Suzhou, China, 2 November 2015. [Google Scholar]
  3. Bushra, N.; Hartmann, T. A review of state-of-the-art reflective two-stage solar concentrators: Technology categorization and research trends. Renew. Sustain. Energy Rev. 2019, 114, 109307. [Google Scholar] [CrossRef]
  4. Price, J.S.; Sheng, X.; Meulblok, B.M.; Rogers, J.A.; Giebink, N.C. Wide-angle planar microtracking for quasi-static microcell concentrating photovoltaics. Nat. Commun. 2015, 6, 6223. [Google Scholar] [CrossRef]
  5. Tian, Y.; Zhao, C.Y. A review of solar collectors and thermal energy storage in solar thermal applications. Appl. Energy 2013, 104, 538–553. [Google Scholar] [CrossRef] [Green Version]
  6. Buljan, M.; Mendes-Lopes, J.; Benítez, P.; Miñano, J.C. Recent trends in concentrated photovoltaics concentrators’ architecture. J. Photonics Energy 2014, 4, 040995. [Google Scholar] [CrossRef] [Green Version]
  7. Madala, S.; Boehm, R.F. A review of nonimaging solar concentrators for stationary and passive tracking applications. Renew. Sustain. Energy Rev. 2017, 71, 309–322. [Google Scholar] [CrossRef]
  8. Karp, J.H.; Tremblay, E.J.; Ford, J.E. Planar micro-optic solar concentrator. Opt. Express 2010, 18, 1122. [Google Scholar] [CrossRef]
  9. Karp, J.H.; Tremblay, E.J.; Hallas, J.M.; Ford, J.E. Orthogonal and secondary concentration in planar micro-optic solar collectors. Opt. Express 2011, 19, A673. [Google Scholar] [CrossRef]
  10. Liu, Y.; Huang, R.; Madsen, C.K. Design of a lens-to-channel waveguide system as a solar concentrator structure. Opt. Express 2014, 22, A198–A204. [Google Scholar] [CrossRef]
  11. Xie, P.; Lin, H.; Liu, Y.; Li, B. Total internal reflection-based planar waveguide solar concentrator with symmetric air prisms as couplers. Opt. Express 2014, 22, A1389. [Google Scholar] [CrossRef] [PubMed]
  12. Teng, T.-C.; Lai, W.-C. Planar solar concentrator featuring alignment-free total-internal-reflection collectors and an innovative compound tracker. Opt. Express 2014, 22, A1818. [Google Scholar] [CrossRef] [PubMed]
  13. Debije, M.G.; Verbunt, P.P.C. Thirty years of luminescent solar concentrator research: Solar energy for the built environment. Adv. Energy Mater. 2012, 2, 12–35. [Google Scholar] [CrossRef]
  14. Li, Y.; Sun, Y.; Zhang, Y. Luminescent solar concentrators performing under different light conditions. Solar Energy 2019, 188, 1248–1255. [Google Scholar] [CrossRef]
  15. Griffini, G.; Levi, M.; Turri, S. Novel high-durability luminescent solar concentrators based on fluoropolymer coatings. Prog. Org. Coat. 2014, 77, 528–536. [Google Scholar] [CrossRef]
  16. Zhao, Y.; Meek, G.A.; Levine, B.G.; Lunt, R.R. Near-Infrared Harvesting Transparent Luminescent Solar Concentrators. Adv. Opt. Mater. 2014, 2, 606–611. [Google Scholar] [CrossRef]
  17. Zhao, Y.; Lunt, R.R. Transparent Luminescent Solar Concentrators for Large-Area Solar Windows Enabled by Massive Stokes-Shift Nanocluster Phosphors. Adv. Energy Mater. 2013, 3, 1143–1148. [Google Scholar] [CrossRef]
  18. Zhao, Y.; Lunt, R.R. Solar Windows: Transparent Luminescent Solar Concentrators for Large-Area Solar Windows Enabled by Massive Stokes-Shift Nanocluster Phosphors. Adv. Energy Mater. 2013, 3, 1248. [Google Scholar] [CrossRef]
  19. Shanks, K.; Senthilarasu, S.; Mallick, T.K. Optics for concentrating photovoltaics: Trends, limits and opportunities for materials and design. Renew. Sustain. Energy Rev. 2016, 60, 394–407. [Google Scholar] [CrossRef] [Green Version]
  20. Hornung, T.; Steiner, M.; Nitz, P. Estimation of the influence of Fresnel lens temperature on energy generation of a concentrator photovoltaic system. Sol. Energy Mater. Sol. Cells 2012, 99, 333–338. [Google Scholar] [CrossRef]
  21. Nithyanandam, K.; Deshpande, J.; Pitchumani, R. Coupled thermal and optical analysis of a planar waveguide concentrator-receiver. Appl. Energy 2017, 208, 1576–1589. [Google Scholar] [CrossRef]
  22. Nithyanandam, K.; Narayan, A.; Pitchumani, R. Analysis and design of a radial waveguide concentrator for concentrated solar thermal applications. Energy 2018, 151, 940–953. [Google Scholar] [CrossRef]
  23. Kalogirou, S.A. Solar thermal collectors and applications. Prog. Energy Combust. Sci. 2004, 30, 231–295. [Google Scholar] [CrossRef]
  24. Zarza, A.F.G.E.; Valenzuela, L.; Pérez, M. Parabolic-trough solar collectors and their applications. Renew. Sustain. Energy Rev. 2010, 14, 1695–1721. [Google Scholar] [CrossRef]
  25. Mahian, O.; Kianifar, A.; Kalogirou, S.A.; Pop, I.; Wongwises, S. Small particles, big impacts: A review of the diverse applications of nanofluids. Int. J. Heat Mass Transf. 2013, 57, 582. [Google Scholar] [CrossRef]
  26. Kalogirou, S.A.; Karellas, S.; Braimakis, K.; Stanciu, C.; Badescu, V. Exergy analysis of solar thermal collectors and processes. Prog. Energy Combust. Sci. 2016, 56, 106–137. [Google Scholar] [CrossRef]
  27. Phadke, M.S. Quality Engineering Using Robust Design, 1st ed.; Phadke, M.S., Ed.; PTR Prentice Hall: Hoboken, NJ, USA, 1995; ISBN 0137451679. [Google Scholar]
  28. Hallas, J.M.; Karp, J.H.; Tremblay, E.J.; Ford, J.E. Lateral translation micro-tracking of planar micro-optic solar concentrator. In Proceedings of the High and Low Concentrator Systems for Solar Electric Applications V, San Diego, CA, USA, 3–4 August 2010; p. 776904. [Google Scholar]
  29. Hallas, J.M.; Baker, K.A.; Karp, J.H.; Tremblay, E.J.; Ford, J.E. Two-axis solar tracking accomplished through small lateral translations. Appl. Opt. 2012, 51, 6117–6124. [Google Scholar] [CrossRef] [Green Version]
  30. Bergman, T.L.; Lavine, A.S.; Incropera, F.P.; Lavine, A.S. Fundamentals of Heat and Mass Transfer, 8th ed.; John Wiley & Sons: Hoboken, NJ, USA, 2011; ISBN 9780471457282. [Google Scholar]
  31. Kant, K.; Shukla, A.; Sharma, A.; Biwole, P.H. Heat transfer studies of photovoltaic panel coupled with phase change material. Sol. Energy 2016, 140, 151–161. [Google Scholar] [CrossRef]
  32. Kant, K.; Pitchumani, R.; Shukla, A.; Sharma, A. Analysis and design of air ventilated building integrated photovoltaic (BIPV) system incorporating phase change materials. Energy Convers. Manag. 2019, 196, 149–164. [Google Scholar] [CrossRef]
  33. Feingold, A.; Gupta, K.G. New Analytical Approach to the Evaluation of Configuration Factors in Radiation From Spheres and Infinitely Long Cylinders. J. Heat Transf. 1970, 92, 69–76. [Google Scholar] [CrossRef]
  34. COMSOL Comsol. Available online: http://www.comsol.com (accessed on 13 June 2020).
  35. Metalsdepot Material Properties. Available online: https://absupply.net/pdf/MetalDepot_Catalog.pdf (accessed on 1 February 2021).
  36. Kelly, B.; Kearney, D. Thermal Storage Commercial Plant Design Study for a 2-Tank Indirect Molten Salt System: Final Report, 13 May 2002– 31 December 2004; National Renewable Energy Laboratory: Golden, CO, USA, 2006. [Google Scholar]
  37. Call, P.J. National Program Plan for Absorber Surfaces R&D (No. SERI/TR-31- 103); National Renewable Energy Lab. (NREL): Golden, CO, USA, 1979. [Google Scholar]
  38. Parthiv, K.; Craig, S. Parabolic trough Collector Cost Update for the System Advisor Model (SAM)[R]; Technical Report, NREL/TP-6A20-65228; National Renewable Energy Laboratory: Golden, CO, USA, 2015. [Google Scholar]
  39. Turchi, C.; Kurup, P.; Akar, S.; Flores, F.; Turchi, C.; Kurup, P.; Akar, S. Domestic Material Content in Molten-Salt Concentrating Solar Power Plants Domestic Material Content in Molten-Salt Concentrating Solar Power Plants; National Renewable Energy Laboratory: Golden, CO, USA, 2015. [Google Scholar]
  40. Ashby, M.F.; Johnson, K. Materials and Design: The Art and Science of Material Selection in Product Design, 3rd ed.; Butterworth-Heinemann: Oxford, UK, 2014; ISBN 9780080982052. [Google Scholar]
  41. Expert TracePro. 6.0. 4 Release; Lambda research Corporation: Littleton, MA, USA, 2009.
  42. Benoit, H.; Spreafico, L.; Gauthier, D.; Flamant, G. Review of heat transfer fluids in tube-receivers used in concentrating solar thermal systems: Properties and heat transfer coefficients. Renew. Sustain. Energy Rev. 2016, 55, 298–315. [Google Scholar] [CrossRef]
  43. Paßlick, C.; Hellwig, A.; Geyer, U.; Heßling, T.; Hübner, M.C. Stability of glass versus plastics for transmissive high-power LED optics. In Current Developments in Lens Design and Optical Engineering XV; Johnson, R.B., Mahajan, V.N., Thibault, S., Eds.; International Society for Optics and Photonics: San Diego, CA, USA, 2014; Volume 9192, p. 919210. [Google Scholar]
  44. Gill, P.E.; Murray, W.; Wright, M.H. Practical Optimization; SIAM: Philadelphia, PA, USA, 2019; ISBN 161197559X. [Google Scholar]
  45. Powell, M.J.D. A fast algorithm for nonlinearly constrained optimization calculations. In Numerical Analysis; Springer: Berlin, Germany, 1978. [Google Scholar]
  46. Han, S.P. A globally convergent method for nonlinear programming. J. Optim. Theory Appl. 1977. [Google Scholar] [CrossRef] [Green Version]
Figure 1. Schematic representation of: (a) top view of the hexagonal waveguide solar concentrator integrated with the receiver and (b) control volume depicting ray propagation and heat fluxes.
Energies 14 02146 g001
Figure 2. Contours of waveguide temperature for different: (a) heat transfer fluid (HTF) temperatures and (b) incident solar irradiation.
Energies 14 02146 g002
Figure 4. Influence of (a) Incident solar radiation ( I 0 ), (b) receiver radius ( R r ), (c) waveguide length ( L w g ), and (d) waveguide thickness ( t w g ) on net thermal power delivered ( P t ) and maximum operating temperature ( T m a x ).
Energies 14 02146 g004
Figure 5. Influence of: (a) Incident solar radiation ( I 0 ), (b) receiver radius ( R r ), (c) waveguide length ( L w g ), and (d) waveguide thickness ( t w g ) on the collection efficiency.
Energies 14 02146 g005
Figure 8. Design envelopes for permissible waveguide length based on the maximum operating temperature and minimum power density considerations for: (a) ZK7 and (b) PC waveguide. The receiver radius is 0.01 m, waveguide thickness is 0.025 m, and incident irradiation is 1000 W / m 2 .
Energies 14 02146 g008
Figure 9. Numerical optimization results obtained for the maximum power density objective function: Optimal waveguide length and the corresponding performance metrics obtained from numerical optimization for (ac) ZK7 and (df) PC waveguide for various incident irradiation and application temperature requirement represented by T F .
Energies 14 02146 g009
Figure 11. Comparison of solar concentrator-receiver cost per unit aperture area for hexagonal waveguide made of ZK7 glass and polycarbonate polymer against state-of-the-art parabolic troughs.
Energies 14 02146 g011
Table 1. Thermophysical property of waveguide materials [21,43].
PropertiesZK7PC
Thermal conductivity, k [W/m-K]1.100.20
Heat capacity, c p [J/kg-K]7701170
Density, ρ [kg/m3]24901190
Thermal expansion coefficient, γ [10–6/K]4.170
Permanent operating temperature, T [°C]450120
Absorption coefficient, α [m−1]1.41
Table 2. L 16 Standard orthogonal array.
Experiment L w g [ m ] t w g [ m ] R r [ m ] I 0 [ W / m 2 ] T F   [ ° C ]
L 1 0.250.0100.0050500100
L 2 0.250.0150.0075750150
L 3 0.250.0200.01001000200
L 4 0.250.0250.01251250250
L 5 0.500.0100.00751000250
L 6 0.500.0150.00501250200
L 7 0.500.0200.0125500150
L 8 0.500.0250.0100750100
L 9 0.750.0100.01001250150
L 10 0.750.0150.01251000100
L 11 0.750.0200.0050750250
L 12 0.750.0250.0075500200
L 13 1.000.0100.0125750200
L 14 1.000.0150.0100500250
L 15 1.000.0200.00751250100
L 16 1.000.0250.00501000150
Publisher’s Note: MDPI stays neutral with regard to jurisdictional claims in published maps and institutional affiliations.

