1. Introduction
The number of applications for offshore floating platforms has expanded far beyond oil and gas floating production systems, or floating wind turbines [
1]. Floating platforms are now being considered for multi-purposed uses which could include offshore greenhouses or food production [
2], solar farms [
3,
4], residential real estate [
5], floating airports [
6], or entertainment facilities [
7]. They can also be considered for holding compressors necessary for underwater compressed air energy storage. For some, these multi-purposed floating platforms are necessary to enable island living, while in other cases they have been relied upon to improve reliability and resiliency of energy generation, and to provide energy storage and clean water [
8].
Offshore energy applications are experiencing increasing interest owing to growing energy demand, climate change, and the desire for clean energy sources. The 2019 International Energy Outlook report predicted that worldwide energy consumption will increase by nearly 50 percent between 2018 and 2050 [
9]. The IEA proposed that renewable energy will be the fastest growing source of electricity generation enhanced by technological improvements and government incentives [
9,
10]. Although many uncertainties remain regarding the effects of the COVID-19 pandemic on the future of energy innovations, it was still predicted that the only energy source expected to grow this year is renewables, as they are to take the “center stage” in the future of energy [
10]. Momentum is building, particularly with new pressures reshaped by pandemic stimulus spending [
10]. Increasingly, countries understand that new infrastructure spending should support clean tech projects that bolster national economies and benefit the environment.
Due to the embryonic state of these newly developed multi-purposed floating platforms, few studies have considered the dynamics of such systems. The US Federal National Offshore Wind Strategy states that a gap remains in the understanding and development of design practices for extreme weather conditions at offshore sites in the US [
11]. As climate change continues and weather becomes less predictable, extreme weather conditions will become more frequent and more powerful [
12]. More research must focus on the necessary design standards for offshore floating structures under extreme weather conditions [
11].
Vulnerabilities of offshore renewable energy infrastructure have already been exposed. One example of an offshore wind turbine failure due to a lack of improved design standards is the Sway turbine [
13]. The 1:6 scaled model wind turbine manufactured by Sway sunk on the Norwegian coast in 2011. The test was modelled to withstand wave heights up to 4 m, but failed after waves 6.3 m high filled the tower with water [
13]. At full scale, the turbine would have faced waves 40 m high. A hundred-year wave does not exceed 30 m, so the Sway turbine experienced very unlikely conditions [
14]. Further testing and understanding of these unlikely, extreme events are necessary to avoid these failures in the future.
Mathematical models have been developed to examine the dynamic motions of offshore structures in the past [
15,
16,
17]. Additionally, simulations and experimental tests have been completed on offshore structures [
18,
19,
20] however the majority take place in a wave tank or basin and are therefore only able to investigate wave loads. More recently, it has been recognized that it is necessary to consider both wave and wind loads, so recent testing has focused on both parameters. This has been accomplished by performing tests in a wave basin and adding a configuration of fans to generate a straight-line wind load on the experimental area. While not entirely realistic, the method provides initial insight to the effects of simple winds on offshore structures. The Maritime Research Institute Netherlands (MARIN) Offshore Basin created a 1:50 scaled straight-line only wind generation set-up for model tests concerning wind and wave loading simultaneously [
18]. The DeepCwind concept was developed and tested in many stages, and modifications of it were also examined [
19,
20,
21,
22]. These experiments involved testing non-optimized floating structure designs to compare the reactions of different generic floating Configurations to wind and wave loads. Here, the spar buoy provided insight to the effect of lowered center of mass far from the center of buoyancy, while the Tension Leg Platform (TLP) based model showed reactions of a taut mooring stabilized system and the semi-submersible structure represented a system with low center of mass and large water plane area. The study found that the order of systems with maximum surge was the semi-submersible, closely followed by TLP, while the spar experienced the smallest surge. As for pitch rotation the spar saw significantly higher rotations, followed by the semi-submersible, while the TLP experienced very small rotations. The winds generated in these tests were added into the testing chamber using a make-shift array of 35 fans generating straight-line winds [
22].
Further, a numerical study was completed to test the Configuration of the floating structure with various numbers of columns [
20]. Experimental tests [
23] were conducted at the wind-wave-current tank at Newcastle University to test the effect of a stabilizer on the motions of an offshore wind turbine. Tests with simulated waves, current and straight-line winds only were completed [
23]. Other experiments focus on the effects the dynamics of the structure have on wind energy production. One study involved the testing of scaled wind turbine models first only in a controlled wave simulator tank, and then with an industrial fan placed in front of the model to produce straight on winds [
17]. The models were ballasted tension leg platform and spar buoy types. Findings showed that surge acceleration dominated over heave acceleration, and pitch rotations were minimal for each test [
17].
Various studies have looked at the natural frequencies and damping on floating offshore platform systems. These values are found by frequency analysis of free-decay tests. One study considered the natural frequency of a floating, deeply drafted spar buoy type system with loose (catenary) mooring lines, which had heave, surge, and pitch natural frequencies of 0.032 Hz, 0.008 Hz and 0.032 Hz, respectively [
24]. Comparing the natural frequencies of different platform and mooring types, the study by Robertson et al. found that the semi-submersible platform with loose mooring lines experienced a heave natural frequency of 0.058 Hz, surge natural frequency of 0.0093 Hz, and pitch natural frequency of 0.037 Hz [
22]. The spar platform with loose mooring experienced a heave, surge, and pitch natural frequency of 0.035 Hz, 0.023 Hz and 0.031 Hz, respectively [
22]. The tension leg platform (TLP) system with taut mooring lines experienced a heave natural frequency of 0.85 Hz, a surge natural frequency of 0.026 Hz, and pitch natural frequency of 0.27 Hz [
22]. Another study comparing three different offshore wind turbine structure types found that the TLP had heave, surge, and pitch natural frequencies of 0.4375 Hz, 0.0165 Hz, and 0.2211 Hz, respectively [
25]. A barge-type floating platform with loose mooring had heave, surge, and pitch natural frequencies of 0.1283 Hz, 0.0076 Hz, and 0.0849 Hz, respectively [
25]. Lastly, the study compared a spar buoy type platform with loose mooring, which had natural frequencies of 0.0324 Hz for heave, 0.0080 Hz for surge, and 0.0343 Hz for pitch [
25]. The damping ratios in this study for the floating platform motion ranged from −0.02 to 0.06 [
25].
Our review of the literature has not revealed any experimental studies similar to that described herein which considers the effects of extreme weather events on the motions of a multi-purpose light duty floating platform with multiple mooring line variations. Platforms were subjected to harsh wind conditions characteristic of those found in tornadoes, extreme thunderstorms, downbursts, and other strong windstorms. Introductory insights into these dynamics may serve as a starting point for additional studies and improved perspective on stability, safety, energy efficiency and suitable applications for these platforms.
Tornadoes and downbursts are local wind systems usually associated with severe thunderstorms [
26]. More formally, tornadoes are defined as strongly rotating columns of air that emerge from a thunderstorm and connect with the surface. The diameter of a tornado vortex is usually between several dozens to a few hundreds of meters and they typically last below 1 h. Tornados produce the highest near-surface winds in the Earth’s atmosphere with the velocities in the strongest tornadoes exceeding 90 m s
−1. Tornadoes that form above water surfaces are called waterspouts. While there might be a difference in the formation of some tornadoes above land and waterspouts [
27], the dynamics of formed tornado-like vortex is the same in both cases. Downbursts are negatively buoyant columns of cold air (around 1 km in dimeter) that emerge from a thunderstorm and create a radially advancing outflow upon hitting the surface. While the many aspects of tornado genesis are still unknown, the main contributors for downburst development are the evaporation and melting of hydrometeors in and underneath the cloud. Precipitation loading and the drag exerted by the falling precipitation on the air can additionally amplify the downdraft. Near-surface winds in the strongest downburst outflows can exceed 70 m s
−1 [
28]. In many regions around the world, including North America, these two wind systems are responsible for the major damages to the built environment [
29]. While the observational data of tornadoes and downbursts above large water surfaces are rare, Solari et al. [
30], Burlando et al. [
31,
32,
33] and Zhang et al. [
34] demonstrated the high occurrence of downbursts in the Mediterranean Sea. However, the interaction between these high-impact winds and offshore structures is mostly unknown.
4. Results
Here, we examine the motions affecting the stability of the platform by studying the surge, heave, and pitch. Given the square profile of the structure and even weight distribution, rotations about the x and y-axes are easily related, so only the pitch is compared in the data shown. Similarly, the accelerations in the x and y-directions were comparative to one another, so again, only the surge is shown in the results. The heave and surge accelerations, as well as pitch rotations, are depicted for each of the platform Configurations. Each acceleration and rotational data set is depicted separately and compared. Within each of the graphs, the movements of the platforms driven by the different wind conditions—ABL, TLV and DB—are graphed together. Figures containing all four Configurations together for each of the motion and wind types can be found within
Appendix A for further comparison. Additionally, in
Appendix A is a summary table,
Table A1, containing the maximum and minimum heave, surge, and pitch values for each wind type. The table also summarizes the time it took for the structure to return to equilibrium after the end of the downburst and after the TLV reached the end of its translation.
Figure 8 shows the vertical profile of the normalized peak downburst velocity, the mean atmospheric boundary layer velocity and peak horizontal tornado velocity at each Cobra probe height normalized with the platform height from the water surface for configuration one. The classical profile of the atmospheric boundary layer flow in which the velocity continuedly increases with the height is not observed in the case of downburst and tornado flows. Both the downburst and tornado flows produce a “nose” shape profile with the maximum velocity close to the surface. However, the tornado flow is characterized by the highest wind speeds at a lower location, near the platform height, while the downburst peak is observed at the height that is approximately twice the maximum velocity height in the tornadic flow.
Each of the DB and TLV tests were run multiple times, and the ABL test was conducted for an extended period to ensure the reactions of the platform were similar in each repeated test. The different DB runs can be seen within the graphs and are clearly similar in magnitude between each run. As for the TLV profile runs, only one of each test is shown below. The largest difference in the means of surge, heave, and for pitch for all tornado runs was 0.27 m s−2, 0.02 m s−2, and 0.75°, respectively. Comparing the results of each repeated test, it was observed that the shapes of the graphs were similar between runs. This suggested that the reactions to the wind profiles were similar between the repeated experiments.
For each of the configurations and motion types, the times in which the downburst began and ended are labelled on the graphs. When the floating system was subjected to the TLV winds, the location that the tornado was at in respect to the platform is shown for each configuration. As previously stated, the tornado translated across the wind chamber, by the bell mouth, a distance of 5 m. The platform was placed in the center of the wind chamber, at 2.5 m, and this has been labelled on the figures.
Within this study we are examining the differences in movement between identical floating platforms with different Configurations. Firstly, we examine a basic floating platform loosely moored, and then tightly moored. Following this, we examine the effect of adding ballast to the legs of the loosely moored platform to lower the center of mass of the structure, and then adding weight to the top to generate a top-heavy Configuration.
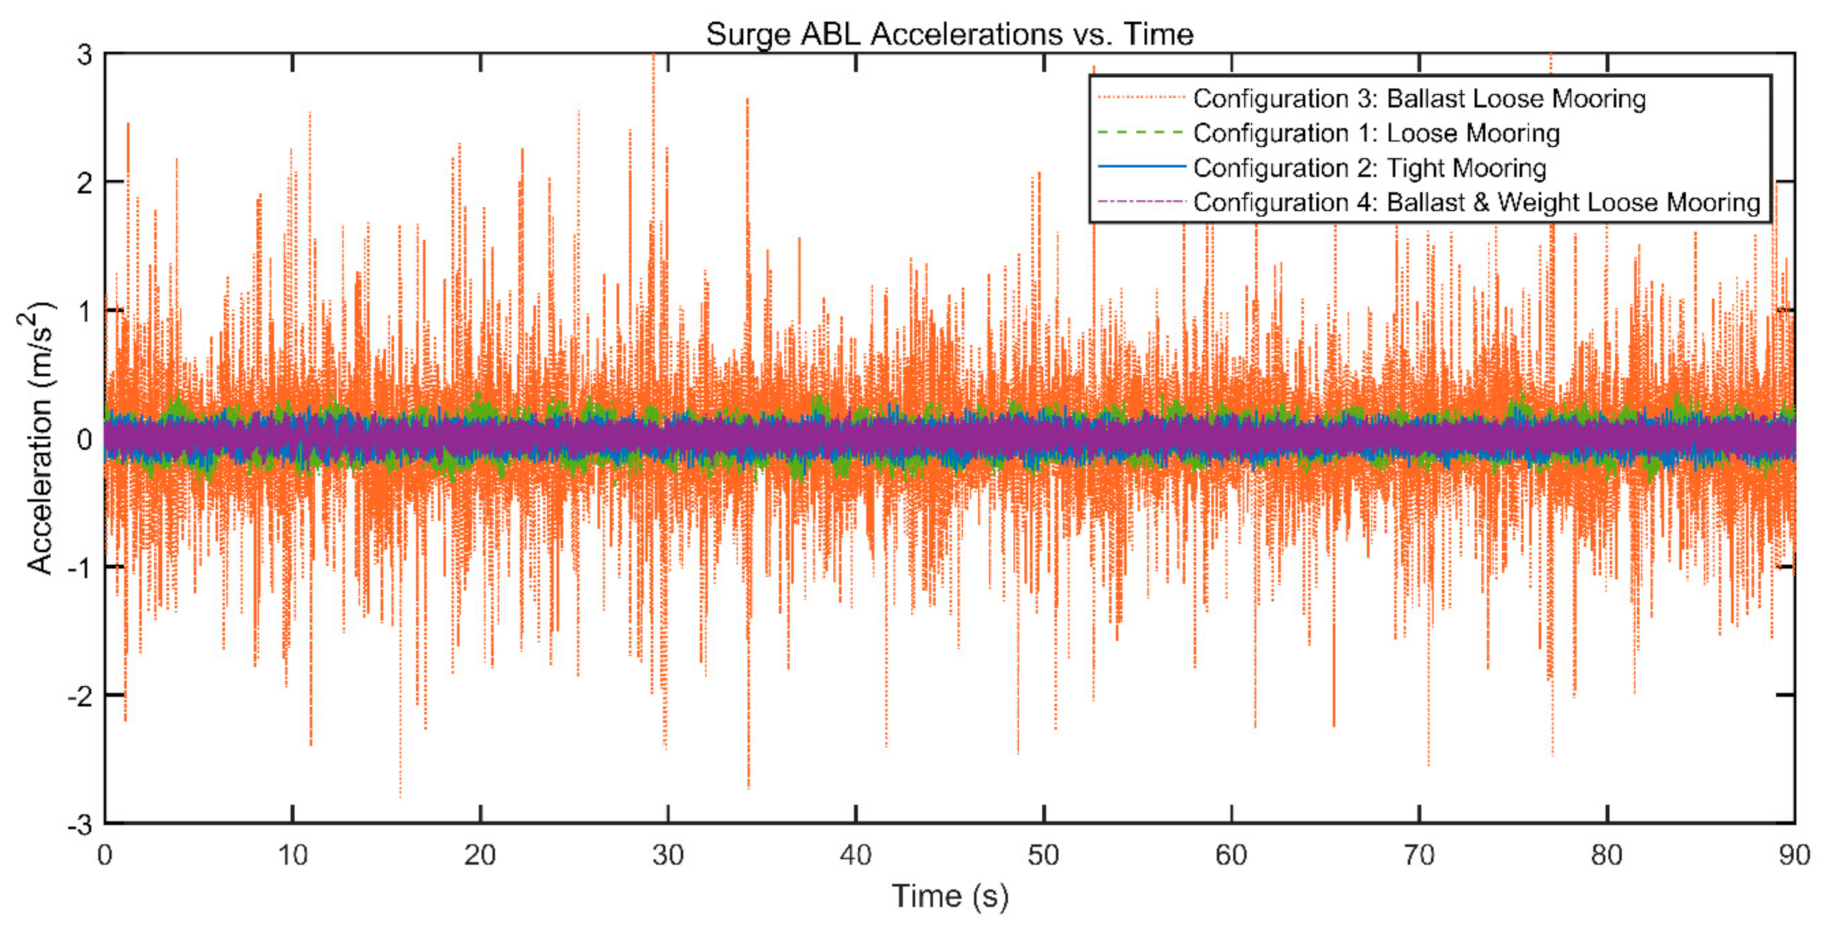
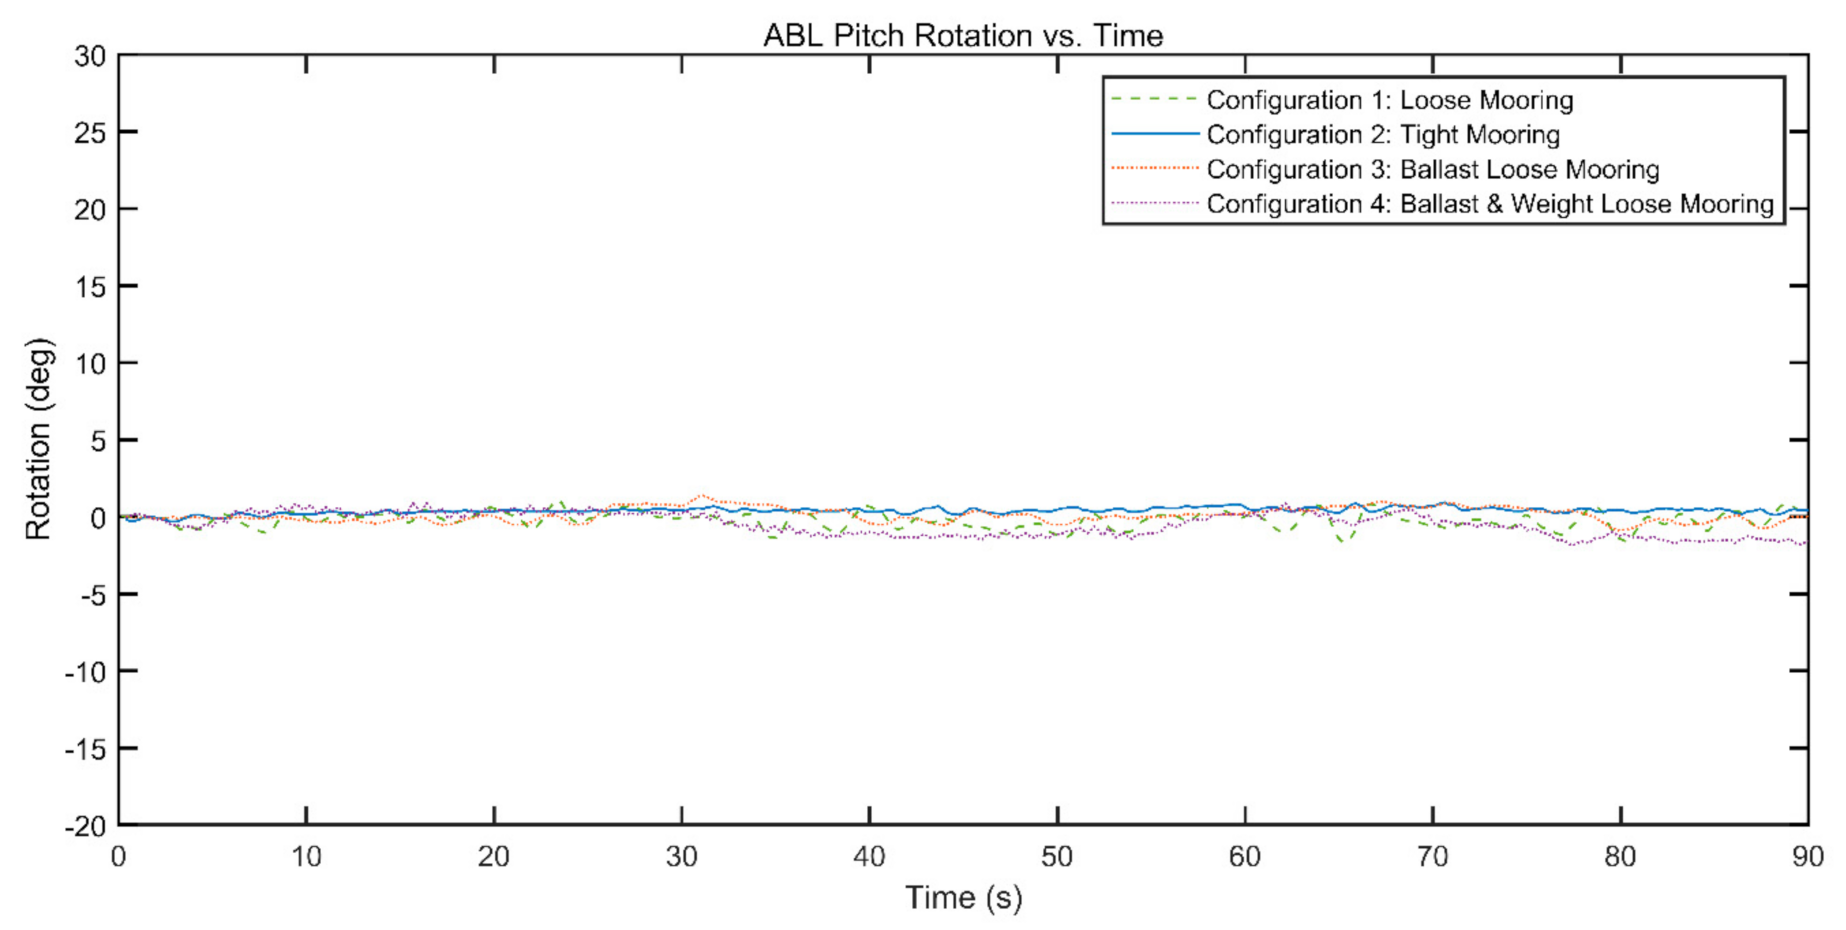
To improve understanding while discussing the findings in this paper, the magnitudes of the motions examined have been defined as follows: Within this paper the surge acceleration is considered small when the peak-to-peak amplitude is less than 11.5% of the maximum peak to peak amplitude (0.6 m s−2), medium when the peak-to-peak amplitude is between 11.5%–23.2% (0.6 m s−2–1.2 m s−2), and large when the peak-to-peak amplitude is above 23.2% (1.2 m s−2). The heave acceleration is considered small when the peak-to-peak amplitude is less than 10% (1 m s−2) of the maximum peak to peak amplitude, medium if the peak-to-peak amplitude is between 10.0%–20.1% (1 m s−2–2 m s−2), and large if the peak-to-peak amplitude is greater than 20.1% (2 m s−2). The motions of the platform were significantly smaller in all degrees of freedom (DOF) when the structure was subjected to the ABL flow, in comparison to the TLV or DB flows for Configurations 1 and 2.
While the floating structure was loosely moored with only the base platform (Configuration 1), the maximum values of platform movement based on wind profiles was ordered: TLV > DB >> ABL for all motion directions (
Figure 9a–c). When the tornado passed over the structure, it caused similar responses in both the heave (
Figure 9a) and surge (
Figure 9b). The suction (i.e., negative pressure) within the TLV lifted the platform from the water, and consequently, the platform experienced a large positive surge and heave acceleration. It was then proceeded by a negative acceleration as the tornado passed over and into the surrounding water. The movements of the platform influence one another and since the loosely moored platform is free to move in many directions, the surge and heave movements have similar profiles. The drop in surge acceleration was of similar magnitude to the initial large rise, when the tornado was over the platform (
Figure 10). While the drop in heave acceleration was larger than its initial peak, as the tornado was able to push the platform down into the water as it passed overtop, and past the platform (
Figure 10). Following the drop in acceleration, both the heave and surge accelerations experienced small and then medium oscillations before completely settling at a new equilibrium of −1 m s
−2, when the tornado ended (
Figure 10).
The surge and heave motion responses of the platform during the DB test on the loosely moored base platform system does not show similar patterns. However, the maximum and minimum acceleration values do occur at the same time. Just before the downburst hits the platform, there is a positive acceleration followed by a quick drop as the structure is forced down by the wind flow. The surge acceleration consists of large, high frequency vibrations of the platform back and forth between the starting position throughout the duration of the experiment. The heave acceleration experiences medium amplitude and high frequency oscillations around a temporary zero of approximately −3 m/s2 before quickly accelerating upwards as the downburst concludes and then settling at the initial state.
The TLV flow caused significantly larger magnitudes of acceleration, which ultimately generated a larger force on the mooring system and platform components. This subjection to large forces on improperly designed, weak, or damaged systems could result in a yielding failure due to the large stress subjected to the structure. The repeated fluctuations caused by the DB flow are more likely to result in fatigue failure due to the recurring stress subjected to the system throughout the wind flow.
Figure 9c shows the pitch rotations subjected to the loosely moored base platform system during each of the three wind types. When subjected to the DB flow, the system experienced a large pitch rotation of 19.8° when the flow hit and then remained at an angle, rotating slightly about this position for approximately four seconds before returning to equilibrium as the downburst was completed. The floating structure was able to be kept on an angle here because of its light weight, and the freedom of movement allowed by the loose mooring lines. During the tornado flow test, the structure experienced a large rotation of 13° in the negative direction, followed by a larger positive rotation of over 28°. For the loosely moored system, it appears that both TLV and DB flows could cause significant rotations to a possibly dangerous degree.
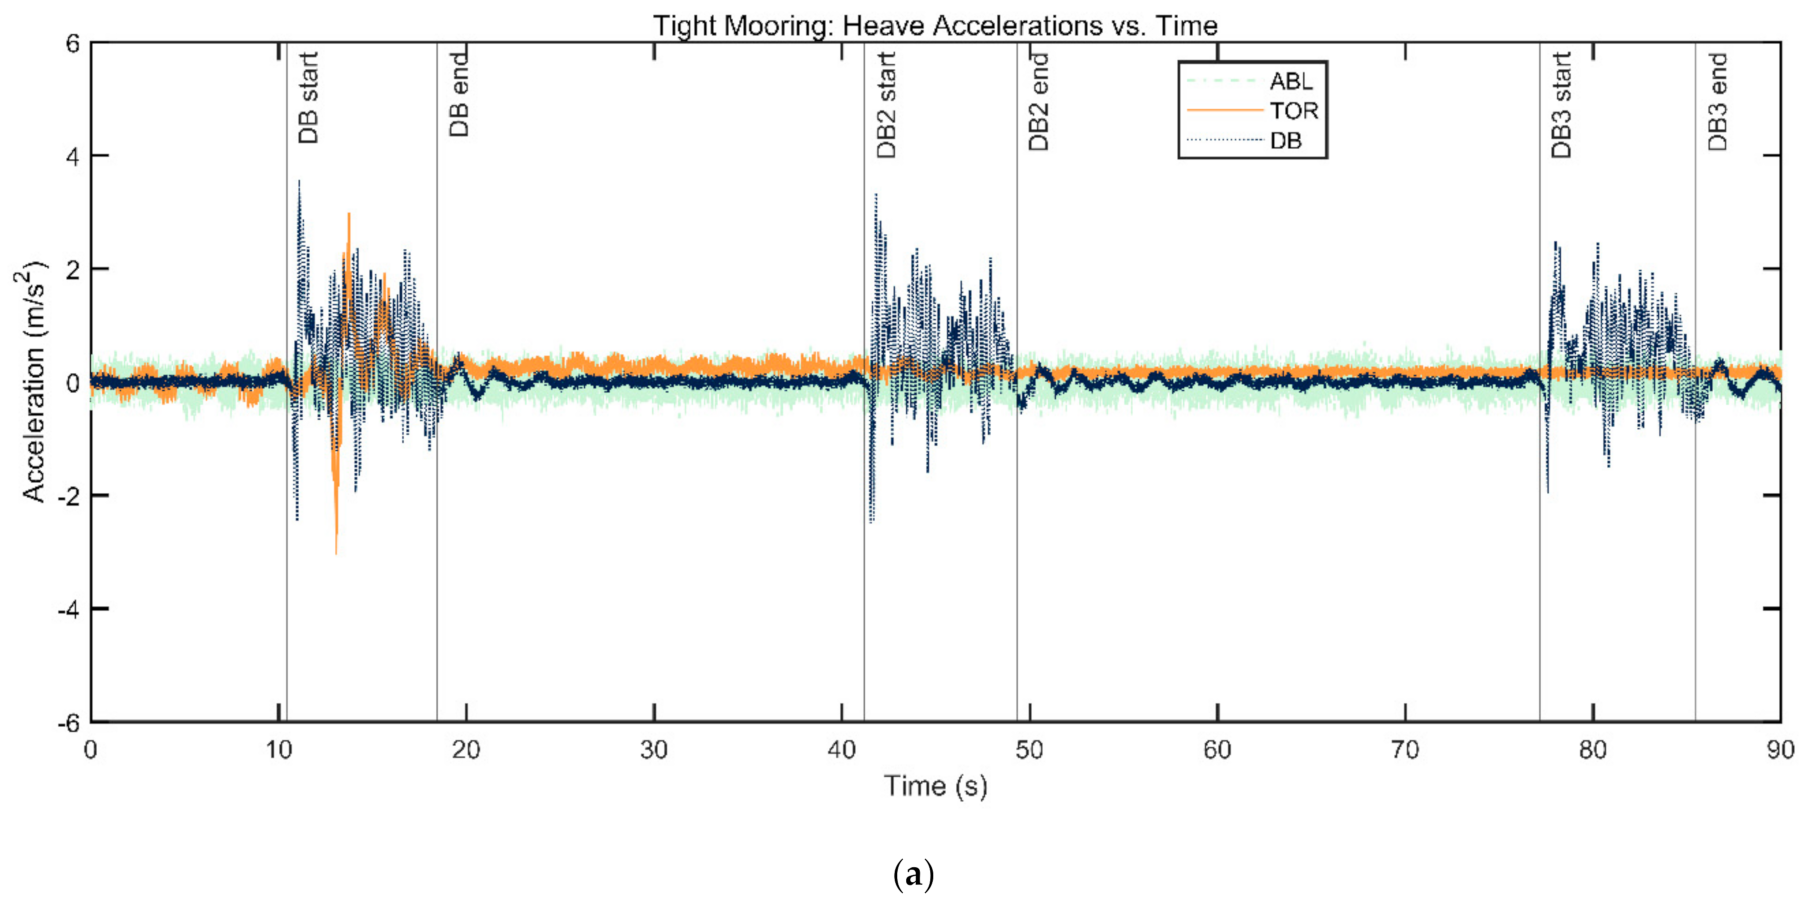
For the tightly moored system, the maximum values of surge acceleration (
Figure 11b) and pitch rotation (
Figure 11c) were ordered: TLV > DB >> ABL. However, the maximum heave acceleration for the tightly moored system (
Figure 11a) was caused by the downburst, followed by the tornado and then was much smaller during the ABL wind profile (DB > TLV >> ABL). As expected, the tension in the mooring lines produced restriction in the structure’s dynamics, causing the absolute maximum of any motion to be lower than that of the loosely moored system of the same design (base platform, no ballast as in Configuration 1). The ABL wind profile generated movements resulting in extremely small oscillations around the equilibrium position compared to the DB or TLV flows. Therefore, the dynamic responses to the TLV and DB flows are studied in more detail.
The tightly moored system generated similar magnitudes of acceleration during the downburst and tornado flows because the tight mooring lines helped to restrain the motion. While tightly moored, the TLV flow, again, caused a similar response to that of the other Configurations in surge and heave accelerations beginning with a large spike in surge acceleration. The heave acceleration of the tightly moored system (
Figure 11a) during the TLV flow began with a negative acceleration when the tornado was over top of the water beside the platform (
Figure 12), significantly lower in magnitude to the loose system of Configuration 1 (
Figure 9a). The lack of initial positive spike in surge and heave acceleration was due to the restrictions of the tight mooring lines, preventing the platform from being pulled upwards far out of the water due to the tornado. Following the initial negative spike in surge and heave acceleration, after the tornado passed over, and was over the open water (
Figure 12), the platform experienced a few additional large oscillations which afterwards clearly dampened to medium and then small oscillation before ending in the equilibrium state. The dampening of the tightly moored platform, after the tornado had fully passed the platform (
Figure 12), is much more controlled than the loosely moored system of Configuration 1, due to the tight mooring lines pulling the platform back to the equilibrium position. The lower magnitudes of acceleration may reduce the likelihood of ultimate strength failure in the platform’s components.
During the tightly moored experiment the magnitudes of rotation were similar for the DB and TLV flows, while the profiles of the rotations were not. The downburst caused a small negative rotation of 5.8° which climbed back up into the positive direction very slightly, as the tension in the mooring lines allowed the system to correct its position, before settling down to the equilibrium level. The tight mooring lines kept the rotation during the TLV test between +3° and −6°, with only 3 large rotations followed by settling of the system. Compared to all other Configurations studied, the rotations during both the TLV and DB tests were significantly reduced with the use of tight mooring lines. These results are comparable to [
22]. The comparable study tested three different types of platforms which were different in design, but the characteristics chosen for comparison were similar to the Configurations compared in this present study. In [
22] the TLP was comparable to Configuration 2, as both consider the effects of taut mooring lines on the stability of the system, the semi-submersible platform is comparable to Configuration 3 as they both were chosen for their lowered center of mass, and the spar buoy is comparable to Configuration 4, as they both consider the effects of low center of mass and larger differences between the center of mass and center of buoyancy. Their study also found that the TLP with tight mooring lines experienced significantly lower pitch values in comparison to the spar and semi-submersible studied.
Next the effects of adding water ballast to the legs of the floating platform (Configuration 3), and then further, generating a top-heavy deck (Configuration 4) with loose mooring lines, are examined. Since floating offshore multi-purposed platforms can be considered for implementation in deep waters, it is important to consider possibilities of implementing these systems in areas where taut mooring lines may not be possible.
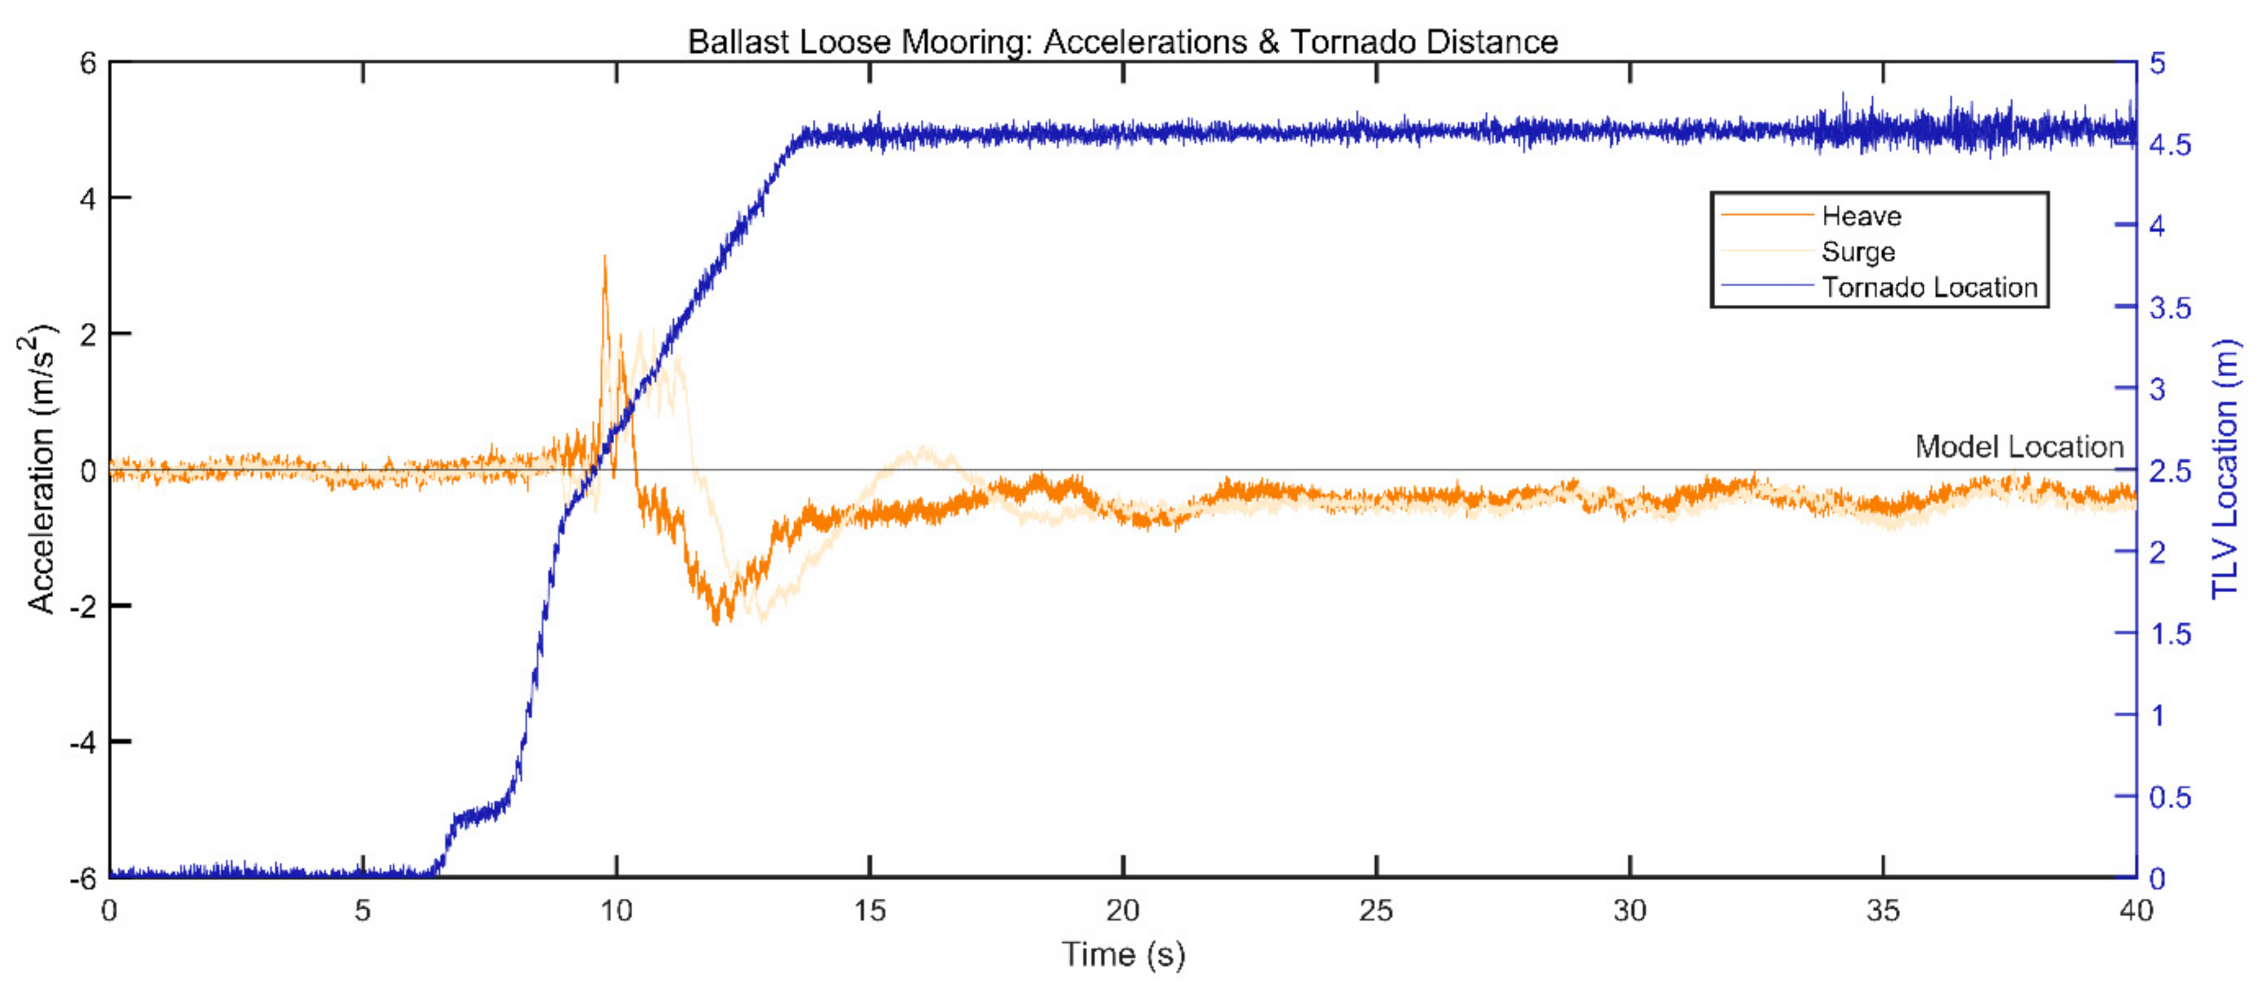
The dynamics of Configuration 3; the floating system with ballast added to the legs of the platform with loose mooring lines, are displayed in
Figure 13a–c. The absolute maximum values for the platform movements of this system were ordered: TLV > DB > ABL, for both the heave acceleration (
Figure 13a) and pitch rotations (
Figure 13c). For the surge acceleration (
Figure 13b) it was ordered: ABL > TLV > DB.
Configuration 3, similarly to the other Configurations, experienced a large initial spike when the downburst and tornado first hit the platform. Following this initial spike, the heave accelerations were greatly reduced in comparison to Configurations 1 and 2, due to the effect of ballast causing a larger force to be necessary to move the structure. However, the surge accelerations were not reduced. Due to the use of water as a ballast material here, the free motion of the water within the structure legs caused this large back and forth movements of the platform. During all three wind profiles, Configuration 3 experienced many large, high frequency surge accelerations.
During the TLV wind profile, the response in acceleration generates a graph with a similar shape to the results generated from Configuration 1 (base platform, loosely moored), however at different magnitudes. The system experienced a spike in acceleration when the tornado was over top of the platform (
Figure 14), and then experienced negative acceleration as the tornado moved across and passed over the platform. Following these initial peaks, the platform experienced one more large surge positive acceleration and then experienced a negative acceleration when the tornado continued into the open water (
Figure 14). This was likely caused by the sloshing effects of the water ballast within the system’s legs. A small rise and fall can be seen in the heave acceleration corresponding to this reaction since, the heave and surge accelerations are correlated. Subsequently, both the heave and surge accelerations continued at relatively low-frequency, and medium sized oscillations before settling back to a stable position.
The downburst generated a large negative acceleration of the system in the surge direction upon its execution, followed by many more large and high frequency oscillations for around 15 s, which would be 184 s at full scale (for all subsequent instances of presenting times analyzed throughout these experiments the full-scale values will be presented in brackets following the experimental values). This Configuration took the greatest amount of time to settle from the large surge oscillations compared to all other Configurations. This is likely because the water ballast within the platform legs continued to slosh back and forth even after the downburst winds ended, causing the structure to continue to experience a surge acceleration for some time.
The pitch rotation experienced by Configuration 3 when subjected to the TLV flow also generate graphs similar in shape to those of the pitch motions seen in Configuration 1, however, at different magnitudes. Configuration 1 had a maximum rotation of 28.38° which decreased to a maximum of 10.5° in Configuration 3, an almost three-fold difference. A peak in negative rotation and then positive rotation was experienced, followed by additional medium sized rotations before settling to the equilibrium position. The downburst caused two large rotations back and forth as the wind profile hit the platform, followed by many high frequency medium sized rotations for a period of approximately 30 seconds. This result is different from Configuration 1, where the platform was held on an angle during the downburst flow. In Configuration 3, it can rotate back from the initial response of the downburst hitting the platform, but consequently experiences more sharp, higher frequency rotations than seen before. Again, the absolute maximum rotation caused by the downburst was significantly reduced by the addition of the ballast. The ABL flow caused small, relatively controlled rotations with a maximum value of 1.38°.
For the test conducted in Configuration 3 the wave heights would correspond to full scale peak-to-peak wave heights of 0–7.5 m. Within [
17] by Naqvi et al., the corresponding full scale wave heights were 0–7 m, which is comparable to the Configuration 3 in ABL wind test conducted in this study. In the Naqvi study the motion response of a ballasted tension leg platform and spar buoy in controlled wave and wind conditions was examined. It was found that the surge accelerations dominated the heave accelerations, which was also discovered for both ballasted systems (Configuration 3 and 4) tested in the present study. The surge acceleration generally resonated between ±0.1 g, with the maximum surge being approximately 0.98 m s
−2. The pitch rotations generated from this test were between approximately −0.75 to 1.75 degrees. Examining the graph of the Configuration 3 motion response to the ABL wind, it can be seen that most of the surge responses were within ±1 m s
−2, although the maximum values are higher at some periods within the test. The major difference between these two experiments is that within Naqvi’s study the system is a tension leg platform while Configuration 3 is a loosely moored system. However, due to the comparable wave generations and subjection to straight wind flows it seems helpful to compare the two findings and to consider the cause of any differences. It is likely that the spikes in surge acceleration within Configuration 3 could have been avoided with more taught mooring lines, as used in [
17]. The pitch rotations of Configuration 3 subjected to the ABL flow were between −0.56° and 1.34°, which again is comparable to the findings in Naqvi’s study [
17].
The findings for Configuration 3 in this study are similar to the findings of the semi-submersible in [
22], due to both of these studies being compared for their lowered center of mass. In this compared study it was found that the semi-submersible platform experienced the highest surge response out of all three types studied [
22]. In the present study, the surge motions of Configuration 3 were the greatest in both magnitude and frequency, compared to that of the other Configurations compared here as well. Again, this was likely cause by the sloshing effects of the water ballast within the platform legs.
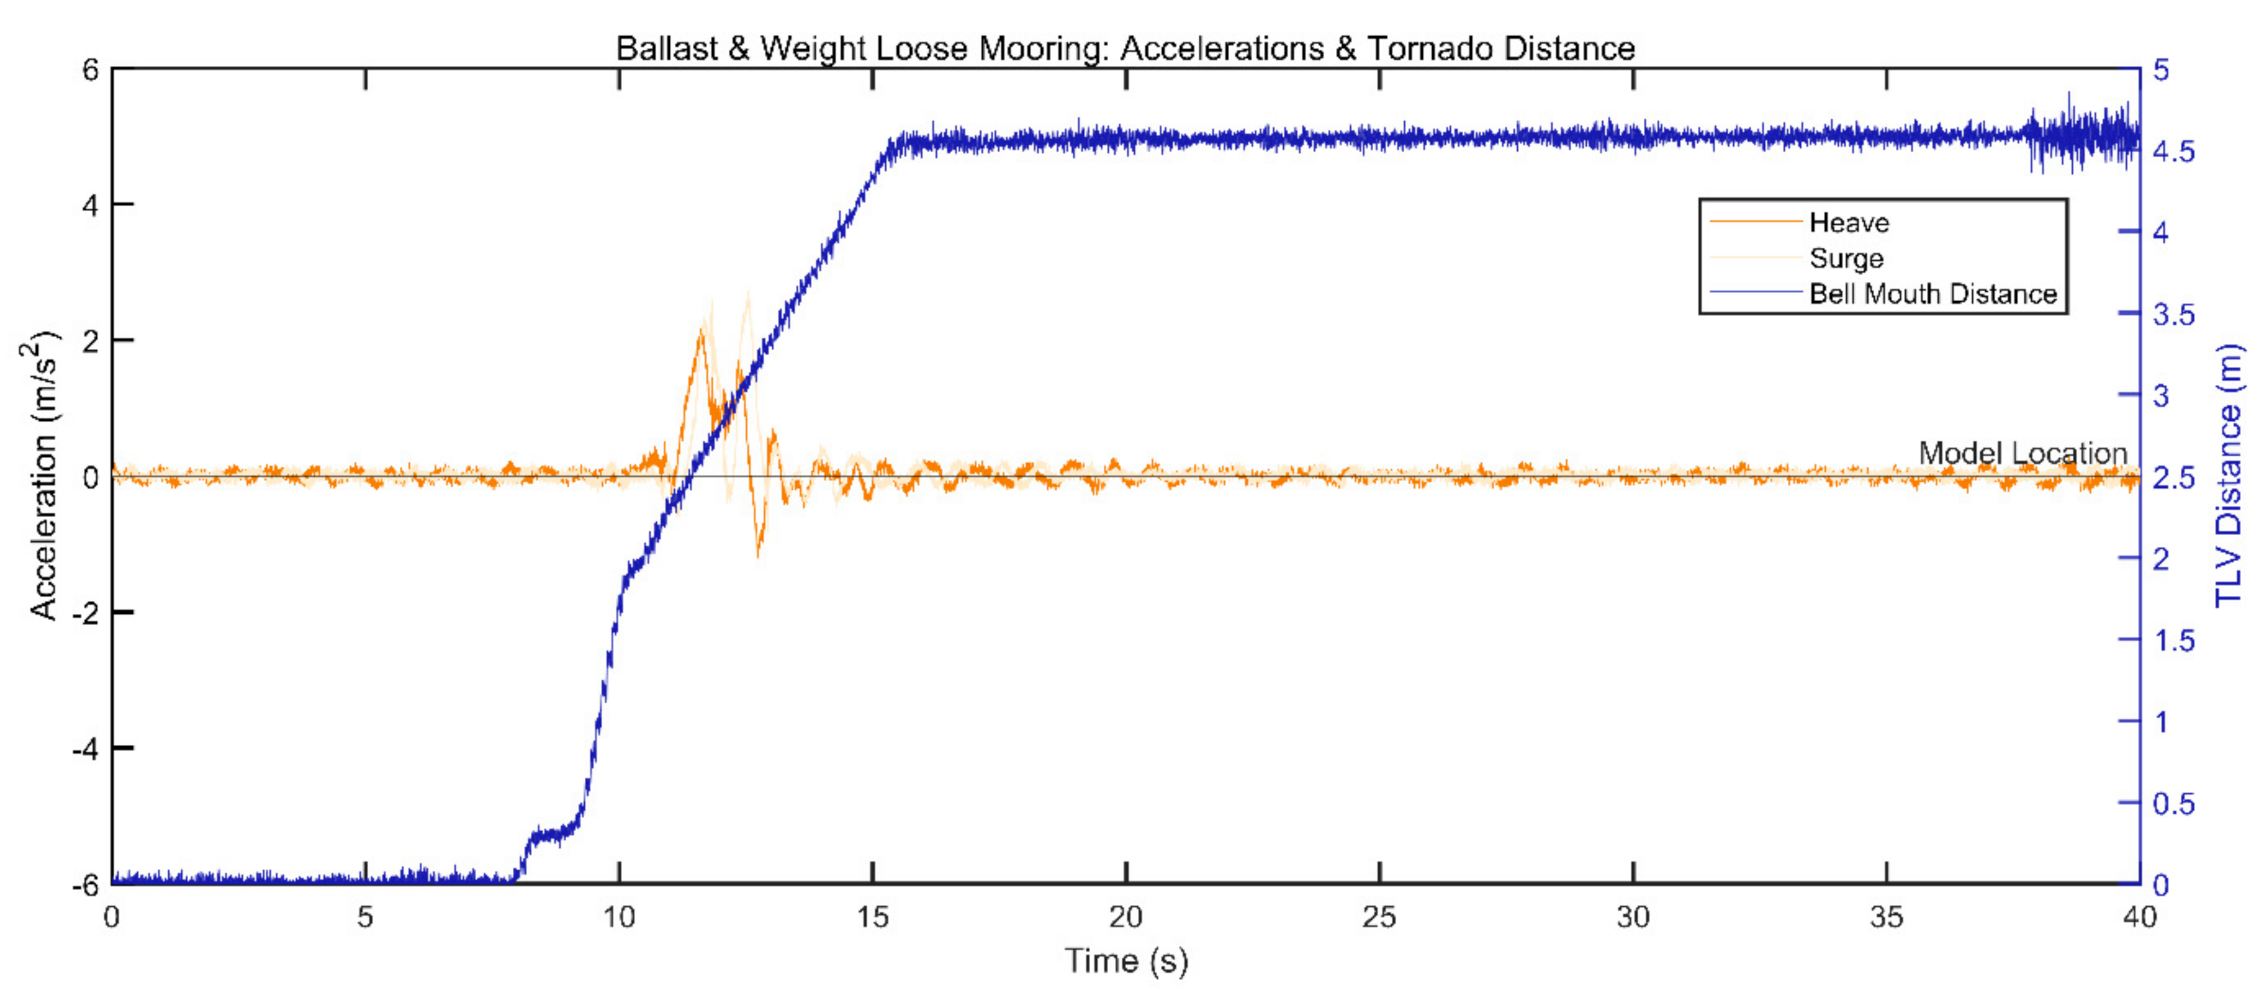
For the platform with additional top-heavy weight added to the system deck (Configuration 4), the order of maximum values of heave acceleration (
Figure 15a) and pitch rotation (
Figure 15c) were: DB > TOR >> ABL. The maximum values of the surge acceleration (
Figure 15b) were of the order: TOR > DB >> ABL.
During the TLV flow, Configuration 4 experienced an increase in both heave and surge acceleration as the tornado was over top of the platform (
Figure 16). The tornado slightly lifted the platform and then passed into the surrounding water. This was followed by small oscillations which very quickly settled to the equilibrium position after the tornado had ended (
Figure 16). When this top-heavy platform was subjected to the DB flow a sharp change in acceleration was generated as the downburst hit the platform. This was followed by small heave accelerations and medium sized surge accelerations for approximately 10 s before the system steadied out to the equilibrium position. The oscillations following the initial peaks generated from the DB and TLV, but before the system settled to the equilibrium position, were significantly smaller in magnitude than those of Configurations 1 and 2 for the heave acceleration, and Configurations 1, 2 and 3 for the surge acceleration. Configuration 4 has the most obvious stability in the heave direction compared to any of the other Configurations.
The period it takes for the motion to settle back to its equilibrium position following the downburst or tornado hitting the platform is shortest in Configuration 4. The reduction in time needed to return to equilibrium for Configuration 4 is most significantly reduced, by 30–50 s (367–612 s at full scale) during the TLV wind profile compared to Configurations 1, 2 and 3. The ABL flow caused extremely small accelerations in both the heave and surge directions.
Comparing the pitch rotations of each Configuration, the tightly moored platform of Configuration 2 experienced, by far, the lowest and most controlled rotations. For the loosely moored systems, the addition of ballast in the legs of the platform significantly reduced the maximum pitch rotations of the platform, however it caused more sharp back and forth rotations during the settling of the platform after the downburst and tornado was completed. This longer time necessary to settle could again be caused by the water sloshing effects of the ballast within the legs. Further, the addition of a top-heavy deck on the floating platform in Configuration 4 increased the absolute maximum rotation during the DB from 8.88° to 9.44°. The TLV absolute rotation decreased from 10.5° to 6.88°. A study completed by Yang et al. found that with increasing water depth, the pitch rotation decreases [
23]. In deeper waters taut mooring lines become less realistic, and platforms will likely be freer to move such as the ones in the present paper represented by the loose catenary mooring. The stability of the pitch rotation for configurations 3 and 4 could be dampened further in a deep-water application, generating a more stable platform.
Comparing these results to the findings of [
22], the spar system is comparable to Configuration 4, due to the characteristics of both systems being a low center of mass and large difference between the center of mass and center of buoyancy. The results of [
22] found that the surge of this Configuration was lowest in comparison to the other configurations in the study. In the study presented here, Configuration 4 did still experience large spikes in acceleration when the wind profiles first hit the platform, however, the motions following those peaks were the lowest of all other configurations.
5. Conclusions
Four Configurations of scaled models of a floating offshore multi-purpose platform were developed and experimentally tested with two types of mooring lines to examine the dynamic responses and stability when subjected to 1:150 scaled Atmospheric Boundary Layer (ABL), Tornado-Like Vortices (TLV) and Downburst (DB) wind flows. The experiments conducted within this study repeatedly resulted in large peaks and sharp movements caused by the TLV wind profile, followed by smaller but significant oscillations before the motions were able to return to equilibrium. The DB profile generated repeated high frequency accelerations throughout its duration. The ABL wind profile produced very small accelerations and rotations for all tests except the surge acceleration of Configuration 3 (loosely moored and ballasted platform).
The tightly moored system in Configuration 2 experienced reduced motions compared to the loosely moored base platform of Configuration 1. The tight system absolute maximum values of acceleration were lower than the loose system, and the rotations were the lowest of all Configurations studied. Considering only the rotational response of the systems, the tightly moored system has by far the greatest stability.
Configurations 3 (ballast addition) and 4 (ballast and top-weight addition) did still experience large peaks when the tornado and downburst first hit the structure. Configuration 4 provided insight to the effect of raising the center of buoyancy of the system, with the loosely moored, ballasted, and top-heavy system. This system experienced very low accelerations following these peaks in comparison to the other loosely moored systems (Configurations 1 and 3) and even the tightly moored system (Configuration 2). The heave of Configuration 4 is significantly dampened, even at the peaks, resulting in Configuration 4 experiencing the greatest heave stability of all the tests. However, the peaks of the surge acceleration were high for this system, which was likely caused by the sloshing effects of the water ballasting material. The ballasted system without top-heavy weight in Configuration 3 experienced even greater peaks for the surge acceleration, again due to the water ballast sloshing effects, resulting in the highest absolute surge maximum of all the systems.
Additionally, the platform was forced on an angle for the entire duration of the downburst wind flow when loosely moored with no ballast. The addition of ballast in Configurations 3 and 4 generated lower maximum rotations compared to Configuration 1. However, the ballasted systems experience a higher frequency of sharp back and forth rotations during the downburst test and following the TLV.
Overall, the downburst caused higher frequencies and large magnitudes of oscillations of the floating system that lasted the entire duration of the downburst. This caused repeated stress on the structure’s components that over time may result in higher fatigue loading of the system. The tornado generated very large platform movements with less significant oscillation, and thus likely producing a greater tendency to experience higher yield stress or potentially ultimate strength failure of system components. The long period of rotation subjected on the platform by the DB flow could also be detrimental to the platform and systems on top of it. If a floating structure were to be implemented within an area prone to these extreme winds, design considerations should especially focus on reduction in rotations of the structure.
The loose mooring line systems are freer to move in any direction, which caused them to move more sporadically. This was especially obvious comparing the pitch rotations of Configurations 1, 3 and 4 to Configuration 2 with the tight mooring lines. The tight mooring line system was able to oscillate more closely and cleanly around the equilibrium point due to the forces from the mooring lines and the added buoyancy force from the platform displacing more water. The tightly moored system faced lower magnitudes of motion in all tests compared to the loosely moored system with no ballast. The tightly moored system did, however, experience a longer period of high frequency oscillations of acceleration during the DB flow subjection, compared to that of Configuration 1, with the loose mooring lines.
Considering the findings of this study, it can be suggested that the tight mooring lines allow for more predictable dynamic motions of a structure, and the lowest maximum accelerations and rotations. In projects where location and design conditions would allow, tightly moored systems may be a desirable option to reduce the risk of major movement or damage from a storm. However, it must be kept in consideration that this type of system could still experience very high frequency motions during a major wind event. In comparison to the loosely moored, unballasted and unweighted system of Configuration 1, however, the reduction in extreme rotation of the structure by using tight mooring lines is desirable.
In areas where the waters are very deep, or tide must be taken into consideration, tightly moored systems may not be a viable option, and loose mooring lines may be chosen. Other reasons for loose mooring lines to become desirable could include ease of installation, or project specific benefits such as the need for high wind speeds far offshore (in deeper waters) for an offshore wind turbine application. The findings in this study provide insight to some methods of improving the design of offshore floating systems with loose mooring lines, with a ballast addition and top-heavy weight system. The major changes in structure dynamics with these different design considerations when subject to extreme wind events is shown within these findings.
The results of these experiments show that the stability of floating structures is much more varied under TLV and DB flows than it us under ABL winds and the dynamic motions are much larger. Clearly, further studies of light-duty floating platforms under extreme winds and environmental conditions should be considered to advance design efficiencies and overarching safety concerns in this nascent segment of the offshore sector.


 ,
, 


