
Analysis of the Net Metering Schemes for PV Self-Consumption in Denmark


Abstract
:1. Introduction
1.1. Setting the Context
1.2. State-of-the-Art
1.3. Contribution
2. Materials and Methods
2.1. Methodology
2.2. Description of the Danish BEK 999/2016 Regulatory Framework
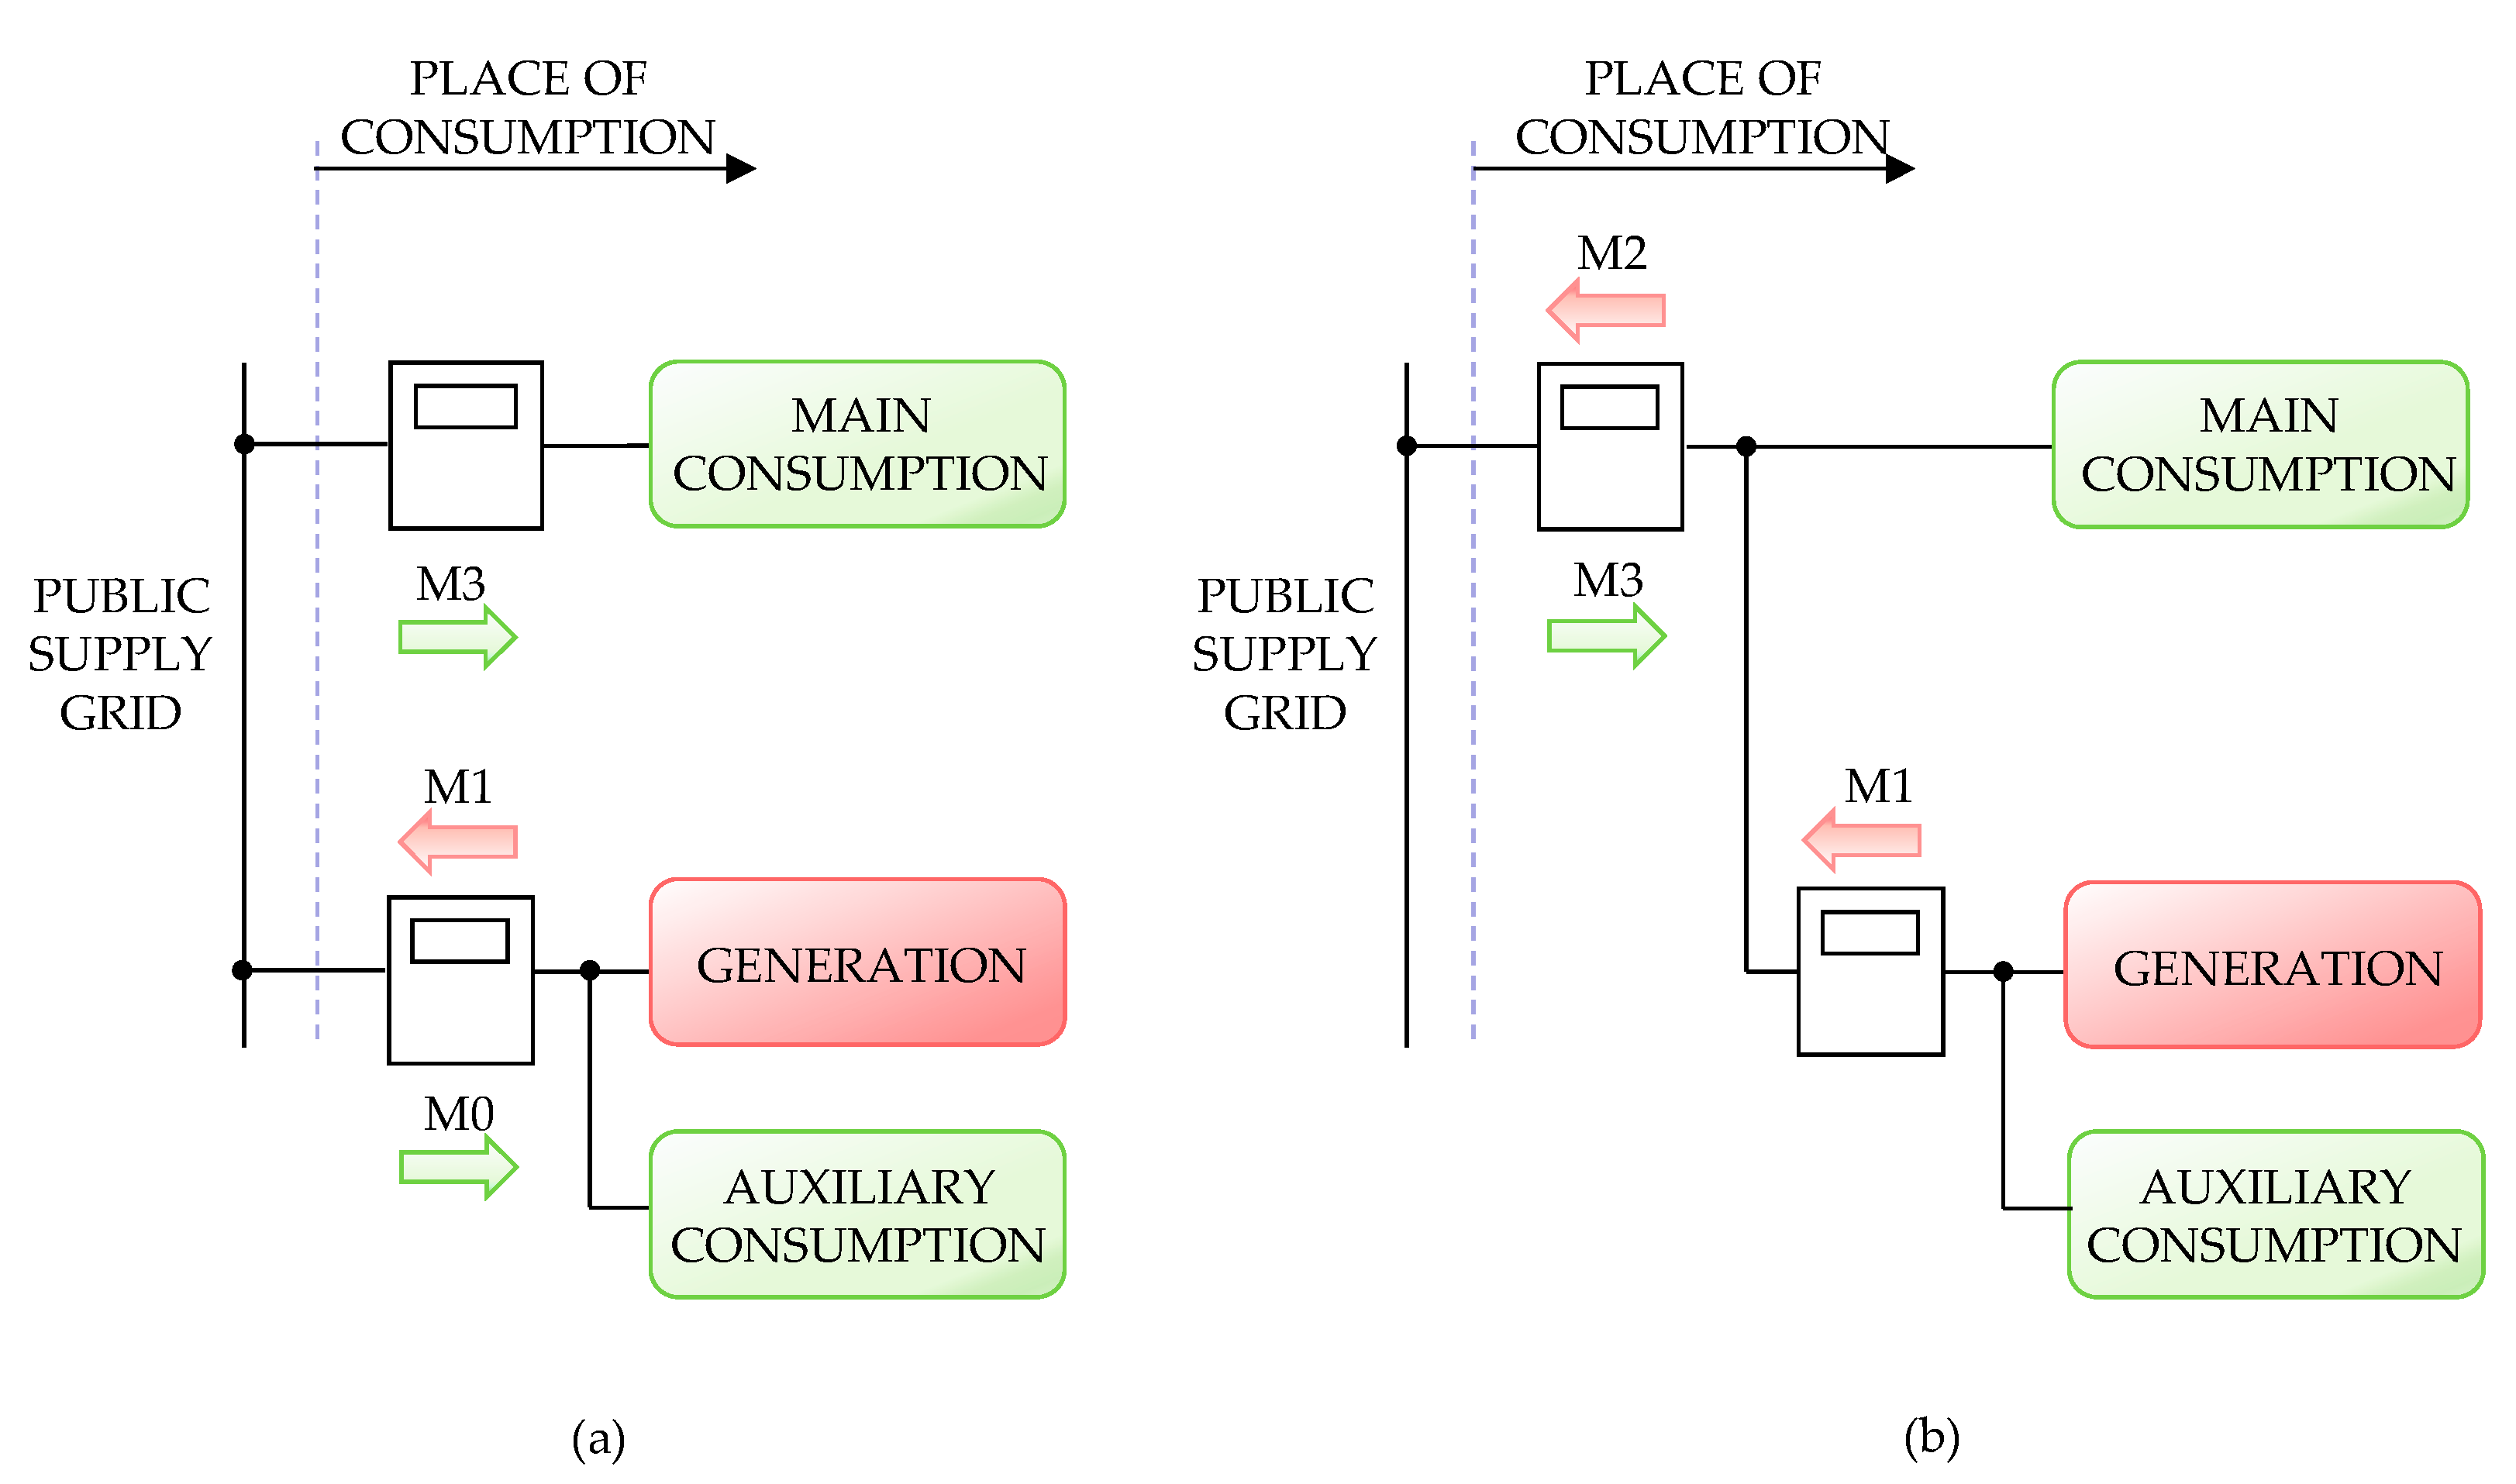
2.2.1. Metering Points
2.2.2. Billing Concepts
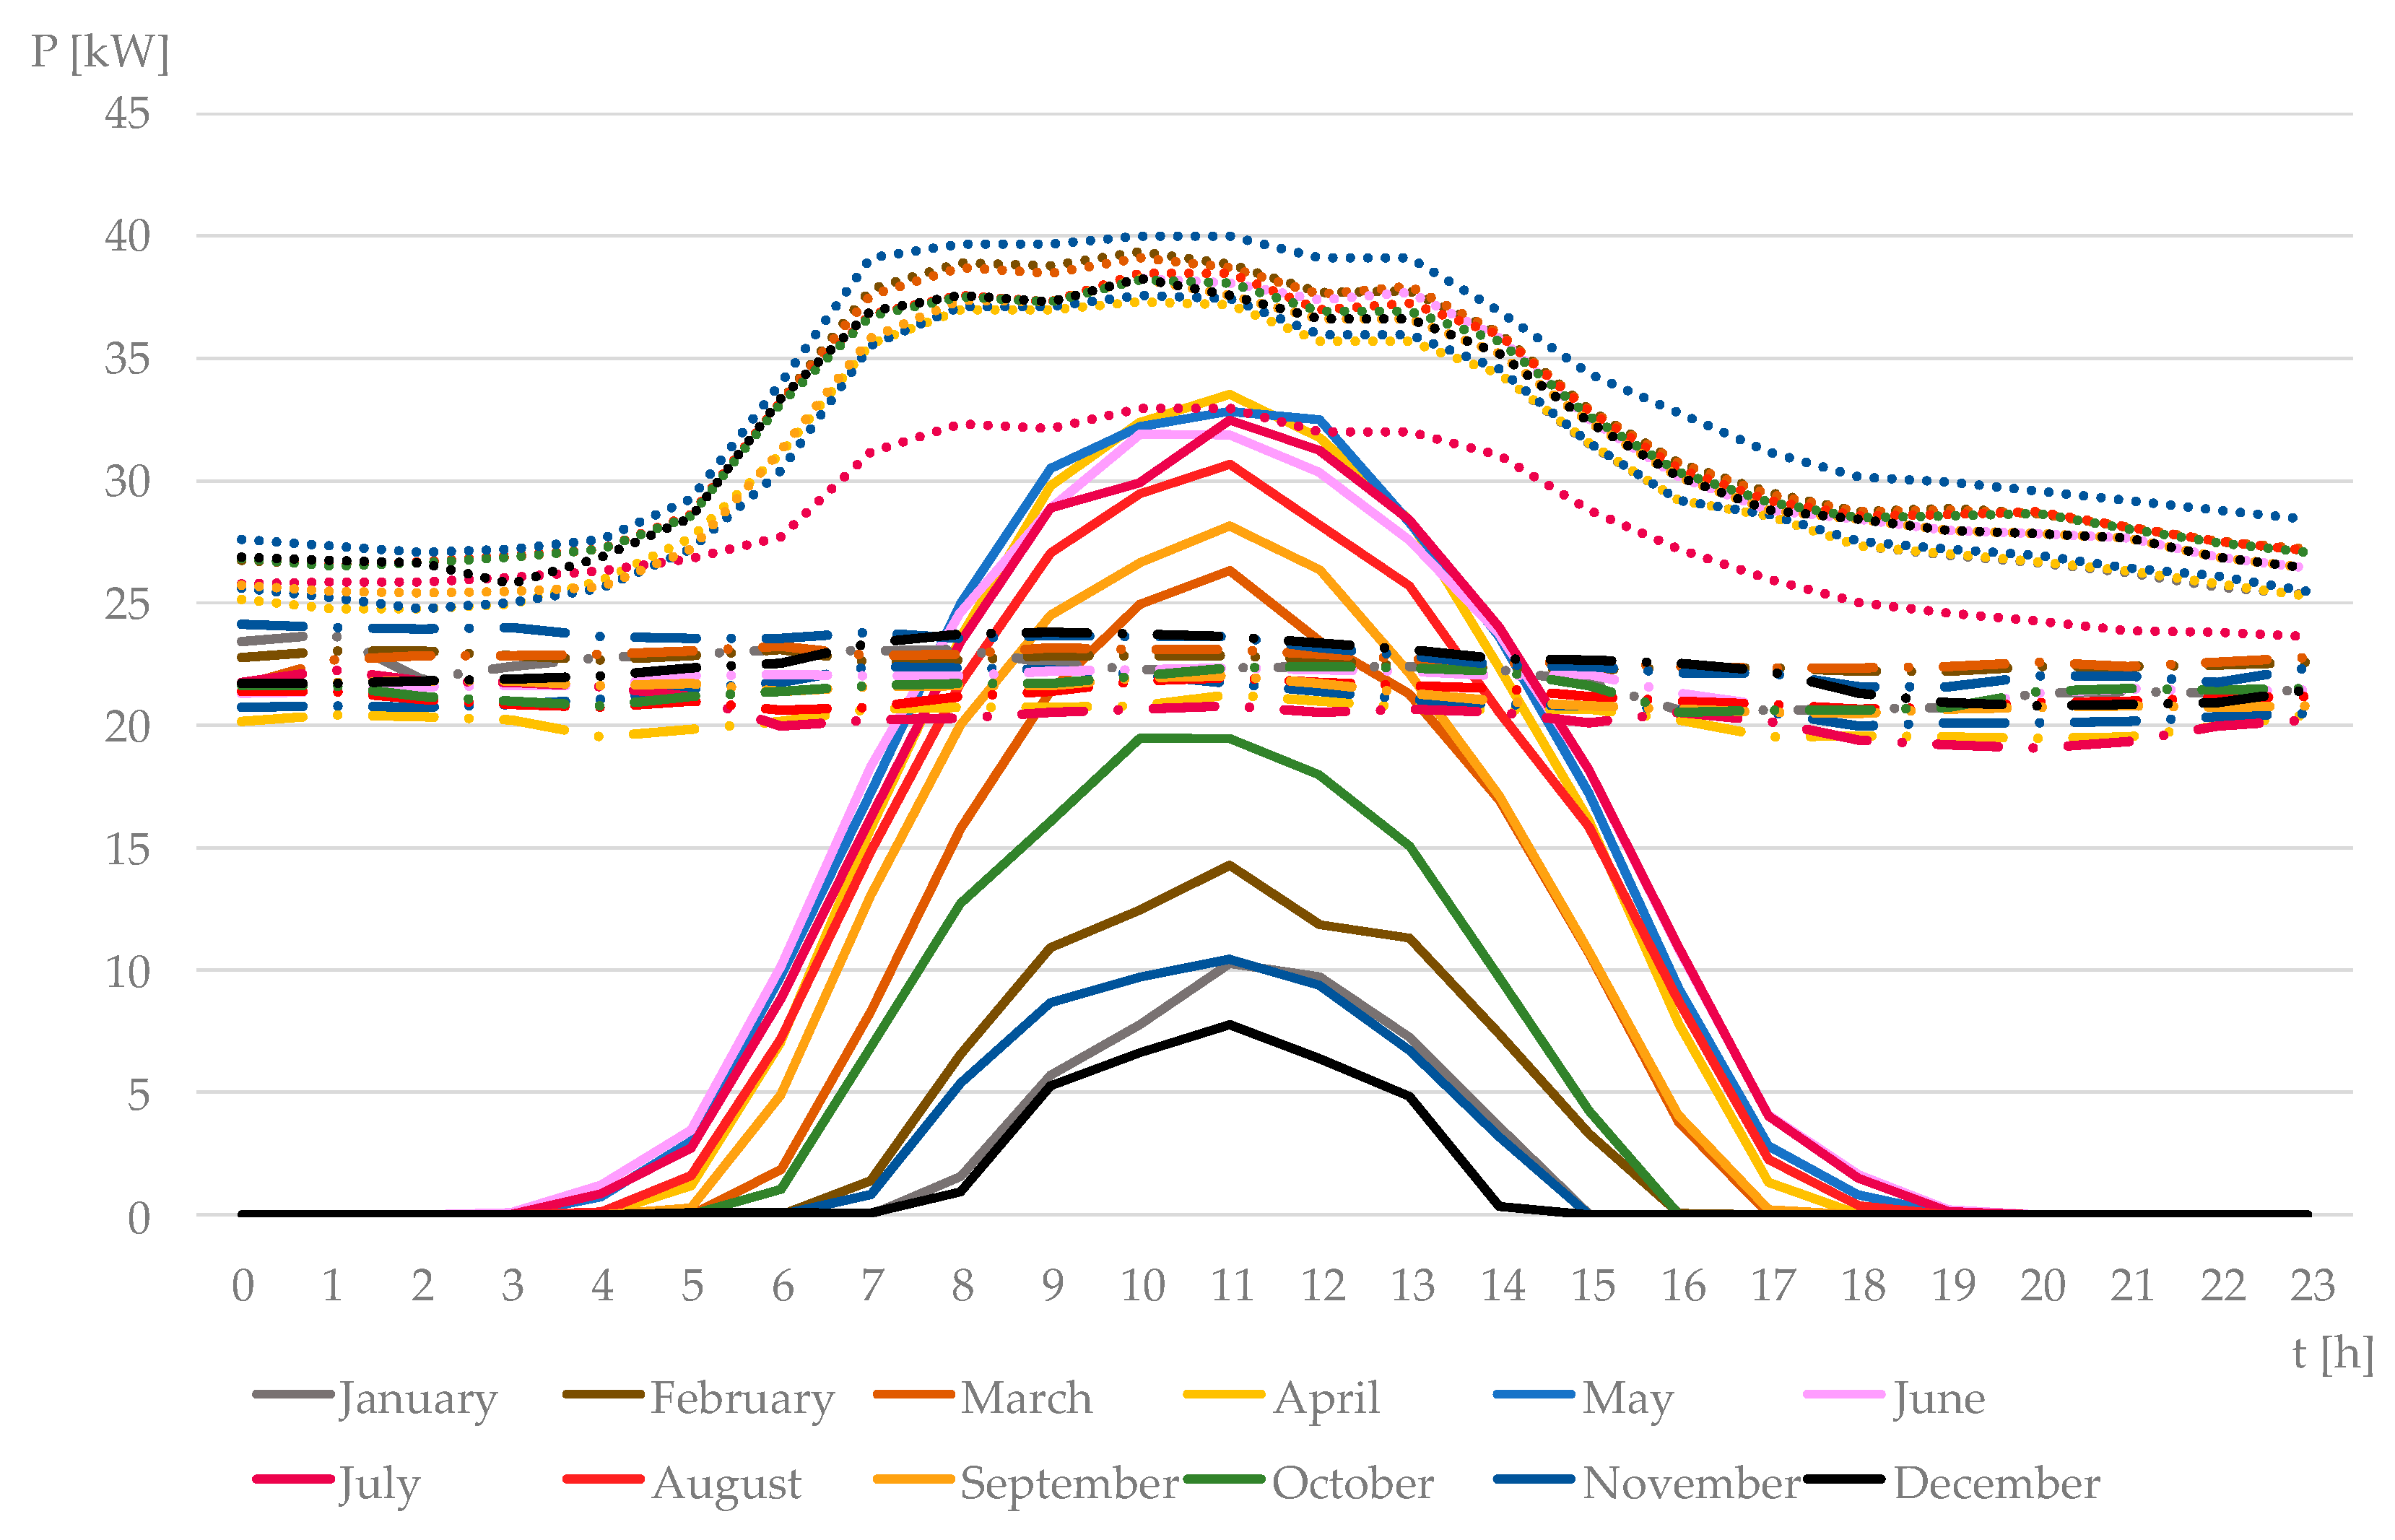
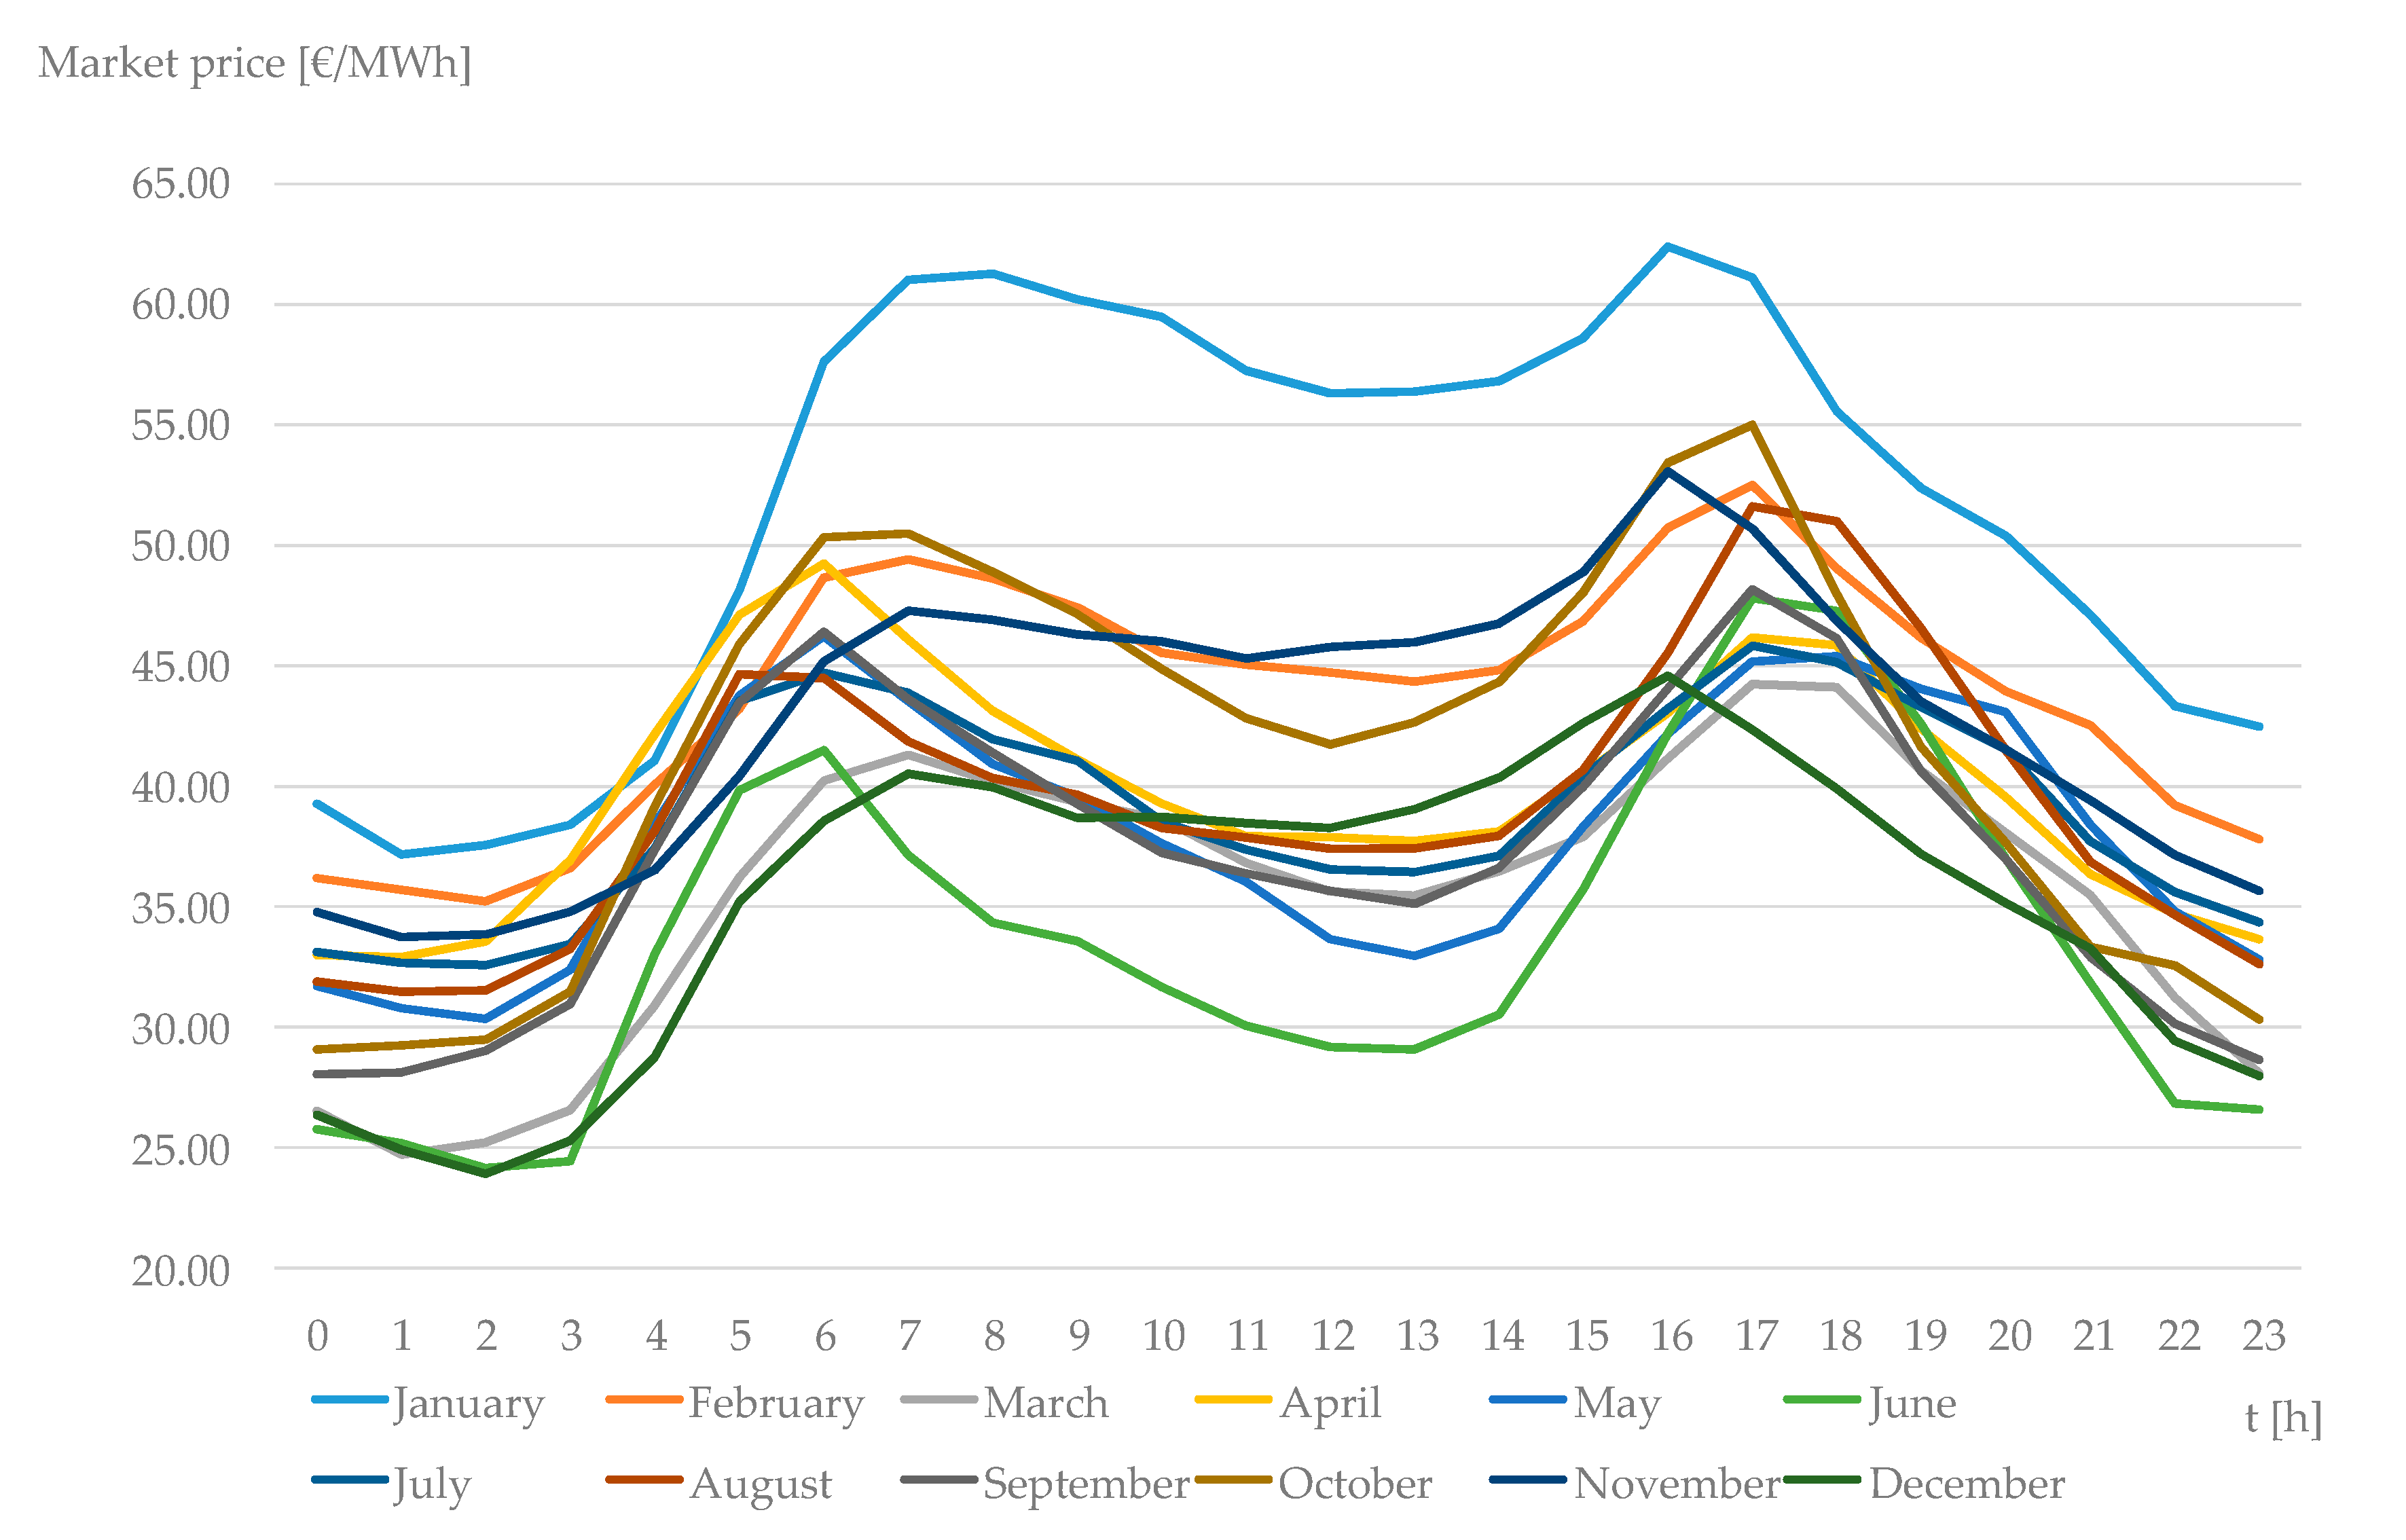
2.3. Case Study
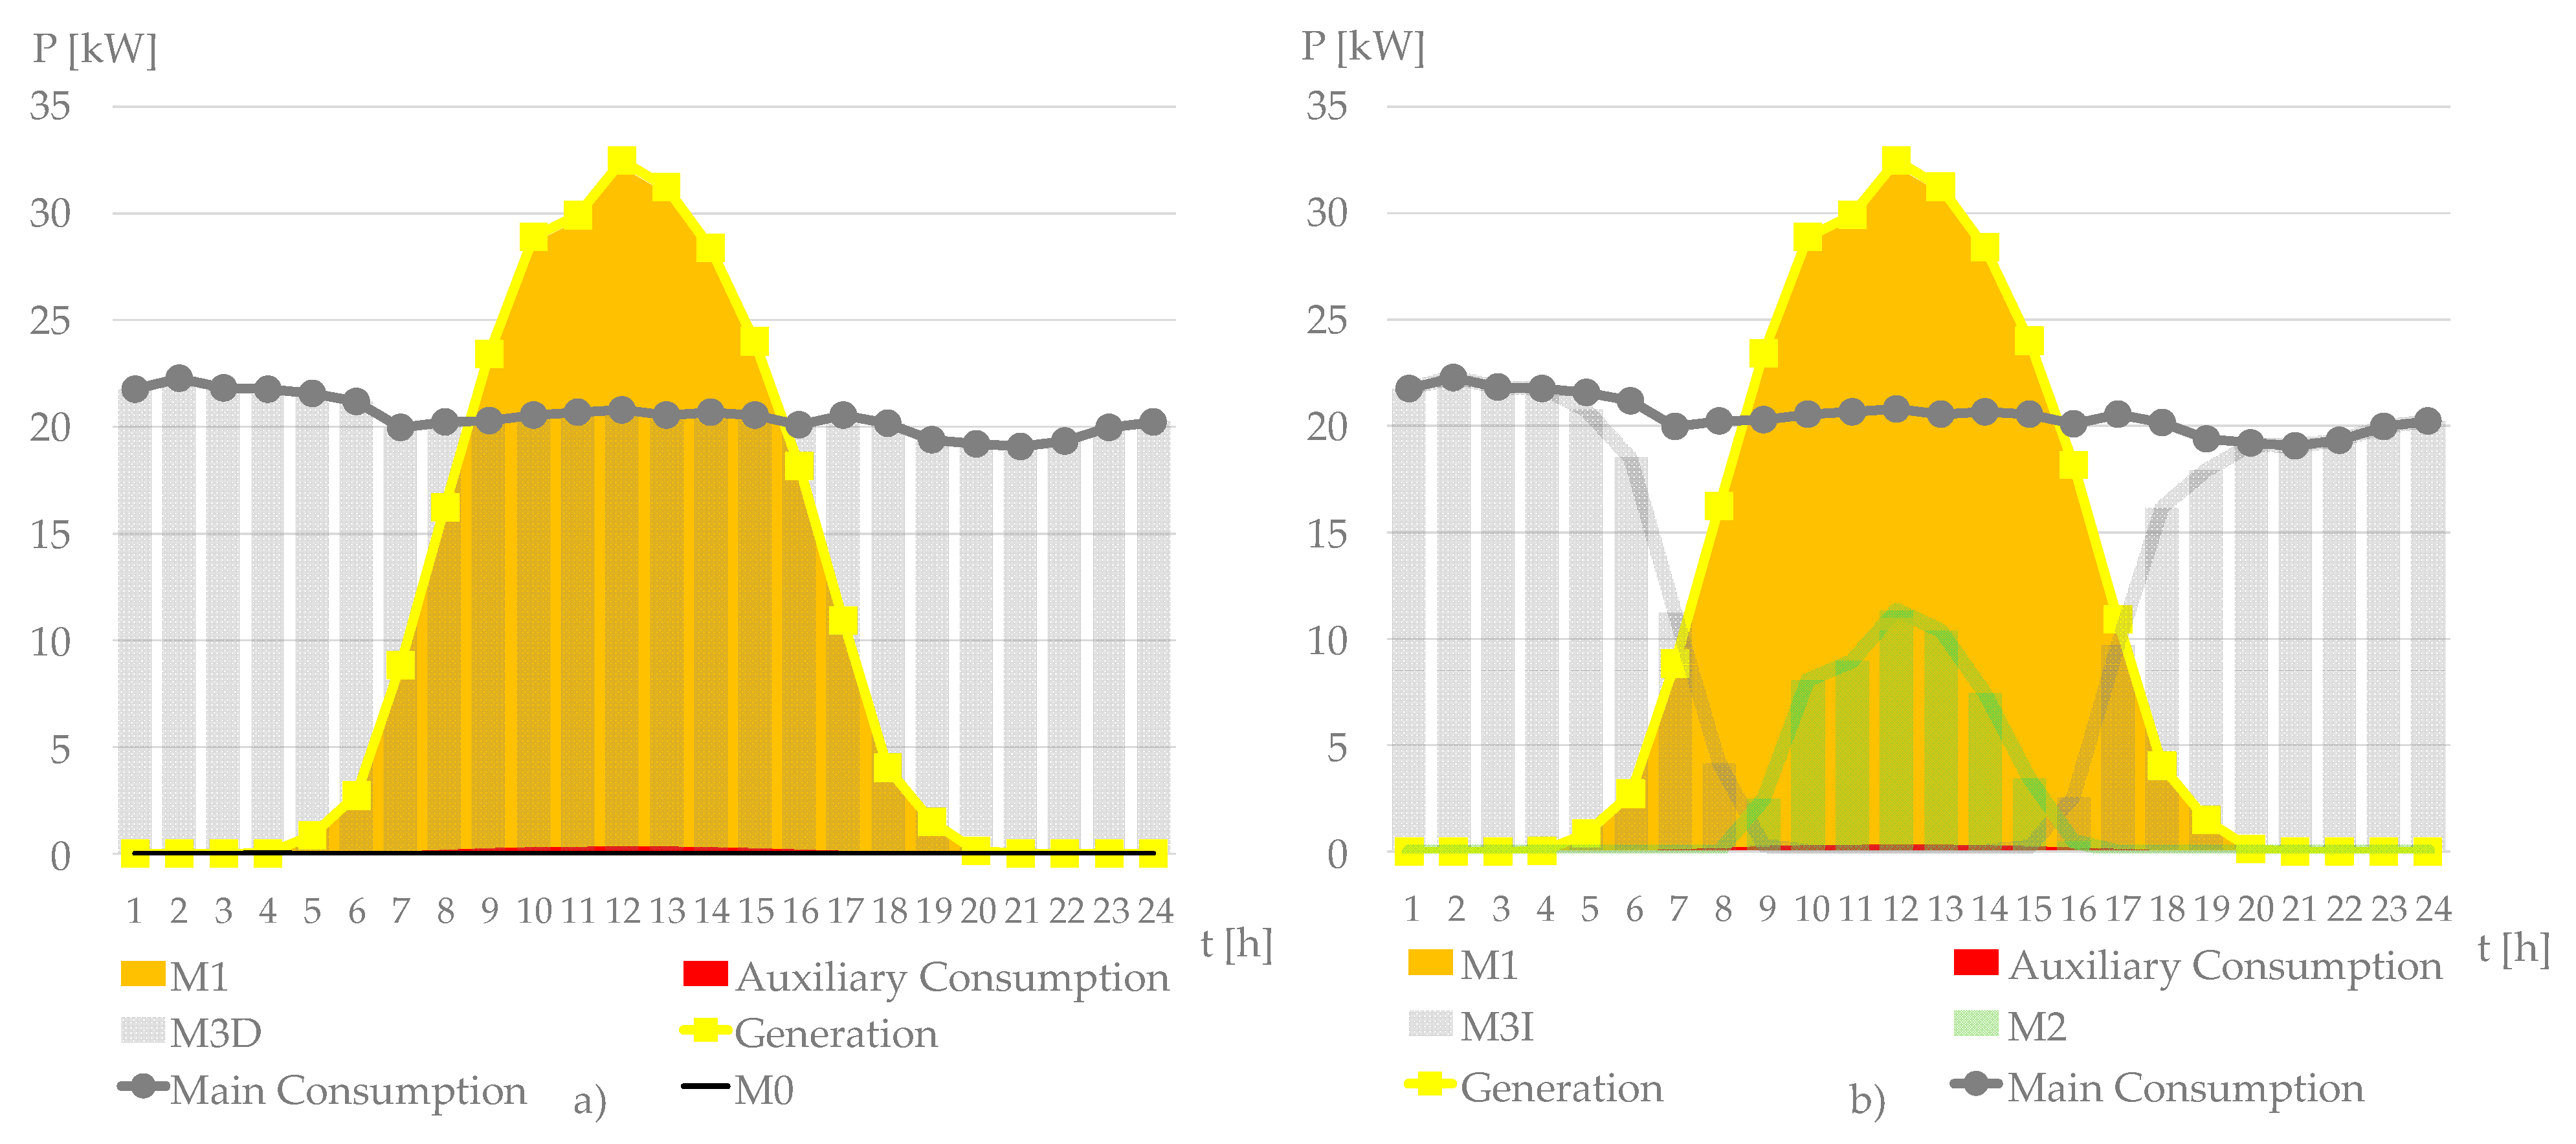
3. Results
4. Discussion
4.1. Analysis of the Danish BEK 999/2016 Regulatory Framework
4.1.1. Billing Concepts with Different Impact for All the Connection Types and Groups
4.1.2. Connection-Type Dependent Billing Concepts
4.1.3. Group Dependent Billing Concepts
4.1.4. Billing Concepts with Equal Impact for all the Connection Types and Groups
4.2. The Uneven Impact of Taxes on the Different Customer Segments
4.3. Additional Considerations
4.4. Future Research
5. Conclusions
Author Contributions
Funding
Conflicts of Interest
Acronyms
| BF | Total consumption |
| CMP | Consumption metering point |
| DKK | Danish krone |
| DSO | Distribution system operator |
| EP | Self-consumption |
| EU | European Union |
| PMP | Production metering point |
| PSO | Public service obligation |
| PV | Solar photovoltaic |
| NFN | Net from network |
| NTN | Net to network |
| RE | Renewable energy |
| RH | Availability payment |
| RES-E | Electricity from renewable energy sources |
| TSO | Transmission system operator |
References
- Ministry of Foreign Affairs. Invest in Denmark. Available online: https://investindk.com/insights/denmark-has-the-worlds-best-energy-system (accessed on 28 February 2021).
- Danish Ministry of Climate, Energy and Utilities. Denmark’s Integrated National Energy and Climate Plan under the Regulation of the European Parliament and of the Council on the Governance of the Energy Union and Climate Action, December 2019. Available online: https://ec.europa.eu/energy/sites/ener/files/documents/dk_final_necp_main_en.pdf (accessed on 28 February 2021).
- REN21. Renewables 2020 Global Status Report. Paris. 2020. Available online: https://www.ren21.net/gsr-2020/ (accessed on 28 February 2021).
- IEA. PVPS Annual Report 2019. 2020. Available online: https://iea-pvps.org/wp-content/uploads/2020/05/IEA-PVPS-AR-2019-1.pdf (accessed on 28 February 2021).
- IRENA. Renewable Energy Statistics 2020. Abu Dhabi, March 2020. Available online: https://www.irena.org/publications/2020/Mar/Renewable-Capacity-Statistics-2020 (accessed on 28 February 2021).
- EUROPEAN COMMISSION. Clean Energy for All Europeans. COM (2016) 860 Final. Brussels, November 2016. Available online: https://ec.europa.eu/energy/sites/ener/files/documents/com_860_final.pdf (accessed on 28 February 2021).
- Krönert, F.; Henriksen, G.L.; Boye, S.; Edfeldt, E.; Wiesner, E.; Nilsson, M.F.; Uusitalo, O. Distributed Electricity Production and Self-Consumption in the Nordics. Sweco and Oslo Economics. June 2019. Available online: https://www.nordicenergy.org/article/new-report-distributed-electricity-production-and-self-consumption-in-the-nordics/ (accessed on 28 February 2021).
- Energistyrelsen. Solcellestatistik for 4. Kvartal 2019. January 2020. Available online: https://www.ft.dk/samling/20191/almdel/KEF/bilag/213/2152522/index.htm (accessed on 28 February 2021).
- Wang, Z.; Yang, G. Static Operational Impacts of Residential Solar PV Plants on the Medium Voltage Distribution Grids—A Case Study Based on the Danish Island Bornholm. Energies 2019, 12, 1458. [Google Scholar] [CrossRef] [Green Version]
- Stroe, D.I.; Zaharof, A.; Iov, F. Power and Energy Management with Battery Storage for a Hybrid Residential PV-Wind System—A Case Study for Denmark. Energy Procedia 2018, 155, 464–477. [Google Scholar] [CrossRef]
- Gržanić, M.; Capuder, T. The Value of Prosumers’ Flexibility under Different Electricity Market Conditions: Case Studies of Denmark and Croatia. In Proceedings of the IEEE PES GTD Grand International Conference and Exposition Asia (GTD Asia), Bangkok, Thailand, 19–23 March 2019; pp. 616–621. [Google Scholar]
- Chatzisideris, M.D.; Laurent, A.; Christoforidis, G.C.; Krebs, F.C. Cost-competitiveness of organic photovoltaics for electricity selfconsumption at residential buildings: A comparative study of Denmark and Greece under real market conditions. Appl. Energy 2017, 208, 471–479. [Google Scholar] [CrossRef] [Green Version]
- Chatzisideris, M.D.; Ohm, P.K.; Espinosa, N.; Krebs, F.C.; Laurent, A. Economic and environmental performances of organic photovoltaics with battery storage for residential self-consumption. Appl. Energy 2019, 256, 113977. [Google Scholar] [CrossRef]
- Hou, P.; Douglass, P.J.; Yang, G.; Hielsen, A.H. Optimal scheduling of PV and battery storage at distribution network considering grid tariffs. In Proceedings of the 11th IET International Conference on Advances in Power System Control, Operation and Management (APSCOM 2018), Hong Kong, China, 11–15 November 2018; pp. 1–6. [Google Scholar]
- Saviuc, I.; Peremans, H.; Van Passel, S.; Milis, K. Economic Performance of Using Batteries in European Residential Microgrids under the Net-Metering Scheme. Energies 2019, 12, 165. [Google Scholar] [CrossRef] [Green Version]
- Marczinkowski, H.M.; Østergaard, P.A. Residential versus communal combination of photovoltaic and battery in smart energy systems. Energy 2018, 152, 466–475. [Google Scholar] [CrossRef] [Green Version]
- Jäger-Waldau, A.; Bucher, C.; Frederiksen, K.H.B.; Guerro-Lemus, R.; Mason, G.; Mather, B.; Mayr, C.; Moneta, D.; Nikoletatos, J.; Roberts, M.B. Self-consumption of electricity produced from PV systems in apartment buildings—Comparison of the situation in Australia, Austria, Denmark, Germany, Greece, Italy, Spain, Switzerland and the USA. In Proceedings of the 2018 IEEE 7th World Conference on Photovoltaic Energy Conversion (WCPEC), Waikoloa Village, HI, USA, 10–15 June 2018; pp. 1424–1430. [Google Scholar]
- Chatzisideris, M.D.; Laurent, A.; Hauschild, M.Z.; Krebs, F.C. Environmental impacts of electricity self-consumption from organic photovoltaic battery systems at industrial facilities in Denmark. CIRP Ann. Manuf. Technol. 2017, 66, 45–48. [Google Scholar] [CrossRef] [Green Version]
- Carli, R.; Dotoli, M.; Jantzen, J.; Kristensen, M.; Othman, S.B. Energy scheduling of a smart microgrid with shared photovoltaic panels and storage: The case of the Ballen marina in Samsø. Energy 2020, 198, 117188. [Google Scholar] [CrossRef]
- Ahamad, N.B.; Othman, M.; Vasquez, J.C.; Guerrero, J.M.; Su, C. Optimal sizing and performance evaluation of a renewable energy based microgrid in future seaport. In Proceedings of the 2018 IEEE International Conference on Industrial Technology (ICIT), Lyon, France, 19–22 February 2018; pp. 1043–1048. [Google Scholar]
- De la Hoz, J.; Martín, H.; Alonso, A.; Luna, A.C.; Matas, J.; Vásquez, J.C.; Guerrero, J.M. Regulatory-framework-embedded energy management system for microgrids: The case study of the Spanish self-consumption scheme. Appl. Energy 2019, 251, 113374. [Google Scholar] [CrossRef]
- Alonso, A.; De la Hoz, J.; Martín, H.; Coronas, S.; Salas, P.; Matas, J. A Comprehensive Model for the Design of a Microgrid under Regulatory Constraints Using Synthetical Data Generation and Stochastic Optimization. Energies 2020, 12, 5590. [Google Scholar] [CrossRef]
- Ministry of Climate, Energy and Supply. BEK Nr. 999 of June 29, 2016. Bekendtgørelse om Nettoafregning for Egenproducenter af Elektricitet. Available online: https://www.retsinformation.dk/eli/lta/2016/999 (accessed on 28 February 2021).
- Ministry of Climate, Energy and Supply. BEK Nr. 1749 of December 26, 2017. Bekendtgørelse om Ændring af Bekendtgørelse om Nettoafregning for Egenproducenter af Elektricitet. Available online: https://www.retsinformation.dk/eli/lta/2017/1749 (accessed on 28 February 2021).
- Energinet. Retningslinjer for Nettoafregning af Egenproducenter under Engrosmodellen. V 2.1, April 2016. Available online: https://energinet.dk/-/media/Energinet/El-RGD/El-CSI/Dokumenter/Data/Retningslinjer-for-nettoafregning-af-egenproducenter-under-Engrosmodellen-juni-2016.pdf (accessed on 28 February 2021).
- Energistyrelsen. Vejledning om Beregning af Nettoafregning og opgørelse af Egenproducentens Køb og Salg af Elektricitet på Elmarkedet. December 2018. Available online: https://ens.dk/sites/ens.dk/files/Stoette_vedvarende_energi/energistyrelsens_vejledning_om_beregning_af_nettoafregning_og_opgoerelse_.pdf (accessed on 28 February 2021).
- Ministry of Climate, Energy and Supply. BEK Nr. 100 of January 29, 2019. Bekendtgørelse om Fritagelse for Betaling til Dækning af Offentlige Forpligtelser i Medfør af § 8 a og § 8 b i Lov om Elforsyning for Øjebliksforbrug af Elektricitet Produceret på Visse Anlæg Ejet af Egenproducenten. Available online: https://www.retsinformation.dk/eli/lta/2019/100 (accessed on 28 February 2021).
- Energinet. Available online: https://en.energinet.dk/Electricity/Energy-data/System-data (accessed on 28 February 2021).
- Energinet. Vejledning—Standard for Nettoafregningsopsætninger i DataHub; Energinet: Fredericia, Denmark, 2017. [Google Scholar]
- Nord Pool, A.S. Available online: https://www.nordpoolgroup.com/Market-data1/Regulating-Power1/Regulating-Prices1/DK-1/Denmark/?view=table (accessed on 28 February 2021).
- Elpris. Available online: https://elpris.dk/#/article/hvad_bestaar_din_elpris_af (accessed on 28 February 2021).
- Energinet. Available online: https://energinet.dk/El/Elmarkedet/Tariffer (accessed on 28 February 2021).
- Energinet. Available online: https://energinet.dk/El/Elmarkedet/Tariffer/PSO (accessed on 28 February 2021).
- Skattestyrelsen. Available online: https://skat.dk/skat.aspx?oID=2061604&chk=216985&lang=da (accessed on 28 February 2021).
- Ministry of Climate, Energy and Supply. LOV Nr. 1049 of September 12, 2017. Available online: https://www.retsinformation.dk/eli/lta/2017/1049 (accessed on 28 February 2021).
- Skattestyrelsen. Available online: https://skat.dk/skat.aspx?oID=2061608&chk=217272 (accessed on 28 February 2021).
- Skattestyrelsen. Available online: https://skat.dk/skat.aspx?oid=2244622 (accessed on 28 February 2021).
- Joint Research Center of the European Comission. Photovoltaic Geographical Information System (PVGIS). Available online: https://ec.europa.eu/jrc/en/pvgis (accessed on 28 February 2021).
- Andersen, F.M.; Henningsen, G.; Møller, N.F.; Larsen, H.V. Long-Term Projections of the Hourly Electricity Consumption in Danish Municipalities. Energy 2019, 186, 115890. [Google Scholar] [CrossRef] [Green Version]
- Noordpool. Available online: https://www.nordpoolgroup.com/historical-market-data/ (accessed on 28 February 2021).
- European Central Bank. Available online: https://www.ecb.europa.eu/stats/policy_and_exchange_rates/euro_reference_exchange_rates/html/eurofxref-graph-dkk.en.html (accessed on 28 February 2021).
- Eurostat. Electricity Prices for Household Consumers—Bi-Annual Data. Available online: http://appsso.eurostat.ec.europa.eu/nui/show.do?dataset=nrg_pc_204&lang=en (accessed on 28 February 2021).
- Eurostat. Electricity prices for Non-Household Consumers—Bi-Annual Data. Available online: https://appsso.eurostat.ec.europa.eu/nui/show.do?dataset=nrg_pc_205&lang=en (accessed on 28 February 2021).
- Katz, J.; Kitzing, L.; Schröder, S.T.; Andersen, F.M.; Morthorst, P.E.; Stryg, M. Household electricity consumers’ incentive to choose dynamic pricing under different taxation schemes. WIREs Energy Environ. 2018, 7, e270. [Google Scholar] [CrossRef] [Green Version]
- Albertsen, L.H.; Andersen, M.; Boscán, L.R.; Santos, A.Q. Implementing dynamic electricity taxation in Denmark. Energy Policy 2020, 143, 111543. [Google Scholar] [CrossRef]
- Dansk Energi. Afregning for Individuelle Solcelleanlæg. August 2018. Available online: https://www.danskenergi.dk/sites/danskenergi.dk/files/media/dokumenter/2018-08/Afregning_individuelle_solcelleanlaeg_aug2018.pdf (accessed on 28 February 2021).
- IRENA. Renewable Power Generation Costs in 2019. Abu Dhabi. 2020. Available online: https://www.irena.org/-/media/Files/IRENA/Agency/Publication/2020/Jun/IRENA_Power_Generation_Costs_2019.pdf (accessed on 28 February 2021).
- Energistyrelsen. Analyse af Tidssvarende Udbygning med Solceller under Hensyn til Gældende EU-Regulering. December 2020. Available online: https://ens.dk/sites/ens.dk/files/Sol/analyse_af_tidssvarende_udbygning_med_solceller_under_hensyn_til_gaeldende_eu-regulering_-_december_2020.pdf (accessed on 28 February 2021).
- Radius Elnet A/S. Metode til Fastlæggelse af Netabonnementer og Nettariffer Pr. 1. April 2016. Available online: https://radiuselnet.dk/wp-content/uploads/El_Metode_til_fastl%C3%A6ggelse_af_netabonnementer_og_nettariffer_1_april_2016.pdf (accessed on 28 February 2021).
- Radius Elnet A/S. Se Nettariffer, Netabonnement og Tidsopdeling Gældende fra den 1. January 2021. Available online: https://radiuselnet.dk/wp-content/uploads/El_Nettariffer_netabonnement_og_tidsopdeling.pdf (accessed on 28 February 2021).


| Connection Type | Rated Power [kW] | Electricity Sold | |
|---|---|---|---|
| Group 1: All | Group 2: Surplus | ||
| Installation-connected | <= 50 | ✓ | ✓ |
| > 50 | ✓ | ✓ | |
| Direct-connected | <= 50 | ✗ | ✗ |
| > 50 | ✓ | ✓ | |
| Metering Point | Connection Type | Group | Definition |
|---|---|---|---|
| NFN (Net from Network) | Direct-connected | 1 | |
| 2 | |||
| Installation-connected | 1 | ||
| 2 | |||
| NTN (Net to Network) | Direct-connected | 1 | |
| 2 | |||
| Installation-connected | 1 | ||
| 2 | |||
| BF (Total Consumption) | Direct-connected | 1 | |
| 2 | |||
| Installation-connected | 1 | ||
| 2 | |||
| EP (Self-Consumption) | Direct-connected | 1 | |
| 2 | |||
| Installation-connected | 1 | ||
| 2 | |||
| RH (Availability Payment) | Direct-connected | 1 | - |
| 2 | |||
| Installation-connected | 1 | ||
| 2 | |||
| CMP (Consumption Metering Point) | Direct-connected | 1 | BF |
| 2 | NFN | ||
| Installation-connected | 1 | BF | |
| 2 | NFN | ||
| PMP(Production Metering Point) | Direct-connected | 1 | |
| 2 | NTN | ||
| Installation-connected | 1 | ||
| 2 | NTN |
| Metering Point | Connection Type | Group | Main Billing Concepts per Unit of Energy [c€/kWh] | ||||||||||
|---|---|---|---|---|---|---|---|---|---|---|---|---|---|
| Market Price | DSO Grid Tariff | Availability Tariff | TSO Grid Tariff | TSO System Tariff | Balance Consumption Tariff | Balance Production Tariff | Feed-in Tariff | PSO Tariff | Reduced PSO Tariff | Electricity Tax | |||
| M0+M3 | Direct | 1 | ✓ | ✓ | |||||||||
| 2 | ✓ | ✓ | |||||||||||
| M3 | Installation | 1 | ✓ | ✓ | |||||||||
| 2 | ✓ | ✓ | |||||||||||
| CMP | Direct | 1 | ✓ | ✓ | |||||||||
| 2 | ✓ | ✓ | |||||||||||
| Installation | 1 | ✓ | ✓ | ||||||||||
| 2 | ✓ | ✓ | |||||||||||
| PMP | Direct | 1 | ✓ | ✓ | |||||||||
| 2 | ✓ | ✓ | |||||||||||
| Installation | 1 | ✓ | ✓ | ||||||||||
| 2 | ✓ | ✓ | |||||||||||
| NFN | Direct | 1 | ✓ | ✓ | ✓ | ||||||||
| 2 | ✓ | ✓ | ✓ | ||||||||||
| Installation | 1 | ✓ | ✓ | ✓ | ✓ * | ||||||||
| 2 | ✓ | ✓ | ✓ | ✓ * | |||||||||
| NTN | Direct | 1 | ✓ | ||||||||||
| 2 | ✓ | ||||||||||||
| Installation | 1 | ✓ | |||||||||||
| 2 | ✓ | ||||||||||||
| EP | Direct | 1 | ✓ | ||||||||||
| 2 | ✓ | ||||||||||||
| Installation | 1 | ✓ | |||||||||||
| 2 | ✓ | ||||||||||||
| RH | Direct | 1 | |||||||||||
| 2 | |||||||||||||
| Installation | 1 | ✓ | |||||||||||
| 2 | ✓ | ||||||||||||
| Tariffs and Taxes [c€/kWh] | Q1 | Q2 | Q3 | Q4 |
| Consumption supplier tariff | 1.34 | 1.34 | 1.34 | 1.34 |
| Production supplier tariff | 0.13 | 0.13 | 0.13 | 0.13 |
| Low DSO grid tariff (C level) | 3.47 | 3.47 | 3.38 | 3.47 |
| Peak* DSO grid tariff (C level) | 8.95 | - | - | 8.95 |
| Availability tariff | 3.17 | 3.17 | 3.17 | 3.17 |
| TSO grid tariff | 0.59 | 0.59 | 0.59 | 0.59 |
| TSO system tariff | 0.48 | 0.48 | 0.48 | 0.48 |
| Balance consumption tariff | 0.022 | 0.022 | 0.022 | 0.022 |
| Balance production tariff | 0.012 | 0.012 | 0.012 | 0.012 |
| Feed-in tariff | 0.04 | 0.04 | 0.04 | 0.04 |
| PSO tax | 0.83 | 0.28 | 0.00 | 1.02 |
| Reduced PSO tax | 0.00 | 0.00 | 0.00 | 0.300.04 |
| Electricity tax | 11.85 | 11.85 | 11.85 | 11.85 |
| Subscriptions [€/month] | Q1 | Q2 | Q3 | Q4 |
| Consumption supplier subscription | 2.68 | 2.68 | 2.68 | 2.68 |
| DSO subscriptions (for M3/M2 and M1) | 6.70 | 6.70 | 6.70 | 6.70 |
| VAT [%] | 25.00 | 25.00 | 25.00 | 25.00 |
| Data [kWh] | Generation: 18.17 | Main Consumption: 20.10 | Auxiliary Consumption: 0.05 | ||
|---|---|---|---|---|---|
| Connection Type | Direct-Connected | Installation-Connected | |||
| Group | 1 | 2 | 1 | 2 | |
| Metering Point [kWh] | |||||
| 0.00 | 0.00 | - | - | ||
| 17.99 | 17.99 | 17.99 | 17.99 | ||
| - | - | 0.48 | 0.48 | ||
| 20.10 | 20.10 | 2.58 | 2.58 | ||
| NFN | 2.11 | 2.11 | 2.11 | 2.11 | |
| NTN | 0.00 | 0.00 | 0.00 | 0.00 | |
| BF | 20.10 | 20.10 | 20.10 | 20.10 | |
| EP | 17.99 | 17.99 | 17.99 | 17.99 | |
| RH | - | - | 17.51 | 17.51 | |
| CMP | 20.10 | 2.11 | 20.10 | 2.11 | |
| PMP | 17.99 | 0.00 | 17.99 | 0.00 | |
| Impact of the Several Tariffs and Taxes on the Total Electricity Cost | |
|---|---|
| Different for all schemes | Electricity tax, VAT |
| Connection type dependent | DSO grid tariff, availability tariff, Electricity tax * |
| Group dependent | Electricity price, (eventually supplier surcharge), balance consumption/production tariffs |
| Equal for all schemes | TSO grid tariff, TSO system tariff, feed-in tariff, PSO tariff, reduced PSO tariff |
Publisher’s Note: MDPI stays neutral with regard to jurisdictional claims in published maps and institutional affiliations. |
© 2021 by the authors. Licensee MDPI, Basel, Switzerland. This article is an open access article distributed under the terms and conditions of the Creative Commons Attribution (CC BY) license (https://creativecommons.org/licenses/by/4.0/).
Share and Cite
Martín, H.; de la Hoz, J.; Aliana, A.; Coronas, S.; Matas, J. Analysis of the Net Metering Schemes for PV Self-Consumption in Denmark. Energies 2021, 14, 1990. https://doi.org/10.3390/en14071990
Martín H, de la Hoz J, Aliana A, Coronas S, Matas J. Analysis of the Net Metering Schemes for PV Self-Consumption in Denmark. Energies. 2021; 14(7):1990. https://doi.org/10.3390/en14071990
Chicago/Turabian StyleMartín, Helena, Jordi de la Hoz, Arnau Aliana, Sergio Coronas, and José Matas. 2021. "Analysis of the Net Metering Schemes for PV Self-Consumption in Denmark" Energies 14, no. 7: 1990. https://doi.org/10.3390/en14071990