Article

The Changes in Thermal Transmittance of Window Insulating Glass Units Depending on Outdoor Temperatures in Cold Climate Countries

Institute of Architecture and Construction, Kaunas University of Technology, Tunelio st. 60, LT-44405 Kaunas, Lithuania
*
Author to whom correspondence should be addressed.
Energies 2021, 14(6), 1694; https://doi.org/10.3390/en14061694
Submission received: 20 February 2021 / Revised: 13 March 2021 / Accepted: 15 March 2021 / Published: 18 March 2021

Abstract

:
Windows, which have a U-value that is governed by an insulating glass unit (IGU) U-value, must be a building’s only enclosure element, which has no design value concept. The declared U-value, which is calculated or measured with 0 °C of external ambient temperature, is used instead of the design value. For most of a building’s elements, its thermal transmittance with a decrease in the external temperature diminishes a little, i.e., improves. However, for modern window IGUs with Low-E coatings, it is the opposite: the thermal transmittance with a lowering external temperature increases. Therefore, for calculating the peak power for the heating of buildings it is necessary to pay attention to this phenomenon and, therefore, it would be wise to introduce the concept of design U-value for windows, recalculation rules, or affix their declared U-values. This is especially the case in modern times with the prevailing architectural tendencies for enlargement of transparent building elements. For IGUs with Low-E coatings and inert gas fillers, the thermal transmittance depends on the temperature difference between warm and cold environments. When the external temperature is −30 °C instead of 0 °C, the thermal transmittance of the IGU can increase by up to 35%. This study presents the thermal properties of windows’ IGUs depending on the changes in outdoor temperatures by using guarded a hot box climate chamber and presents the proposed simplified methodology for determining the thermal properties of windows’ glass units. The accuracy of the composed simplified methods, comparing the calculated thermal transmittances of IGUs with those measured in the “hot box”, were up to 1.25%.

1. Introduction

With rising energy prices and declining natural resources, increasing attention is being paid to reducing energy consumption in buildings. Buildings consume approximately 40% of the European Union’s total energy consumption, which has led to the growing discussion on reducing the energy consumption of buildings. In accordance with the requirements of EU Directive 2010/31/EU [1], energy consumption in buildings must be significantly reduced. There is a great potential for energy savings in modern residential and office buildings, and the energy performance of a building depends on the structures of a building’s envelope. Windows are one of the most sensitive parts of a building’s enclosure in terms of thermal transmission between interior and exterior. Changes in architectural trends have shown that the number and dimensions of windows in buildings are increasing. Due to the fact of an increase in the area of transparent enclosures, buildings become spacious, cozy, with more daylight. However, the research shows that the optimal wall–window ratio (WWR) is 25%—as the WWR ratio increases, the need for heating and cooling in a building increases too [2,3].
In addition, due to the increasing dimensions of windows, the area of insulating glass units (IGUs) is increasing too. Since, in most cases, the thermal transmittance (U-value) of IGUs is lower than the thermal transmittance of window frames, the U-value of an entire window decreases with the increment in the glazing area and, therefore, the importance of IGUs concerning the building’s heat loss increases. As the temperature difference between outdoor and indoor increases, the thermal properties of the glazing usually deteriorate; thus, during the cold season, the heat loss through glazing areas increases significantly, and the calculated peak power for heating loss, declared window U-values, may be insufficient due to the large glazing areas.
When assessing the energy performance of an entire building, windows are one of the main components in a cold climate zone, resulting in the loss of approximately 20–40% of the total energy used to heat a building [4]. Therefore, making accurate assessments of their thermal properties is particularly important. During cold periods, not only are large solar energy flows available through windows, reducing the heat loss of a building, but also the increased demand for cooling during warm periods results in lower energy performances of the building.
When designing a building, it is necessary to take into account not only the thermal properties of windows, the amount of selective coatings of IGUs, but also the orientation of windows in relation to the world, glazing areas, and direct sunlight protection measures [5,6,7].
In order to assess the correct thermal transmission through transparent enclosures, the study carried out in this work attempted to determine the dependence of window glazing thermal transmittance values from external temperatures. This would allow for the assessment of a possible decrement of U-values of windows due to the fact of their lower external temperatures. These dependencies can be used in the future to determine the peak heating power needs of buildings at critical negative temperatures in cold climate zones.

2. Literature Review

2.1. Dependence of Total Window Thermal Transmittance on IGUs

Some authors have carried out interesting works in relation to the evaluation of the thermal transmittance of windows. In order to reduce heat loss through windows, there are several methods that can be used such as optimizing the air layer thickness of double-pane windows, filling the cavity between panes with an inert gas or aerogel, evacuating the cavity, coating the pane’s surface with low emissivity coatings or solar selective coatings, as well as simultaneously applying some of these methods.
M. Arici [8] analyzed flow and heat transfer in double, triple, and quadruple pane windows. The importance of parameters on the heat loss through windows was found, such as number of panes, emissivity of glass surface, and gap width.
It has been shown that the thermal properties of IGUs improve with an increasing amount of glass panes. Jelle et al. [9] conducted a state-of-the-art review on high- performance fenestration products, ranging from glazing to spacers, frames, etc. The analysis has shown that today, the most common glazing that provides a low U-value is triple glazing [8,9]. With multilayer glazing, generally, the lower the U-value, the lower the visible solar transmittance; this is due to the presence of several glass and coating layers in triple-glazed products.
With the change in the number of glass panes in the IGU, the distance between them may also change [10]. M. Arici says the effect of the gap width on the energy saving is more noticeable for low temperature differences. The radiation component of heat transfer increases as gap width increases and decreases as temperature difference increases. However, it is almost independent from the number of panes [9]. Studies conducted by T. G. S. Lago say that the optimum spacing between the glass sheets is about 0.025 m. This distance is very important for the design and manufacture of the ventilated double glass window [11].
The space between glass panes can, instead of air, be filled with argon, krypton, xenon, and other gases or PCM [9,12]. The lowest U-value of glazing is obtained with xenon and krypton gases, but these gases are expensive and therefore rarely used. The most common filler is argon. Windows using aerogels and without Low-E coatings can already produce better thermal insulation than triple-glazed, Low-E windows, although visible transmittance is also an issue for aerogels [13].
In order to improve the thermal performance of windows, glass panes from inside can be covered with Low-E coatings, which also have some drawbacks when applied in high-performance glazing products as they reduce visible transmittance and reflect solar energy. A. A. Lechowska [14] determined the solution of covering PVC surfaces with a low-emissivity coating can reduce window frame thermal transmittance by about 28%. The air gap filling with polyurethane foam in window frames can reduce window frame thermal transmittance by about 27%.
Several studies are made about edge seals in IGU. It is clear that edge seal thermal performance has a significant effect on the U-value. According to the authors non-metal spacers are the most promising future approach for window spacer designs [13,15].
The thermal properties of windows listed above may vary depending on the outdoor ambient temperature. Due to the different outdoor ambient temperatures, the theoretical (i.e., calculated) and actual values of energy consumption in buildings differ. For many building materials, thermal conductance varies slightly depending on temperature. It has a tendency to lower with the lowering of a mean temperature of a material. This can be applied to many materials, but not when heat exchange takes place in the gas spaces, especially if the surfaces surrounding them are covered with Low-E coatings. This is relevant for modern IGUs with infrared (IR) Low-E coatings. Heat exchange in the gas spaces of an IGU takes place by convection and radiation. These parameters depend on the temperature difference and the absolute temperatures of those surfaces. IGUs are an integral part of windows, so both the temperature itself and the temperature differences are important for heat exchange over the entire window area.

2.2. Conditions for Determining the Thermal Characteristics of Windows in Cold Climate Countries

Although Europe has uniform standards for the calculation of the energy characteristics of buildings, the climate parameters of European countries are very different. Thus, products or structures suitable for one country may not be suitable for use in other countries due to the climate differences. This problem is also faced by the Organization of Passive Houses that states that a passive building can be built in countries with different climates by applying appropriate design solutions including windows [16,17].
In Europe, the thermal characteristics of windows are calculated according to EN ISO 10077-1 [18] and EN ISO 10077-2 [19], and measured according to EN ISO 12567-1 [20]. According to the requirements of these standards, both calculations and measurements are performed under the same ambient conditions with an outdoor temperature of 0 °C and an indoor temperature of + 20 °C.
In North America, the conditions for determining the thermal insulation properties of windows are regulated by the NFRC (National Fenestration Rating Council) window assessment methodology, in China by the Design standard for energy efficiency of residential buildings. The heat transfer coefficient (thermal transmittance) is determined at ambient temperatures of −18 °C and 21 °C in North America, −20 °C and 20 °C in China [21]. Comparing the methodologies for determining the U-values of North American, Chinese, and European windows, the values measured at different standard ambient temperatures differ up to 25% [16]. The source also mentions that the outdoor temperature of 0 °C chosen by European standards is more in line with the conditions for calculating the annual heat loss of the building, but −18 °C, the outdoor air temperature chosen by the North American standards, is more in line with the conditions for calculating a peak thermal energy needs for heating a building under extreme (low) outdoor temperatures. Another disadvantage of these methodologies is that there are no easy possibilities to compare products in different countries when their declared thermal properties are determined according to different methodologies. The declared thermal insulation properties of materials according to ISO 10456:2007 [22] are determined at a mean temperature of + 10 °C with a temperature difference between 0 °C and + 20 °C. Similar measurement conditions are also provided for the determination of the thermal transmittance for windows, measured in accordance with EN ISO 12567-1:2010 and calculated in accordance with EN ISO 10077-1:2017 and EN ISO 10077-2:2017. In order for better assessment of energy needs for heating of buildings, European directives have required calculations to be made not for the whole cold (heating) season of the year, but for individual months. As a result, the temperature difference in the calculations through windows from a constant 20 °C becomes different for each month: In autumn and spring months, this difference is smaller, and in winter months, larger.

3. Methodology

The framework of this paper methodology is as follows:
Energies 14 01694 i001

3.1. Measurements of the U-Value of an IGU (of a Window) in a GHB

On the basis of a literature review, laboratory tests were carried out on the change in the value of the window’s U-value in a guarded hot box (GHB), changing the temperature of the ambience on the cold side of the sample, in order to verify the detailed (standard EN 673) calculation methodology of U-values of IGU under different external temperatures. During the test, the U-value of the central part of the IGU was measured with a heat flow density meter and differential T-type thermocouple (Figure 1).
The basis of the hot box method is the measurement, at steady-state conditions, of the heat flux through the building components and the corresponding temperature differences across it. This method can be applied for the thermal characterization of homogeneous or non-homogeneous specimens and building structures or composite assemblies (e.g., walls with windows, doors). The GHB apparatus was used in several studies to evaluate the U-value of different construction elements, for instance, in References [23,24,25,26,27]. There were several data acquisition and measurement devices used in the hot box testing: 1. Heat flow density sensor PU 4.3; Institute of applied physics TPD TNO-TH; electrical resistance 1450 Ohm; thermal conductivity of sensor material, 0,25 (W/mK); sensitivity, 6.2 (W/m2·mV), accuracy, 5%; Tmax, 90 °C; 2. Thermocouples: T type, Omega Grade A: TT-T-30, AWG#30; 3. Multimeter for heat flow density and temperature difference measurements in the central area of IGUs: HP34401A; 4. Data acquisition multimeter(s) of guarded hot-box: Keithley 2450, 2 pcs.
Descriptions of the windows measured in the test are given in Table 1.
The temperature on the warm side of the hot box was kept close to + 20 °C, and on the cold side 0 °C, −10 °C, and −14 °C. The choice of the lowest temperature on the cold side was determined by the technical capabilities of the equipment.

3.2. Methodology for Calculating the Thermal Transmittance of the IGU

In order to evaluate the changes in the values of thermal transmittance of IGU caused by outdoor temperatures, calculations were performed by modelling various construction variants of IGU and the differences in temperatures through them. Calculations of the thermal transmittance of IGU were performed according to the standard EN 673 [28], except the Nusselt number, which was determined according to ISO 15099 [29].
The U-value is given by:
1 U = 1 h e + 1 h t + 1 h i
where he and hi are the external and internal heat transfer coefficients; ht is the total thermal conductance of the glazing.
1 h t = 1 N 1 h s + 1 M d j · r j
where hs is the thermal conductance of each gas space; N is the number of spaces; dj is the thickness of each material layer; rj is the thermal resistivity of each material (thermal resistivity of soda lime glass = 1.0 (m·K/W); M is the number of material layers.
hs,k = hr,k + hg,k
where hs,k is the heat transfer of the kth space; hr,k is the radiation conductance; hg,k is the U-value of gas. Radiation conductance hr is given by:
h r = 4 σ ( 1 ε 1 , k + 1 ε 2 , k 1 ) 1 T m , k 3
where σ is the Stefan–Boltzmann constant; Tm,k is the mean absolute temperature of the gas space; ε1,k and ε2,k are the corrected emissivities of the surfaces bounding the enclosed space between the panes at Tm,k. Gas conductance hg is given by:
h g , k = N u ( λ k s k )
where sk is the thickness of the fill gas layer (or pane spacing) k; λk is the thermal conductivity of the fill gas; Nu is the Nusselt number. The Nusselt number for a vertical cavity:
N u = ( N u 1 ,   N u 2 ) m a x N u 1 = 0.067383 R a 1 / 3 , w h e n   5 × 10 4 < R a N u 1 = 0.028154 R a 0 , 4134 , w h e n   10 4 < R a 5 × 10 4 N u 1 = 1 + 1.7596678 × 10 10 R a 2.2984755 , w h e n   R a 10 4 N u 2 = 0 , 242 ( R a A g v , i ) 0 , 272
where Ra is the Rayleigh number. Agv,i—the projected vision area of glazing, m2;
R a = ρ 2 · d 3 · g · β · c p · · T μ · λ
where: β—thermal expansion coefficient of the fill gas, K−1; d—thickness of glazing cavity, m; ρ—density of fill gas, kg/m3; g—acceleration due to gravity, (9.81), m/s2; cp—specific heat capacity at constant pressure of fill gas, J/kg⋅K; Tm—mean temperature fill gas, K; ΔT—temperature drop across the glazing cavity, K; μ—dynamic viscosity of fill gas, kg/(m⋅s); λ—thermal conductivity of fill gas at certain mean temperature, W/(m⋅K);
The same methodology was used in several studies (e.g., [27]). On the basis of the obtained calculation results, the empirical simplified formulas for determination of an IGUs thermal transmittance values in relation to the external (i.e., outdoor) temperature, thermal corrected emissivity of Low-E coatings and thickness of a gas space in the IGU were worked out.

4. Results

4.1. Analysis of the Calculation Results

The measurements of the two windows with double-(No. 2) and triple-glazed (No. 1) IGUs in the GHB showed that as the temperature on the cold side dropped from 0 °C to −14 °C, the U-value of the windows (Uw) increased by approximately 9–10%. The U-values of the central part (Ug) of IGUs were also measured. As the temperature on the cold side dropped from 0 °C to −14 °C, the U-values of IGU increased by approximately 14–15%. ΔT is separately measured with a differential thermocouple (Omega’s grade A thermocouple wire, T type) in the central area of IGU by measuring with the multimeter HP 34401A.
The results of window No. 1’s measurements are presented in Table 2 and the results of window No. 2’s measurements are presented in Table 3, where: Uw—thermal transmittance of window, W/(m2·K); Ug—thermal transmittance of IGU, W/(m2·K); ΔT—temperature differences on the glass unit surfaces, °C.

4.2. Calculation Results of Thermal Transmittance of Different IGUs under Different Negative External Air Temperatures

Based on previous research [30], it was found that the differences in temperature have a small effect on the thermal transmittance of the wooden window frame and the IGU spacer [30]; therefore, further research focused on the insulating glass units and their influence on heat transfer throughout the window.
The thermal characteristics of the IGU depend on the number of glasses, the distance between the glasses, the Low-E coatings, the filling gases, and their concentration.
For the determination of the thermal characteristics of the abovementioned IGUs, a digital modelling of the double and triple glazing was carried out, changing the spaces between the glass panes from 10 mm to 25 mm (10 mm; 12 mm; 14 mm; 16 mm; 18 mm; 20 mm; 25 mm); the corrected emissivity ε of the Low-E coating varied from 0.03 to 0.09 (0.03, 0.04, 0.05, 0.06, 0.08, 0.09); the argon gas concentration ranged from 95% to 60% (60%; 80%; 90%; 95%).
The internal temperature was always + 20 °C, and the external temperature was changed from 0 °C to −30 °C (0 °C; −5 °C; −10 °C; −15 °C; −20 °C; −25 °C; −30 °C). For comparison, calculations were also made for IGUs without Low-E coatings filled with air.
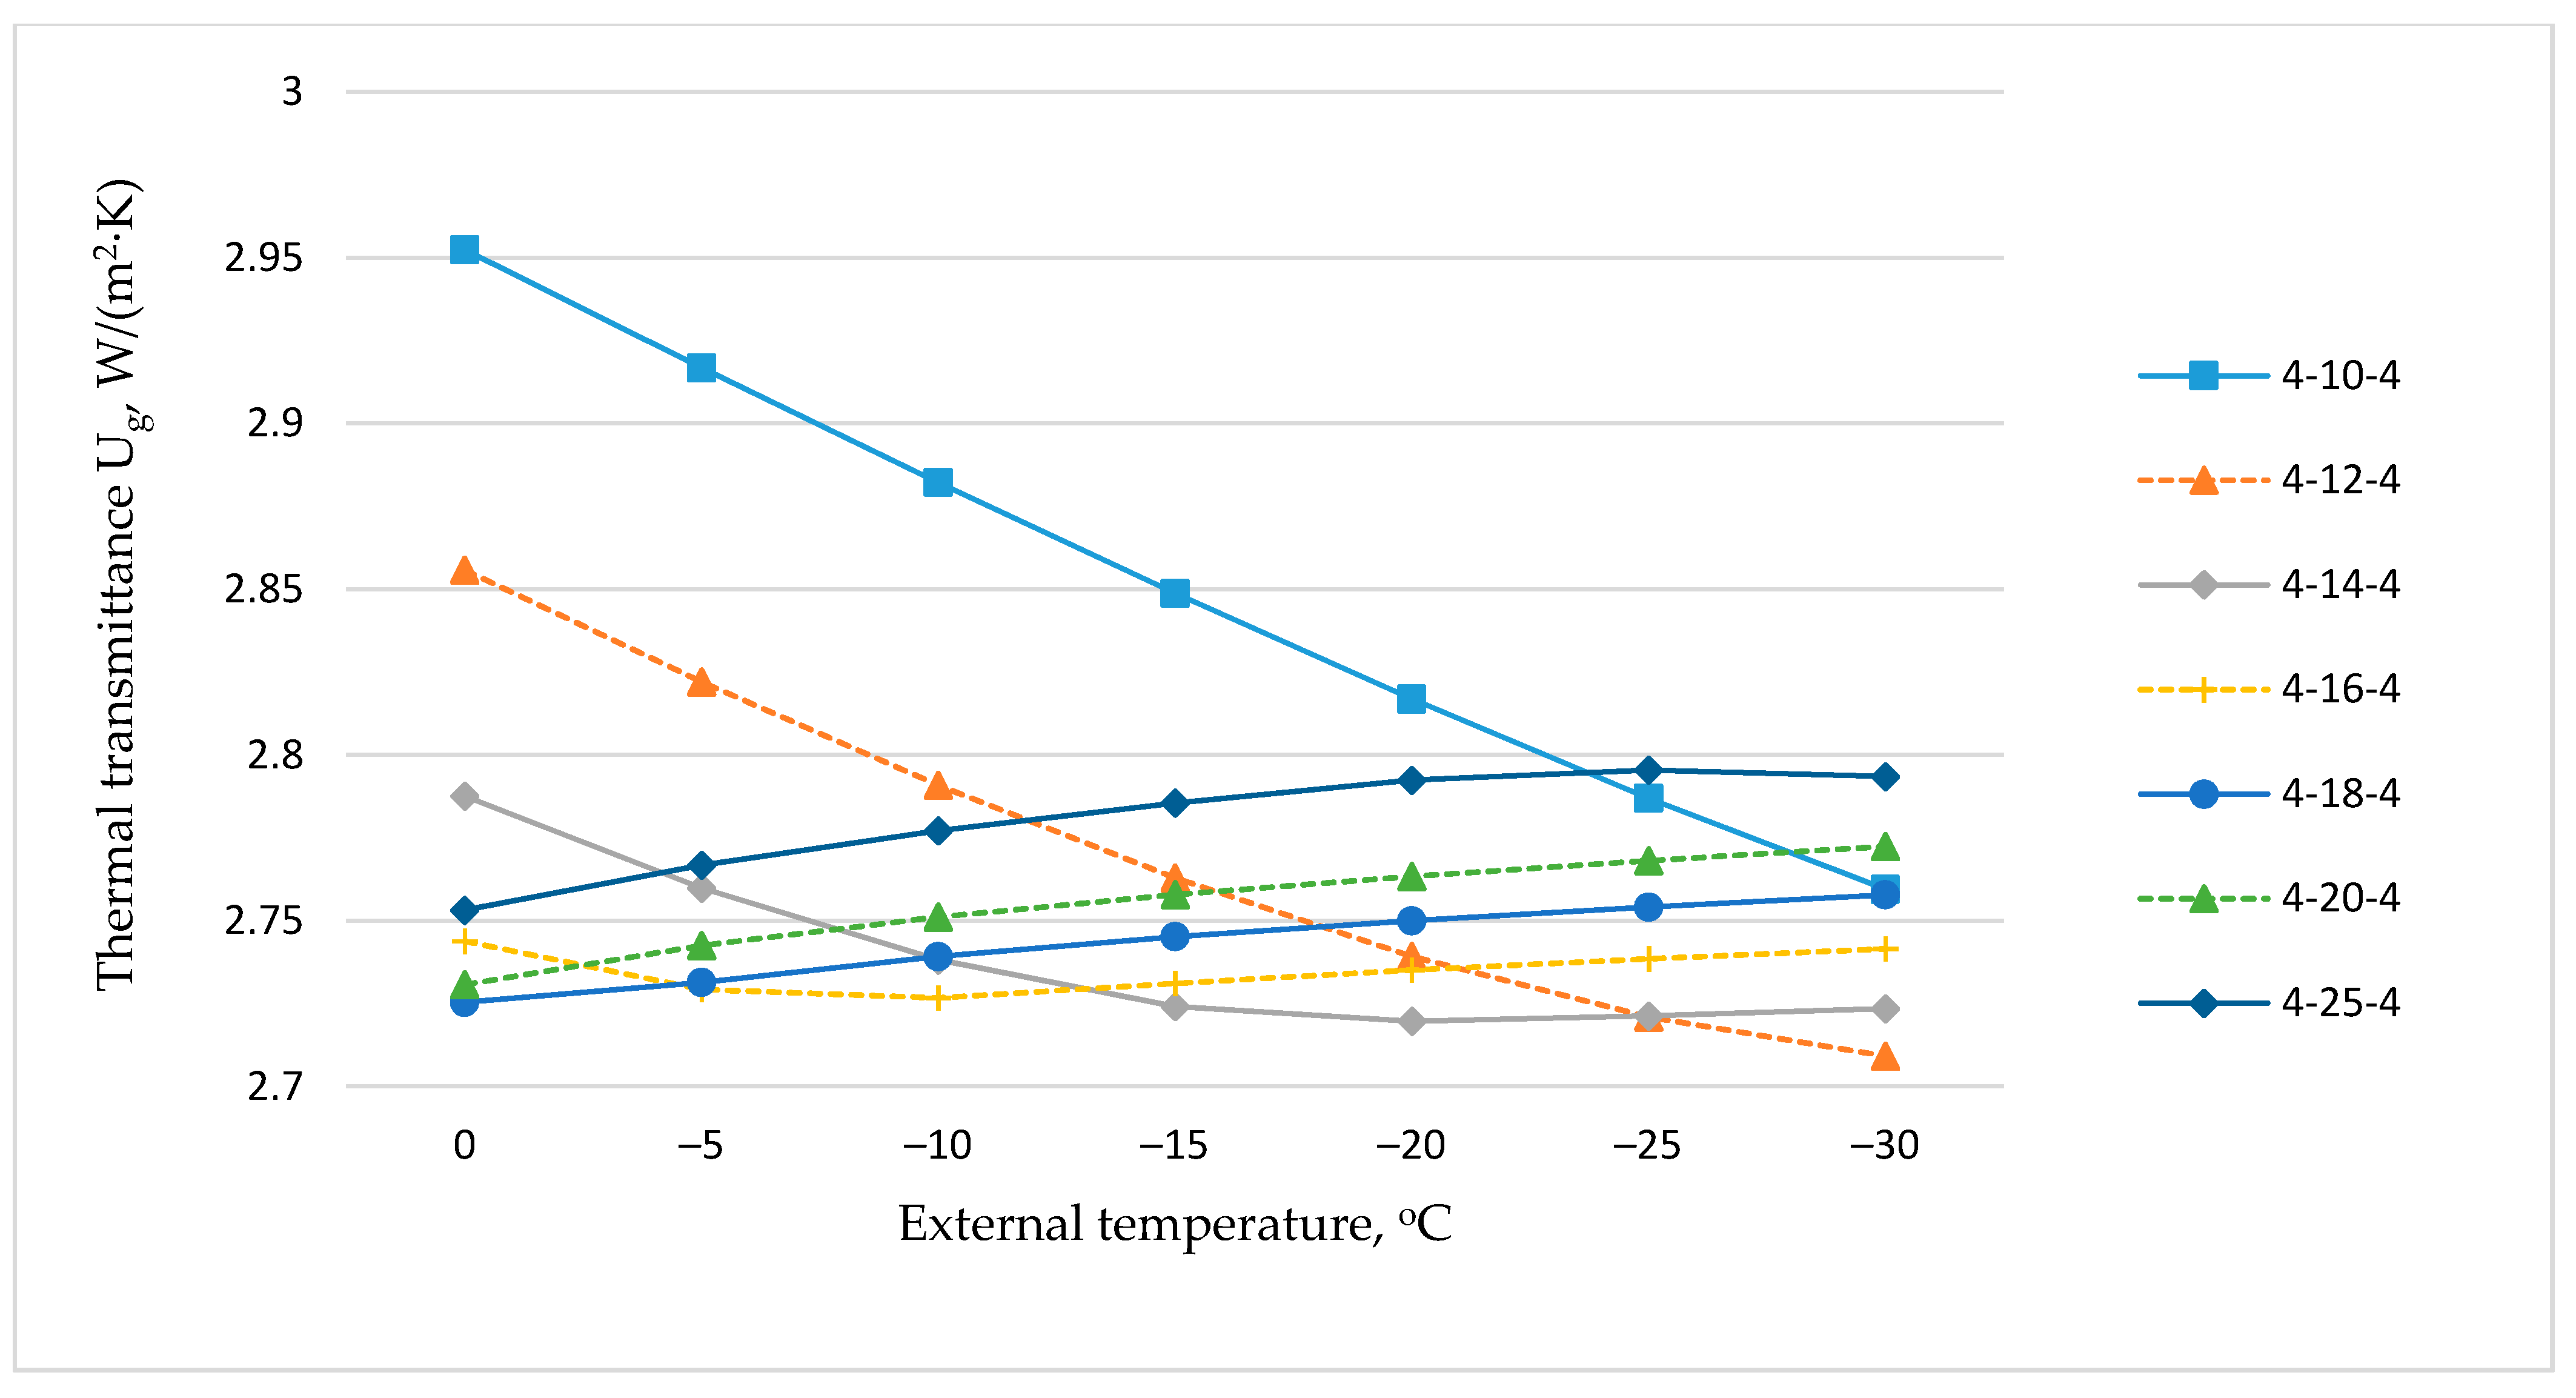
The results of the calculations of the central part of the thermal transmittance Ug, W/(m2·K), for double glazing, depending on external air temperature and the distance between the glasses, when the thermal emissivity of glass surfaces was ε = 0.84 (without Low-E coatings) and there was no gas filler (air), are presented in Figure 2.
The presented data show that with the decrement of external air temperature, the thermal transmittance decreased at small distances between glasses 10 and 12 mm, and at greater distances between glasses, it changed (mainly increased) slightly up to 2%. The decrement of thermal transmittance with the decrease in external air temperature can be considered a positive phenomenon (at extremely low temperatures, there would be lower heat losses), and small changes in the Ug-value may be ignored as insignificant.
These results confirm why the change in the thermal transmittance of IGUs due to external temperatures has been ignored in the past. However, circumstances are changed when IGUs with Low-E coatings and inert gas fillers began to be used in cold climate zones.
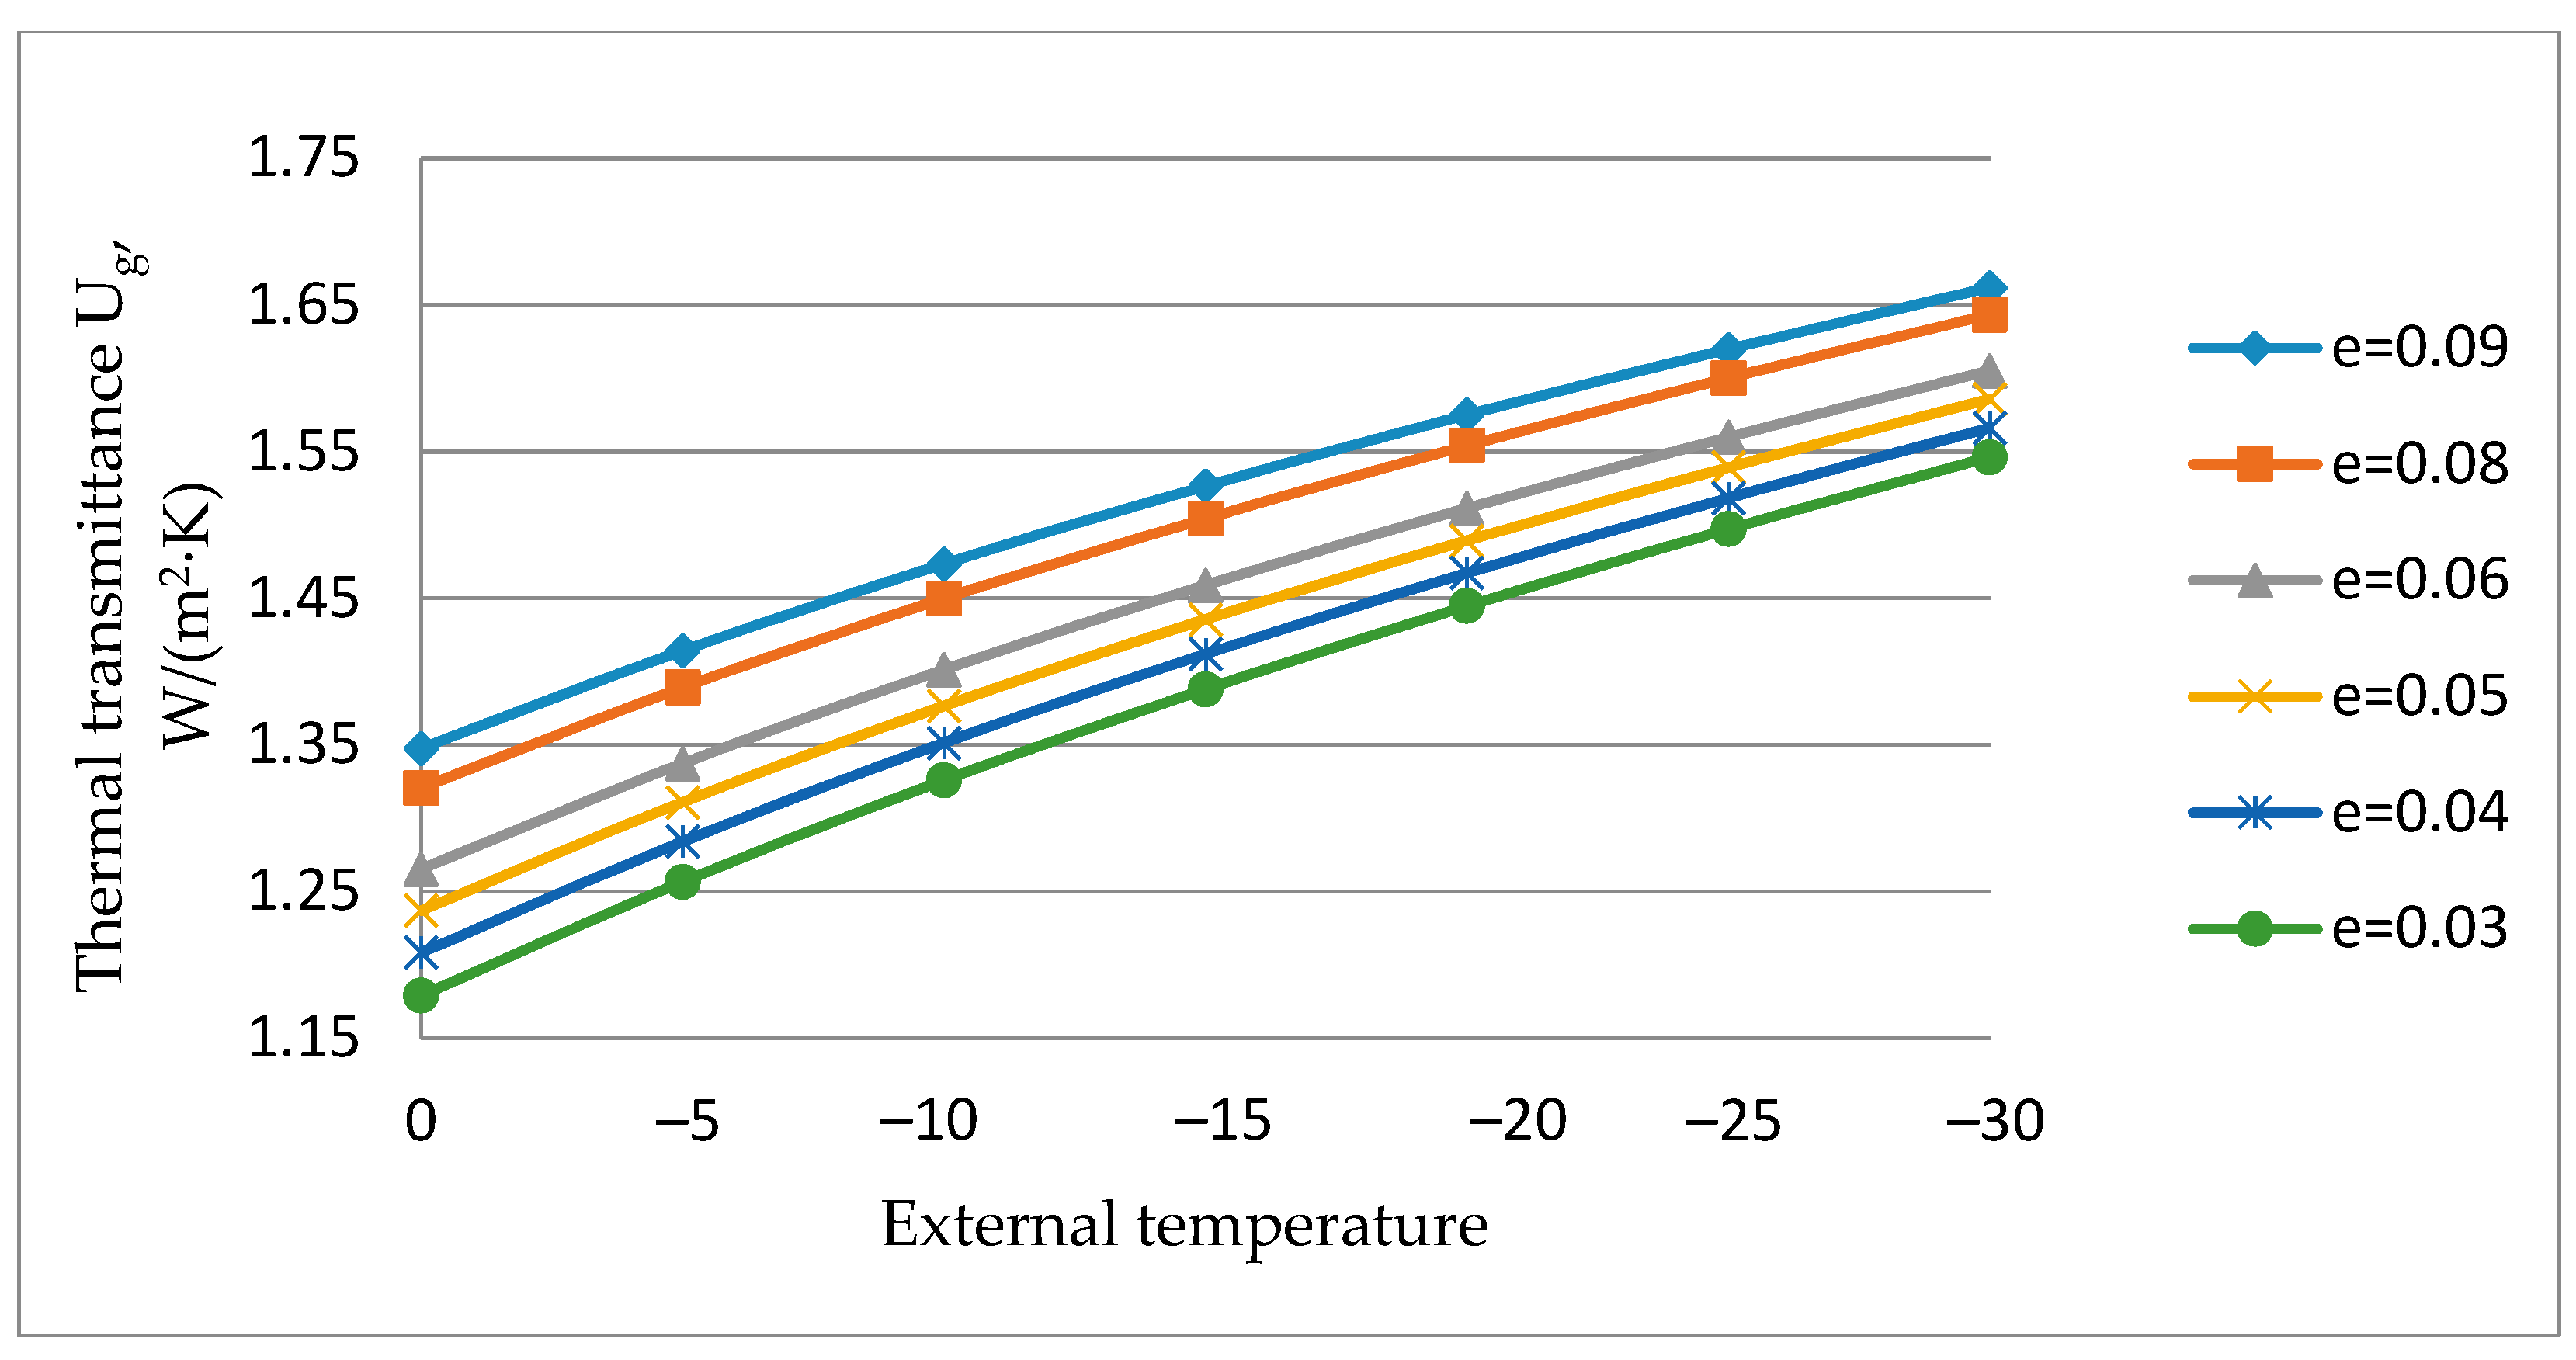
The results of the calculations of the central part of thermal transmittance Ug, W/(m2·K), of the double-glazed IGU, depending on external air temperature and Low-E coating corrected emissivity value ε, and when the distance between glasses was 16 mm and the argon gas was concentration was 95%, are given in Figure 3. The obtained calculation results show that the thermal transmittance value increased rapidly with the drop of the external temperature from 0 °C (standard temperature) to −30 °C (the design temperature for calculating the peak heating power of lightweight construction buildings in Lithuania). When using Low-E coating, ε = 0.04, the Ug of the IGU increased from 1.21 to 1.57 W/(m2·K), i.e., approximately 30%.
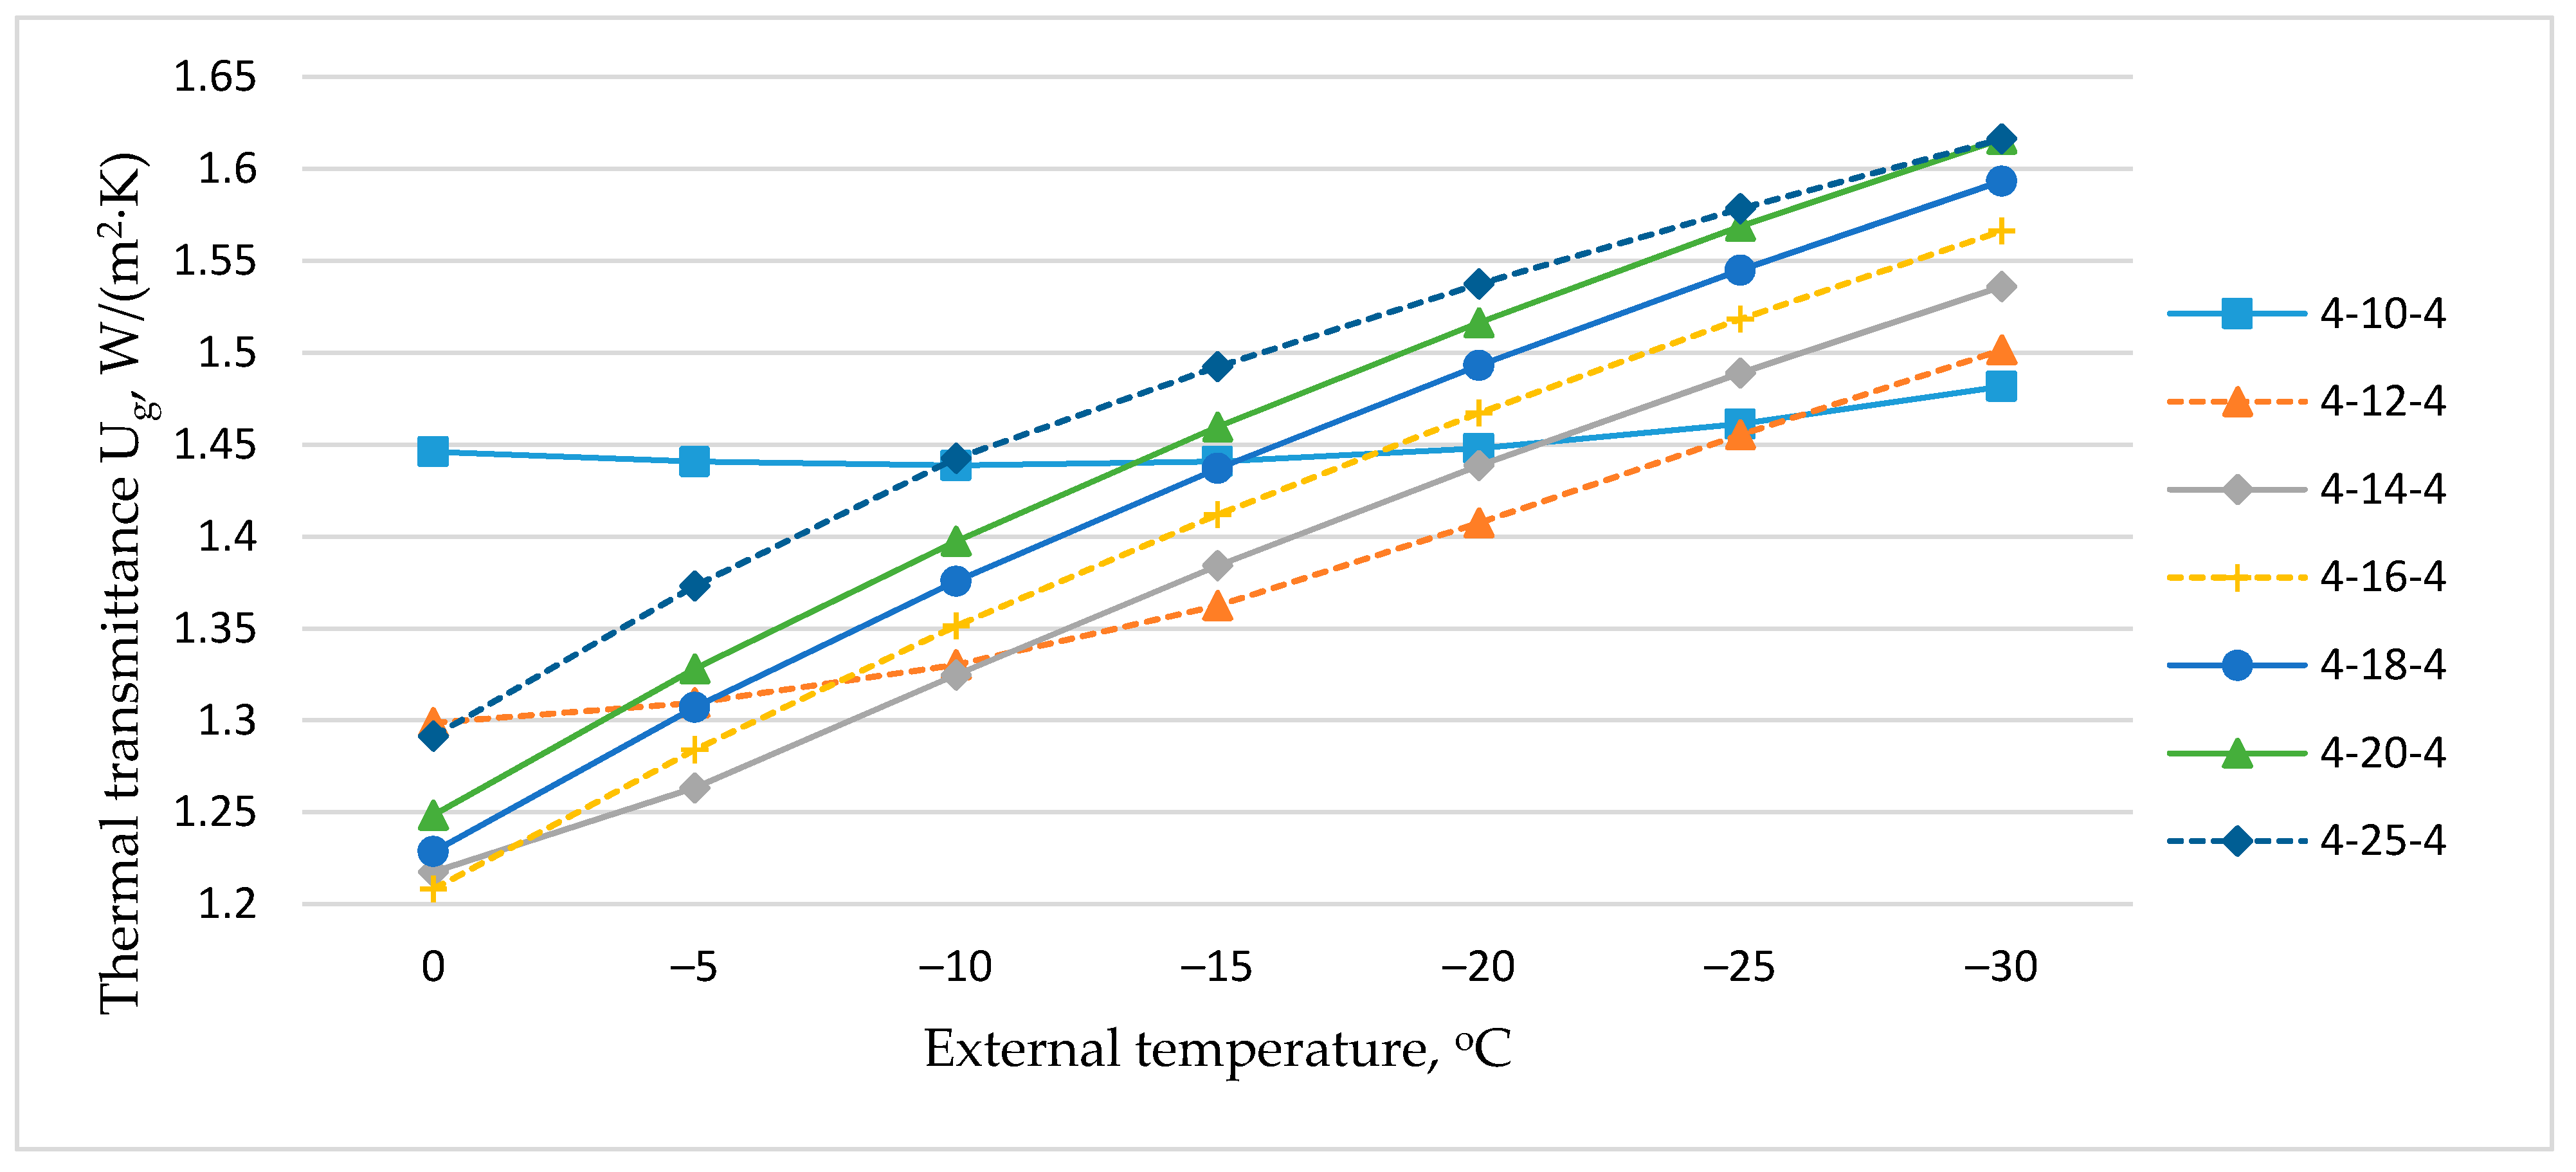
The results of the calculations on the dependence of the Ug-value of the double-glazed IGUs on external air temperature and distance between the panes, when the Low-E coating’s corrected emissivity value was ε = 0.04 and the argon gas concentration was 95%, are presented in Figure 4. This graph shows that the distance between the glasses had a different effect on the increment of thermal transmittance as the external air temperature decreased. When there was a small distance between the panes (10 mm), the value of Ug-value was almost unchangeable, and a small change was also the case with a thickness of 12 mm compared to other instances. The maximum change in the Ug-value occurred when the distance between the panes was 18 mm, then it was close to a 30% increase (from 1.22 W/(m2·K) to 1.59 W/(m2·K)). These results show that when the external air temperature is 0 °C, the lowest Ug-value is given by the IGU with space between panes of 16 mm (Ug = 1.21 W/(m2·K)), and the highest value with a 10 mm distance (Ug = 1.45 W/(m2·K)). Accordingly, when the external temperature dropped to −30 °C, the lowest Ug-value occurred when the distance was 10 mm between the panes (Ug = 1.48 W/(m2·K)), and the highest value was when the distance was 25 mm (Ug = 1.62 W/(m2·K)).
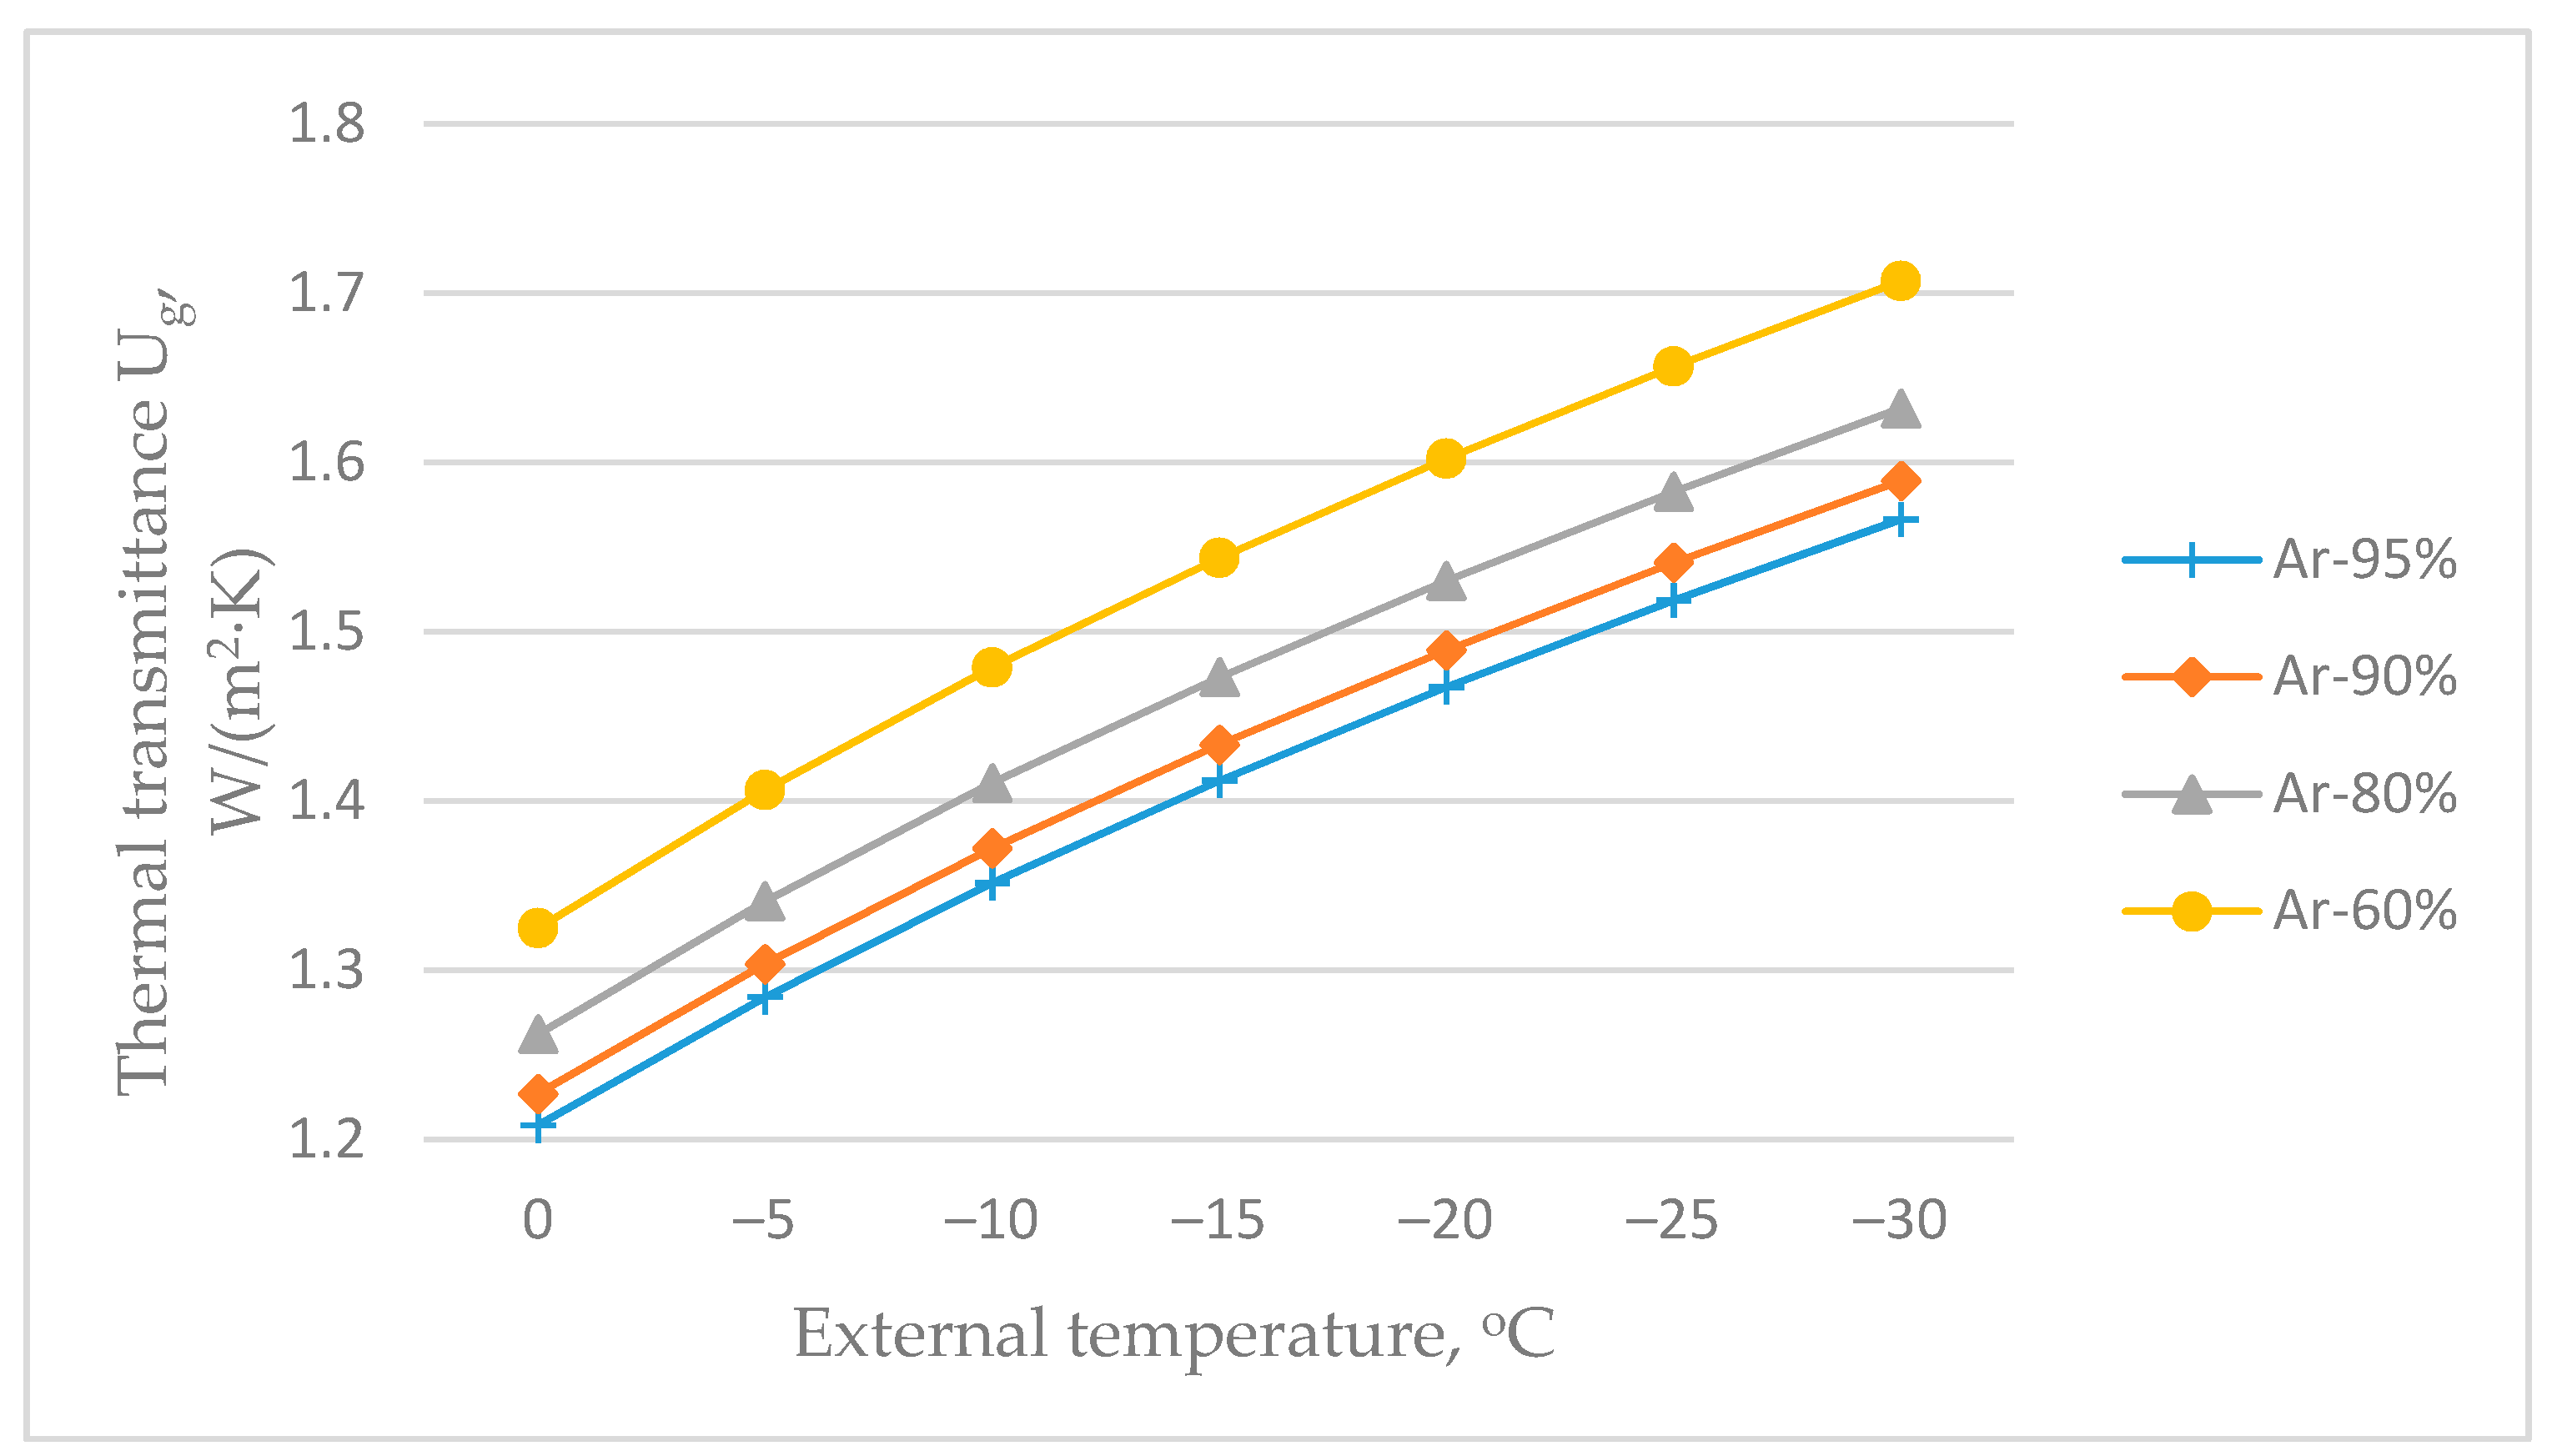
The dependencies of the thermal transmittance (Ug, W/(m2·K)) values of the central part of the double-glazed IGU on the external air temperature and concentration of argon gas fill, when the Low-E coating’s corrected emissivity value was ε = 0.04 and the distance between glasses was 16 mm, are given in Figure 5. The results show that the changes in the concentration of the argon gas fill did not change the dependence tendency of the thermal transmittance value on the external air temperature.
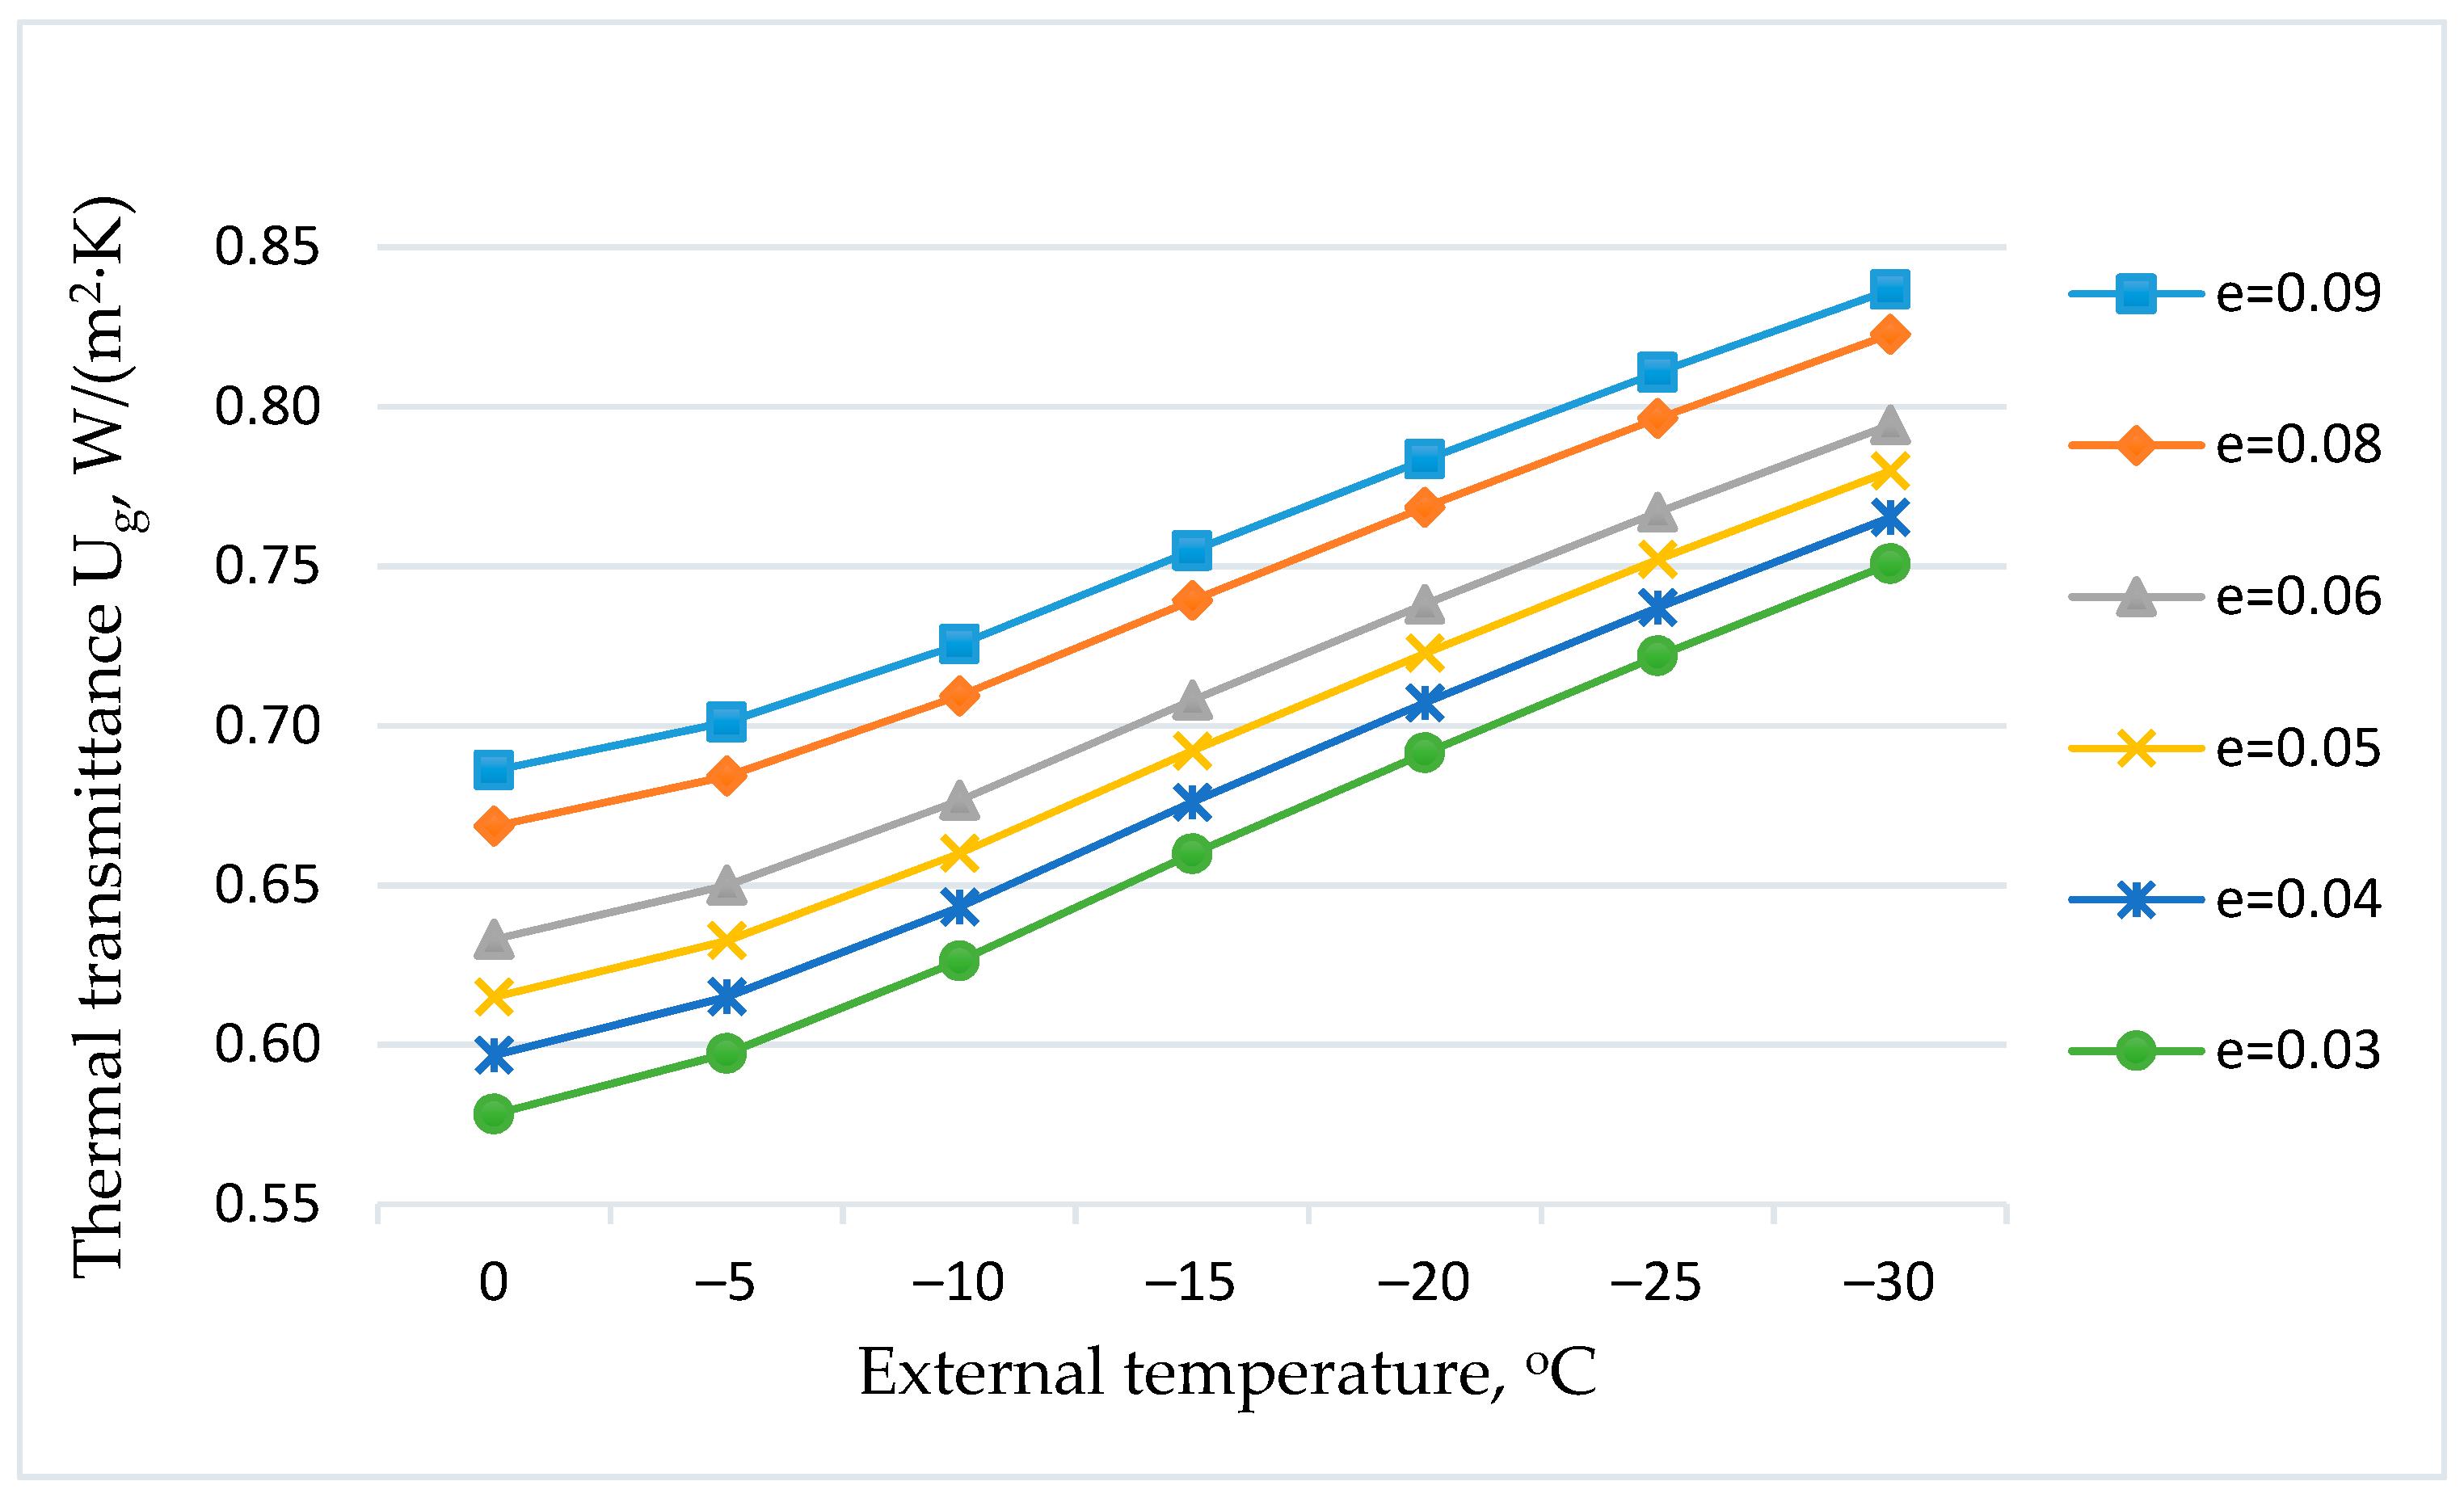
The results of the calculations of dependencies of the thermal transmittance (Ug, W/(m2·K)) values of the central part of the triple-pane IGU on external air temperature and Low-E coating corrected emissivity value ε, when the distance between glass panes was 16 mm and the argon gas fill concentration was 95%, are presented in Figure 6.
The graphs from Figure 6 show that the thermal transmittance increases rapidly with the change in the external air temperature from 0 °C (standard temperature) to −30 °C (design temperature for the calculation of peak heating power in Lithuania for lightweight construction buildings). When the Low-E coating’s value was ε = 0.04, the Ug-value increased from 0.60 to 0.76 W/(m2·K), i.e., close to 27%. Comparing the results presented in Figure 3 and Figure 6, we can see that the dependencies of the change in thermal transmittances of double-glazed and triple-glazed IGUs on the external air temperatures are similar.
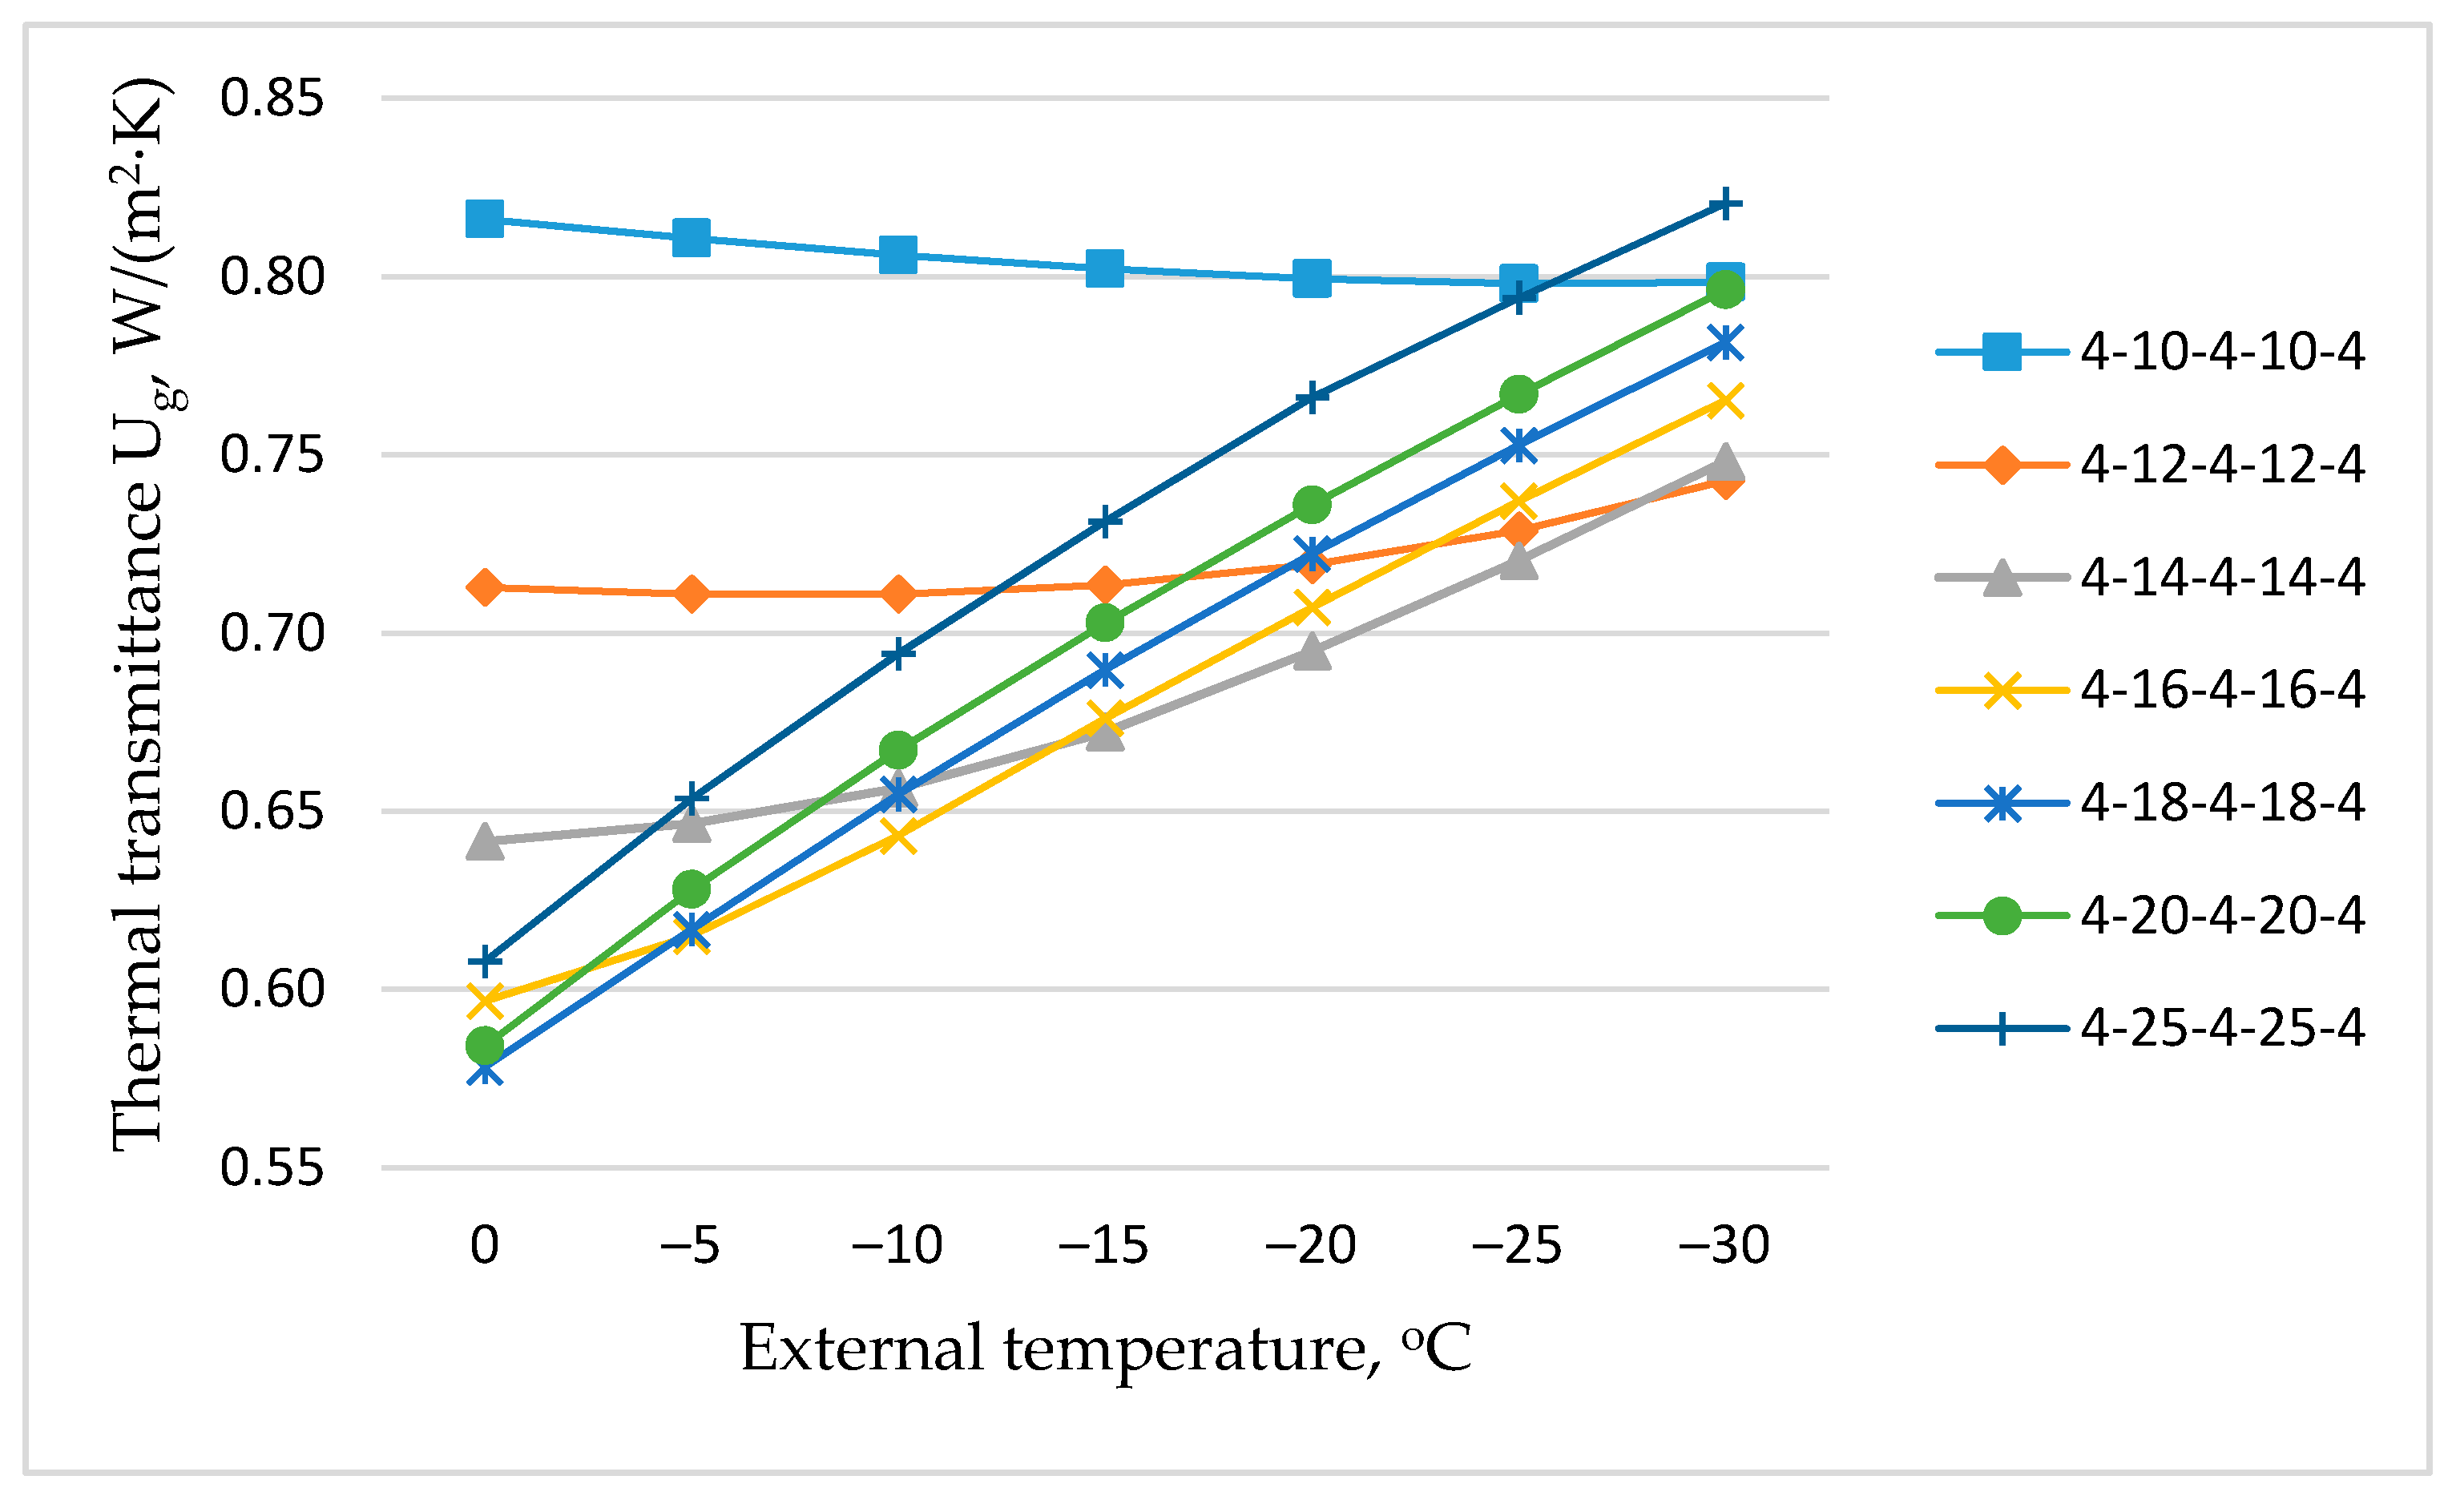
The results of the calculations on the dependence of Ug-values of the triple-glazed IGU on external air temperature and distance between the panes when the Low-E coating was ε = 0.04 and the concentration of argon gas fill was 95% are shown in Figure 7. This graph shows that the distance between the panes influenced differently the increment in the Ug-value as the external air temperature decreases. When there were small distances between the glass panes (10–14 mm), the Ug-value varied slightly. If the distance between the glass panes was 10 mm, the Ug-value even decreased slightly as the external air temperature decreased. The largest change in thermal transmittance value was observed when the distances between the panes were 25 mm, then it increased by approximately 34% (from Ug = 0.61 W/(m2·K) to Ug = 0.82 W/(m2·K)). This graph also shows that when the external temperature was 0 °C °, the lowest Ug-value was for the double-glazed IGUs with an inter-pane gap of 18 mm (Ug = 0.58 W/(m2·K)), and the highest was with 10 mm gaps (Ug = 0.82 W/(m2·K)). Correspondingly, when the external temperature was −30 °C, the lowest value was when the distance between the panes was 12 mm (Ug = 0.75 W/(m2·K)), and the highest was when it was 25 mm (Ug = 0.82 W/(m2·K)).

4.3. Simplified Calculation Method of the Thermal Transmittance of IGUs Dependent on External Air Temperature

One of the objectives of this study was to determine the relationships between the thermal transmittance of IGU and the external air temperature. As the manufacturers of windows and IGUs declare the thermal transmittance values at 0 °C external air temperature according to European standards, lower external temperatures are used for design of a peak heating power of buildings (for example, in Lithuania up to −30 °C). There is a need to know the real (design) U-values of windows and IGUs at low external temperatures, because it can be significantly higher than those declared at 0 °C. Therefore, it may be important for designers to have a simple methodology to perform the recalculations from declared values to design using the real U-values of windows. As we know, the insulated glass units make the determinant impact on U-values of windows. Therefore, the simplified recalculation formulas were developed for double-glazed IGUs, filled with argon gas with one Low-E coating depending on the distance between the glass panes, when it is known that the Ug-value of the double-glazed IGUs are 0 °C (U(0)) and the external air temperature (θe) (Table 4); for triple-glazed IGUs filled with argon gas and two Low-E coatings (Table 5).
The thermal transmittance of the double-glazed IGU is dependent on the external air temperature and distance between the glass panes. The comparisons of the U-value calculations of the IGUs with the Low-E coating’s value of ε = 0.06 and a 90% argon gas fill concentration, using standard methods (EN 673 and ISO 15099) and the developed simplified methods are given in Table 6 for double-glazed and in Table 7 for triple-glazed IGUs.
In order to verify the reliability of the composed simplified methods, the differences of Ug-values were found between the values calculated in accordance with the standard methodology and the values calculated according to the developed simplified recalculation formulas.
Calculation data using the standard methodology and simplified formulas for double-glazed IGU with 16 mm cavity, filled with argon gas and one Low-E coating (4-16Ar-4e), are given in Table 8, and for triple-glazed glass unit with 16mm cavities, filled with argon gas and two Low-E coatings (4e-16Ar-4-16Ar-4e)—in Table 9.
The data in Table 8 and Table 9 show that the simplified recalculation formula did not result in a non-compliance of more than 2.4%.
The comparison of U-values of IGU measured in Hot Box and calculated according to simplified methods are given in Table 10.

5. Discussion

For air-filled IGUs without Low-E coatings, the increment of convective heat transfer in the cavity as the external air temperature decreases is compensated by a decrement in the radiative heat transfer and partly by a decrement in the cavity air’s thermal conductivity. For example, in a double-glazed IGU with an air cavity of 50 mm, when the external air temperature drops from 0 °C to −30 °C, the radiative heat transfer decreases 18%, and the thermal conductivity of the air cavity by 6%. This basically compensates for the 50% increment in convective heat transfer. Therefore, in such an air cavity, the U-value increases very slightly, i.e., only by 0.2%. The radiant part of the heat transfer in such an air cavity under 0 °C of external temperature makes a large part (approximately 67%) of the total heat transfer, and as the external temperature drops to −30 °C, it decreases to approximately 54% of the total heat loss.
For IGUs, 90% filled with argon gas and with Low-E coating’s corrected emissivity, ε ≈ 0.04, the convective component of heat transfer in the cavity of the IGU varies depending on the thickness of the cavity. As the thickness of the cavity increases, so does the convective heat transfer, while the radiant heat transfer remains constant. Convective heat transfer also increases due to the resulting increment in temperature difference as the external air temperature decreases. Thus, the increment of heat loss with the decrease in the external air temperature is determined by the increment in the convective heat transfer as a result of the increase in the temperature difference and distance between the panes. At a 0 °C external temperature, increasing the cavity of IGU from 10 mm to 25 mm, the convective heat transfer increased by 112% and at the external temperature of −30 °C, correspondingly by 185%. Convective heat transfer in the 10 mm cavity increased by only 12% and in the cavity with a 25 mm thickness by 51%, when the external air temperature dropped from 0 °C to −30 °C. Convective heat transfer in the 10 mm cavity at an external air temperature of 0 °C created approximately 1% of total heat loss, but in the 25 mm cavity, it already created approximately 46.7%, i.e., due to the increase in the cavity of the IGU from 10 mm to 25 mm, the convective heat transfer increased approximately more than 6 times. Convective heat transfer in the 10 mm cavity at an external temperature of −30 °C resulted in a 10.3% total heat transfer, and in the 25 mm cavity it resulted in approximately 64%, i.e., due to the increment in the air cavity of the IGU from 10 mm to 25 mm, the convective heat transfer increased approximately 6.2 times. If in small cavities the increment in the convective heat transfer with a decrement in the external temperature is caused by an increment in the temperature difference, in larger cavities, the decisive role is given to the enlargement of the distance between the panes.

6. Conclusions and Recommendations

For IGUs with Low-E coatings and inert gas fillers, the thermal transmittance depends on the temperature difference between warm and cold environments. When the external temperature is −30 °C (extreme temperature for calculating the peak heating power of a building) instead of 0 °C (standard temperature), the thermal transmittance of the IGU can increase by up to 35%.
For IGUs without Low-E coatings and inert gas fillers, where the distances between the panes are small, the dependence of the U-value on external air temperature is insignificant. Such IGUs can be used in warm climate zones, where the possibility of significant drops in external temperatures below 0 °C is less relevant.
The distance between the glass panes has the greatest impact on the thermal transmittance value dependence from the external air temperature change. When there is 10 mm between the glass panes (with argon gas filler), the thermal transmittance dependence on external temperature may be negligible, but at greater distances it begins to increase significantly. The dependence of the U-value of the IGU on the external air temperature with the change in the Low-E coating and argon gas fill concentration values had a similar tendency. Therefore, in order to make the simplified methods for calculating U-values of IGUs dependent on external temperatures, the distance between the panes is considered the main component.
The accuracy of the composed simplified methods, comparing the calculated thermal transmittances of IGUs with those measured in the “hot box” were up to 0.6% for double glazed and up to 1.5% for double glazed IGUs.
Comparing the results calculated according to the simplified recalculation methodology with the calculation results of the standard methodology, non-compliance between the results did not exceed 2.5%.
It is reasonable to introduce the design value concept for windows and IGUs in order to use the correct thermal values when modelling or calculating the building’s heating systems at least in a colder climate zones.

Author Contributions

Conceptualization, K.B.; resources, J.K.; writing—original draft preparation, A.B.; writing—review and editing, J.R.; visualization, V.P.; supervision, K.B. All authors have read and agreed to the published version of the manuscript.

Funding

This research received no external funding.

Institutional Review Board Statement

Not applicable.

Informed Consent Statement

Not applicable.

Data Availability Statement

Data sharing not applicable. No new data were created or analyzed in this study. Data sharing is not applicable to this article.

Conflicts of Interest

The authors declare no conflict of interest.

Abbreviations

WWRwall-window ratio
IGUinsulating glass unit
PCMphase change material
Low-Elow emissivity coating
IRinfrared
NFRCNational Fenestration Rating Council
GHBguarded hot box
EPSexpanded polystyrene
PVCpolyvinyl chloride
ALaluminum
TGIthermal edge bong glass insulating

References

  1. European Union. Directive 2010/31 EU of the European Parliament and the Council of 19 May 2010 on the energy performance of buildings. Communication 2010, L153, 21–22. [Google Scholar]
  2. Lee, J.W.; Jung, H.J.; Park, J.Y.; Lee, J.B.; Yoon, Y. Optimization of building window system in Asian regions by analyzing solar heat gain and daylighting elements. Renew. Energy 2013, 50, 522–531. [Google Scholar] [CrossRef]
  3. Kim, S.; Zadeh, P.A.; Staub-French, S.; Froese, T.; Cavka, B.T. Assessment of the Impact of Window Size, Position and Orientation on Building Energy Load Using BIM. Procedia Eng. 2016, 145, 1424–1431. [Google Scholar] [CrossRef] [Green Version]
  4. Hee, W.J.; Alghoul, M.A.; Bakhtyar, B.; Elayeb, O.; Shameri, M.A.; Alrubaih, M.S.; Sopian, K. The role of window glazing on daylighting and energy saving in buildings. Renew. Sustain. Energy Rev. 2015, 42, 323–343. [Google Scholar] [CrossRef]
  5. Sadooghi, P.; Kherani, N.P. Thermal analysis of triple and quadruple windows using partitioning radiant energy veilsTM with different physical and optical properties. Sol. Energy 2018, 174, 1163–1168. [Google Scholar] [CrossRef]
  6. Poirazis, H.; Blomsterberg, Å.; Wall, M. Energy simulations for glazed office buildings in Sweden. Energy Build. 2008, 40, 1161–1170. [Google Scholar] [CrossRef]
  7. Gasparella, A.; Pernigotto, G.; Cappelletti, F.; Romagnoni, P.; Baggio, P. Analysis and modelling of window and glazing systems energy performance for a well insulated residential building. Energy Build. 2011, 43, 1030–1037. [Google Scholar] [CrossRef]
  8. Arici, M.; Karabay, H.; Kan, M. Flow and heat transfer in double, triple and quadruple pane windows. Energy Build. 2015, 86, 394–402. [Google Scholar] [CrossRef]
  9. Jelle, B.P.; Hynd, A.; Gustavsen, A.; Arasteh, D.; Goudey, H.; Hart, R. Fenestration of today and tomorrow: A state-of-the-art review and future research opportunities. Sol. Energy Mater. Sol. Cells 2012, 96, 1–28. [Google Scholar] [CrossRef] [Green Version]
  10. Respondek, Z. Heat transfer through insulating glass units subjected to climatic loads. Materials 2020, 13, 286. [Google Scholar] [CrossRef] [Green Version]
  11. Lago, T.G.S.; Ismail, K.A.R.; Lino, F.A.M. Ventilated double glass window with reflective film: Modeling and assessment of performance. Sol. Energy 2019, 185, 72–88. [Google Scholar] [CrossRef]
  12. Liu, C.; Wu, Y.; Li, D.; Zhou, Y.; Wang, Z.; Liu, X. Effect of PCM thickness and melting temperature on thermal performance of double glazing units. J. Build. Eng. 2017, 11, 87–95. [Google Scholar] [CrossRef] [Green Version]
  13. Song, S.Y.; Jo, J.H.; Yeo, M.S.; Kim, Y.D.; Song, K.D. Evaluation of inside surface condensation in double glazing window system with insulation spacer: A case study of residential complex. Build. Environ. 2007, 42, 940–950. [Google Scholar] [CrossRef]
  14. Lechowska, A.A.; Schnotale, J.A.; Baldinelli, G. Window frame thermal transmittance improvements without frame geometry variations: An experimentally validated CFD analysis. Energy Build. 2017, 145, 188–199. [Google Scholar] [CrossRef]
  15. Van Den Bergh, S.; Hart, R.; Jelle, B.P.; Gustavsen, A. Window spacers and edge seals in insulating glass units: A state-of-the-art review and future perspectives. Energy Build. 2013, 58, 263–280. [Google Scholar] [CrossRef]
  16. Hanam, B.; Jaugelis, A.; Finch, G. Energy performance of windows: Navigating North American and European window Standards. In Proceedings of the 14th Canadian Conference on Building Science and Technology, Toronto, ON, Canada, 29–30 October 2014; pp. 1–10. [Google Scholar]
  17. Gustavsen, A.; Jelle, B.P.; Arasteh, D.; Kohler, C. State-of-the-Art Highly Insulating Window Frames—Research and Market Review. In SINTEF Building and Infrastructure; SINTEF Building and Infrastructure: Trondheim, Norway, 2007; Volume 2, ISBN 9788253609706. [Google Scholar]
  18. EN ISO 10077-1:2017. Thermal Performance of Windows, Doors and Shutters—Calculation of Thermal Transmittance—Part 1. General (ISO 10077-1:2017); ISO: Geneva, Switzerland, 2017. [Google Scholar]
  19. EN ISO 10077-2:2017. Thermal Performance of Windows, Doors and Shutters—Calculation of Thermal Transmittance—Part 2: Numerical Method for Frames (ISO 10077-2:2017); ISO: Geneva, Switzerland, 2017. [Google Scholar]
  20. EN ISO 12567-1:2010. Thermal Performance of Windows and Doors—Determination of Thermal Transmittance by the Hot-Box Method—Part 1: Complete Windows and Doors (ISO 12567-1:2010); ISO: Geneva, Switzerland, 2010. [Google Scholar]
  21. Liu, Z.; Bao, Y.; Liu, H. Influence of Windows Performance Parameters Changes on Building Energy Consumption. In Proceedings of the International High Performance Buildings Conference, West Lafayette, Indiana, 12–15 July 2010. [Google Scholar]
  22. ISO 10456:2007. Building Materials and Products—Hygrothermal Properties—Tabulated Design Values and Procedures for Determining Declared and Design Thermal Values; ISO: Geneva, Switzerland, 2007. [Google Scholar]
  23. Chowdhury, D.; Neogi, S. Thermal performance evaluation of traditional walls and roof used in tropical climate using guarded hot box. Constr. Build. Mater. 2019, 218, 73–89. [Google Scholar] [CrossRef]
  24. Trgala, K.; Pavelek, M.; Wimmer, R. Energy performance of five different building envelope structures using a modified Guarded Hot Box apparatus—Comparative analysis. Energy Build. 2019, 195, 116–125. [Google Scholar] [CrossRef]
  25. Baldinelli, G.; Bianchi, F.; Lechowska, A.A.; Schnotale, J.A. Dynamic thermal properties of building components: Hot box experimental assessment under different solicitations. Energy Build. 2018, 168, 1–8. [Google Scholar] [CrossRef]
  26. Asdrubali, F.; Baldinelli, G. Thermal transmittance measurements with the hot box method: Calibration, experimental procedures, and uncertainty analyses of three different approaches. Energy Build. 2011, 43, 1618–1626. [Google Scholar] [CrossRef]
  27. Jelle, B.P. Solar radiation glazing factors for window panes, glass structures and electrochromic windows in buildings—Measurement and calculation. Sol. Energy Mater. Sol. Cells 2013, 116, 291–323. [Google Scholar] [CrossRef] [Green Version]
  28. LST EN 673:2011. Glass in Building—Determination of Thermal Transmittance (U Value)—Calculation Method. Brussels. 2011. Available online: https://standards.globalspec.com/std/1360149/EN%20673 (accessed on 3 January 2021).
  29. ISO 15099:2003. Thermal Performance of Windows, Doors and Shading Devices—Detailed Calculations; ISO: Geneva, Switzerland, 2003. [Google Scholar]
  30. Būrlingis, A.; Samajauskiene, B.; Ramanauskas, J. An influence of outdoor temperature on thermal performance of windows with a low-emissivity glazing. J. Civ. Eng. Manag. 2003, 9, 115–121. [Google Scholar] [CrossRef]
Figure 1. (a) Scheme of climate chamber “hot box”; 1. Warm side guard box: internal dimensions 2800 × 2800 × 1100 mm; wall thickness 130 mm, total thermal resistance approximately 3 m2⋅K/W; 2. Guard box’s air flow deflecting screen; 3. Electrical heater, power 660 W, controlled according to a set point temperature in the metering box (6); 4. Electrical heater of the metering box, power control from 13 W to 660 W; 5. Warm side baffler (of the metering box) with surface and air temperature sensors; 6. Metering box: Internal dimensions 2400 mm × 2400 mm × 360 mm; 7. Surround panel: 200 mm thick, core material EPS polystyrene (faced with 3 mm thick cellular PVC plastic sheet on either side); thermal resistance approximately 6 m2⋅K/W; 1484 mm (h) × 1234 mm aperture for window specimen mounting, 2055 mm (h) × 1234 mm aperture for door specimen mounting; 8. Cold side box: Internal dimensions 2800 mm × 2800 mm × 1100 mm; wall thickness 130 mm, total thermal resistance about 3 m2⋅K/W; 9. Cold side baffler with surface and air temperature sensors; 10. Cold side controlled cooling air unit, maximum cooling power up to 3 kW; 11. Cold side air cooling box with five speed motor fan; 12. The tested window. (b) Photos of closed and opened GHB. (c) Measurement location of the heat flow meter and differential thermocouple on the insulating glass unit (IGU) of window.
Energies 14 01694 g001
Figure 2. Dependence of Ug-value of a double-glazed IGU on distance between the panes and external air temperature (no Low-E coatings or inert gases).
Energies 14 01694 g002
Figure 3. Dependence of the Ug-value of a double-glazed IGU on Low-E coating and external air temperature.
Energies 14 01694 g003
Figure 4. Dependence of the Ug-value of a double-glazed IGU on the distance between the panes and external air temperature.
Energies 14 01694 g004
Figure 5. Dependence of the Ug-value of a double-glazed IGU with a distance of 16 mm between the panes on the concentration of the argon gas fill and external air temperature.
Energies 14 01694 g005
Figure 6. Dependence of the Ug-values of the triple-glazed IGU on the Low-E coating value and external air temperature.
Energies 14 01694 g006
Figure 7. Dependence of the Ug-value of the triple-glazed IGU on the distance between the panes and external air temperature.
Energies 14 01694 g007
Table 1. Descriptions of the double- and triple-glazed windows measured in the hot box.
Description of Window
Number 1 Double glazed1.48(h) × 1.23 m window, wooden/aluminum frame; triple-IGU 4GN-20Ar-4-20Ar-4GN, Swiss spacer; frame width = 110 mm and thickness = 110 mm; the thickness of the wooden part = 95 mm, AL = 15 mm; the perimeter of the IGU P = 1260 × 2 + 1010 × 2 = 4540 mm
Number 2 Triple glazed1.48(h) × 1.23 m window, wooden frame; double-IGU 4-16Ar-4TM, thermal TGI spacer; frame width = 90 mm and thickness 113 = mm
Table 2. Results of double-glazed window No. 1’s (characteristics are in presented Table 1) measurements in a GHB.
Measurement ModeAir Temperature, °CAmbient Temperature, °CAir Velocity, m/sWindowIGU
°CoutsideinsideoutsideinsideoutsideinsideUwΔTUg
0/20−0.1019.66−0.0319.722.890.240.760616.860.660
−10/20−9.5919.71−9.5219.673.180.240.816724.740.727
−14/20−14.6019.71−14.5319.623.190.230.838028.920.764
Table 3. Results of triple-glazed window No. 2′s (characteristics are in presented Table 1) measurements in a GHB.
Measurement ModeAir Temperature, °CAmbient Temperature, °CAir Velocity, m/sWindowIGU
°CoutsideinsideoutsideoutsideinsideoutsideUwΔTUg
0/20−0.1219.78−0.0319.723.050.191.369814.641.257
−10/20−9.5919.89−9.5019.663.150.191.459721.251.383
−14/20−14.2619.94−14.1619.613.260.191.496524.471.435
Table 4. Simplified method for recalculation of declared thermal transmittance values U(0) at 0 °C to values at lower external temperatures θe, °C (double-glazed IGUs).
IGUSimplified Method
4-10Ar-4eU = 0.000101 × θ2 + 0.00232 × θ + U(0)
4-12Ar-4eU = 0.000164 × θ2 + 0.001518 × θ + U(0)
4-14Ar-4eU = −0.000026 × θ2 − 0.011099 × θ + U(0)
4-16Ar-4eU = −0.000107 × θ2 − 0.014592 × θ + U(0)
4-18Ar-4eU = −0.000112 × θ2 − 0.014960 × θ + U(0)
4-20Ar-4eU = −0.000116 × θ2 − 0.015209 × θ + U(0)
4-25Ar-4eU = −0.000174 × θ2 − 0.015394 × θ + U(0)
Table 5. Simplified method for recalculation of declared thermal transmittance values U(0) at 0 °C to values at lower external temperatures θe, °C (triple-glazed IGUs).
IGUSimplified Method
4e-10Ar-4-10Ar-4eU = 0.000023 × θ2 + 0.001444 × θ + U(0)
4e-12Ar-4-12Ar-4eU = 0.000064 × θ2 − 0.001126 × θ + U(0)
4e-14Ar-4-14Ar-4eU = 0.000099 × θ2 − 0.000484 × θ + U(0)
4e-16Ar-4-16Ar-4eU = 0.000029 × θ2 − 0.004798 × θ + U(0)
4e-18Ar-4-18Ar-4eU = −0.000042 × θ2 − 0.007909 × θ + U(0)
4e-20Ar-4-20Ar-4eU = −0.000055 × θ2 − 0.008569 × θ + U(0)
4e-25Ar-4-25Ar-4eU = −0.000078 × θ2 − 0.0093 × θ + U(0)
Table 6. Dependence of thermal transmittance of a double-glazed IGU on the distance between glass panes and external air temperature using standard methods and developed simplified methods.
IGU ε = 0.06 Ar-90%According to Standard EN 673 MethodAccording to the Developed Simplified Methods
External Air Temperature θe, °C
0−5−10−15−20−25−30−5−10−15−20−25−30
4-10Ar-4e1.521.521.511.511.521.531.551.511.511.511.521.531.54
4-12Ar-4e1.381.381.401.431.471.521.561.391.411.441.471.521.57
4-14Ar-4e1.301.341.401.451.501.551.601.351.401.461.511.561.60
4-16Ar-4e1.281.361.421.481.531.581.631.351.421.481.531.581.62
4-18Ar-4e1.301.381.451.501.561.611.651.381.441.501.561.611.65
4-20Ar-4e1.321.401.471.531.581.631.681.401.461.531.581.631.67
4-25Ar-4e1.371.441.511.561.601.641.681.441.501.561.601.641.67
Table 7. Dependence of thermal transmittance of a triple-glazed IGU on the distance between glass panes and the external air temperature using standard methods and developed simplified methods.
IGU ε = 0.06 Ar-90%According to Standard EN 673 MethodAccording to the Developed Simplified Methods
External Air Temperature θe, °C
0−5−10−15−20−25−30−5−10−15−20−25−30
4e-10Ar-4-10Ar-4e0.860.860.850.850.840.840.840.860.850.850.840.840.84
4e-12Ar-4-12Ar-4e0.760.760.760.760.760.770.790.760.760.760.760.770.78
4e-14Ar-4-14Ar-4e0.690.690.700.720.740.760.790.690.700.720.740.760.79
4e-16Ar-4-16Ar-4e0.640.660.690.720.750.780.810.670.690.720.750.780.81
4e-18Ar-4-18Ar-4e0.620.660.700.730.770.800.820.660.700.730.770.800.82
4e-20Ar-4-20Ar-4e0.630.670.710.750.780.810.840.670.710.750.780.810.84
4e-25Ar-4-25Ar-4e0.650.700.740.780.810.840.860.700.740.780.810.840.86
Table 8. The comparison of U-values of double-glazed 4-16Ar-4e IGU calculated according to the standard methodology and simplified methods.
Gas FillLow-E EmissivityCalculation Methodology and Differences in ResultExternal Air Temperature θe, °C
0−5−10−15−20−25−30
Ar-95%ε = 0.09Standard, U, W/(m2·K)1.351.411.471.531.581.621.66
Simplified, U, W/(m2·K)1.421.481.541.601.651.69
Difference, %-0.710.680.651.271.851.81
ε = 0.06Standard, U, W/(m2·K)1.271.341.401.461.511.561.61
Simplified, U, W/(m2·K)1.341.401.461.511.561.61
Difference, %-0.000.000.000.000.000.00
ε = 0.04Standard, U, W/(m2·K)1.211.281.351.411.471.521.57
Simplified, U, W/(m2·K)1.281.341.401.461.511.55
Difference, %-0.00−0.74−0.71−0.68−0.66−1.27
Ar-90%ε = 0.09Standard, U, W/(m2·K)1.371.431.491.551.601.641.68
Simplified, U, W/(m2·K)1.441.501.561.611.661.71
Difference, %-0.700.670.650.631.221.79
ε = 0.06Standard, U, W/(m2·K)1.281.361.421.481.531.581.63
Simplified, U, W/(m2·K)1.351.421.481.531.581.62
Difference, %-−0.740.000.000.000.00−0.61
ε = 0.04Standard, U, W/(m2·K)1.231.301.371.431.491.541.59
Simplified, U, W/(m2·K)1.301.361.421.481.521.57
Difference, %-0.00−0.73−0.70−0.67−1.30−1.26
Ar-80%ε = 0.09Standard, U, W/(m2·K)1.401.471.531.581.631.681.72
Simplified, U, W/(m2·K)1.471.531.591.651.701.74
Difference, %-0.000.000.631.231.191.16
ε = 0.06Standard, U, W/(m2·K)1.321.391.461.521.571.621.67
Simplified, U, W/(m2·K)1.391.451.511.571.621.66
Difference, %-0.00−0.68−0.660.000.00−0.60
ε = 0.04Standard, U, W/(m2·K)1.261.341.411.471.531.581.63
Simplified, U, W/(m2·K)1.331.401.461.511.561.60
Difference, %-−0.75−0.71−0.68−1.31−1.27−1.84
Ar-60%ε = 0.09Standard, U, W/(m2·K)1.461.531.591.651.701.751.80
Simplified, U, W/(m2·K)1.531.591.651.711.751.80
Difference, %-0.000.000.000.590.000.00
ε = 0.06Standard, U, W/(m2·K)1.381.461.531.591.641.691.74
Simplified, U, W/(m2·K)1.451.511.571.631.681.72
Difference, %-−0.68−1.31−1.26−0.61−0.59−1.15
ε = 0.04Standard, U, W/(m2·K)1.321.411.481.541.601.661.71
Simplified, U, W/(m2·K)1.391.461.521.571.621.67
Difference, %-−1.42−1.35−1.30−1.88−2.41−2.34
Table 9. The comparison of U-values of triple-glazed 4e-16Ar-4-16Ar-4e IGU calculated according to the standard methodology and simplified methods.
Gas FillLow-E EmissivityCalculation Methodology and Differences in ResultExternal Air Temperature θe, °C
0−5−10−15−20−25−30
Ar-95%ε = 0.09Standard, U, W/(m2·K)0.690.700.730.750.780.810.84
Simplified, U, W/(m2·K)0.710.740.760.790.820.86
Difference, %-1.431.371.331.281.232.38
ε = 0.06Standard, U, W/(m2·K)0.630.650.680.710.740.770.79
Simplified, U, W/(m2·K)0.660.680.710.740.770.80
Difference, %-1.540.000.000.000.001.27
ε = 0.04Standard, U, W/(m2·K)0.600.620.640.680.710.740.77
Simplified, U, W/(m2·K)0.620.650.680.700.730.77
Difference, %-0.001.560.00−1.41−1.350.00
Ar-90%ε = 0.09Standard, U, W/(m2·K)0.700.710.740.770.800.820.85
Simplified, U, W/(m2·K)0.720.750.770.800.830.87
Difference, %-1.411.350.000.001.222.35
ε = 0.06Standard, U, W/(m2·K)0.640.660.690.720.750.780.81
Simplified, U, W/(m2·K)0.670.690.720.750.780.81
Difference, %-1.520.000.000.000.000.00
ε = 0.04Standard, U, W/(m2·K)0.610.630.650.690.720.750.78
Simplified, U, W/(m2·K)0.630.660.690.710.750.78
Difference, %-0.001.540.00−1.390.000.00
Ar-80%ε = 0.09Standard, U, W/(m2·K)0.720.730.760.790.820.850.88
Simplified, U, W/(m2·K)0.740.770.800.820.850.89
Difference, %-1.371.321.270.000.001.14
ε = 0.06Standard, U, W/(m2·K)0.660.680.710.740.770.800.83
Simplified, U, W/(m2·K)0.690.720.740.770.800.83
Difference, %-1.471.410.000.000.000.00
ε = 0.04Standard, U, W/(m2·K)0.630.650.680.710.740.780.81
Simplified, U, W/(m2·K)0.650.680.710.740.770.80
Difference, %-0.000.000.000.00−1.28−1.23
Ar-60%ε = 0.09Standard, U, W/(m2·K)0.760.770.800.830.860.890.92
Simplified, U, W/(m2·K)0.780.810.830.860.890.93
Difference, %-1.301.250.000.000.001.09
ε = 0.06Standard, U, W/(m2·K)0.700.720.750.780.820.850.88
Simplified, U, W/(m2·K)0.730.750.780.810.840.87
Difference, %-1.390.000.00−1.22−1.18−1.14
ε = 0.04Standard, U, W/(m2·K)0.670.690.720.750.790.820.85
Simplified, U, W/(m2·K)0.690.720.750.780.810.84
Difference, %-0.000.000.00−1.27−1.22−1.18
Table 10. The comparison of U-values of IGU measured in Hot Box and calculated according to simplified methods.
IGU
4-16Ar-4e4e-20Ar-4-20Ar-4e
External air temperature θe, °C−0.12−9.59−14.26−0.10−9.59−14.60
Measured U value in GHB, W/(m2·K)1.2571.3831.4350.6600.7270.764
Simplify calculation method U value, W/(m2·K)1.3871.4430.7370.773
Difference, %-0.2960.557-1.3761.228
Publisher’s Note: MDPI stays neutral with regard to jurisdictional claims in published maps and institutional affiliations.

