
Varying the Energy Mix in the EU-28 and in Poland as a Step towards Sustainable Development


Abstract
:1. Introduction
2. Assumptions of the Energy Policy
2.1. The Climate and Energy Policy of the European Union
- reduction of greenhouse gases (GHG) emissions in developed countries by 30% until 2020 (compared to the 1990 level) and reduction of global emissions by 50% until 2050 (including the reduction of emissions in industrialized countries by 60–80%), to reduce global warming to 2 °C;
- domestic reduction of greenhouse gases emissions by at least 20% when compared to the 1990 levels;
- increase of the share of renewable energy in the total energy balance of the European Union, from the current level of less than 7% to 20% until 2020, and at least a 10% share of biofuels (the objectives after 2020 will be analysed in the light of technological progress, and the contribution of each Member State to achieving the EU goals must take into account the diverse conditions and different starting points in different countries);
- implementation of a strategic plan in the field of energy technologies which will lower the cost of clean energy (what is meant here are initially renewable energy sources, and in 2050 hydrogen energy, nuclear power, and fourth generation nuclear fusion power) coupled with increasing the energy efficiency of buildings, appliances, equipment, industrial processes, and systems of transport;
- development of an EU framework for nuclear energy, subject to the most stringent safety standards, including nuclear waste management and decommissioning of nuclear facilities;
- pursuing an active, common European Union foreign policy in the field of energy.
- nowadays, in terms of reduction of GHGs emissions, the action plan sets the goals:
- reduction of domestic GHGs emissions by 80% until 2050 when compared with emissions in 1990 (in all EU Member States);
- program of obligatory reduction of GHGs emissions in the subsequent years: 25% in 2020, 40% in 2030, 60% in 2040, 80% in 2050.
2.2. Energy Policy of Poland
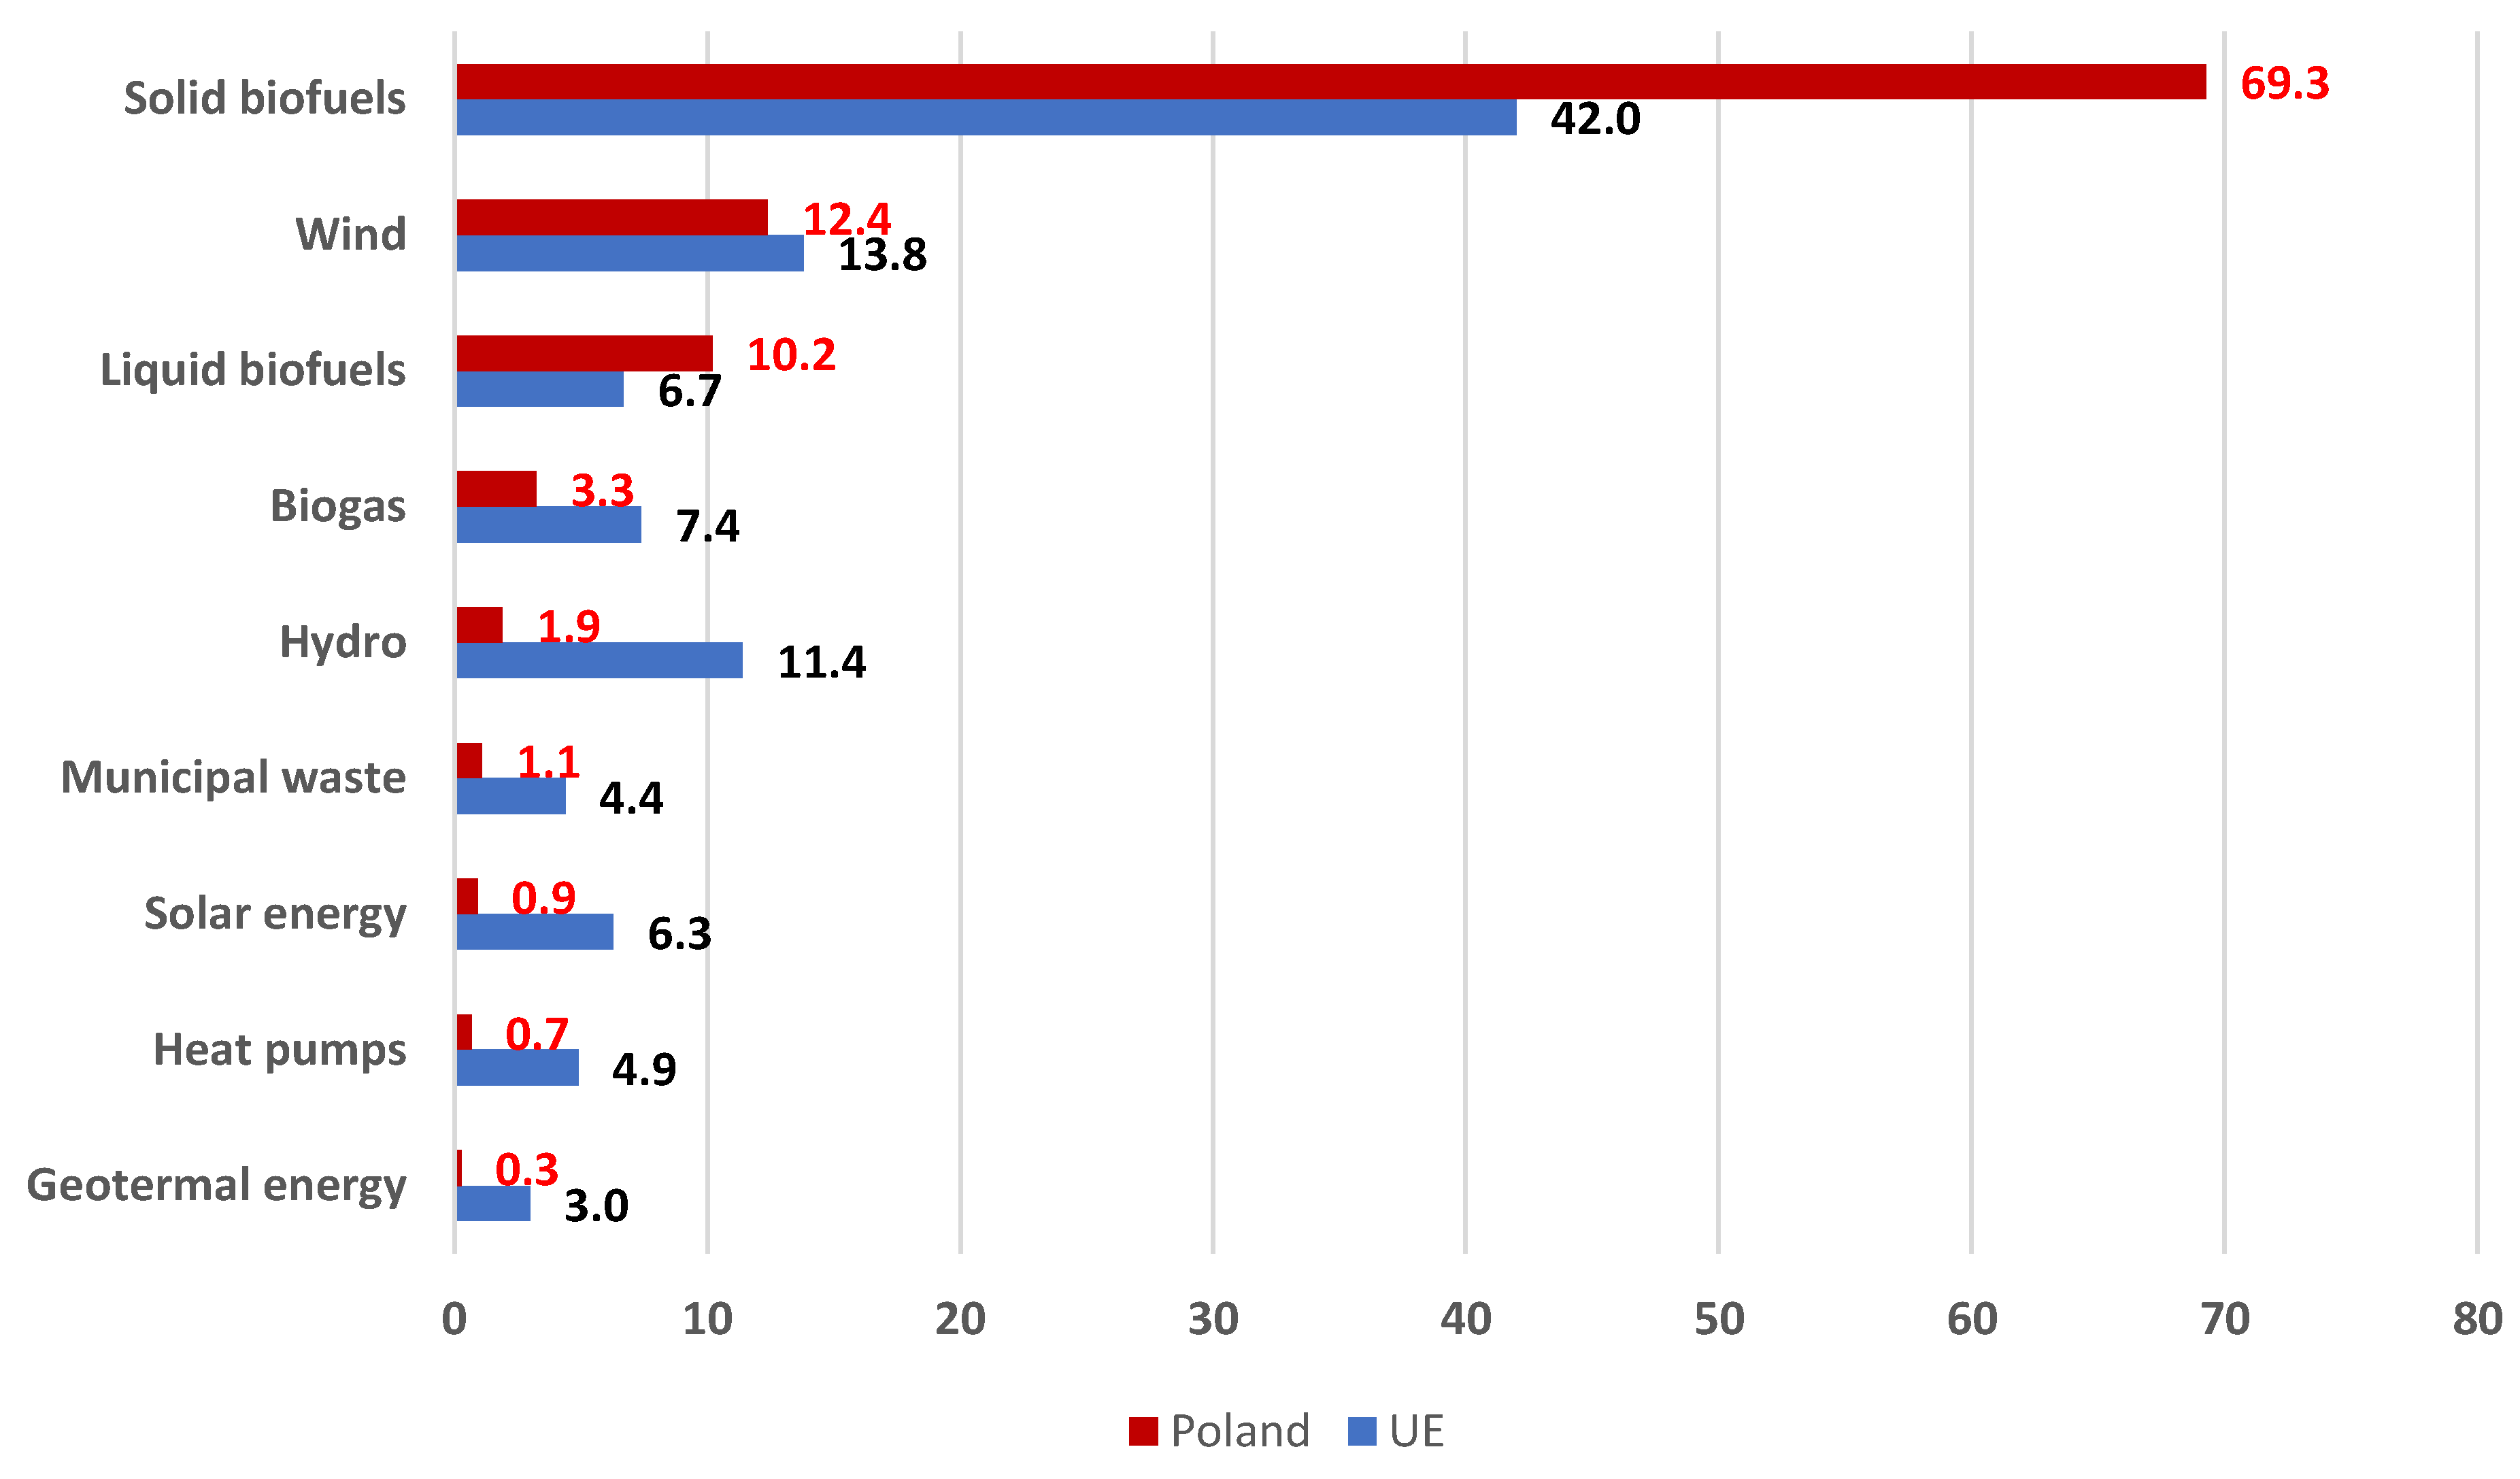
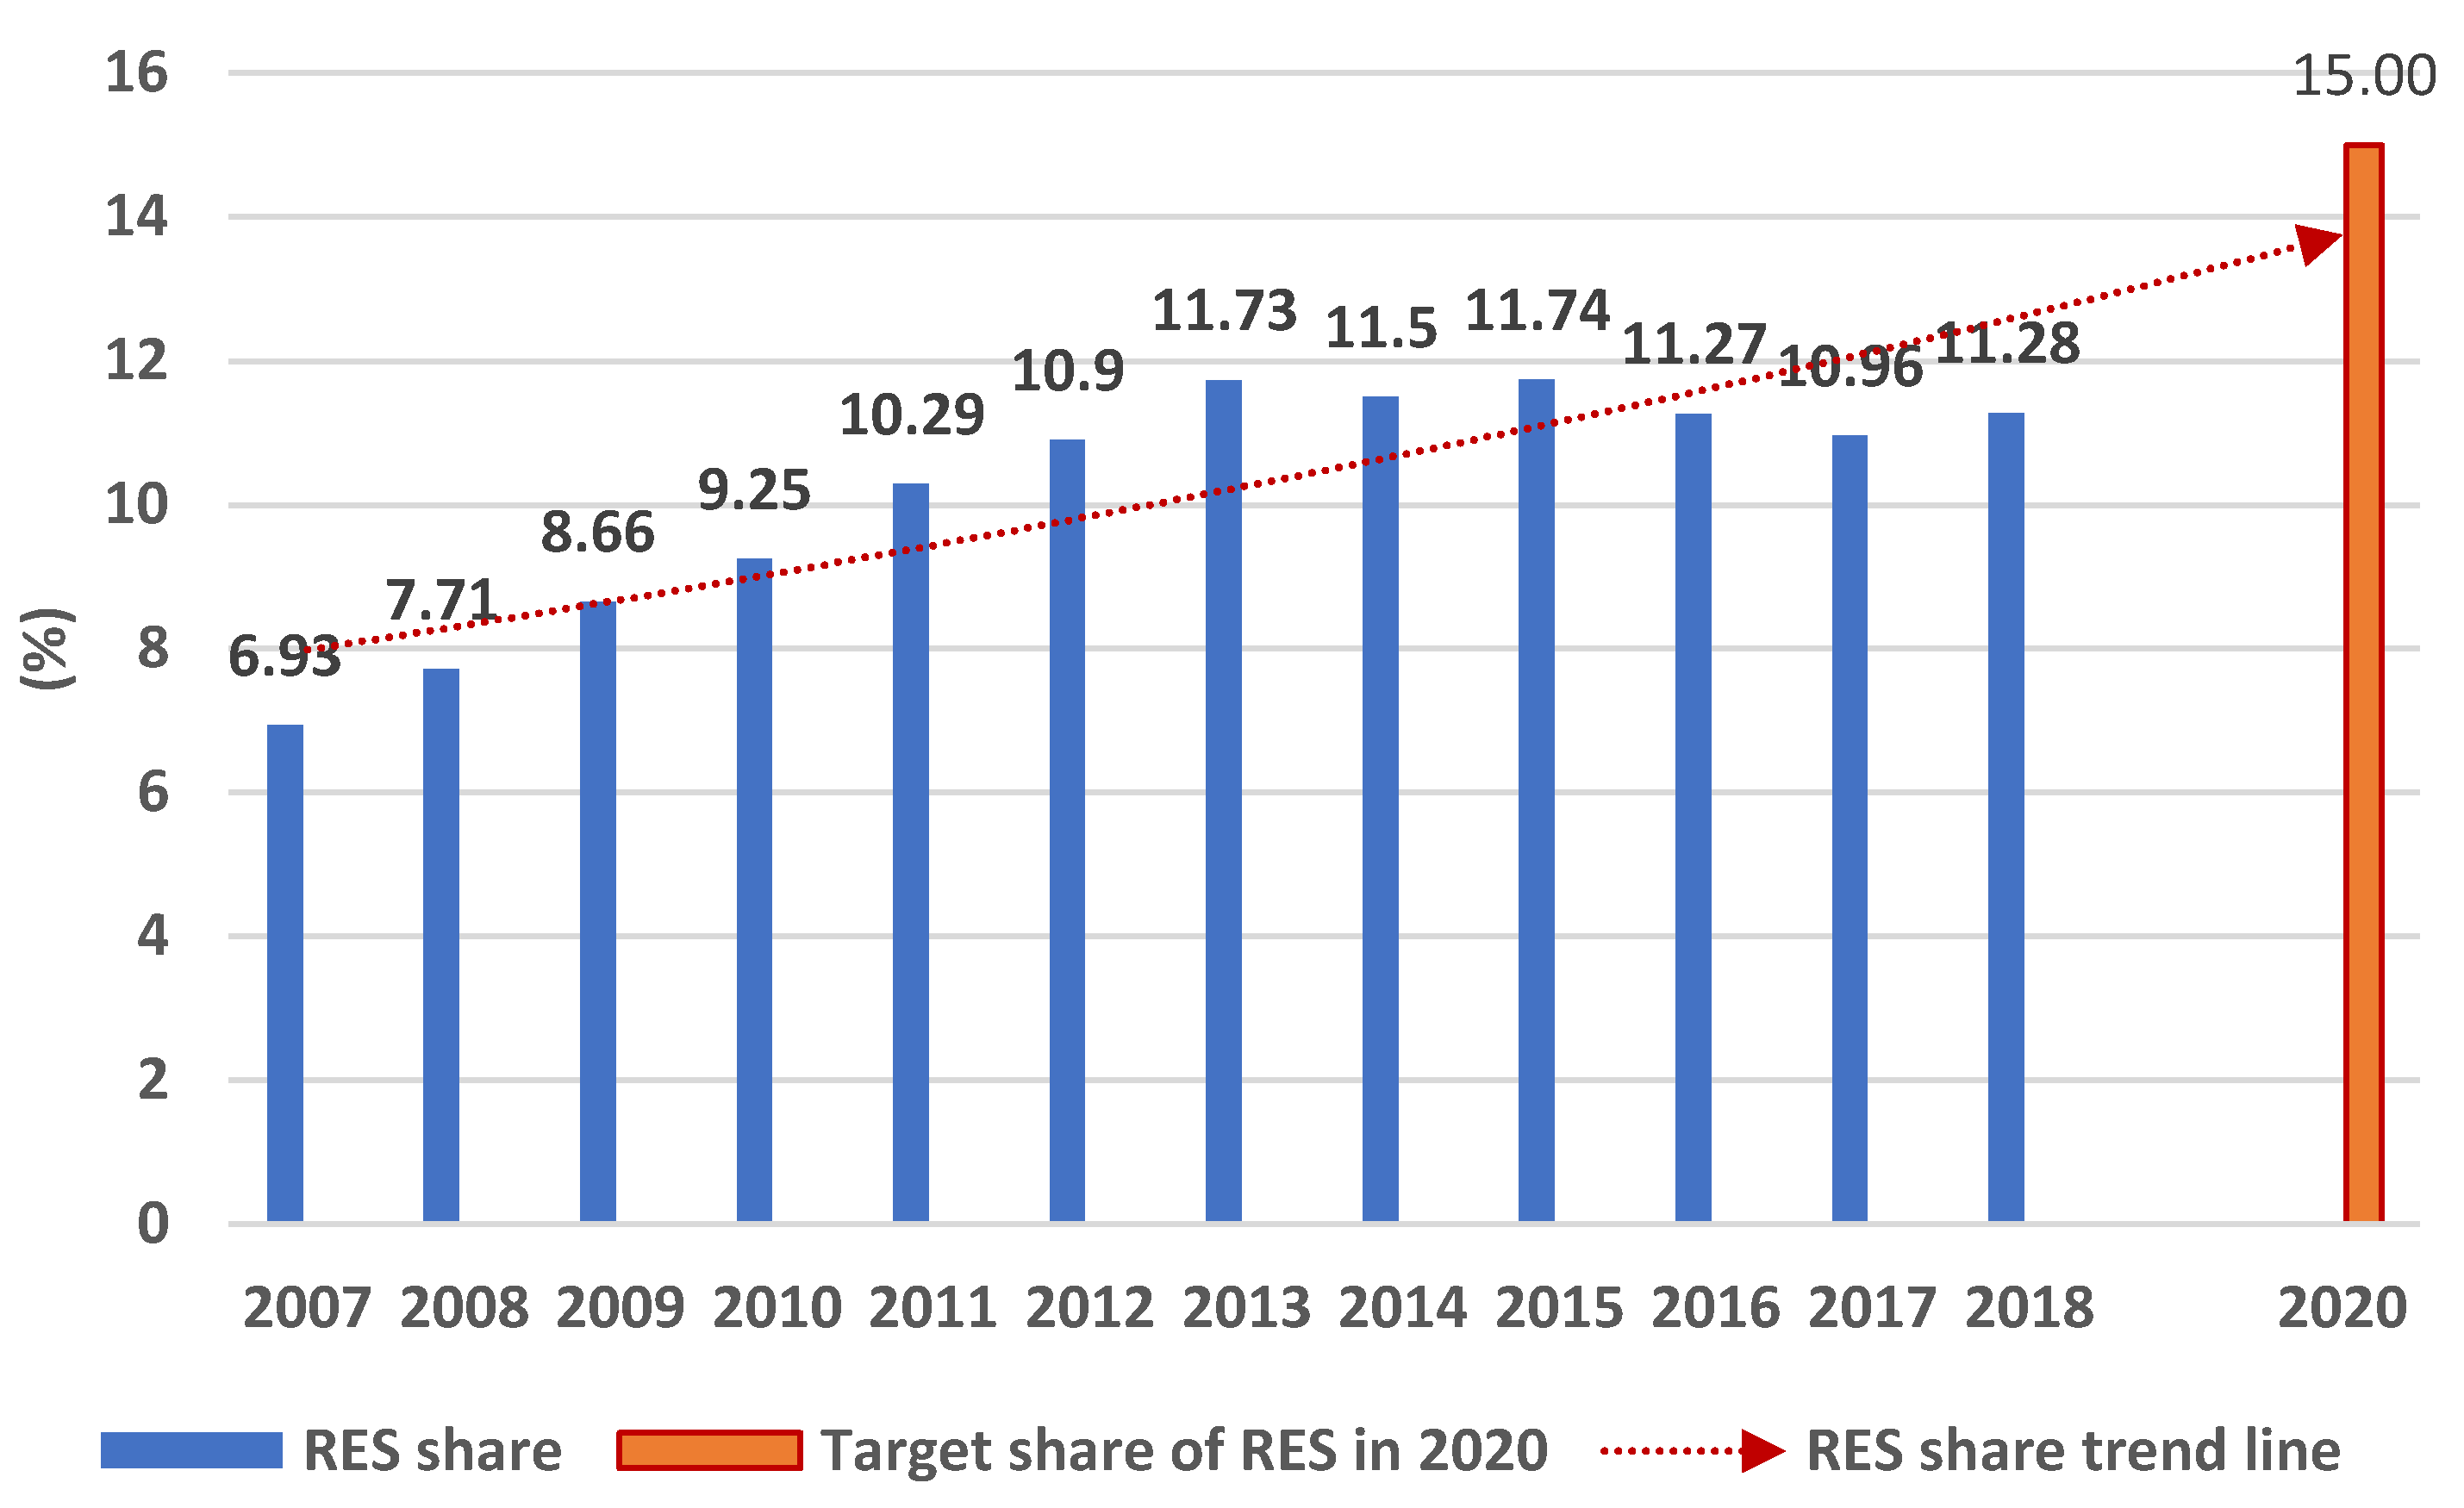
2.3. Energy from Renewable Sources
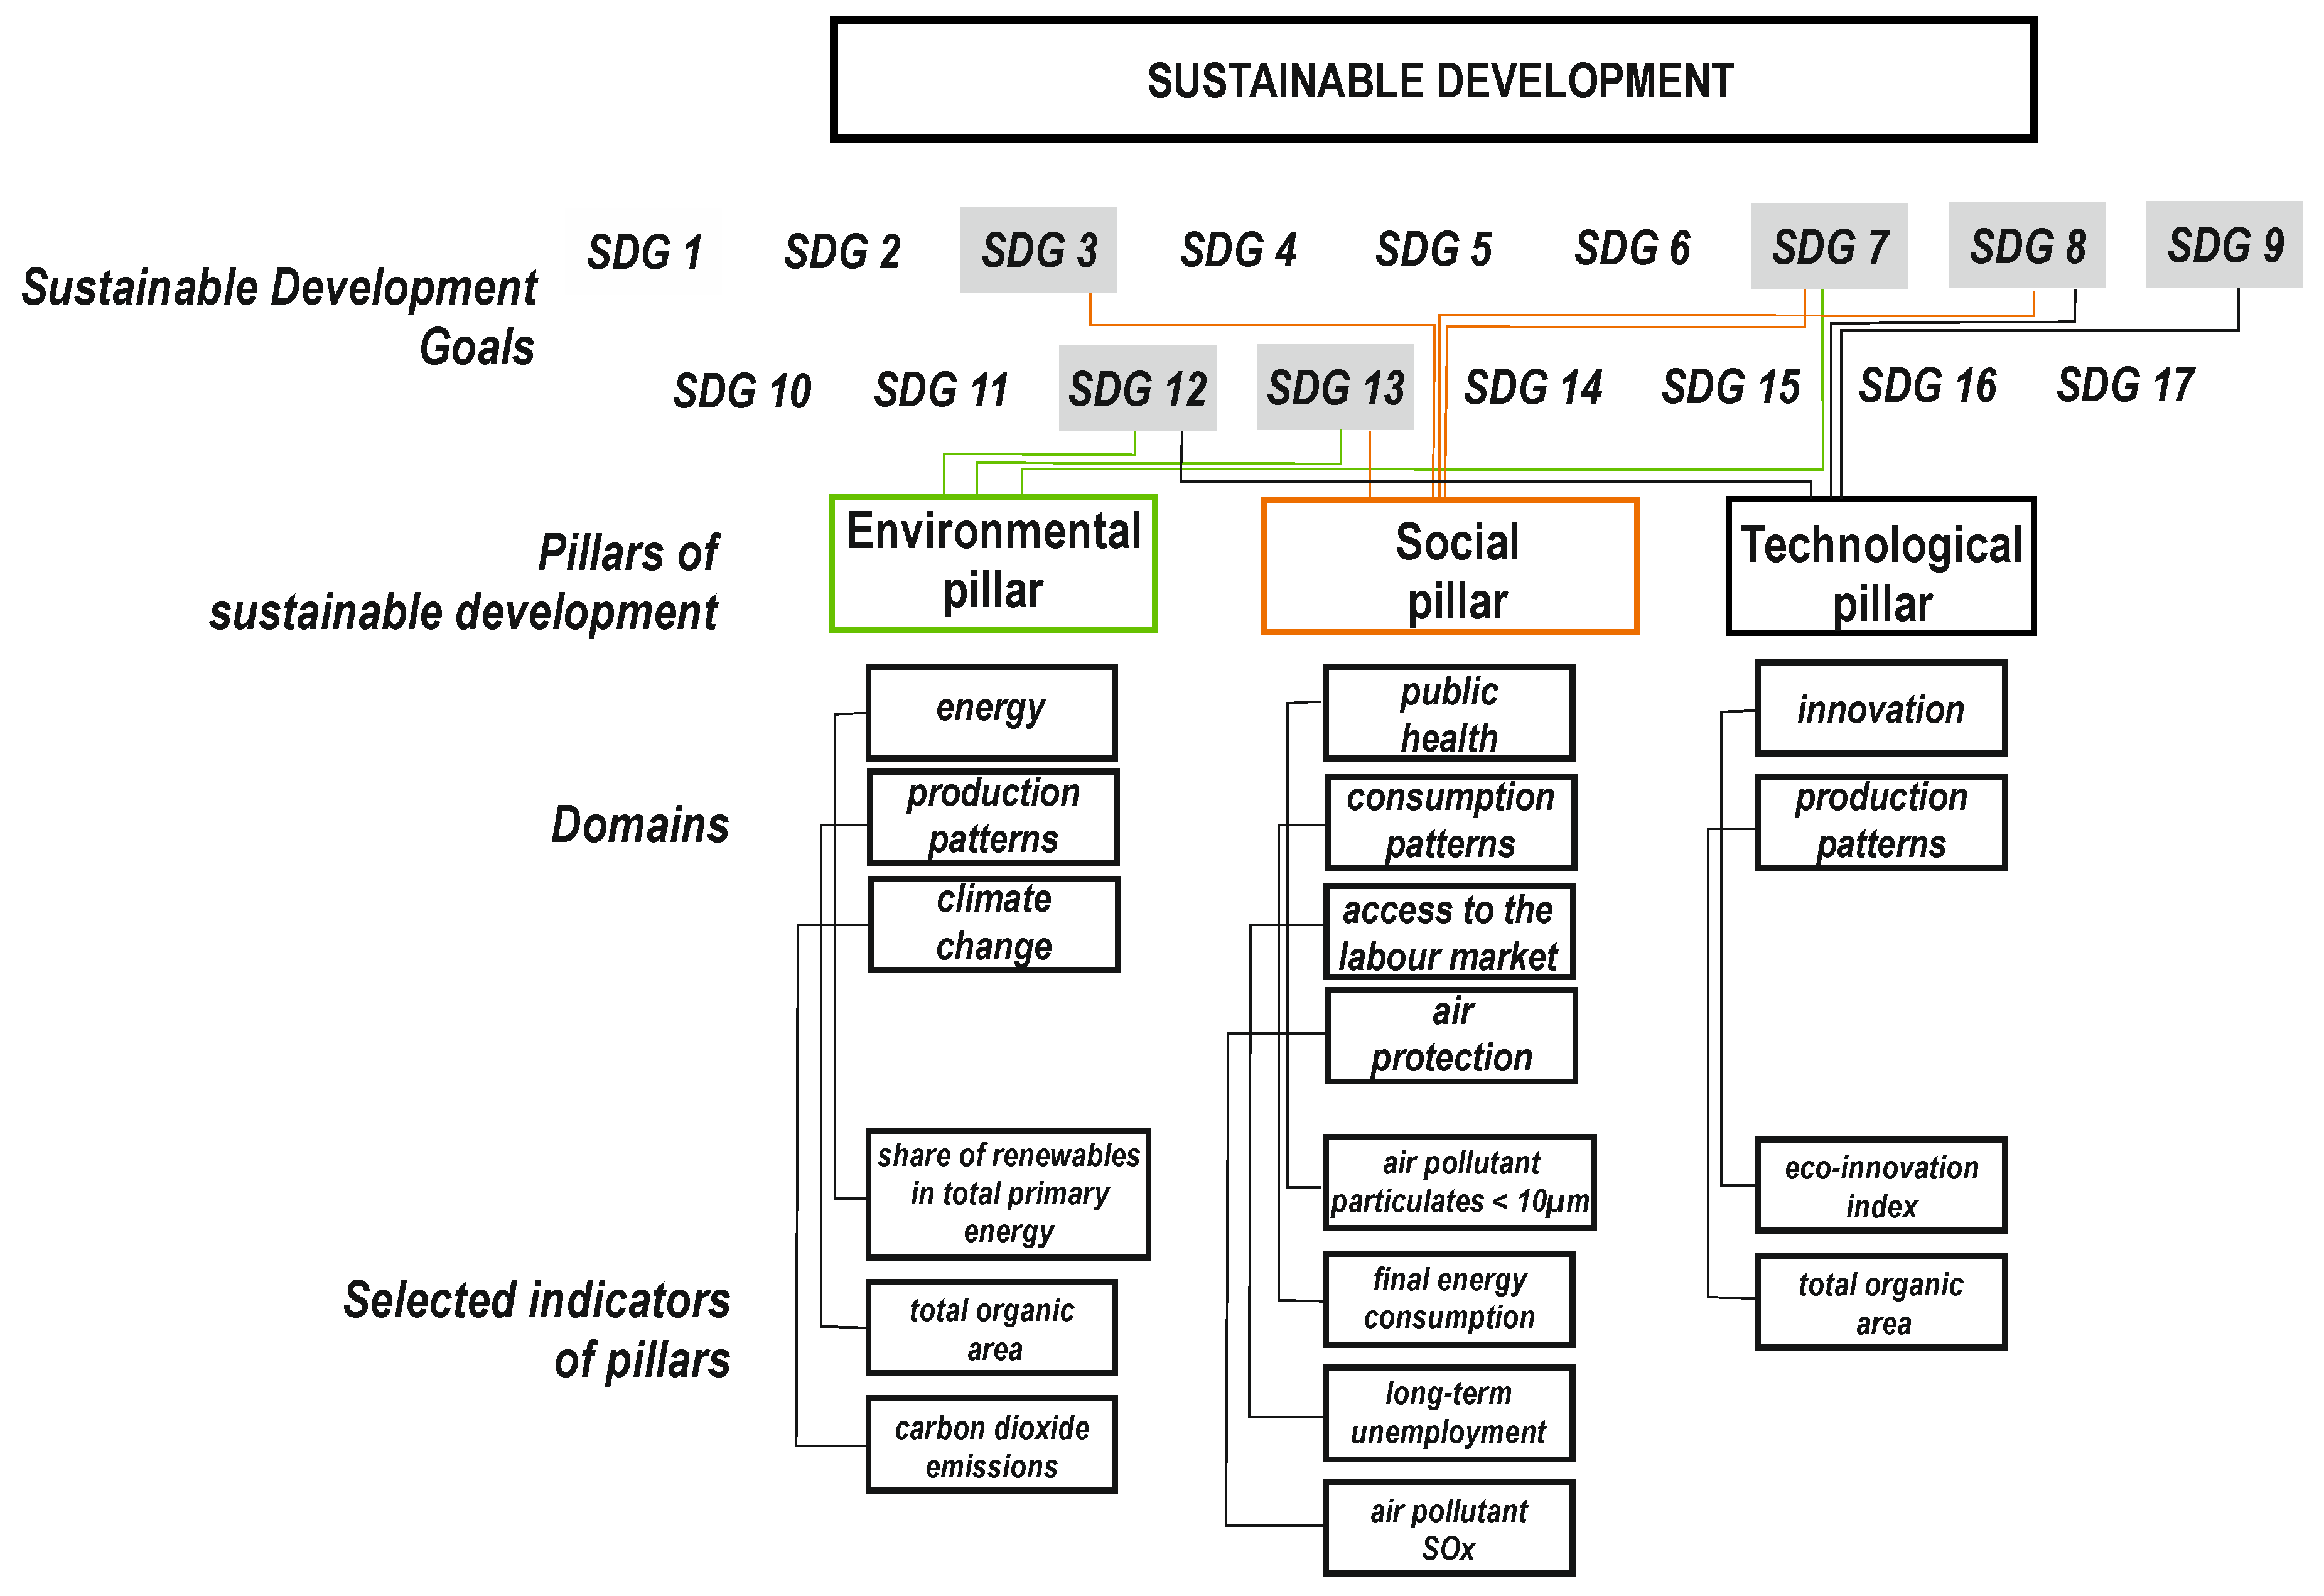
3. Purpose and Research Methods
- The indicator should show everyday life, not just an idea (regional social policy);
- achieving the indicator is possible in a moderately prosperous country (Poland);
- achieving the indicator shows how, in small steps, a great goal can be achieved (regional economic policy);
- achieving the indicator has a measurable impact on improving the condition of the environment (regional environmental policy).
3.1. The Analysis of the Implementation of the Selected Indicators of the Social, Economic, and Environmental Pillars by the Biomass-Based Power Industry
3.1.1. Implementation of Social Pillar Indicators
3.1.2. Implementation of Economic Pillar Indicators
3.1.3. Implementation of Environmental Pillar Indicators
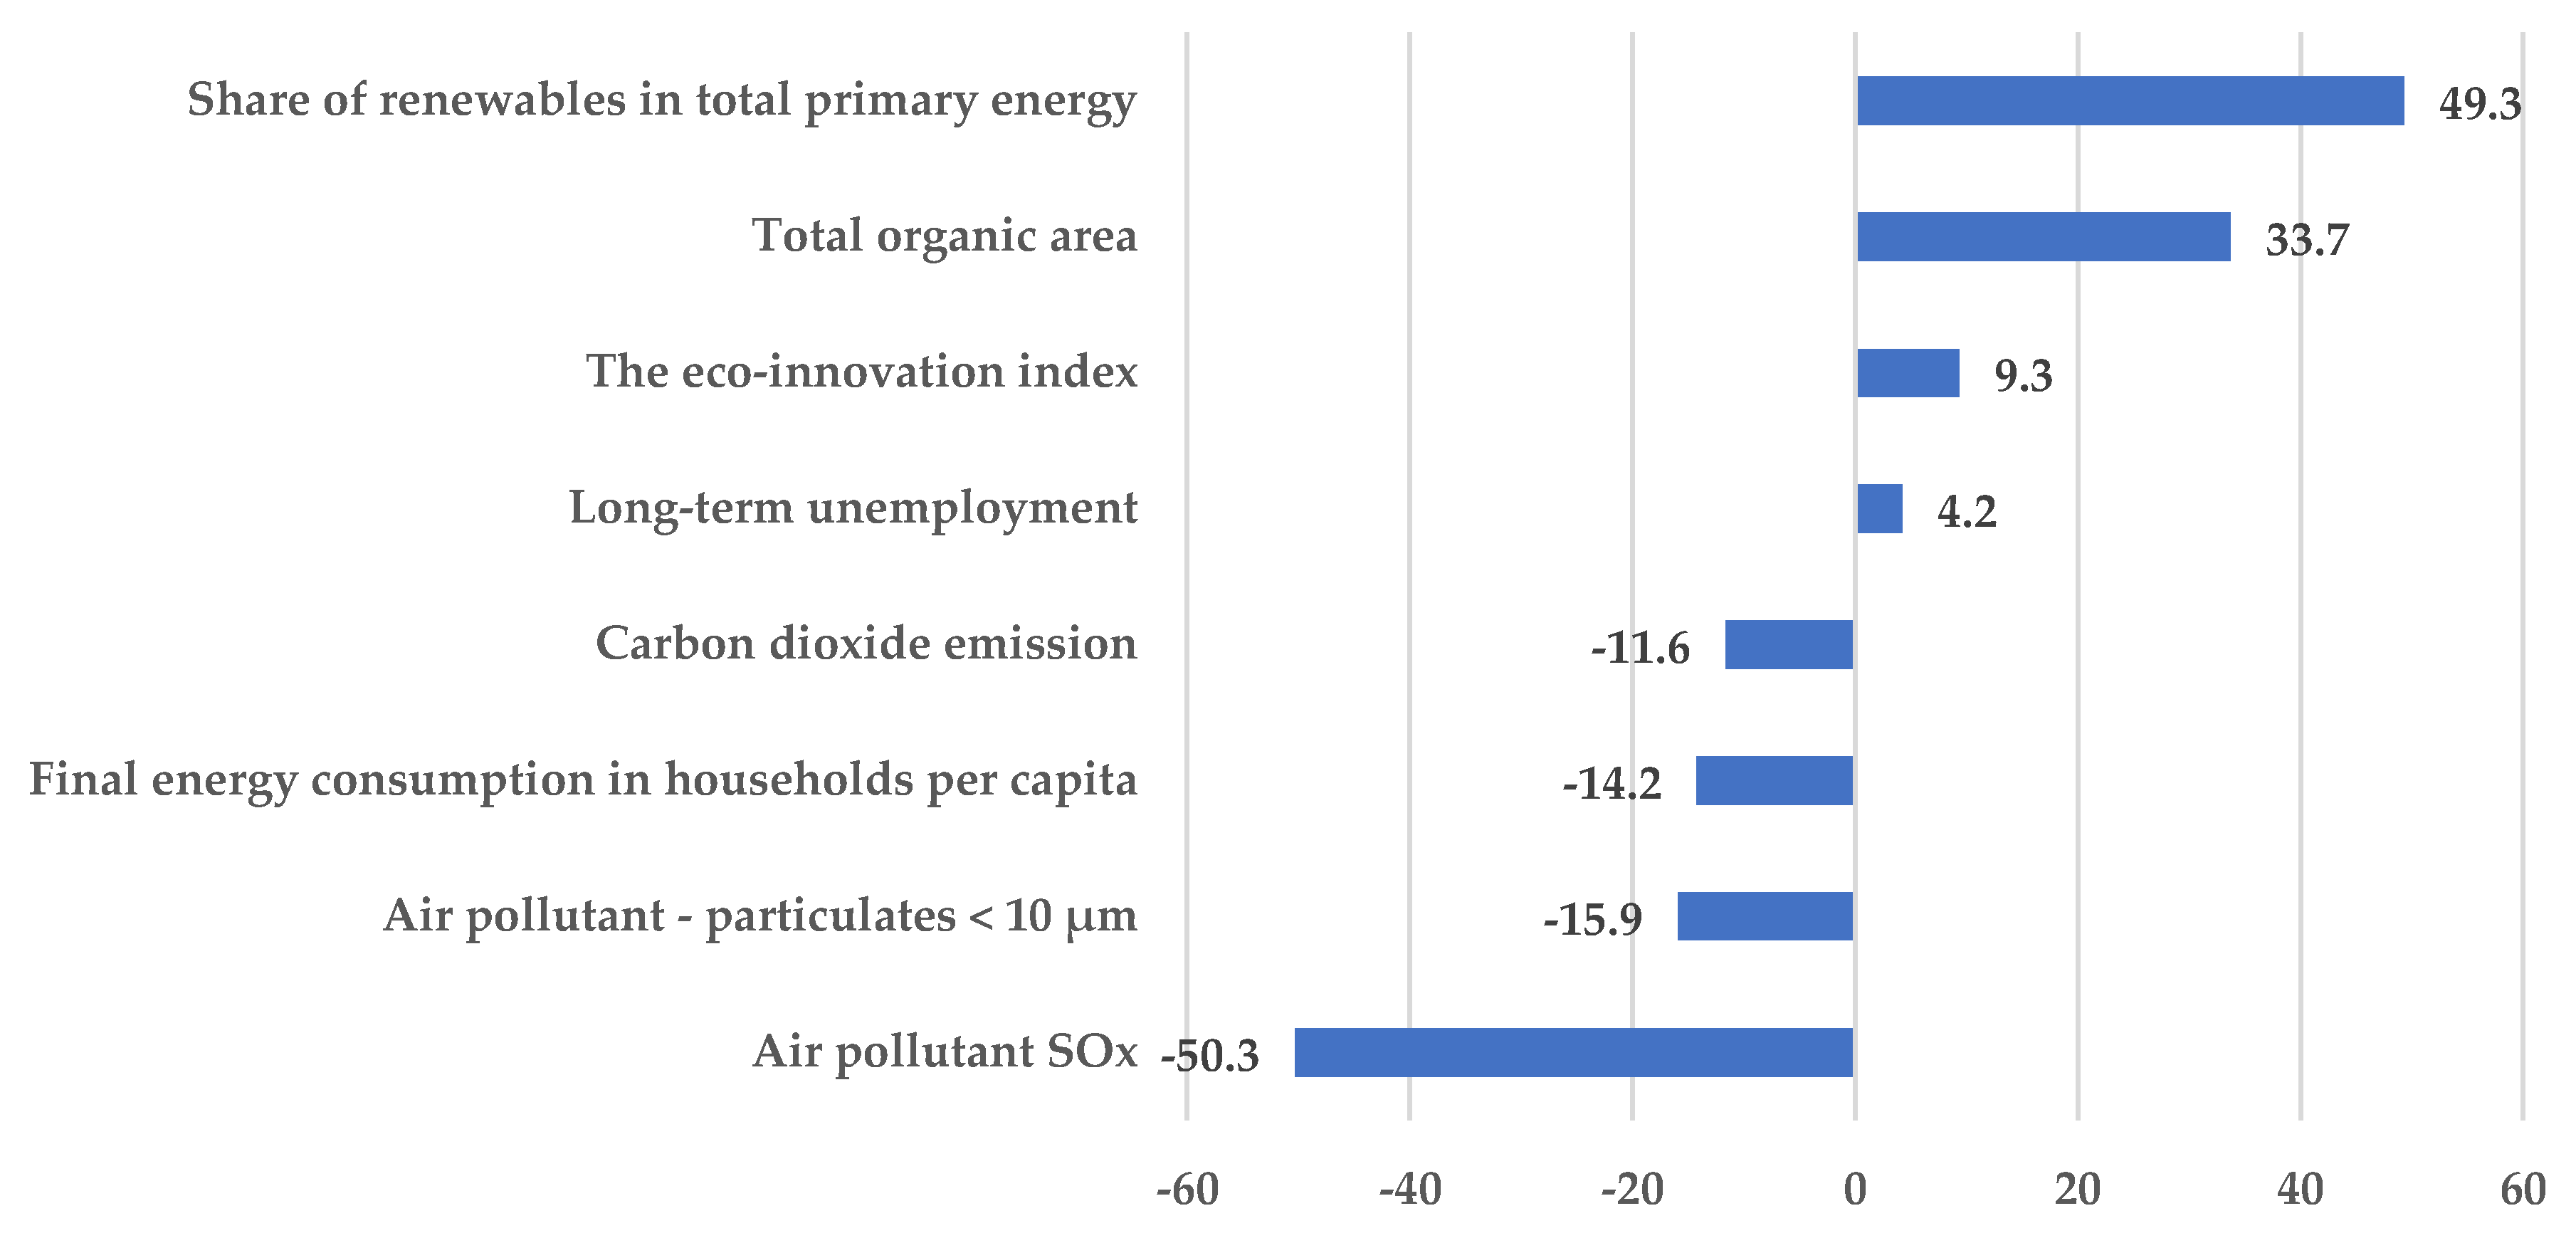
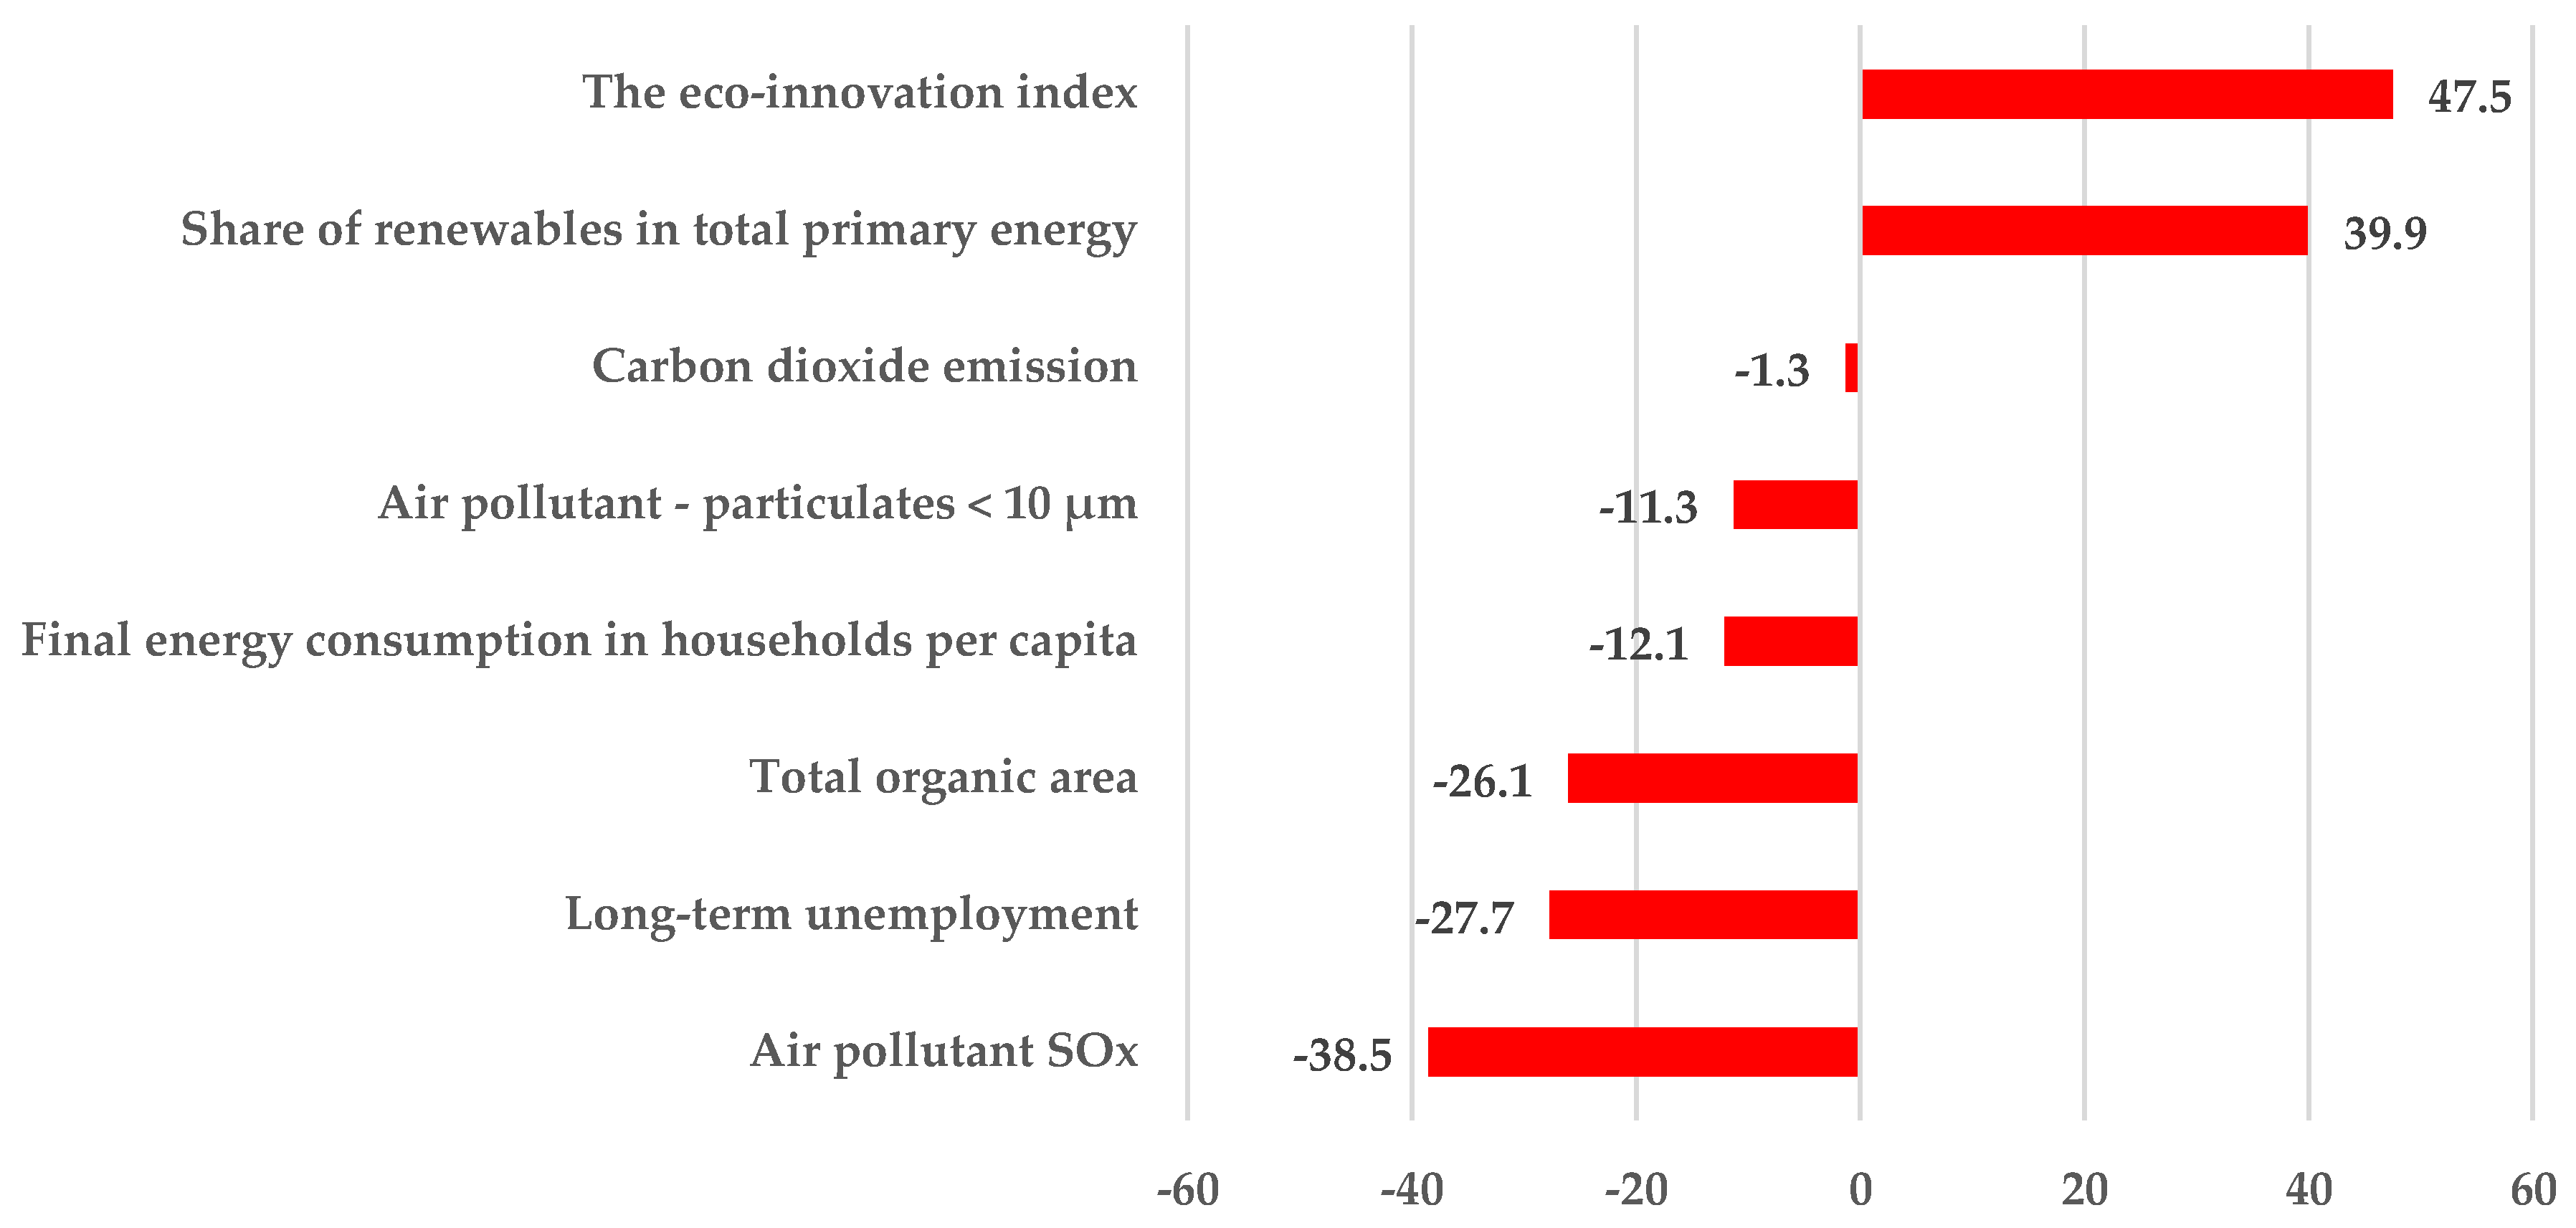
4. Analysis of Selected SDGs for EU-28 and Poland—Results and Discussion
5. Conclusions
Author Contributions
Funding
Conflicts of Interest
References
- Tutak, M.; Brodny, J.; Siwiec, D.; Ulewicz, R.; Bindzár, P. Studying the Level of Sustainable Energy Development of the European Union Countries and Their Similarity Based on the Economic and Demographic Potential. Energies 2020, 13, 6643. [Google Scholar] [CrossRef]
- Pultowicz, A. Przesłanki rozwoju rynku odnawialnych źródeł energii w Polsce w świetle idei zrównoważonego rozwoju. Probl. Sustain. Dev. 2009, 4, 109–115. [Google Scholar]
- Brodny, J.; Tutak, M.; Saki, S.A. Forecasting the Structure of Energy Production from Renewable Energy Sources and Biofuels in Poland. Energies 2020, 13, 2539. [Google Scholar] [CrossRef]
- Su, W.; Zhang, D.; Zhang, C.; Streimikiene, D. Sustainability assessment of energy sector development in China and European Union. Sustain. Dev. 2020, 28, 1063–1076. [Google Scholar] [CrossRef]
- Akadiria, S.; Ada, A.A.; Akadiria, C.; Alolab, U.V. Renewable energy consumption in EU-28 countries: Policy toward pollution mitigation and economic sustainability. Energy Policy 2019, 132, 803–810. [Google Scholar] [CrossRef]
- Brożyna, J.; Mentel, G.; Ivanová, E.; Sorokin, G. Classification of Renewable Sources of Electricity in the Context of Sustainable Development of the New EU Member States. Energies 2019, 12, 2271. [Google Scholar] [CrossRef] [Green Version]
- Pak, B.K.; Albayrak, E.; Erensal, Y.C. Renewable Energy Perspective for Turkey Using Sustainability Indicators. Int. J. Comput. Intell. Syst. 2015, 8, 187–197. [Google Scholar]
- Barbier, E.B. The concept of sustainable economic development. Environ. Conserv. 1987, 14, 101–110. [Google Scholar] [CrossRef]
- Holmberg, J.; Sandbrook, R. Sustainable development: What is to be done? In Policies for a Small Planet: From the International Institute for Environment and Development (19–38); Holmberg, J., Ed.; Earthscan Publications: London, UK, 1992. [Google Scholar]
- United Nations. The Sustainable Development Goals Report. 2020. Available online: https://unstats.un.org/sdgs/report/2020 (accessed on 20 October 2020).
- Udo, V.; Pawlowski, A. Human Progress towards Equitable Sustainable Development, part II: Empirical Exploration. Probl. Sustain. Dev. 2011, 6, 33–62. [Google Scholar]
- Ahmed, W.; Sarkar, B. Management of next-generation energy using a triple bottom line approach under a supply chain framework. Resour. Conserv. Recycl. 2019, 150, 4431. [Google Scholar] [CrossRef]
- Barbier, E.B.; Burgess, J.C. The sustainable development goals and the systems approach to sustainability. Economics: The Open-Access. Open-Assess. E J. 2017, 11, 1–23. [Google Scholar] [CrossRef] [Green Version]
- United Nations (UN). Transforming our World: The 2030 Agenda for Sustainable Development; United Nations: New York, NY, USA, 2015; Available online: https://sustainabledevelopment.un.org/post2015/transformingourworld/publication (accessed on 11 February 2021).
- Sachs, J.D. From millennium development goals to sustainable development goals. Lancet 2012, 379, 2206–2211. [Google Scholar] [CrossRef]
- Reyers, B.; Smith, S.M.; Erb, K.H.; Scholes, R.J.; Selomane, O. Essential Variables help to focus Sustainable Development Goals monitoring. Curr. Opin. Environ. Sustain. 2017, 26, 97–105. [Google Scholar] [CrossRef]
- Lu, Y.; Nakicenovic, N.; Visback, M.; Stevance, A.S. Five priorities for the UN sustainable development goals. Nature 2015, 520, 432–433. [Google Scholar] [CrossRef] [PubMed] [Green Version]
- Jacob, A. Mind the gap: Analyzing the impact of data gap in millennium development goals’ (MDGs) indicators on the progress toward MDGs. World Dev. 2017, 93, 260–278. [Google Scholar] [CrossRef]
- Hák, T.; Janoušková, S.; Moldan, B. Sustainable development goals: A need for relevant indicators. Ecol. Indic. 2016, 60, 565–573. [Google Scholar] [CrossRef]
- Barbier, E.B.; Burgess, J.C. Sustainable development goal indicators: Analyzing trade-offs and complementarities. World Devel. 2019, 122, 295–305. [Google Scholar] [CrossRef]
- Allen, C.; Metternicht, G.; Wiedmann, T. Prioritizing SDG targets: Assessing baselines, gaps and interlinkages. Sustain. Sci. 2019, 14, 421–438. [Google Scholar] [CrossRef]
- Ivanov, A.; Peleah, M. Sustainable Humand Development Index–A Pragmatic Proposal for Monitoring Sustainability within the Affordable Boundaries; IARIW Bank of Korea: Seoul, Korea, 2017. [Google Scholar]
- Commission of the European Communities. Green Book. Market Instruments for Environmental and Related Policy; Commission of the European Communities: Brussels, Belgium, 28 March 2007; Available online: https://ec.europa.eu/taxation_customs/consultations-get-involved/tax-consultations/green-paper-market-based-instruments-environment-related-policy-purposes_en (accessed on 19 October 2020).
- The Council of Ministers. Poland’s Energy Policy until 2030. 10 November 2009. Available online: https://www.google.com/search?client=firefox-b&q=Poland%27s+energy+policy+until+2030.+November+10%2C+2009.+The+Council+of+Ministers (accessed on 24 October 2020). (In Polish).
- The Accession Treaty of Poland to the EU. 16 April 2003. Available online: https://eur-lex.europa.eu/collection/eu-law/treaties/treaties-accession.html?locale=pl#new-2-30 (accessed on 20 October 2020).
- The 2020 Climate and Energy Package. Directive 2009/28/EC of the European Parliament and of the Council of 23 April 2009 on the Promotion of the Use of Energy from Renewable Sources, Amending and Subsequently Repealing Directives 2001/77/WE and 2003/30/WE. Available online: https://eur-lex.europa.eu/legal-content/PL/TXT/?uri=LEGISSUM:2001_8 (accessed on 24 October 2020).
- United Nations Framework Convention on Climate Change. 9 May 1992. Available online: http://isap.sejm.gov.pl/isap.nsf/DocDetails.xsp?id=wdu19960530238 (accessed on 22 October 2020).
- Energy from Renewable Sources in 2018. GUS Warszawa 2019. Available online: https://www.google.com/searchclient.firefox-b-d&q16.09Energy+from+renewable+sources+in+2018 (accessed on 21 July 2020).
- The European Green Deal COM/2019/640. Communication from the Commission to the European Parliament, the European Council, the Council, the European Economic and Social Committee and the Committee of the Regions. Available online: https://eur-lex.europa.eu/legal-content/EN/TXT/uriCOM3A20193A6403AFIN(COM(2019)640 (accessed on 21 June 2020).
- Dychkovskyi, R.; Tabachenko, M.; Zhadiaieva, K.; Cabana, E. Some aspects of modern vision for geoenergy usage. E3S Web Confer. 2019, 123, 1010. [Google Scholar] [CrossRef]
- Eurostat. 2020. Available online: https://ec.europa.eu/eurostat/data/database (accessed on 5 January 2021).
- Report of the Inter-Agency and Expert Group on Sustainable Development Goal Indicators (E/CN.3/2016/2/Rev.1). The Report of the UN Statistical Commission. 2016. Available online: https://unstats.un.org/sdgs/iaeg-sdgs/report-iaeg-sdgs (accessed on 20 October 2020).
- Urbaniec, M. Sustainable development indicators for Poland: Central Statistical Office and Statistical Office in Katowice. Entrep. Bus. Econ. Rev. 2015, 3, 119–134. (In Polish) [Google Scholar]
- Czech, T.; Sobczyk, A.T.; Jaworek, A.; Krupa, A. Comparison of Physical Properties of Fly Ashes from Hard Coal, Lignite and Biomass Combustion. Conference Materials POL-EMIS. 2012, pp. 73–82. Available online: http://www.pzits.not.pl/docs/ksiazki/Pol_%202012/Czech%2073-82.pdf (accessed on 16 July 2020). (In Polish).
- Zarzycki, G.; Wielgosinski, G. Technologies and Processes of Air Protection; Polish Scientific Publishers PWN: Poland, Warsaw, 2018. (In Polish) [Google Scholar]
- Economic Activity of the Polish Population. Q4 2017. Information and Statistical Studies. GUS Warsaw 2018. Available online: www.stat.gov.pl (accessed on 22 July 2020). (In Polish)
- Murawska, A. Factors Differing the Level of Unemployment in Rural Households in Poland. Association of Agricultural and Agribusiness Economists. Sci. Ann. 2015, 17, 283–289. (In Polish) [Google Scholar]
- Wielewska, I. The development of renewable energy sources in rural areas and their impact on the natural environment, in the opinions of agricultural advisors. Sci. Pap. Wars. Univ. Life Sci. Probl. World Agric. 2014, 14, 186–195. (In Polish) [Google Scholar]
- Sobczyk, W.; Kowalska, A. The techniques of producing energy from biomass. TEKA Comm. Mot. Energetics Agric. 2012, 12, 257–261. [Google Scholar]
- Malada, A.; Sobczyk, W. Growing energy crops as a form of activation of rural environments. Sci. J. Dep. Process Eng. University Opole 2005, 2, 92–98. (In Polish) [Google Scholar]
- Sobczyk, W. Yielding basket willow–In the light of research. Polityka Energetyczna 2007, 10, 547–556. (In Polish) [Google Scholar]
- Sobczyk, W. Evaluation of harvest of energetic basket willow. TEKA Comm. Mot. Energetics Agric. 2011, 11, 343–352. [Google Scholar]
- Sobczyk, W. Sustainable development of rural areas. Probl. Sust. Dev. 2014, 9, 119–126. [Google Scholar]
- Sobczyk, W.; Sternik, K.; Sobczyk, E.J.; Noga, H. Yield evaluation of willow fertilized with sewage sludge. Ann. Set Env. Prot. 2015, 17, 1113–1124. [Google Scholar]
- Sobczyk, W. The Use of Biomass for Energy Production. Int. J. N. Technol. Sci. Eng. 2016, 3, 35–40. [Google Scholar]
- Wielewska, I.; Sobczyk, W.; Gliniak, M. Energy from Renewable Sources as Social Welfare in the Opinions of Polish Farmers. Folia Pomer. Univ. Technol. Stetin. Oeconomica 2017, 333, 91–100. (In Polish) [Google Scholar] [CrossRef]
- International Renewable–International Renewable Energy Agency (IRENA). Available online: http://www.irena.org (accessed on 21 June 2020).
- GUS. Energy Consumption in Households in 2018. 2019. Available online: https://stat.gov.pl/obszary-tematyczne/srodowisko-energia/energia/zuzycie-energii-w-gospodarstwach-domowych-w-2018,12,1.html.pl (accessed on 22 June 2020). (In Polish)
- The Number of Organic Producers, as at 31 December 2018 in Poland, in the Structure of the Voivodeships and of the Categories of Activity. Available online: https://www.gov.pl/web/ijhars/dane-o-rolnictwie-ekologicznym (accessed on 1 July 2020). (In Polish)
- Kyoto Protocol. Available online: https://pl.wikipedia.org/wiki/ProtokC3B3C582_Kioto.veaction (accessed on 1 July 2020).
- Green Projects. Available online: https://www.green-projects.pl/najwieksi-emitenci-co2-niechlubny-ranking (accessed on 20 July 2020). (In Polish).
- National Energy and Climate Plan for 2021–2030. Assumptions and Goals as well as Policies and Activities; Minister of State Assets: Warsaw, Poland, 30 December 2019. [Google Scholar]
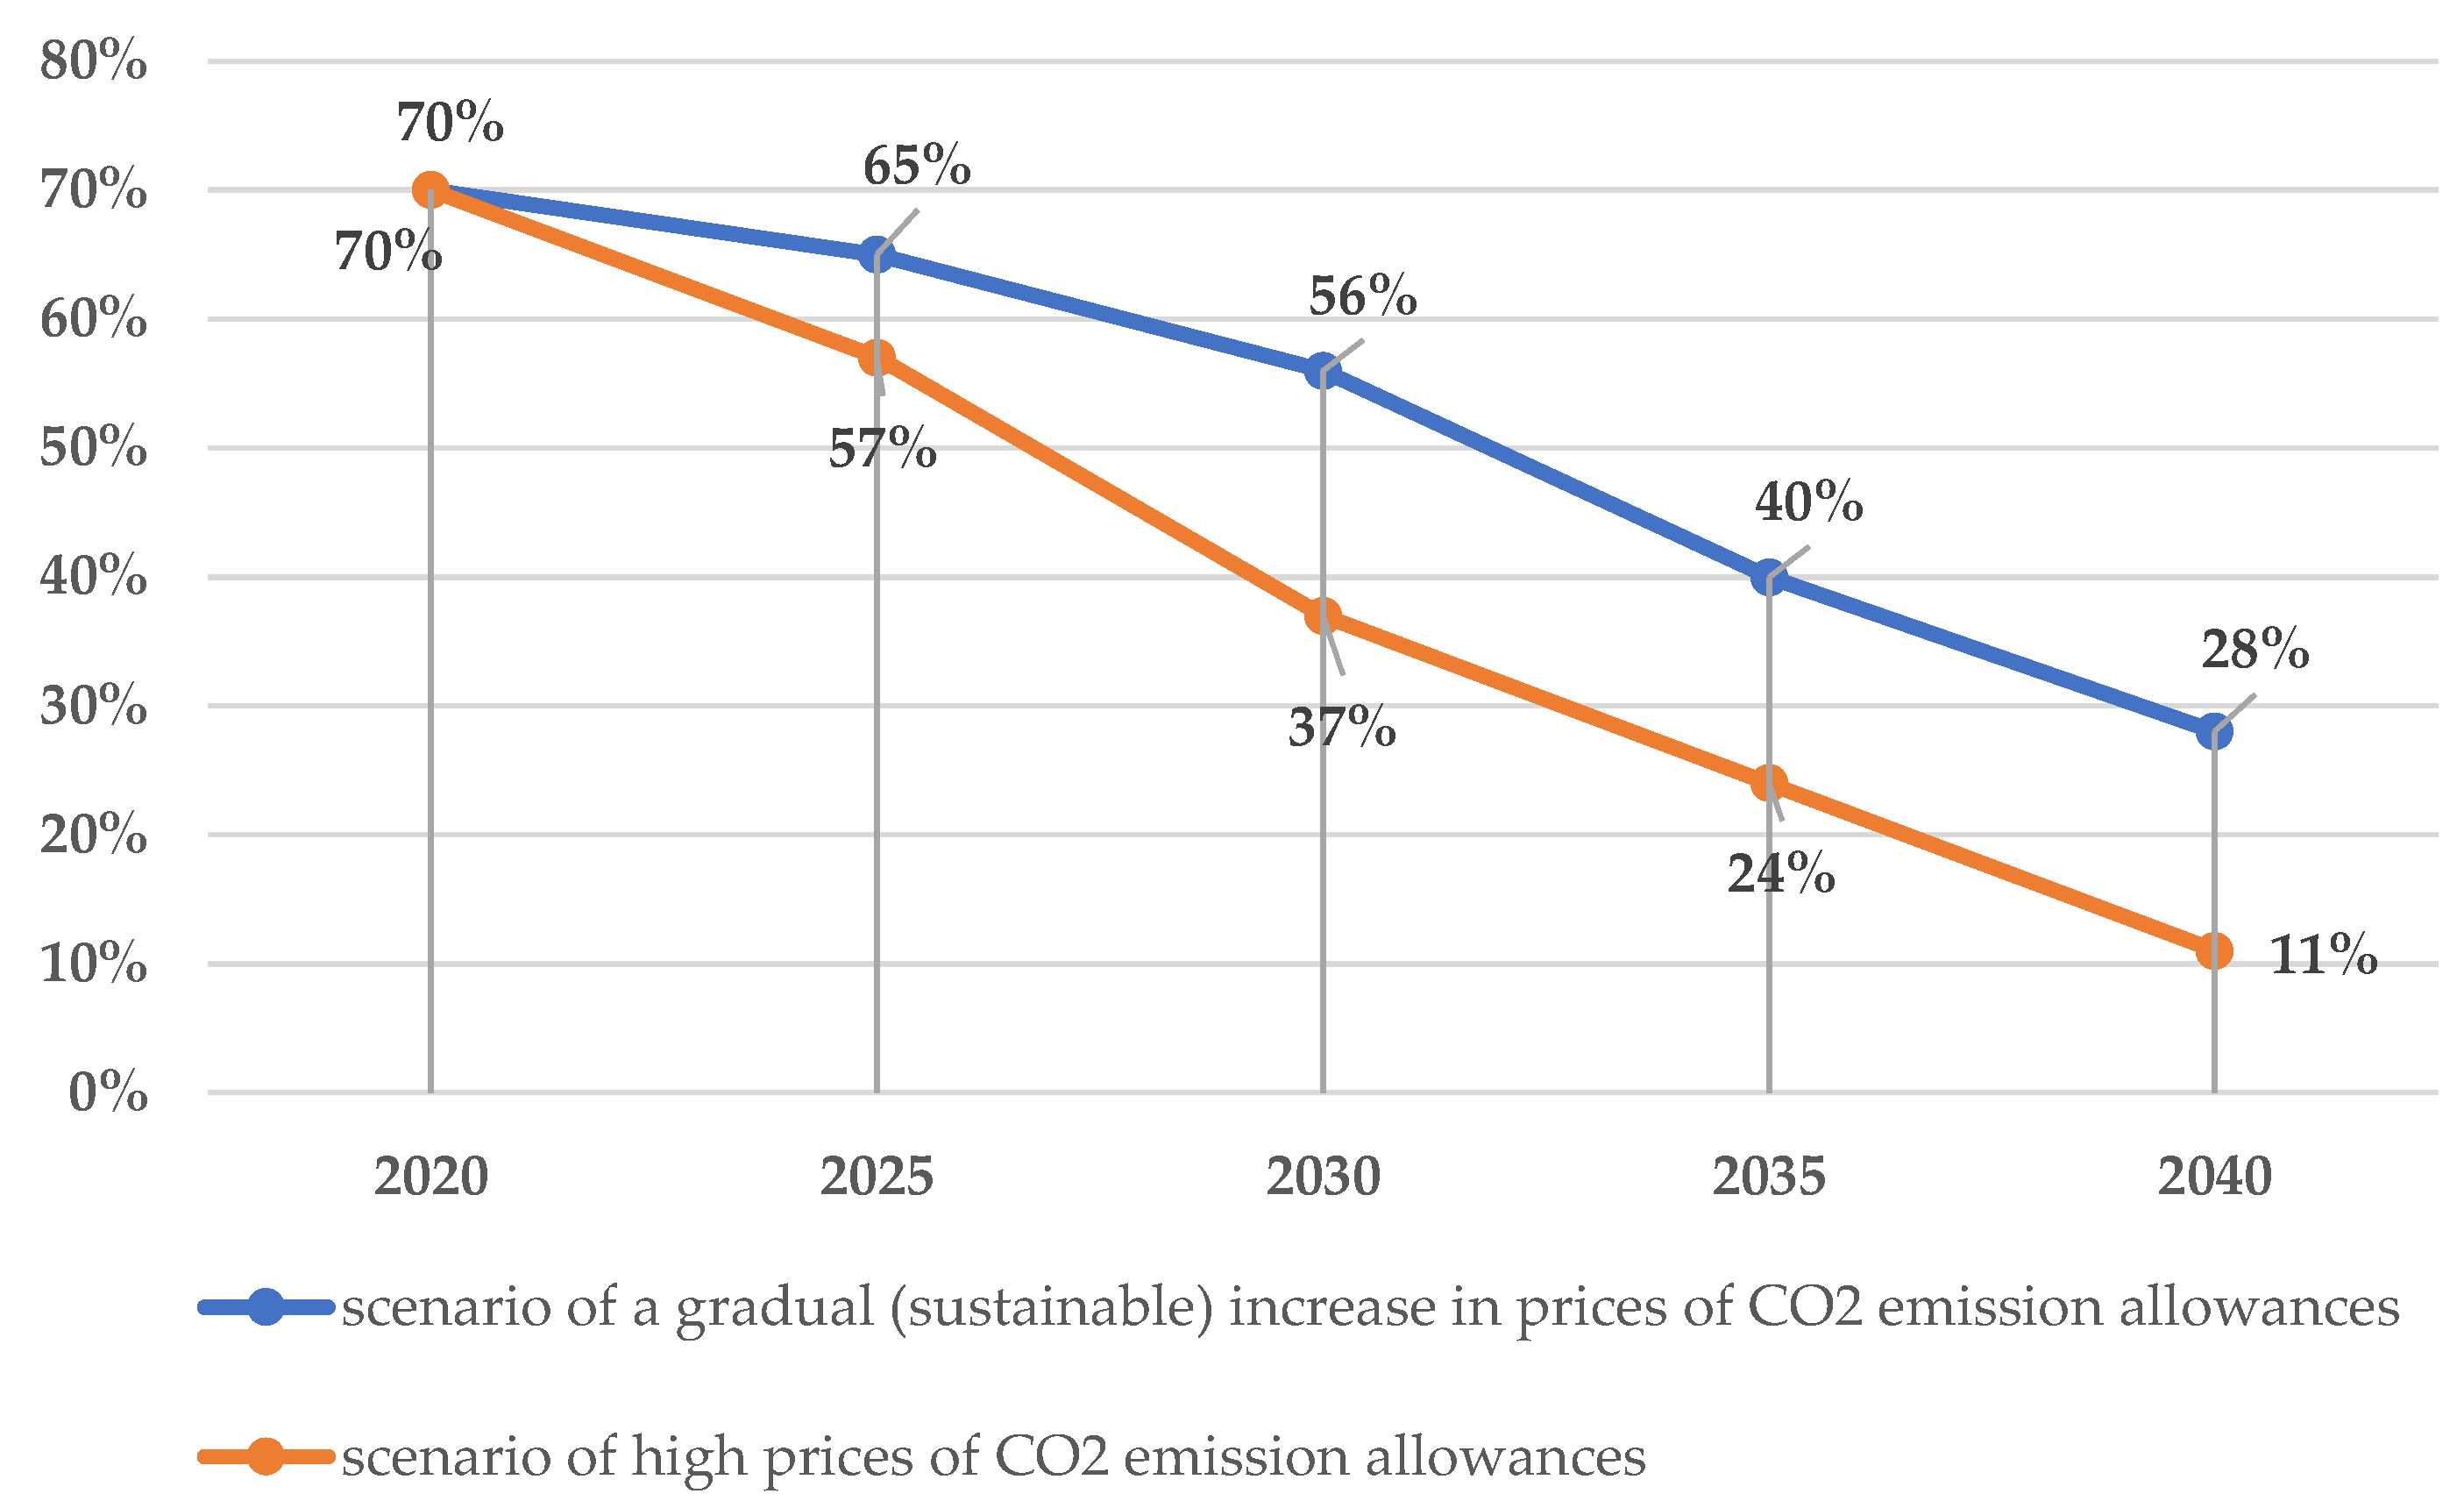
- Energy Policy for Poland by 2040. Development Strategy for the Fuel and Energy Sector (PEP2040). Ministry of State Assets. Available online: https://www.gov.pl/web/aktywa-panstwowe/zaktualizowany-projekt-polityki-energetycznej-polski-do-2040-r (accessed on 20 October 2020). (In Polish)
- Energy Policy for Poland by 2050; ver. 0.6; The Ministry of Economy: Warsaw, Poland, 2015. (In Polish)
- Resolution No. XVIII/243/16 of the Council of the Małopolska Province of 15 January 2016 on the introduction of restrictions in the operation of installations in which fuel combustion takes place in the area of the Municipality of Krakow. Available online: http://edziennik.malopolska.uw.gov.pl/ActDetails.aspx?year=2016&poz=812 (accessed on 1 December 2020). (In Polish)
- Małopolska in a Healthy Atmosphere. Effects of Implementation. Available online: https://powietrze.malopolska.pl/program-ochrony-powietrza/efekty-realizacji (accessed on 20 October 2020). (In Polish).
- Bezyk, Y.; Sowka, I. Trends and Forecasts of Emissions of Selected Greenhouse Gases in Europe; Kotowski, A., Piekarska, K., Kazmierczak, B., Eds.; Interdisciplinary Issues in Engineering and Environmental Protection: Washington, DC, USA, 2015; Volume 6, pp. 22–39. (In Polish) [Google Scholar]
- Act of 11 January 2018 on Electromobility and Alternative Fuels. Available online: https://sip.lex.pl/akty-prawne/dzu-dziennik-ustaw/elektromobilnosc-i-paliwa-alternatywne-18683445 (accessed on 13 December 2020). (In Polish).
- Więcek, K.A.; Suszanowicz, D. Air pollution in European countries and life expectancy–Modelling with the use of neural network. Air Qual. Atmosph. Health 2019, 12, 1335–1345. [Google Scholar] [CrossRef] [Green Version]
- Suszanowicz, D.; Więcek, K.A. The impact of green roofs on the parameters of the environment in urban areas–Review. Atmosphere 2019, 10, 792. [Google Scholar] [CrossRef] [Green Version]
- Walus, M. Proekologiczne Zmiany w Komunikacji Miejskiej. Nowoczesne Tramwaje i Autobusy, Przesiadka na Rowery. 11 December 2020. Available online: https://krakow.wyborcza.pl/krakow/7,44425,26593428,rower-na-trudne-czasy.html?disableRedirects=true (accessed on 12 December 2020). (In Polish).
- Tonkha, O.; Mehbaliyeva, N.; Nagorniuk, O. Professional adaptation of the future agronomist as a psychological and pedagogical problem. Educ. Technol. Comput. Sci. 2019, 4, 247–254. [Google Scholar] [CrossRef]
- Ceny Praw do Emisji CO2 Ponownie Zaskakują. 20 July 2020. Available online: https://wysokienapiecie.pl/30756-ceny-praw-emisji-co2-ponownie-zaskakuja (accessed on 15 December 2020). (In Polish).
- Renewable Energy Association: GUS: Increase in the Share of Energy from Renewable Sources in Gross Final Energy Consumption in 2018. Available online: http://seo.org.pl/gus-wzrost-udzialu-energii-ze-zrodel-odnawialnych-w-koncowym-zuzyciu-energii-brutto-w-2018 (accessed on 22 July 2020). (In Polish).
- Ministry of Climate and Environment. Poland’s Energy Policy until 2040. 2 February 2021. Available online: https://www.gov.pl/web/klimat/polityka-energetyczna-polski (accessed on 20 February 2021).
- Regulation of the Minister of the Environment of 2 August 2012 on Zones Where Air Quality Is Assessed. Available online: http://isap.sejm.gov.pl/isap.nsf/DocDetails.xsp.id=WDU20120000914 (accessed on 23 July 2020). (In Polish)
- Anteconomics and Anti-Ecology, That Is Energy from Imported Biomass. 23 December 2015. Available online: https://www.salon24.pl/u/energetyka (accessed on 3 July 2020). (In Polish).
- Pradhan, P.; Costa, L.; Rybski, D.; Lucht, W.; Kropp, J.P. A systematic study of Sustainable Development Goal (SDG) interactions. Earth’s Future 2017, 5, 1169–1179. [Google Scholar] [CrossRef] [Green Version]
- Nagornyuk, O.M.; Palapa, N.V.; Temchenko, V.V. The value of material and technical support of organic production technologies for eco-safety of the agrosphere of Ukraine. Agroecol. J. 2019, 4, 42–49. Available online: http://journalagroeco.org.ua/issue/view/11465/showToc (accessed on 25 July 2020). [CrossRef]


| Specification | 2010 | 2018 | 2010 | 2018 | 2010 | 2018 |
|---|---|---|---|---|---|---|
| Total Primary Energy Generation | Share of Renewables in Total Primary Energy Generation (%) | |||||
| Total (PJ) | Renewable Energy Sources (PJ) | |||||
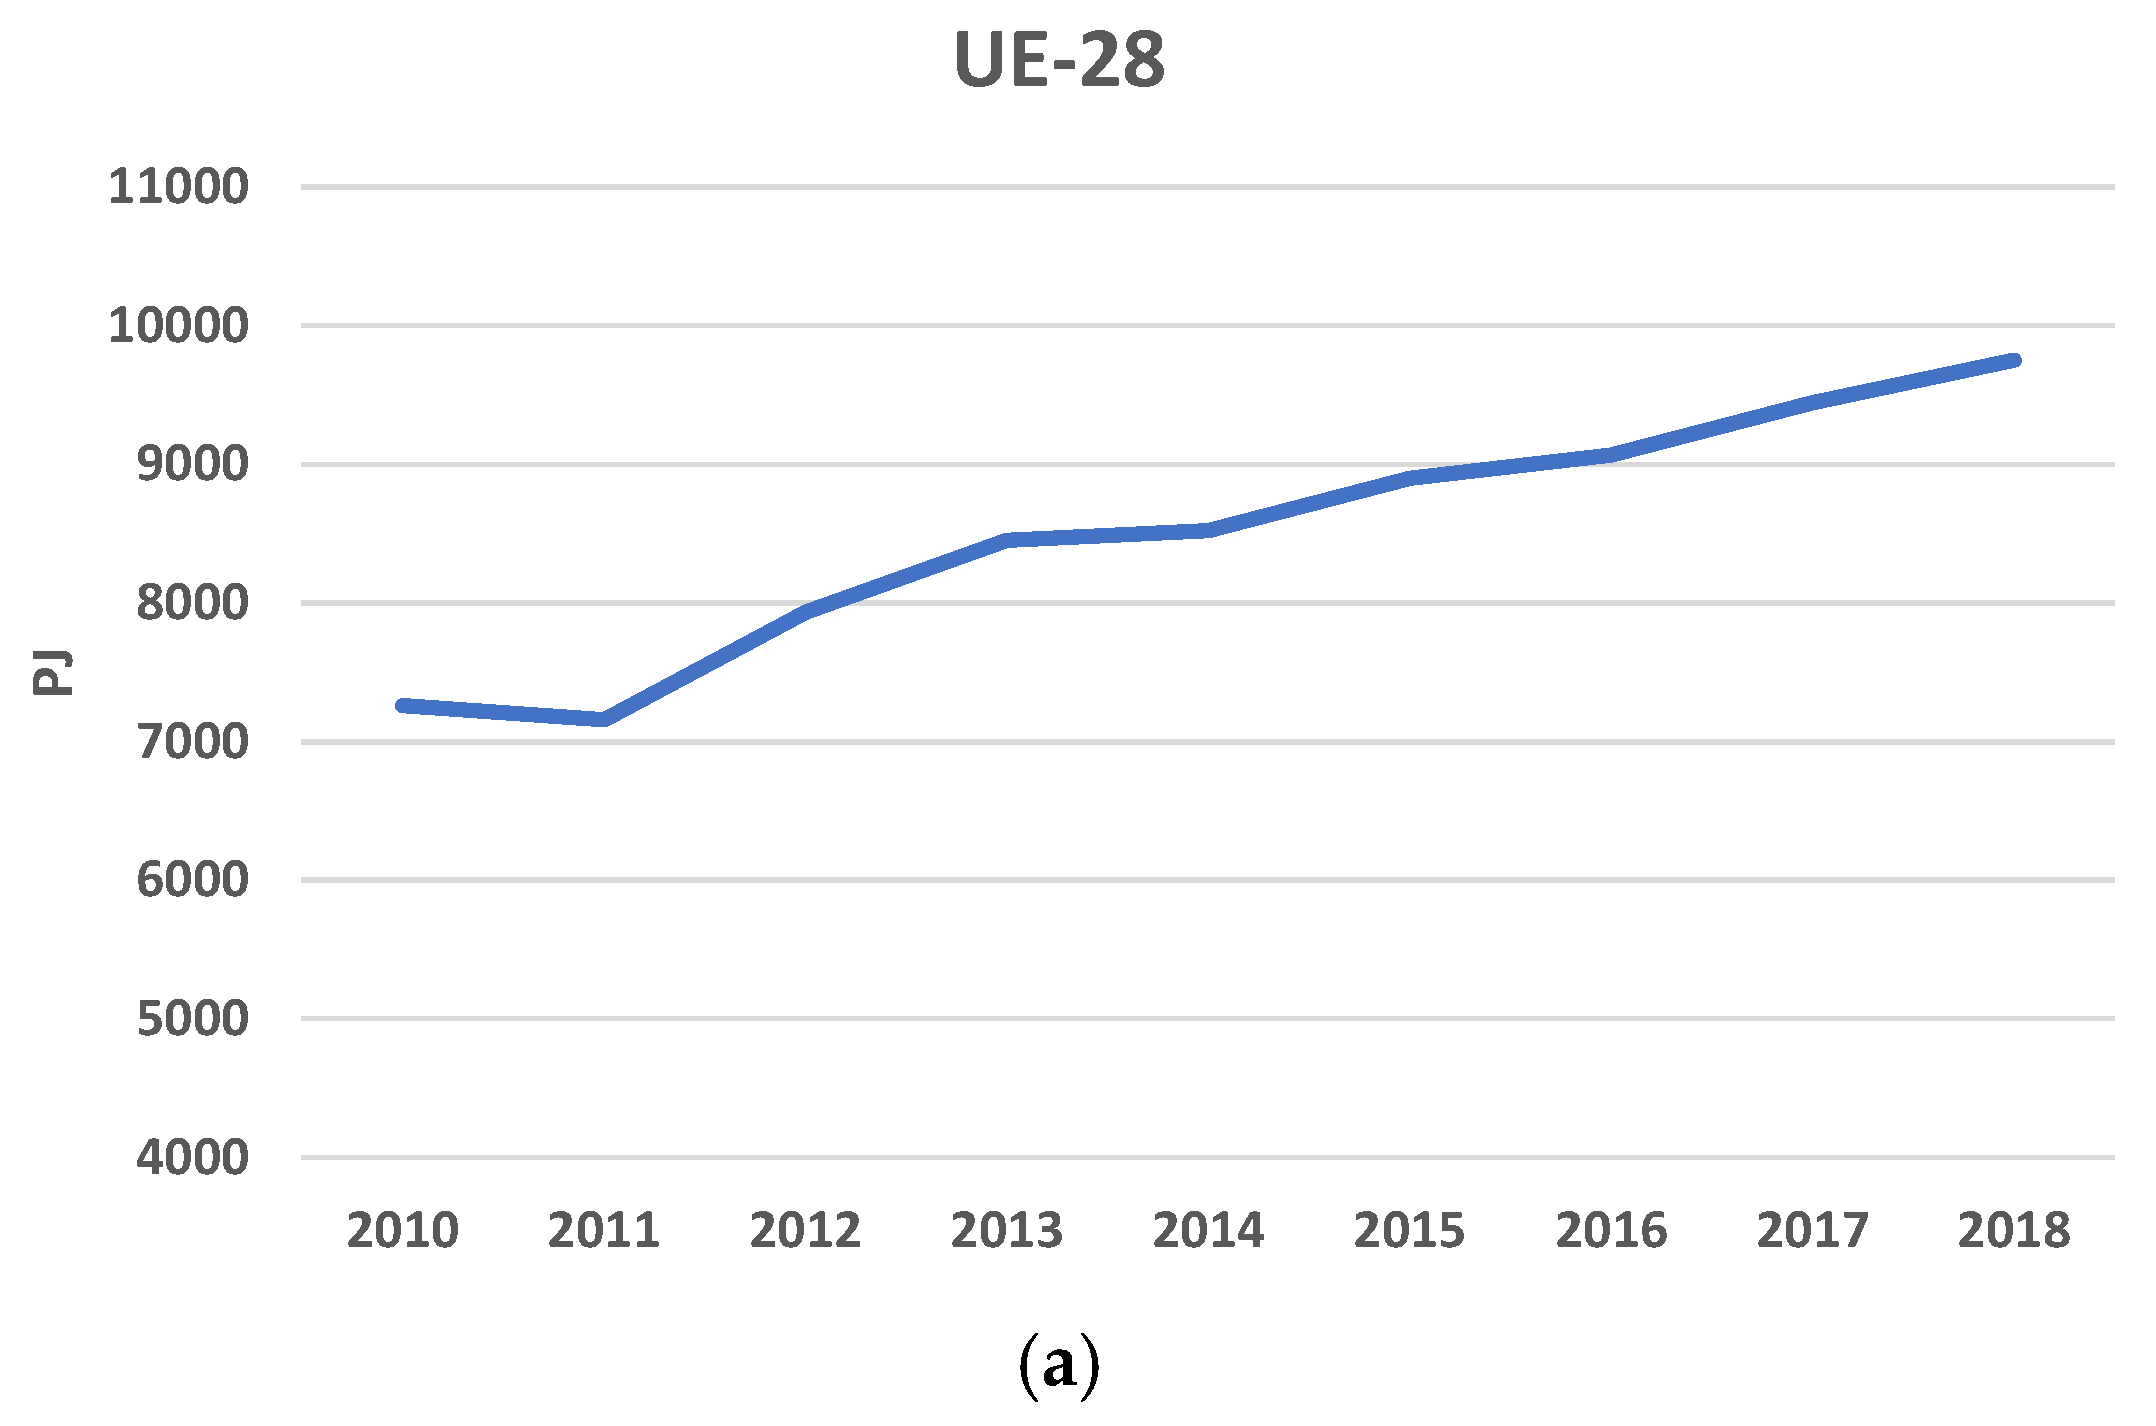
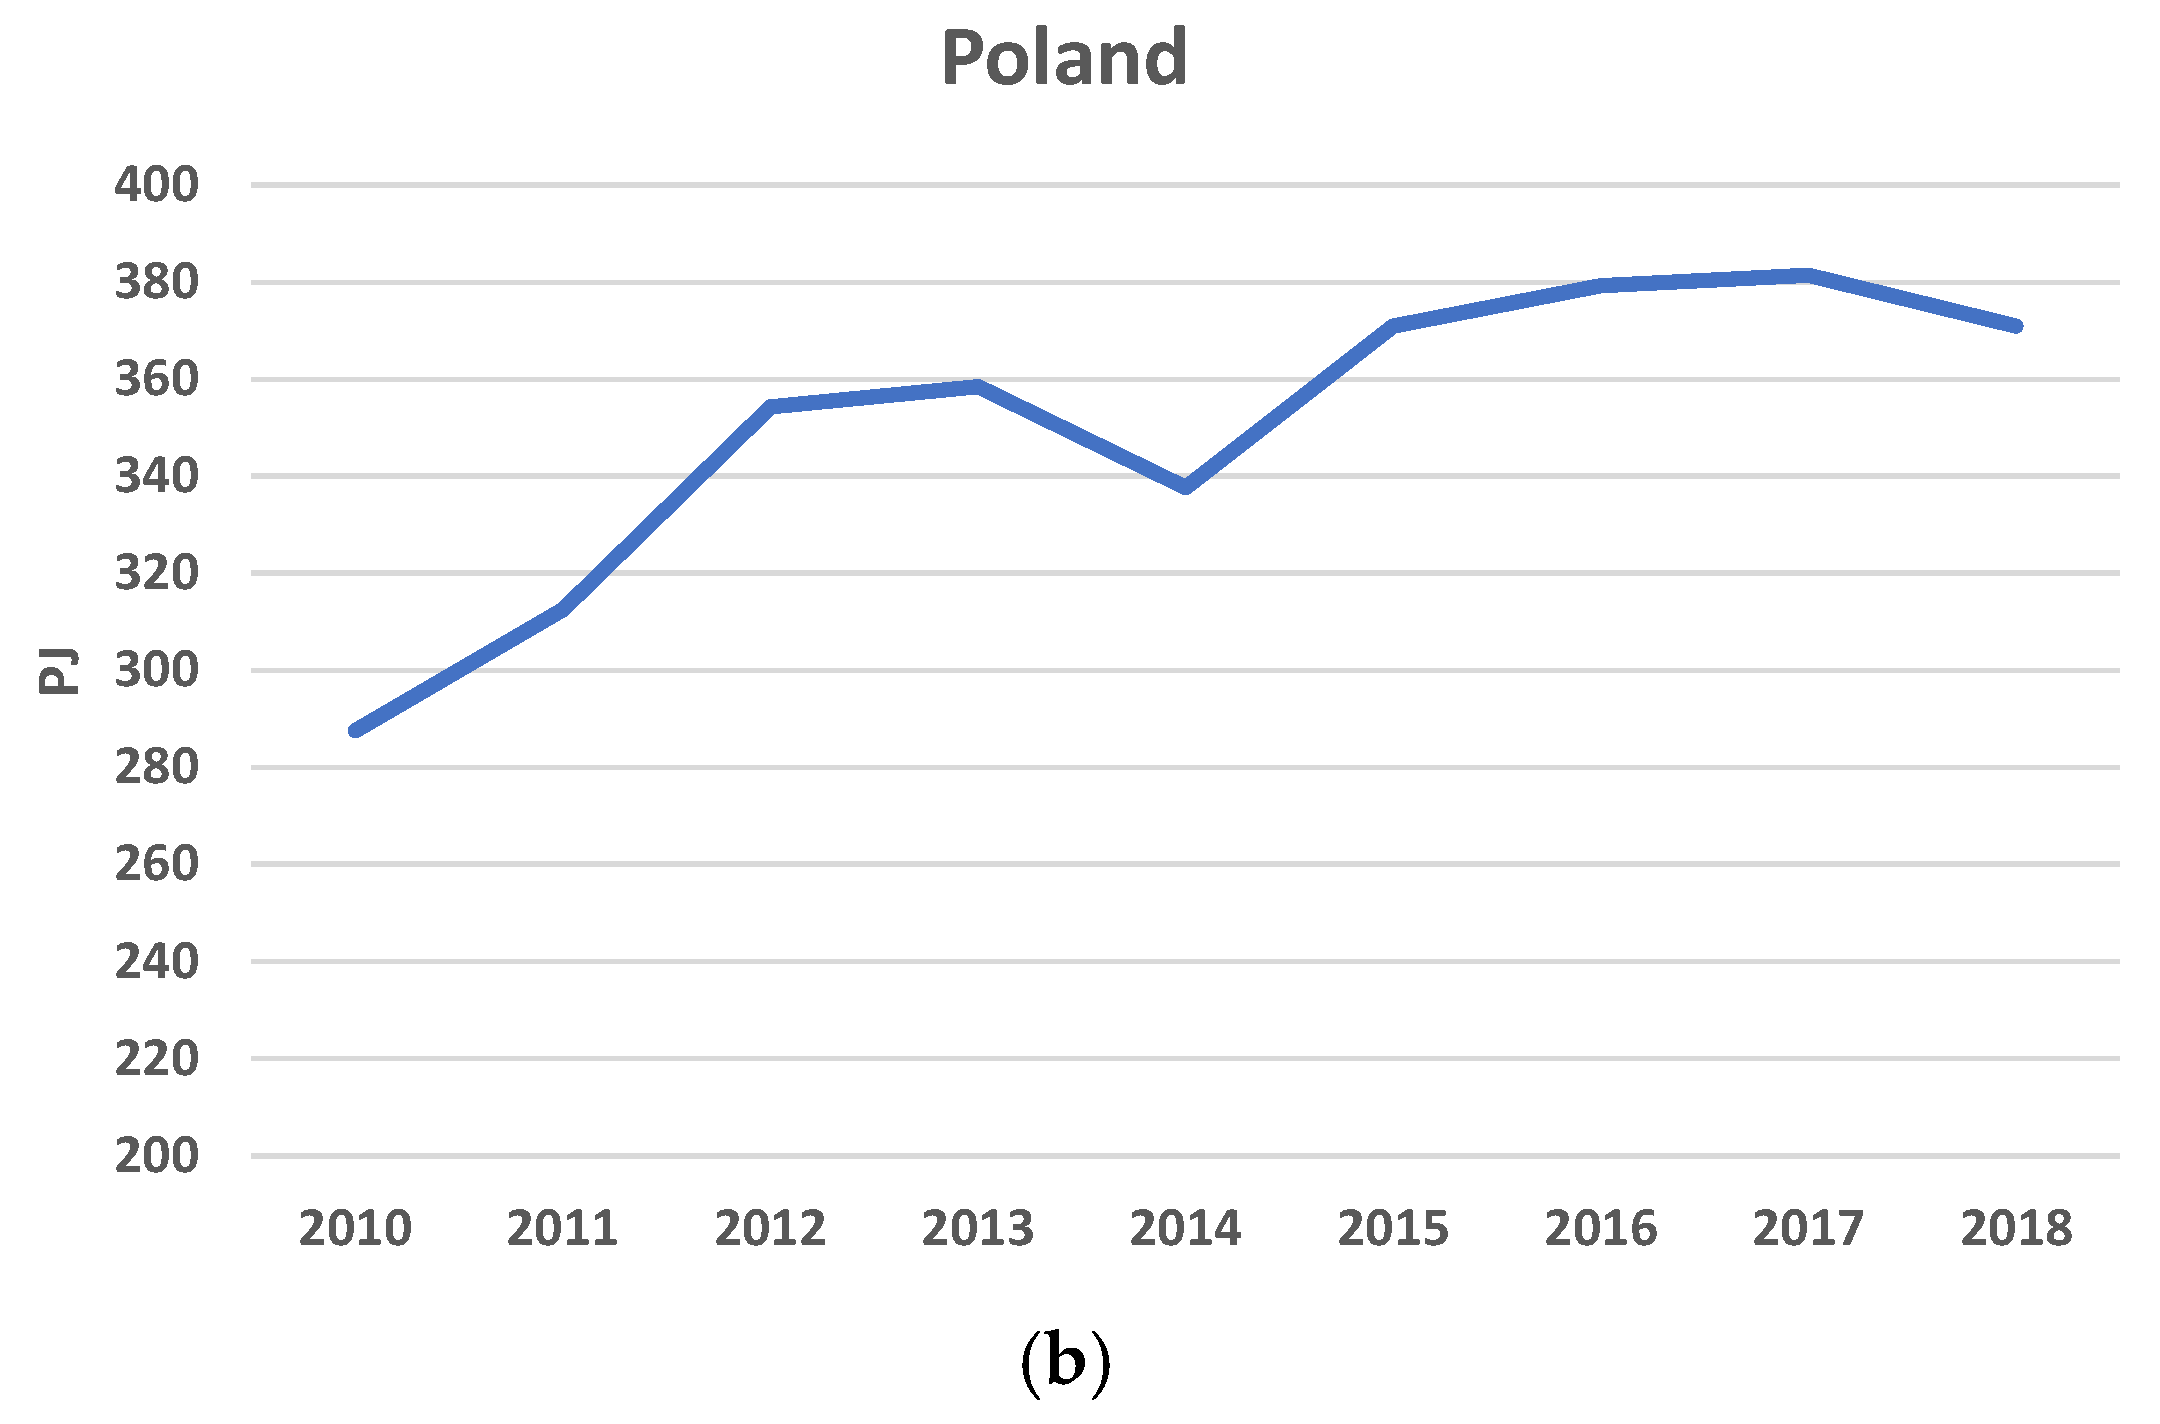
| Poland | 2784 | 2559 | 288 | 371 | 10.3 | 14.5 |
| EU-28 | 35,103 | 31,510 | 7261 | 9749 | 20.7 | 30.9 |
| Long-Term Unemployment (%) | |||
|---|---|---|---|
| EU-28 | Poland | ||
| 2010 | 2018 | 2010 | 2018 |
| 42.9 | 44.7 | 37.2 | 26.9 |
| Indicator | EU-28 | Poland | ||||||
|---|---|---|---|---|---|---|---|---|
| 2010 | 2018 | % Change | Outcome | 2010 | 2018 | % Change | Outcome | |
| The eco-innovation index | 86.0 | 94.0 | 9.3 | Improving | 40.0 | 59.0 | 47.5 | Improving |
| Total organic area (mln ha) | 10.05 | 13.4 | 33.7 | Improving | 0.65 | 0.48 | −26.1 | Declining |
| Long-term unemployment (%) | 42.9 | 44.7 | 4.2 | Declining | 37.2 | 26.9 | −27.7 | Improving |
| Carbon dioxide emissions (Mt) | 3922.9 | 3466.5 | −11.6 | Improving | 323.8 | 319.5 | −1.3 | Improving |
| Final energy consumption in households per capita (kgoe) | 643.0 | 552.0 | −14.2 | Improving | 578.0 | 508.0 | −12.1 | Improving |
| Air pollutant SOx (Mt) | 4.1 | 2.04 | −50.3 | Improving | 0.82 | 0.50 | −38.5 | Improving |
| Air pollutant-particulates < 10 µm (Mt) | 2.4 | 1.99 | −15.9 | Improving | 0.27 | 0.24 | −11.3 | Improving |
| Share of renewables in total primary energy (%) | 20.7 | 30.9 | 49.3 | Improving | 10.3 | 14.5 | 39.9 | Improving |
| Composite Index | 180.1 | 152.3 | ||||||
Publisher’s Note: MDPI stays neutral with regard to jurisdictional claims in published maps and institutional affiliations. |
© 2021 by the authors. Licensee MDPI, Basel, Switzerland. This article is an open access article distributed under the terms and conditions of the Creative Commons Attribution (CC BY) license (http://creativecommons.org/licenses/by/4.0/).
Share and Cite
Sobczyk, W.; Sobczyk, E.J. Varying the Energy Mix in the EU-28 and in Poland as a Step towards Sustainable Development. Energies 2021, 14, 1502. https://doi.org/10.3390/en14051502
Sobczyk W, Sobczyk EJ. Varying the Energy Mix in the EU-28 and in Poland as a Step towards Sustainable Development. Energies. 2021; 14(5):1502. https://doi.org/10.3390/en14051502
Chicago/Turabian StyleSobczyk, Wiktoria, and Eugeniusz Jacek Sobczyk. 2021. "Varying the Energy Mix in the EU-28 and in Poland as a Step towards Sustainable Development" Energies 14, no. 5: 1502. https://doi.org/10.3390/en14051502