1. Introduction
Lithium-ion batteries are the most popular type of rechargeable battery owing to their low cost, long life, reliability, and relative environment friendliness. Most electronic devices like laptop computers and mobile phones use lithium-ion batteries as their power source [
1], and their use in automotive and aerospace applications has also become a reality [
2,
3]. Since these batteries are electrochemical power sources, they have great potential for use in large-scale applications. Hence, improvising their efficiency, robustness and specific charging/discharging capability are key research focus areas [
4,
5]. Li-ion batteries are categorized as energy storage systems which depend on insertion reactions for both positive and negative electrodes where lithium ions are the charge carriers. Li-ion batteries constitute multiple cell chemistries in accordance with this definition [
6].
The anodes are generally carbon-based, lithium metal, lithium titanate, or alloy based (e.g., silicon-based), while cathodes are intercalating compounds permitting lithium ions to enter and exit [
5,
7]. Charging (lithiation) involves the lithium-ion accumulation on the anode after passing through the electrolyte from the cathode, and the opposite happens during the de–lithiation/discharging process. In electrode materials, expansion and contraction during lithiation/charging, delithiation/discharging process due to stresses induced by diffusion are common phenomenon. Such volume changes often lead to mechanical damages such as deformation, capacity fade and electrode fracture [
8,
9].
Silicon was selected as the anode material in this work. It has a gravimetric capacity of 4200 mAh/g even at low potentials, making it ideal for large scale applications like electric vehicles. A major concern with silicon is that it has a significant volume expansion of as high as 400% during lithiation. This generates strain, leading to cracking and then capacity fade, and eventual disintegration of the silicon electrode [
10]. Silicon anode degradation can also occur due to the quality of the solid-electrolyte interface (SEI) developed from the solvent and salt decomposition in the electrolyte. During the first insertion phase of lithium into the electrode, a SEI layer is formed between the electrode and the electrolyte which acts like a barrier. The purpose of the barrier is to provide for conduction of lithium ions, electron flow insulation, and limiting electrolyte disintegration, all of which prevents the continuous reduction of the battery’s cycle performance [
11,
12]. Electrode particulate design structures such as nanowires, nanotubes, nanofibers, porous structures, and solid core-shell, yolk shell and hollow core shell structures, have been proposed to address specific Si electrode issues such as Si pulverization, electrical contact loss and fracture of the solid electrolyte interphase. Since Si nanoparticles have good electrochemical properties and can easily be mass produced, there is a need to select and optimize the particle structure and size.
Battery modeling is a cost-effective way to design optimized batteries and can reduce the time and cost of development by providing insight into the effect of design parameters and operating conditions on the performance of the battery, including the efficiency, safety, and degradation of batteries [
13]. It was shown that the losses in capacity are linked to phase changes in the inserted electrode materials, active material dissolution, passive film formation, etc [
14]. Consumption of lithium ions at the anode during the cell charge and cathode dissolution are considered as major factors for capacity losses [
14,
15,
16]. Based on these issues, further modeling studies have shown that increased impedance at both the electrodes and loss of active lithium at negative electrode contribute to the irreversible capacity losses [
15]. Identification and measurement of the design variables are two important factors which are regulated with validated modeling to support experimental work to improve battery operation. There are several different types of battery models, including empirical, electrochemical, and atomistic/molecular models [
13,
17].
Electrochemical models are considered to be the best tools to explore the design parameters and their influence on the performance of the battery. In our current research, we used COMSOL Multiphysics version 5.5 (Stockholm, Sweden) for the simulations to explore the effect of parameters on cell performance and also to address the above mentioned issues in silicon anodes. The current electrochemical model uses electrode structures as porous matrices of solid active particles. The objective of our research is to address the high-volume changes in silicon anodes by studying the effects of growth of SEI layer and at the same time to focus on a possible working cathode to establish a full cell. Most of the experimental work is still concentrated on half-cells with Li metal as the counter electrode to analyze the electrochemical behavior of silicon. Loss of recyclable lithium is the main factor in the reduction of performance of full cell. Studies on half cells cannot address long term cycling performance of silicon anodes and only full cells could possibly give an insight into the commercial application [
18].
NMC electrodes have high specific energy and good thermal characteristics [
7], while NCA provides high specific energy and specific power and a long lifespan, which makes it ideal for capacity fade tests [
7,
13]. Based on mentioned properties, the two cathode materials evaluated in this paper are lithium nickel manganese cobalt oxide (NMC) and lithium nickel cobalt aluminum oxide (NCA).
Comparisons between the performance of the two cathodes with silicon anode would be discussed further. A forthcoming work would be focused on the role of battery material, structural characteristics on the thermal behavior of lithium-ion battery with silicon as the anode.
2. Materials and Methods
2.1. Model Development
Two separate 1D capacity fade models (one with NCA as positive electrode and another with NMC as positive electrode) were developed to understand capacity fade in a cell. The cell was discharged at four different loads (0.5C, 1C, 1.5C, 2C). The capacity fade model is based on a constant current/constant voltage (CCCV) cycling condition. The cell is charged at a rate of 1C until the voltage exceeds 4.1 V. Then, at a constant voltage of 4.1 V, it is charged until the current drops below 0.1 A. Next, the cell is discharged until the voltage drops below 3.1 V at a constant current with a rate of 1C.
Since it is difficult to work experimentally with a material like pure silicon, the discharge curves in this model (with NCA cathode) were compared with those of research work carried out on a commercial NCA lithium-ion pouch cell where the negative electrode is graphite. According to the model, graphite electrodes show 20% capacity fade and reduction in the battery life for 2000 cycles [
19].
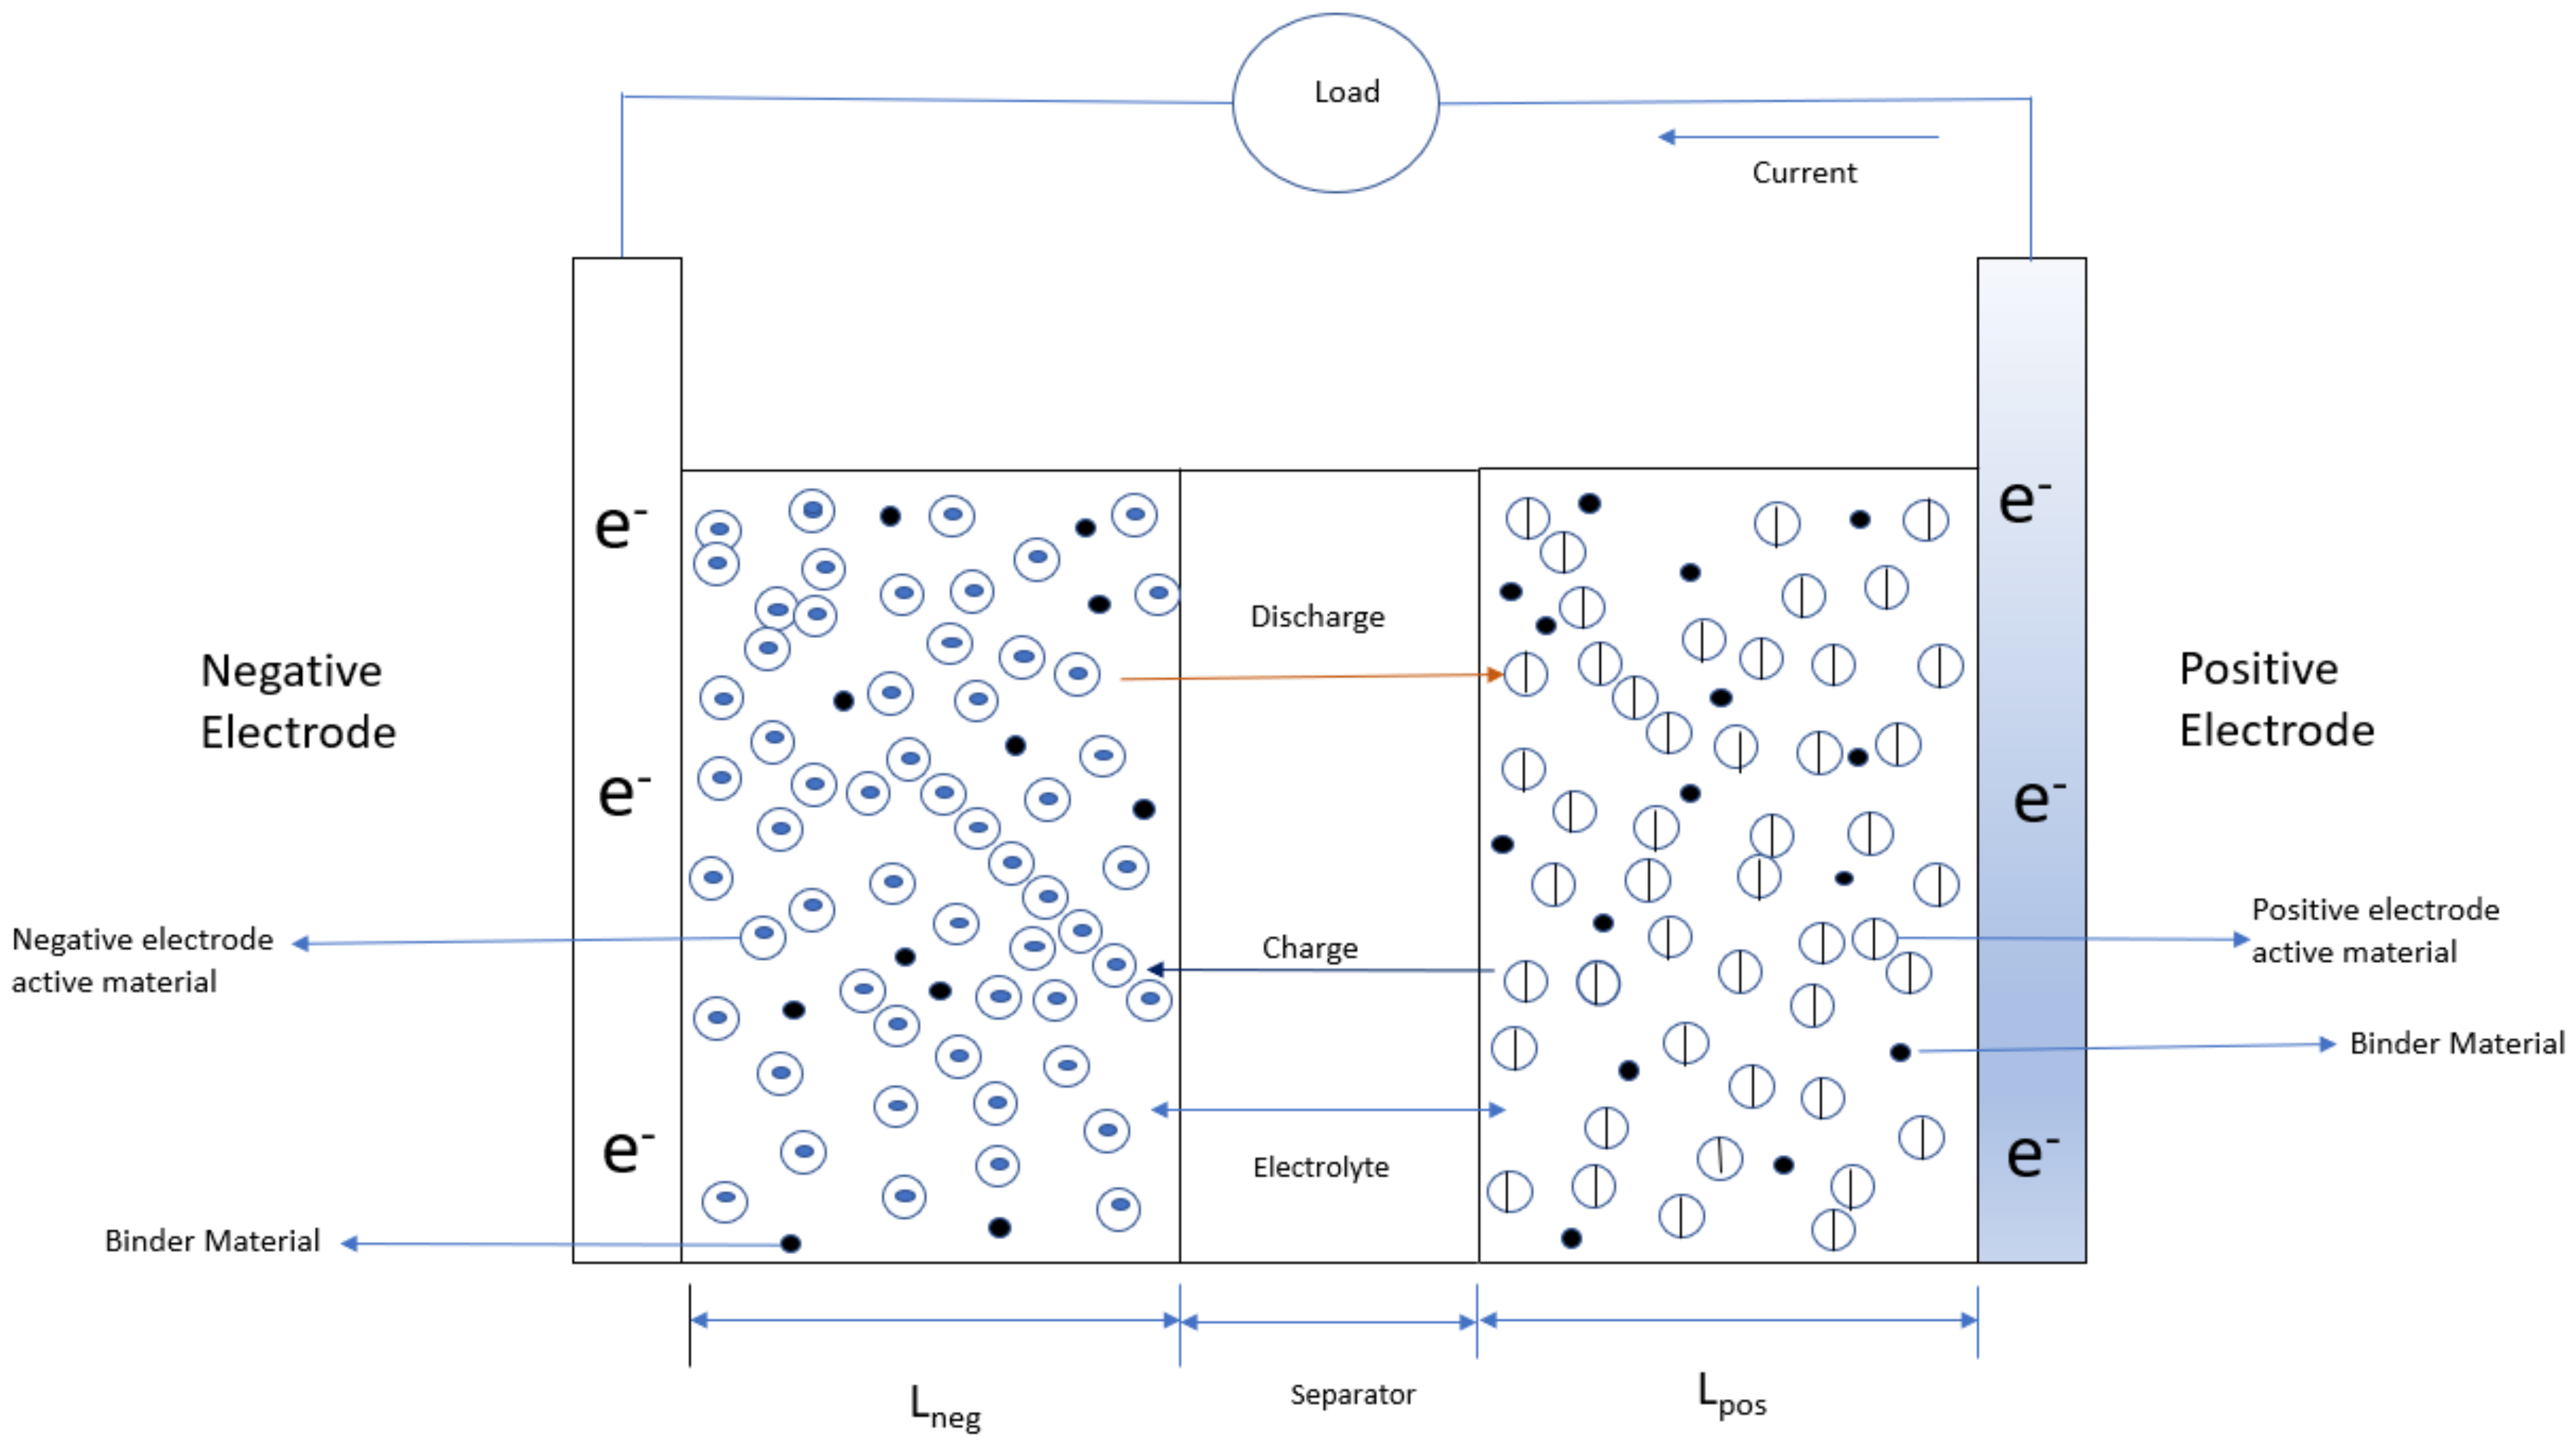
Although the model is 1D, a schematic shown in
Figure 1 shows the assumed structure in two dimensions, comprised of two electrodes sandwiched between a separator with electrolyte. Both the electrodes are modeled as porous solid matrices of active particles which are spherical in shape and of uniform size. The separator is a porous matrix filled with electrolyte made up of lithium hexafluorophosphate (LiPF
6) dissolved in a 3:7 liquid mixture of ethylene carbonate (EC) and dimethyl carbonate (DMC).
Aging results in two phenomena: The first is the decomposition of the SEI layer and thus an increase in the internal resistance. The second is the increase in the capacity loss since the cyclable Li is utilized in the formation of SEI [
19].
Accordingly, this model’s focus is on the diffusion and migration of the particles in the electrodes and electrolyte, the electrode kinetics, and the conductivity of the ions in the electrolyte.
Using this model, the volume fractions of the electrolyte in the electrodes were taken as follows:
where,
= Solid phase volume fraction of the negative electrode
= Solid phase volume fraction of the positive electrode
The values 0.172 and 0.170 represent the assumed volume fraction due to the conductive carbon filler material in each electrode, which is considered to be inert for electrolyte transport or lithium intercalation.
Additionally, since the modeling was based on the effects of the growth of the SEI layer, which causes capacity fade, it is important to focus on the kinetics of the layer formation. The nature of the SEI layer formation is dependent on the type of electrolyte in the battery, and results in the irreversible loss of ethylene carbonate. This is stated as [
19]:
where S represents the ethylene carbonate electrolyte and PSEI is the parasitic SEI reactant formed in the reaction.
The following equation describes the kinetics of this parasitic reaction with respect to the local current density on the particle surface in the negative electrode:
where:
= local current density,
HK = dimensionless silicon expansion factor function, defined as zero during de–intercalation and the value depends on the state of charge of the negative electrode,
J = exchange current density for the parasitic reaction (dimensionless),
α = transfer coefficient of the electrochemical reduction reaction,
= over-potential (assumes an equilibrium potential of 0 vs. lithium),
= local accumulated charge from the SEI formation,
f = parameter based on the SEI film properties (dimensionless)
The expression below is used to keep track of the SEI concentration in the porous electrode, c
SEI (moles/m
3),
where:
= reaction coefficient of the SEI species,
n = number of electrons involved in the reaction,
The term
which is the local accumulated charge belonging to the SEI formed layer, is directly proportional to
,
where:
The parasitic reaction leads to the loss of cyclable lithium, hence increasing the resistance of the SEI film. The model incorporates two important formulas related to the SEI film. First, the film thickness is calculated as follows:
where MP is the molar weight
is the density of the formed products from the side reactions. Here the initial film thickness at t = 0, , was assumed to be 1 nm.
The second important characteristic is the film resistance Rfilm (Ω cm)
where,
This resistance increases with the film thickness.
2.2. Model Assumptions
Silicon was used as the negative electrode and ethylene carbonate (EC) in LiPF
6 as the electrolyte. Since is there is no available experimental data for silicon, the following parameters in
Table 1 and
Table 2 are taken from COMSOL materials library validated by comparing the experimental data of graphite and EC in LiPF
6 [
20,
21]. The Electrochemical model parameters in
Table 3, and governing equations, boundary conditions of this model in
Appendix A and
Appendix B are used from comsol library [
19].
NOTE:
Initial capacity of the cell = Maximum Lithium concentration in the positive electrode
Maximum electrode state of charge of positive electrode
Solid phase volume fraction of positive electrode
Thickness of the positive electrode
Faraday’s constant
3. Results
The performance of the lithium-ion battery was simulated by modeling a silicon anode and comparing both NCA and NMC cathodes.
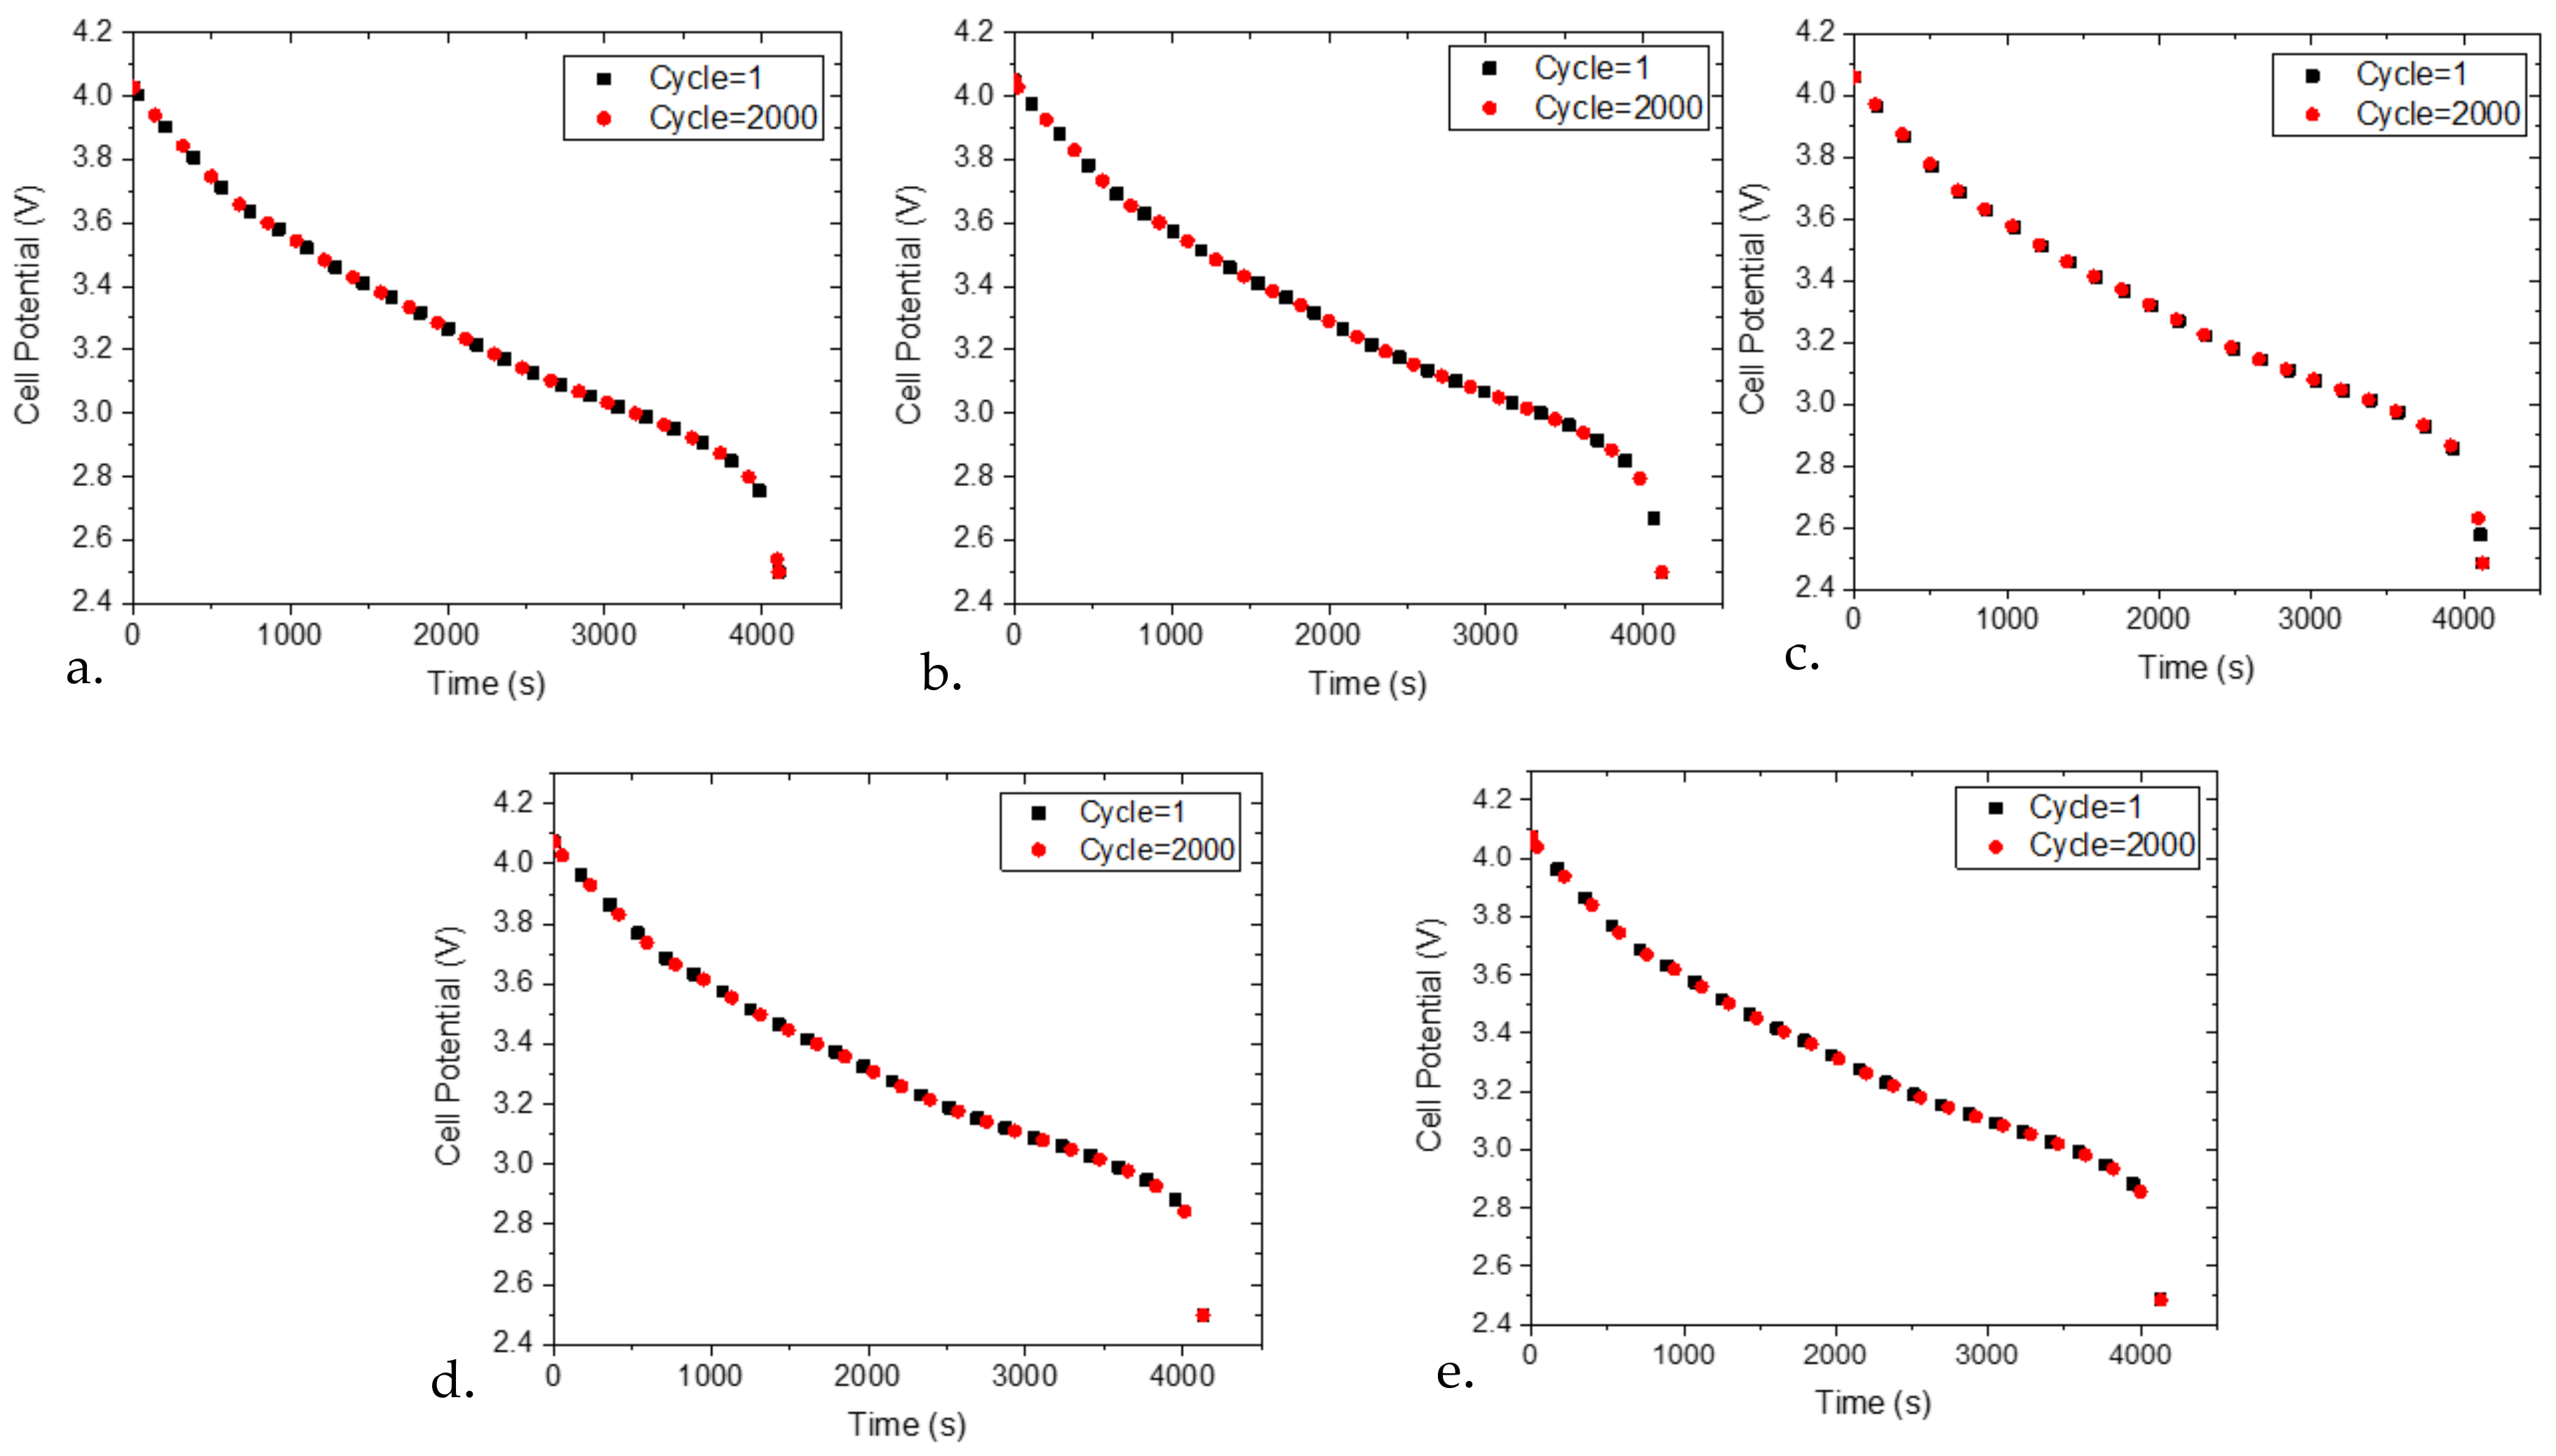
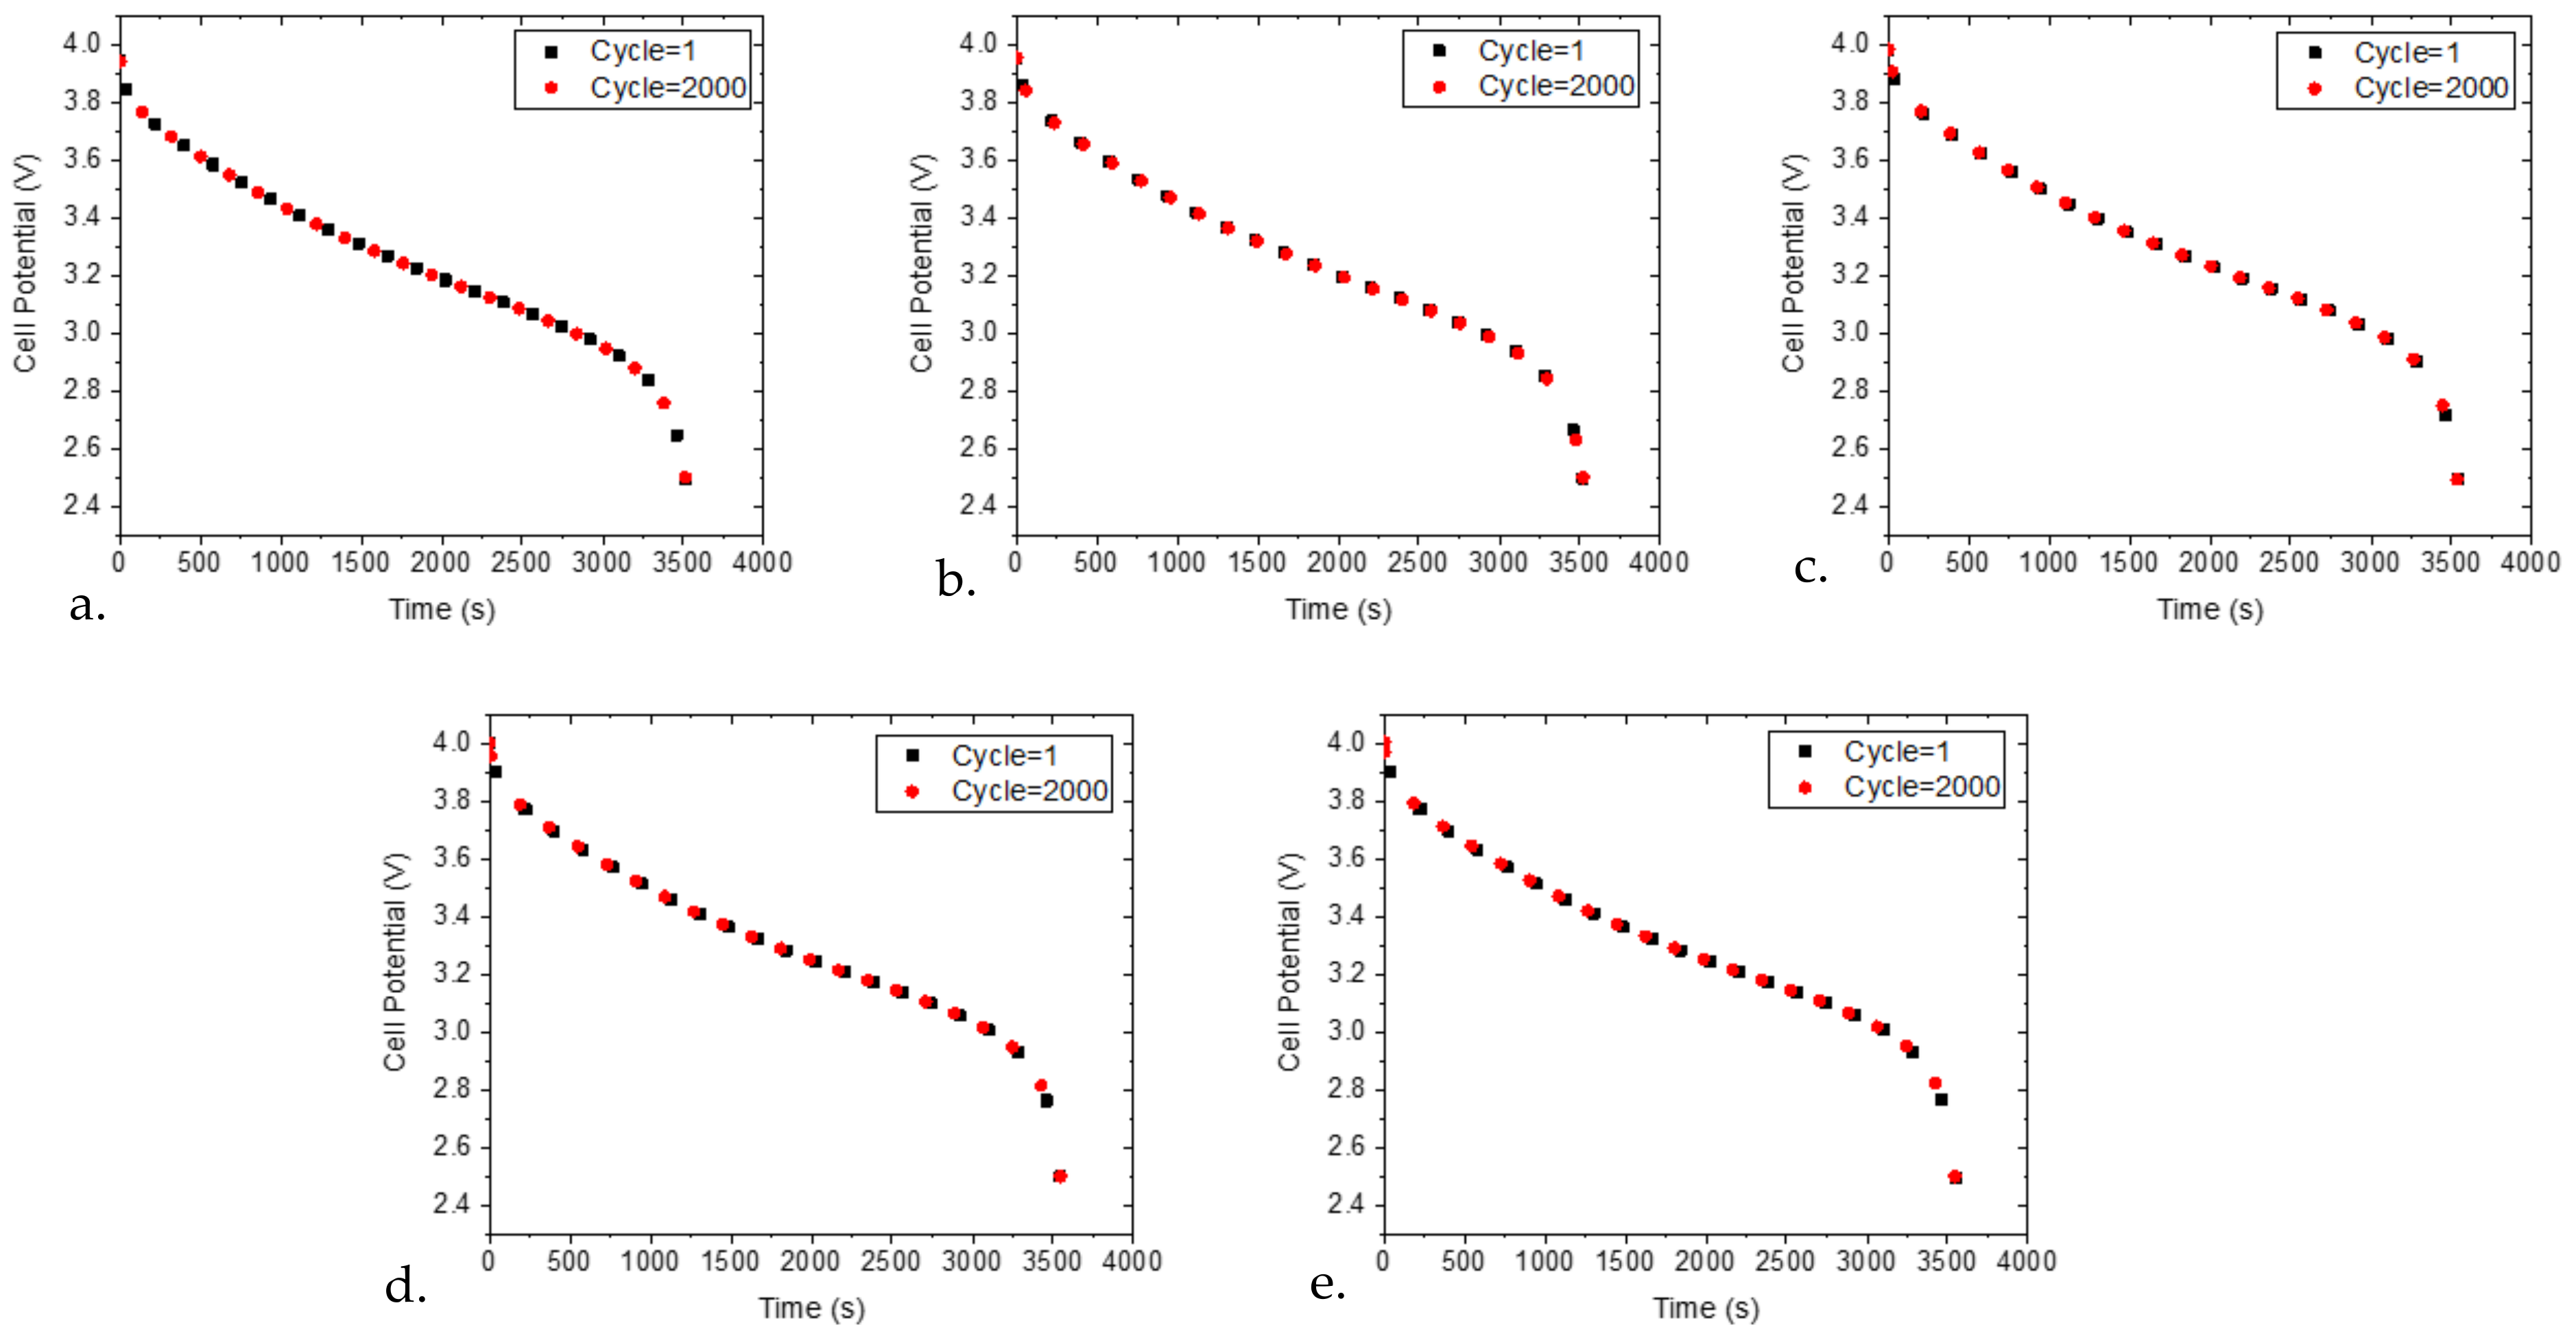
Figure 2 shows the discharge curves for different Si particle sizes (4
m, 2
m, 1
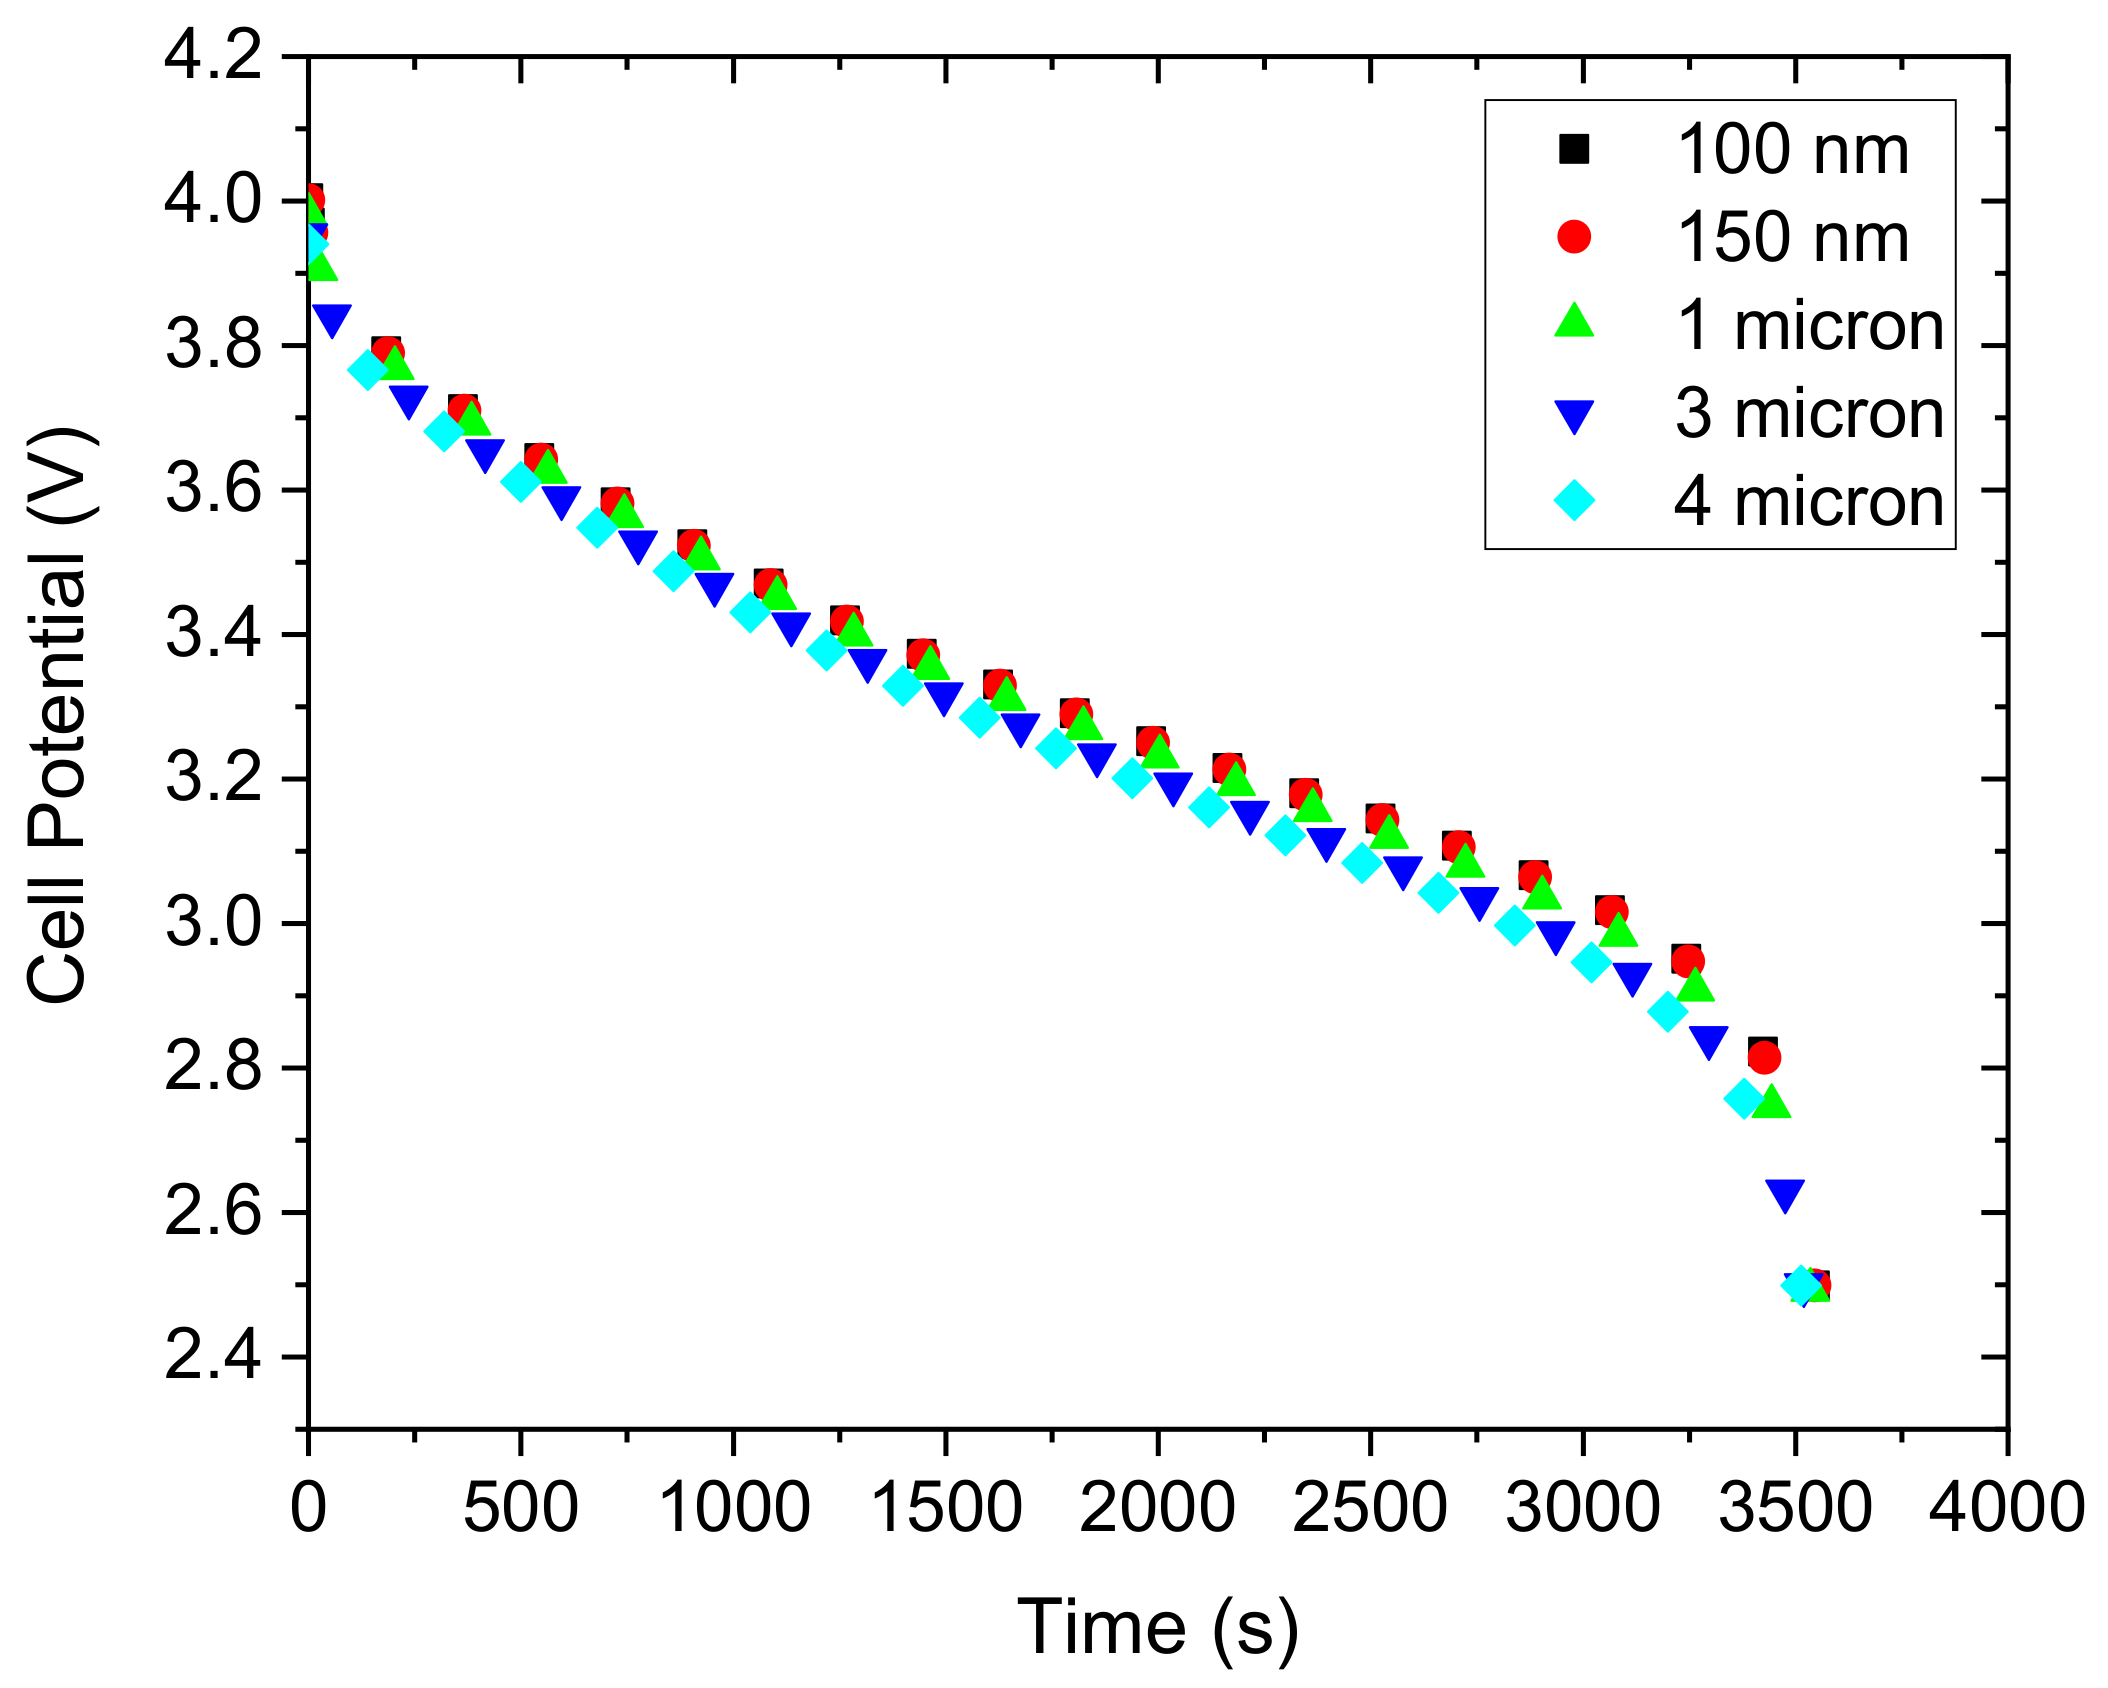
m, 150 nm, 100 nm) coupled with the NCA cathode, for the first and 2000th cycle. For these cases, there were no observed potential losses. However, when we compare the 2000th cycle discharge curves of these five particle sizes in
Figure 3, it is observed that the degree of capacity fade decreases with a decrease in the particle size of the negative electrode. This loss in capacity is negligible for the smallest particles (150 nm and smaller), consistent with other published work mentioning that the particle size, surface condition and morphology are important in the electrochemical performance of lithium-ion batteries [
23,
24,
25,
26,
27].
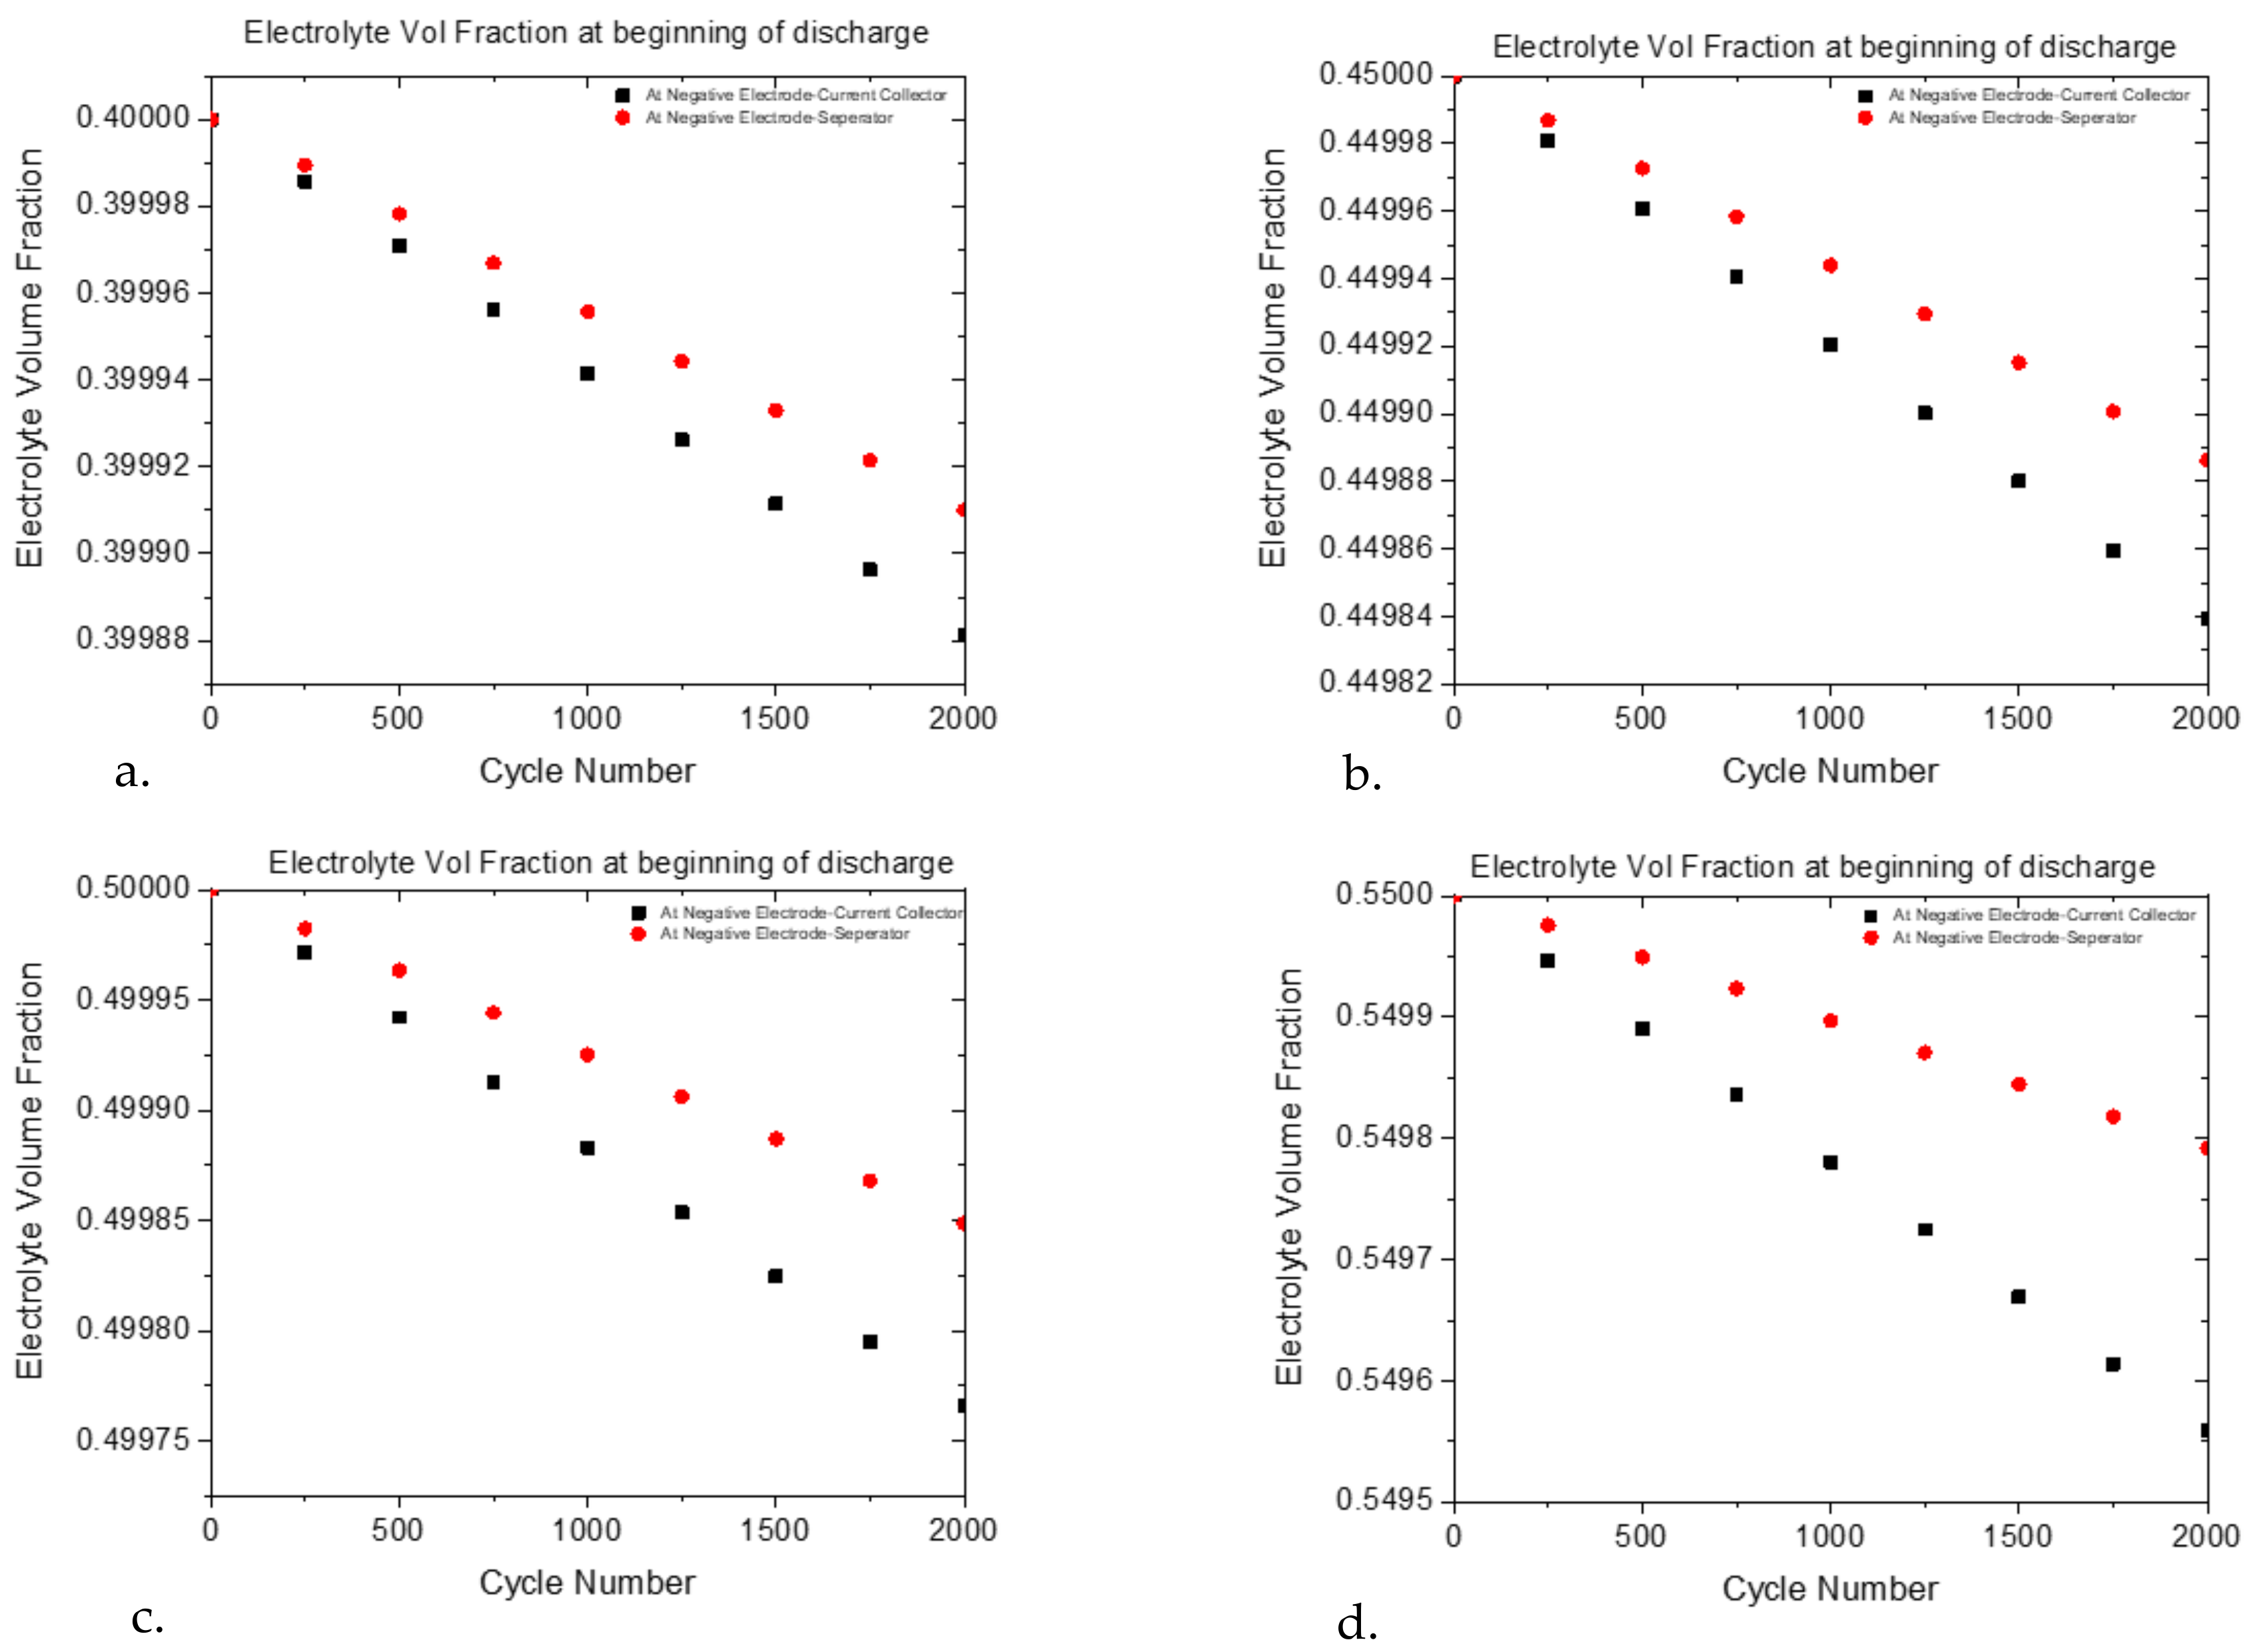
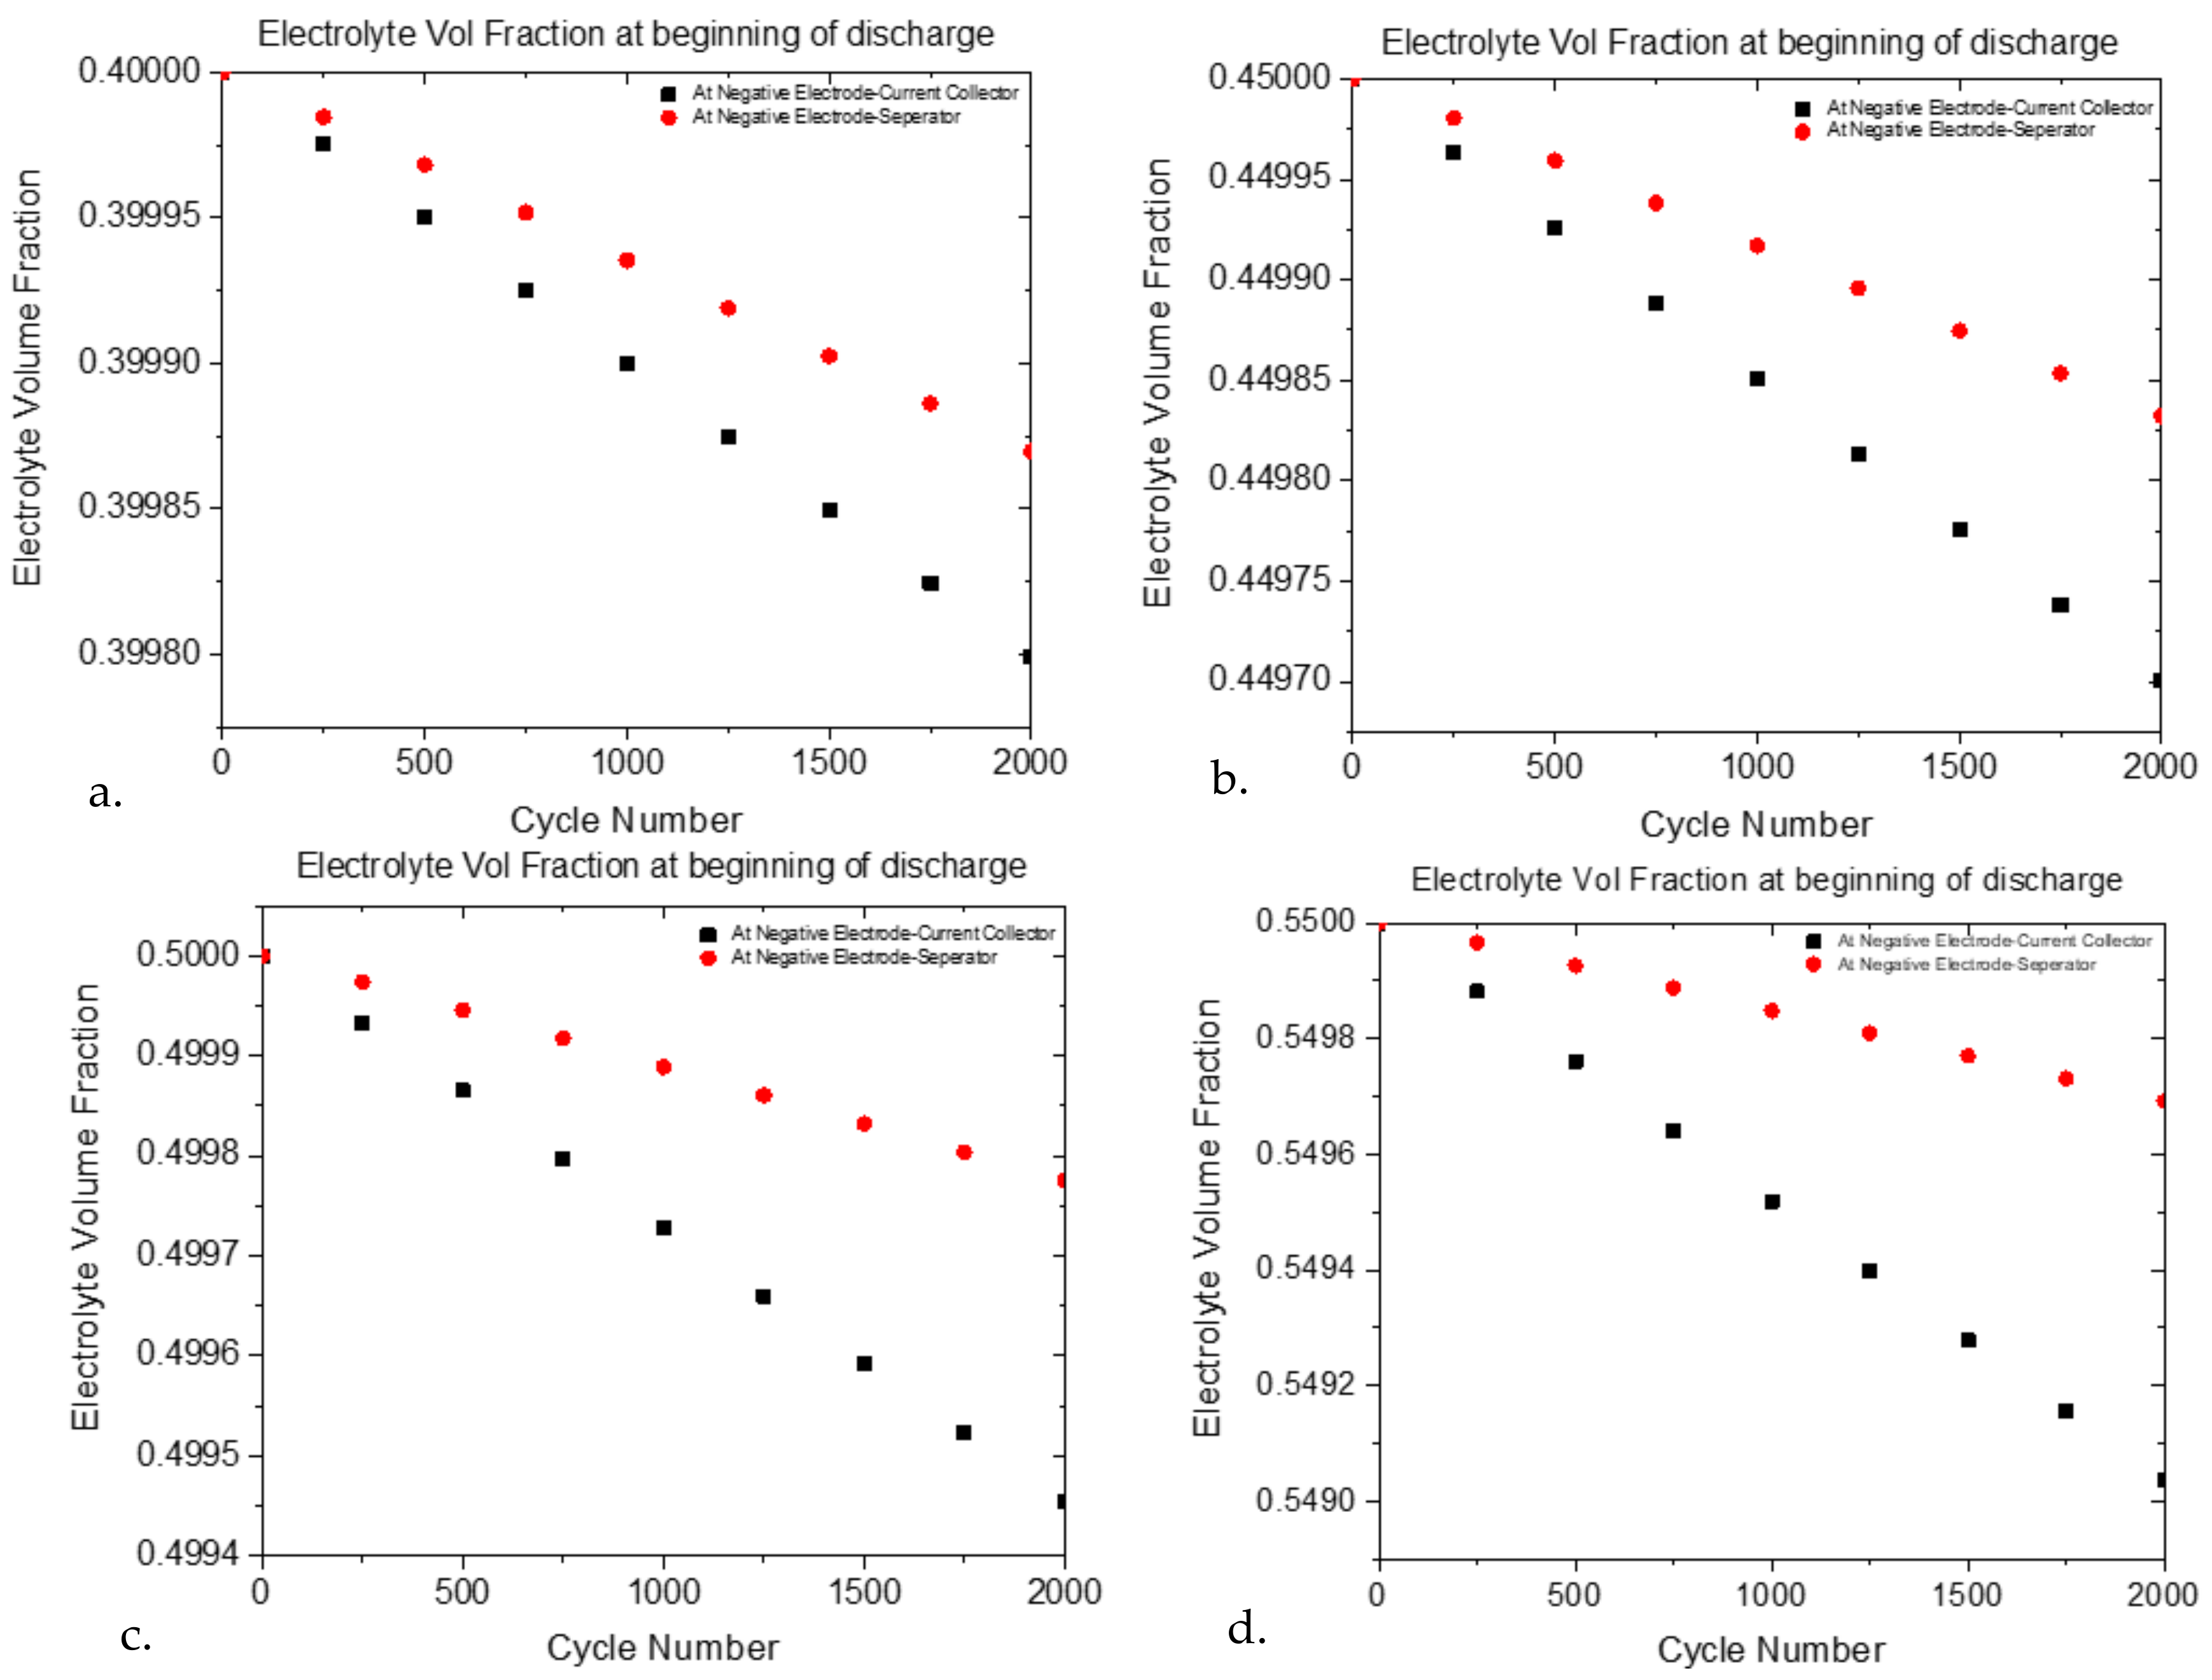
Further, the electrolyte volume fraction stability at both anode interfaces in
Figure 4 was assessed at four different values of the volume fraction of the electrolyte in the anode material (
, 0.55, 0.50, 0.45 and 0.40, while holding the volume fraction of the electrolyte in the positive electrode constant at 0.41. The positive electrode volume fraction was based on the values from the COMSOL materials library.
The changes in the volume fraction are shown in
Figure 4. It was observed that, for all samples, the available volume fractions after 2000 cycles were essentially the same as from the initial value, for boundaries of the negative electrode.
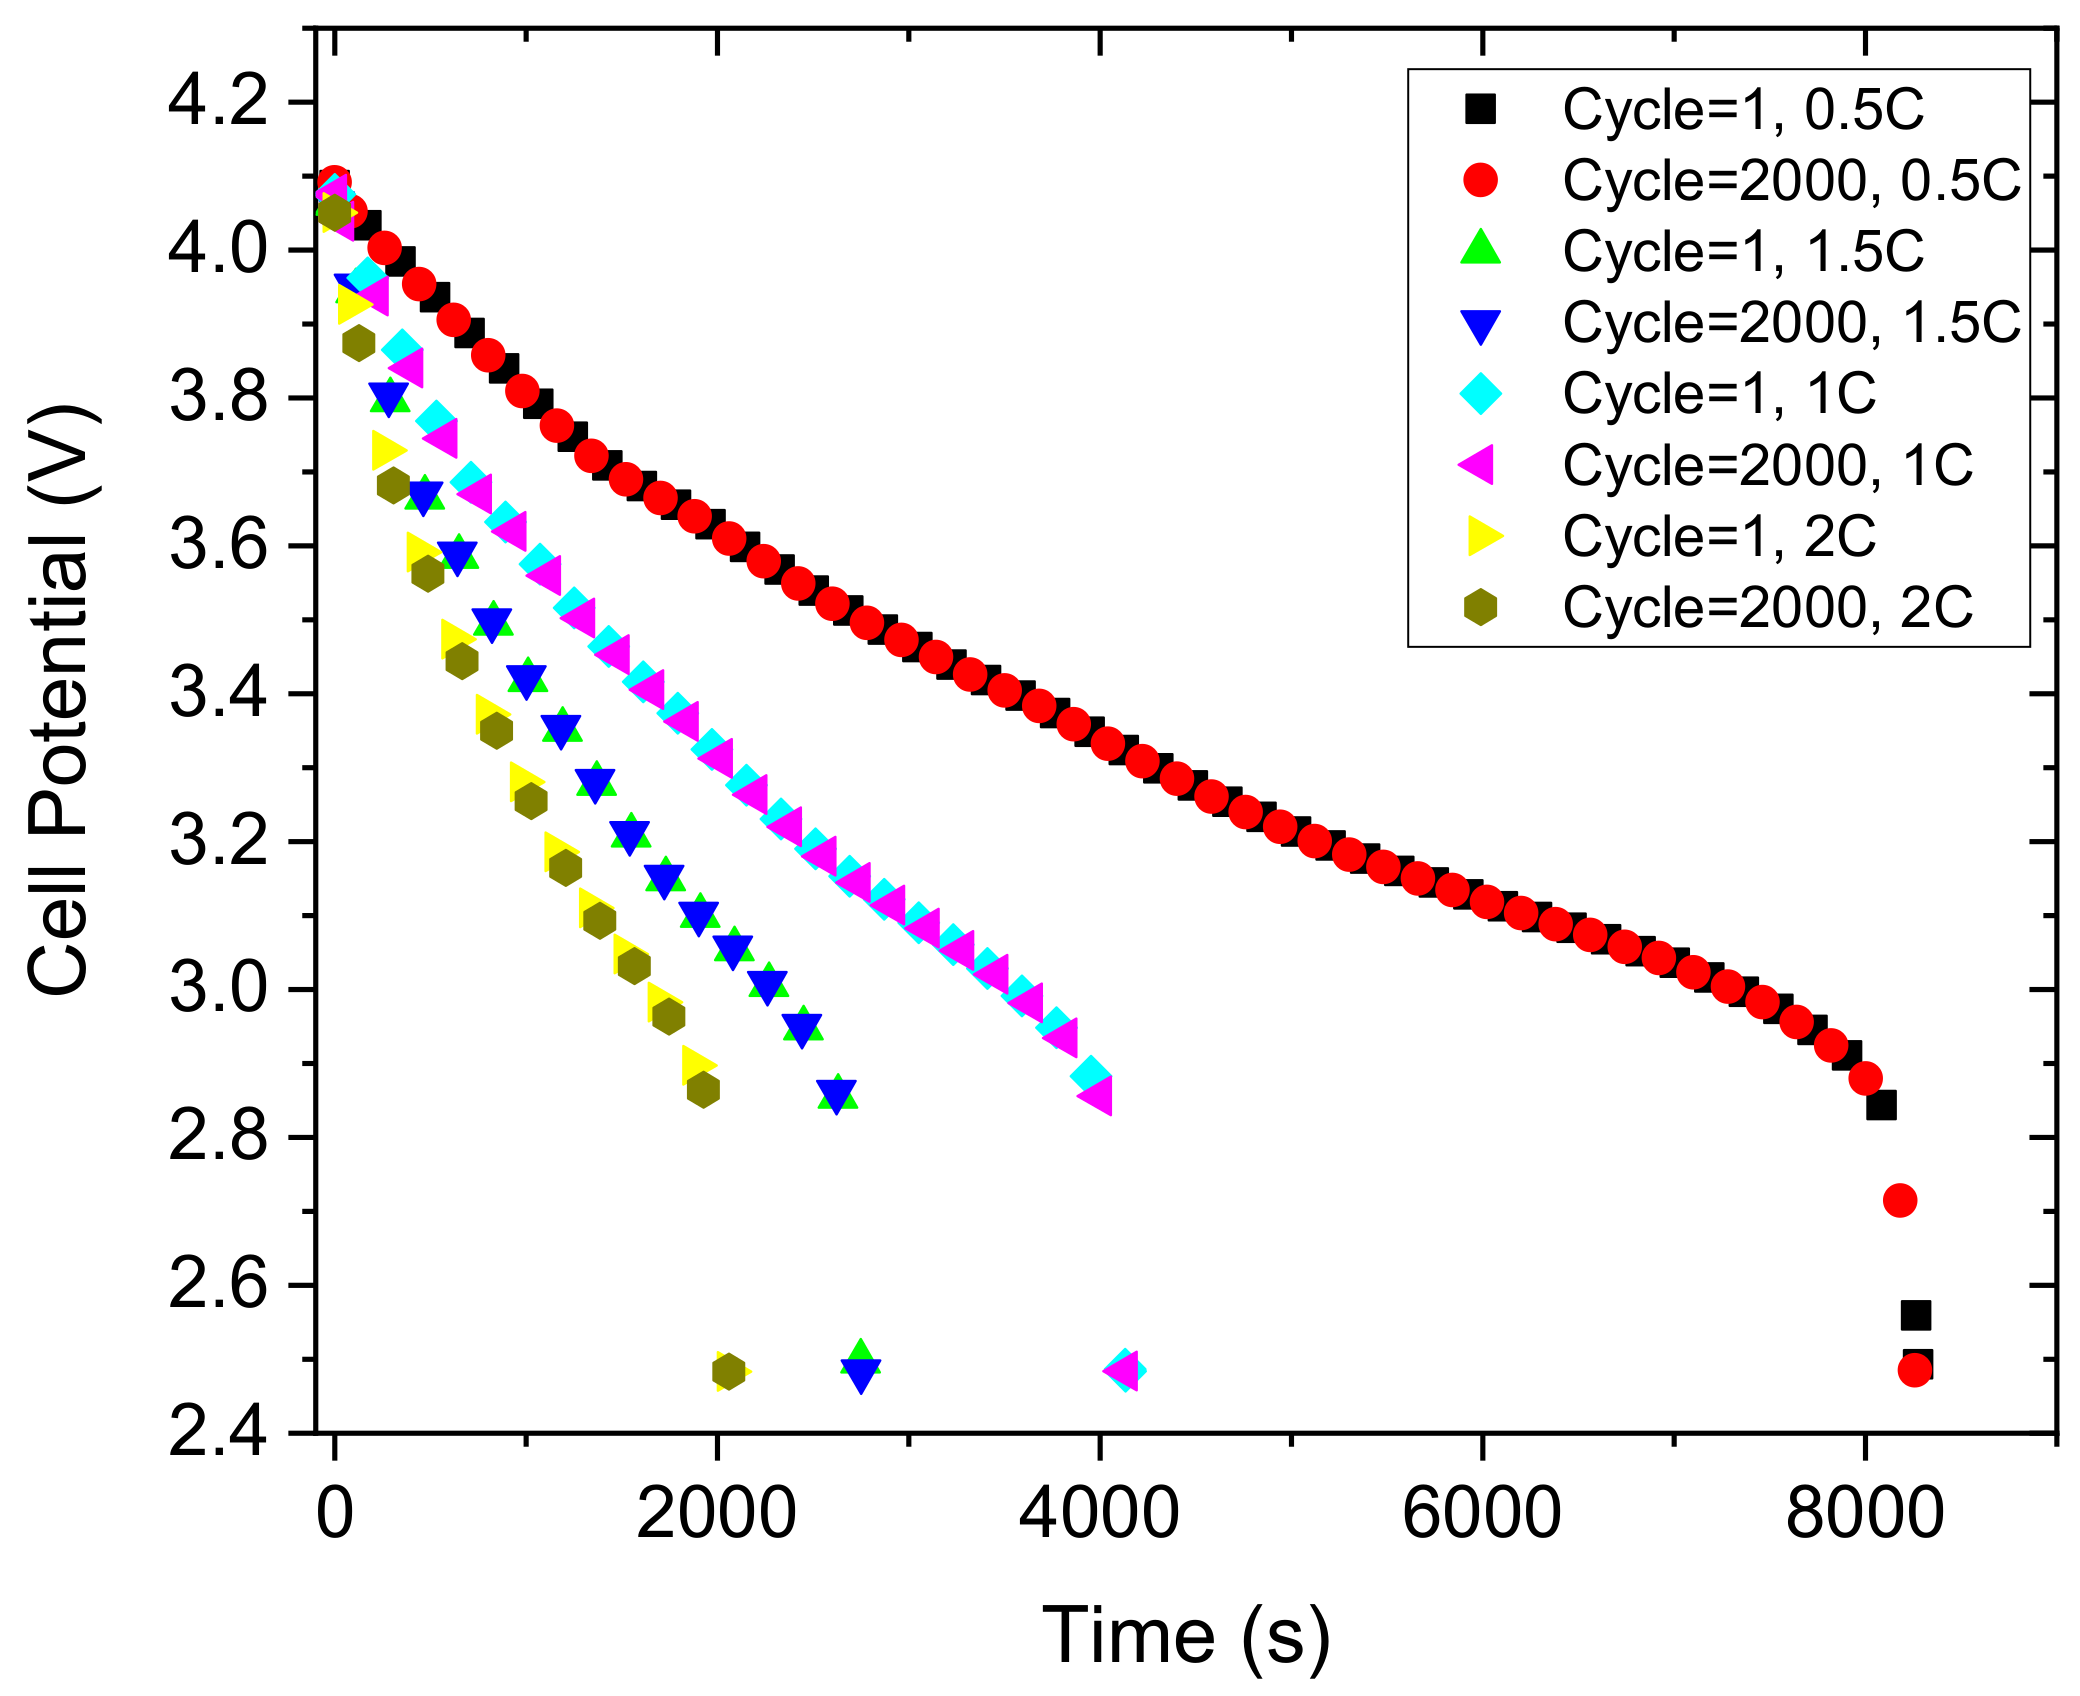
Using the results from
Figure 3 and
Figure 4 to select values of particle sizes (100 nm) and electrolyte volume fraction of the electrolyte in the negative electrode (0.45) for a battery modeled with the NCA cathode, the effects of four loading conditions (0.5C, 1C, 1.5C, 2C) on cell lifetime are modeled as shown in
Figure 5. It is observed that none of the loading conditions show any capacity fade between the 1st and 2000th cycles, indicating that the selected values of particle size and volume fraction of the electrolyte in the negative electrode were a good choice.
Analogously to
Figure 2,
Figure 6 compares cycle 1 and cycle 2000 discharge curves for the NMC cathode. In the case of NMC, the optimized Si anode particle sizes were determined to be 150 nm or smaller, which resulted in no significant capacity fade.
Figure 7 compares the discharge curves of the NMC electrode for different Si anode particle sizes (4
m, 3
m, 1
m, 150 nm, 100 nm) for the 2000th cycle of each case. It shows that the fade increases with particle size like the trend in
Figure 3. Similar to
Figure 4,
Figure 8 shows the available electrolyte volume fraction values at the two boundaries of the Si anode. There was no substantial difference in the volume fraction values for both NCA and NMC cathodes at the two boundaries even after 2000 cycles.
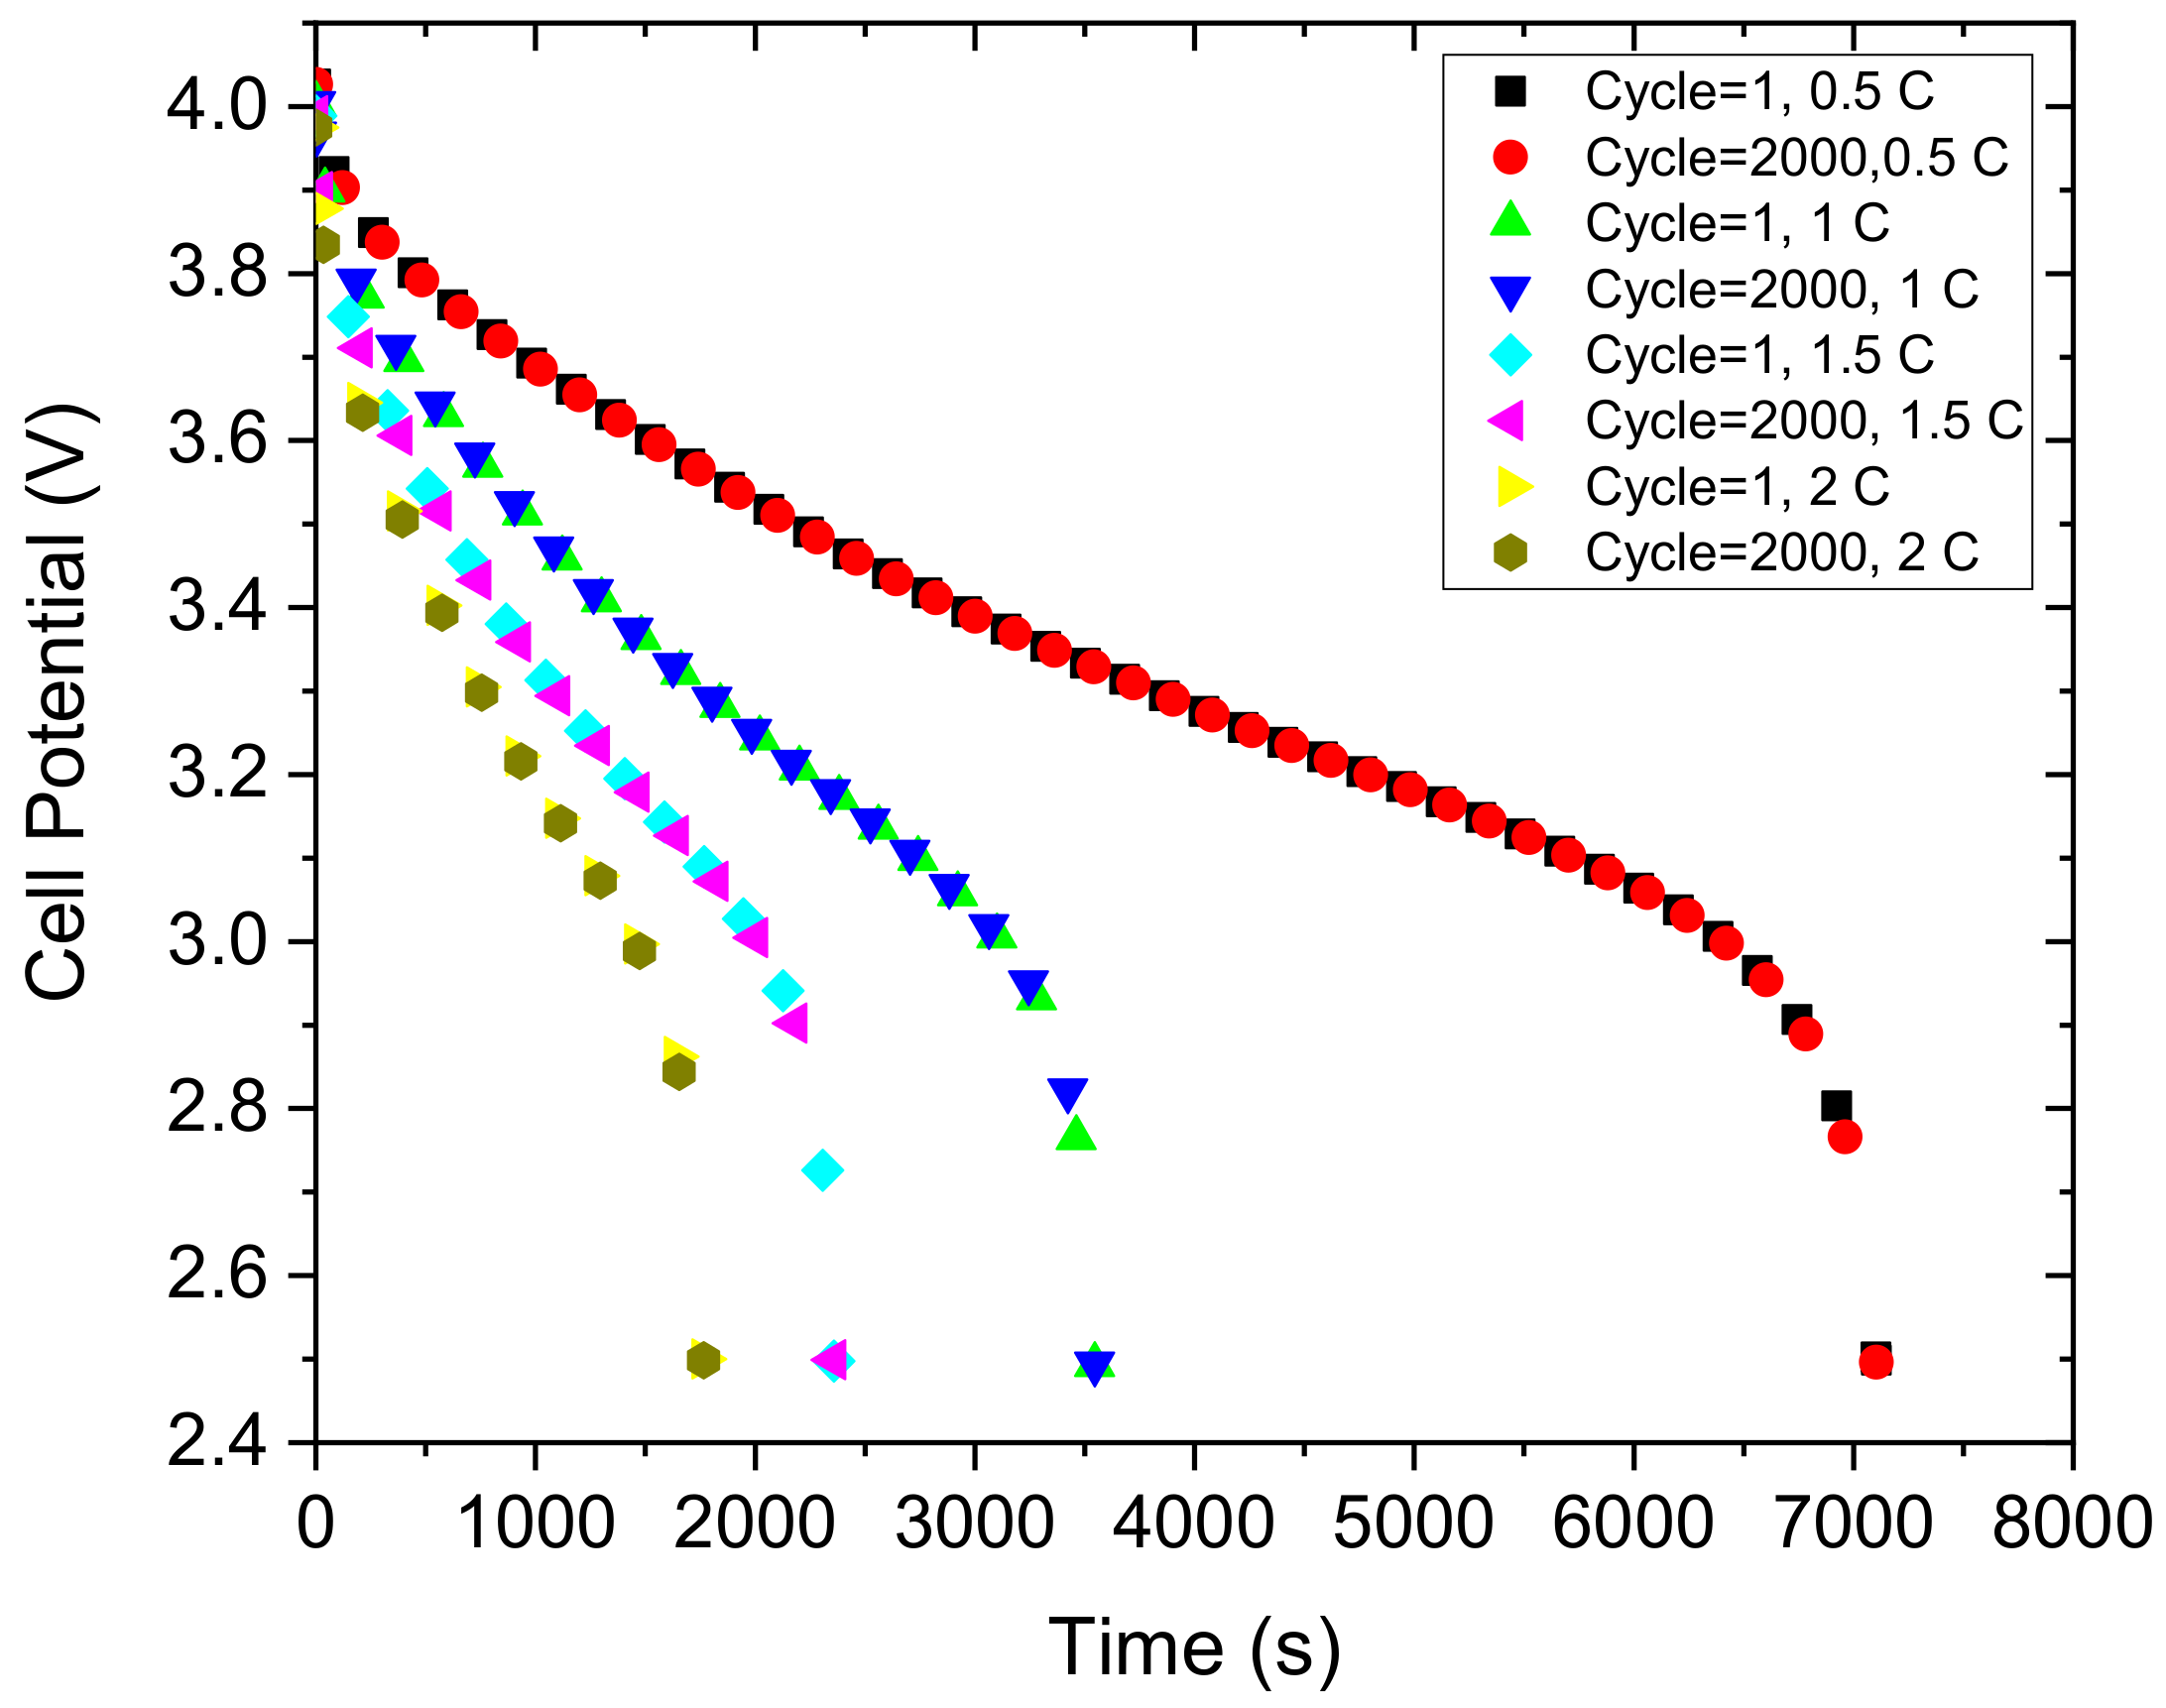
Figure 9 is a comparison of the discharge curves of 1 and 2000 cycles at four rates of discharge (0.5C, 1C, 1.5C, 2C) for a NMC cathode.
Comparing
Figure 9 with
Figure 5, the NCA cathode shows a lifetime of over 8000 s at a load 0.5C, while NMC shows a lifetime of 7000 s at the same load. It is also observed that as the load increases, the cell lifetime decreases, which is evident, but the lifetime variation is dependent on the chemistry of the battery.
The relative capacity under a load 1C remained unchanged at 0.85 after 2000 cycles for NCA cathode, while it was unchanged at 0.98 for NMC.
5. Conclusions
This research has focused on a one-dimensional model which was developed using COMSOL version 5.5 to study capacity fade in silicon anode lithium-ion batteries. The impact of changes in the negative electrode active material particle sizes and electrolyte volume fractions on the performance of the battery were investigated. Neither cathode exhibits capacity fade for the optimized Si particle (150 nm or smaller). This is due to the influence of particle size on the solid diffusion polarization, whereby smaller values decrease capacity fade. Optimized values of the volume fraction of the electrolyte in the negative electrode led to minimal accumulation of lithium ions. Hence, these volume fraction values can prevent or minimize drastic volume expansion of the silicon anode typically observed in Li-ion batteries. The overall trends in available volume fraction in the negative electrode leading to minimal volume expansion values were the same for both NCA and NMC 111.
It was observed that silicon as an anode behaves differently in terms of cell lifetime with two different cathodes (NCA and NMC), and that when they are compared, NMC shows a better relative capacity than NCA when paired with a silicon anode.
It can be concluded from this research work that higher relative capacity of NMC cathode makes it a better working electrode for Silicon anode.
As discussed, temperature is also an important factor in determining the performance of a battery. A forthcoming work would be on how silicon anode would behave depending on different structural characteristics and different temperature conditions.


