Article

A Model-Based Sensor Fault Diagnosis Scheme for Batteries in Electric Vehicles

1
School of Automotive Engineering, Harbin Institute of Technology, Weihai 264209, China
2
National Engineering Laboratory for Electric Vehicles, School of Mechanical Engineering, Beijing Institute of Technology, Beijing 100081, China
3
School of Mechanical Engineering and Automation, Northeastern University, Shenyang 110819, China
*
Author to whom correspondence should be addressed.
Energies 2021, 14(4), 829; https://doi.org/10.3390/en14040829
Submission received: 20 January 2021 / Revised: 2 February 2021 / Accepted: 3 February 2021 / Published: 5 February 2021
(This article belongs to the Collection Invited Papers on Electric Vehicles)

Abstract

:
The implementation of each function of a battery management system (BMS) depends on sensor data. Efficient sensor fault diagnosis is essential to the durability and safety of battery systems. In this paper, a model-based sensor fault diagnosis scheme and fault-tolerant control strategy for a voltage sensor and a current sensor are proposed with recursive least-square (RLS) and unscented Kalman filter (UKF) algorithms. The fault diagnosis scheme uses an open-circuit voltage residual generator and a capacity residual generator to generate multiple residuals. In view of the different applicable state of charge (SOC) intervals of each residual, different residuals need to be selected according to the different SOC intervals to evaluate whether a sensor fault occurs during residual evaluation. The fault values of the voltage and current sensors are derived in detail based on the open-circuit voltage residual and the capacity residual, respectively, and applied to the fault-tolerant control of battery parameters and state estimations. The performance of the proposed approaches is demonstrated and evaluated by simulations with MATLAB and experimental studies with a commercial lithium-ion battery cell.

1. Introduction

The development of electric vehicles (EVs) is the consensus of all countries in the world to deal with the energy crisis and environmental deterioration. Lithium-ion batteries are currently the first choice for battery systems due to their excellent performance, but given the limitations of their cell voltage and energy density, EVs are often equipped with hundreds of battery cells [1]. Therefore, an appropriate battery management system (BMS) is indispensable for the safe and reliable operation of battery systems [2]. A BMS has many functions; however, most researchers focus on the estimation of the state of charge (SOC) [3,4,5] and state of health (SOH) [6,7,8], and little attention has been paid to fault diagnosis techniques until the occurrence of several accidents related to battery systems in EVs in recent years [9,10]. Internal short-circuit and external short-circuit faults of the battery caused by electrical abuse, electrical abuse, and mechanical abuse were considered to be the main causes of battery system safety accidents [11,12,13,14,15]. The diagnosis of short-circuit faults is basically based on measurement data collected by sensors to establish various diagnostic models and compare the measured values with the predicted values of the models to determine whether a fault has occurred [16,17]. Therefore, the accuracy of collected sensor data directly determines the reliability of the battery fault diagnosis results. In addition, once the acquisition sensor fails, it will affect the realization of other functions that rely on data acquisition in the BMS and further affect the safety of the battery system [18]. Hence, sensor fault diagnosis is of great importance to ensure the healthy operations of a BMS.
Sensor fault diagnosis methods are basically divided into hardware redundancy methods and software redundancy methods. The former realizes sensor fault detection and isolation by increasing the number of acquisition sensors or changing the topology arrangement of acquisition sensors [19]. The latter includes model-based methods, machine-learning-based methods, and expert-system-based methods. Among them, the model-based method is the most widely used method in the literature [20], the basic idea of which is to reconstruct the fault model and compare the predicted value of the model with the measured value or reference value to determine whether a fault has occurred [21,22]. In other words, the fault diagnosis process of this method includes two steps: residual generation and residual evaluation. Liu et al. [23] take the difference between the predicted voltage of an equivalent circuit model and the measured value of a voltage sensor as the residual and judge whether a sensor fault occurred by comparing the cumulative sum of the residual and predetermined threshold, and then the structured residual method is used to effectively isolate the sensor fault [24]. The difficulty of determining the threshold is the shortcoming of the sensor fault diagnosis method using the voltage prediction error. Dey et al. [25] compare the predicted and measured values of temperature, current, and voltage based on the electrical–thermal coupling model and the sliding mode observer (SMO), respectively, to construct three residuals to achieve sensor fault detection and isolation. Biron et al. [26] also use an electrical–thermal coupling model to generate temperature, current, and voltage residuals to achieve sensor fault detection and isolation, but the residual generation process uses a Kalman filter (KF) and SMO. The problem with the need to construct a current residual generator for the fault diagnosis method is that it is very difficult and complicated to obtain the estimated value of the current that is often used as the model input. To address this issue, Ablay et al. [27] use an electrical–thermal coupling model and observer to generate residuals of temperature, voltage, and resistance for sensor fault detection and isolation. Although the battery dynamic characteristic parameter such as resistance is different in sensor fault and fault-free conditions, it is difficult to obtain the reference resistance in the case of a sensor fault because it is easily affected by the current rate and SOC interval. Therefore, it cannot be directly applied to the sensor fault diagnosis of the battery system. In fact, not only do the dynamic characteristic parameters change when the sensor fails but the various states of the battery also deviate from the expected values [28,29]. Therefore, Xu et al. [30] use the state of energy (SOE) estimation error as the residual to detect a current sensor fault. In addition, the errors of the estimated SOC and capacity are treated as the residuals to detect and isolate the current and voltage sensors’ faults in our previous work [31]. Although the calculation of the estimation errors of SOC and SOE is relatively fast, it takes a relatively long time to detect and isolate sensor faults. On the other hand, the method with a capacity error can realize sensor fault diagnosis in a relatively short time, but it cannot be applied to the initial stage of discharge due to limitations [31].
In fact, the fault-tolerant control should be carried out after fault detection and isolation to reduce potential safety hazards [32,33]. However, most studies are satisfied with the detection and isolation of sensor fault, and very little work is documented in the literature on sensor fault-tolerant control in battery systems. Xu et al. [30] add the current sensor fault into a state vector and then realize the online identification and fault-tolerant control of a current sensor fault through the proportional integral observer (PIO). Zhao et al. [34] solve this issue by including a sensor fault into a state vector and reformulating the model to achieve current and voltage sensors’ fault-tolerant control with the unscented KF (UKF) algorithm. In their studies, the initial value of the sensor fault in the state vector is set to 0. In fact, it takes a lot of time to retune the measurement noise and system noise of the UKF algorithm for the augmented model. Although the augmented model can realize the fault-tolerant control of the battery state, it ignores the fault-tolerant control of the parameter identification process. In addition, it takes a long time for the estimated value of the sensor fault to converge from the initial value of 0 to the true value. Except for methods based on augmented models, almost no works in the literature have been found to discuss how to estimate sensor fault values.
In order to solve the aforementioned issues, a model-based sensor fault diagnosis scheme is proposed for battery systems in EVs. The main innovations are as follows:
·
A model-based sensor fault diagnosis method with parameter residual and state residuals is proposed. The estimation error of the battery static characteristic parameter, i.e., the open-circuit voltage (OCV), is used as a residual for sensor fault diagnosis, which only has a good effect in the beginning and middle stages of the charging and discharging process. The estimated capacity derived from the ratio of the accumulated charge to the SOC difference at various nonadjacent sampling times is used to generate state residuals to detect the sensor fault. These residuals are only suitable for sensor fault diagnosis in the middle and late stages of the charging and discharging process. In view of the different application intervals of the two residuals, a sensor fault diagnosis scheme with two kinds of residuals is proposed.
·
A fault identification and fault-tolerant control strategy is proposed. The fault values of the voltage sensor and current sensor are derived based on the OCV residual and the capacity residual respectively. Then, the fault value is applied to the parameter identification and state estimation of the battery for fault-tolerant control to ensure the safety of the battery.
The remainder of this paper is organized as follows. Section 2 develops the battery model. Section 3 introduces the sensor fault detection and isolation scheme. Section 4 carries out the sensor fault-tolerant control. Section 5 establishes simulation and experimental validation. Conclusions are finally given in Section 6.

2. Battery Model

The battery model adopted here is the first-order resistor-capacitor model depicted in Figure 1, which includes an OCV that is a nonlinear function of SOC [35,36], an ohmic resistance Ro, and resistor-capacitor (Rp—Cp) elements that reflect the dynamics of the batteries. I represents the battery charge/discharge current, and Up and Ut denote the battery polarization voltage and terminal voltage, respectively.
The electrical dynamics of this battery model can be written as
{ U t , k = O C V k U p , k I k R o , k U p , k + 1 = exp ( Δ t / τ k ) U p , k + ( 1 exp ( Δ t / τ k ) ) R p , k I k , d e f i n e :   τ k = R p , k C p , k
The battery OCV is generally modeled as a nonlinear function of SOC [36]
{ O C V k = k 1 z k + k 2 z k 2 + k 3 z k 3 + k 4 / z k + k 5 ln ( z k ) + k 6 ln ( 1 z k ) z k = z k 1 η I k Δ t / Q
where k1k6 are the fitting coefficients of the OCV model, z represents the battery SOC, η is the coulomb efficiency, Δt is the sampling interval, and Q denotes the maximum available capacity of the battery cell.
When the acquisition sensor is faulty, the sensor measurements can be expressed as
{ I m = I + I f U t , m = U t + U f
where Im and Ut,m are measured variables, and If and Uf are the current and voltage faults, respectively. It is assumed that If and Uf are bounded by the finite values, and only one sensor fault can occur at the same time.

3. Sensor Fault Detection

In this section, we mainly focus on the sensor fault detection with the multiple residuals scheme. The sensor fault isolation methods in the battery system are discussed in [31]. The proposed sensor fault diagnosis scheme is depicted in Figure 2. In the following paragraphs, the specific elements of the scheme are described in detail.

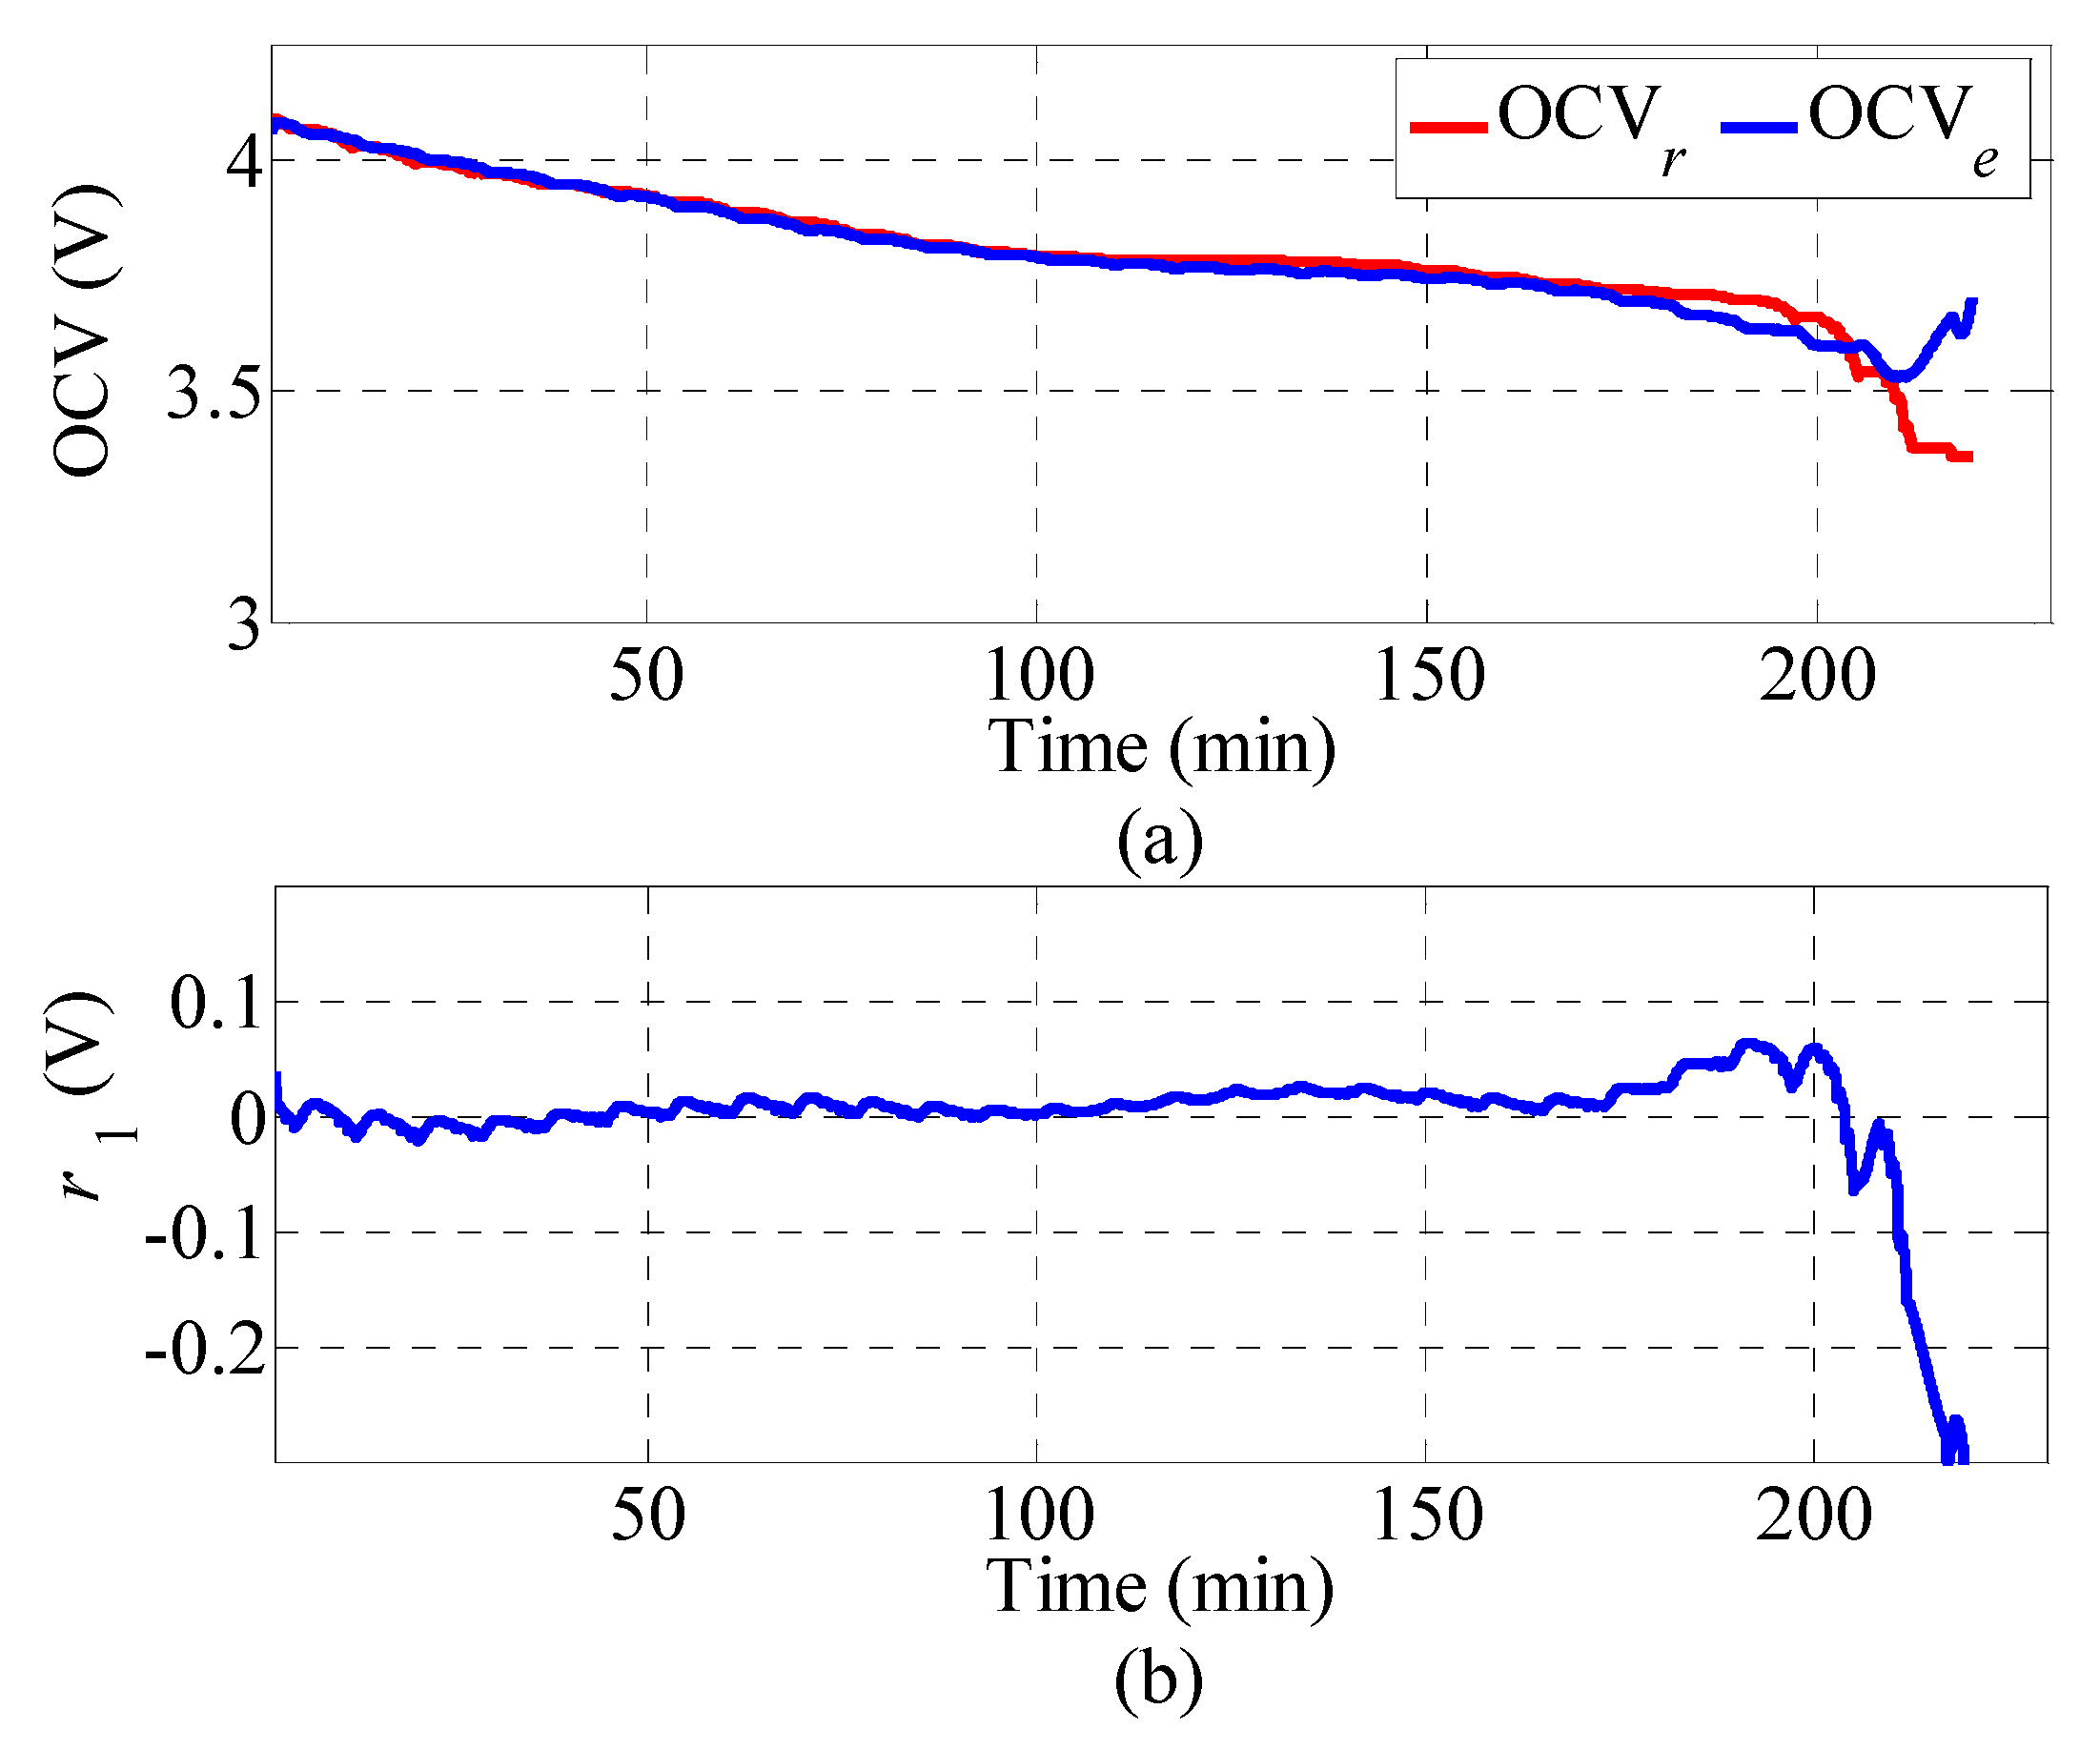
3.1. Residual Generator 1

In order to obtain higher model accuracy in a BMS, offline identification methods have been gradually replaced by online parameter identification methods. When parameter identification is performed by RLS [37] and nonlinear Kalman filters [38], the dynamic characteristic parameters of the battery change with the current rate and SOC interval during the discharge process, so it is difficult to obtain the reference value of the dynamic characteristic parameters when the sensor fails to generate the residual. In fact, the battery static characteristic parameter (i.e., OCV) can also be estimated by an online identification method [39], and its reference value can also be calculated by Equation (2) at the whole discharge process. Therefore, the residual r1 can be defined as
r 1 = O C V r O C V e
where the reference value OCVr is calculated via Equation (2), and the estimated OCVe is obtained by the online identification method.
RLS is a widely used optimization algorithm in battery parameters identification. For a system shown in Equation (5), parameters can be iteratively updated with RLS [39].
y k = φ k θ k + e k
where yk is system output, φk is the coefficient vector, θk is the parameter vector, and ek is the terminal voltage prediction error.
For the lithium-ion battery model, the terminal voltage Ut,m,k is usually regarded as the output yk, φk, and θk can be defined as
{ φ ( k ) = [ 1 U t , m , k 1 I m , k I m , k 1 ] θ ( k ) = [ M k a 1 a 2 a 3 ] T
Mk, a1, a2, and a3 are the transformation quantities when the nonlinear Equation (1) is linearized, which can be expressed as
{ M k = O C V e a 1 O C V e a 1 = Δ t 2 R p C p Δ t + 2 R p C p a 2 = R o Δ t + R p Δ t + 2 R o R p C p Δ t + 2 R p C p a 3 = R o Δ t + R p Δ t 2 R o R p C p Δ t + 2 R p C p
Therefore, when the θk at each sampling moment is identified by RLS, the estimated value of OCVe can be further obtained:
O C V e , k = M k 1 a 1
Then, the residual r1 can be calculated at the whole discharge process. It should be noted that the estimation error of OCV is smaller in the middle and high SOC intervals and larger in the low SOC interval [39], which may cause false alarms in the low SOC interval.

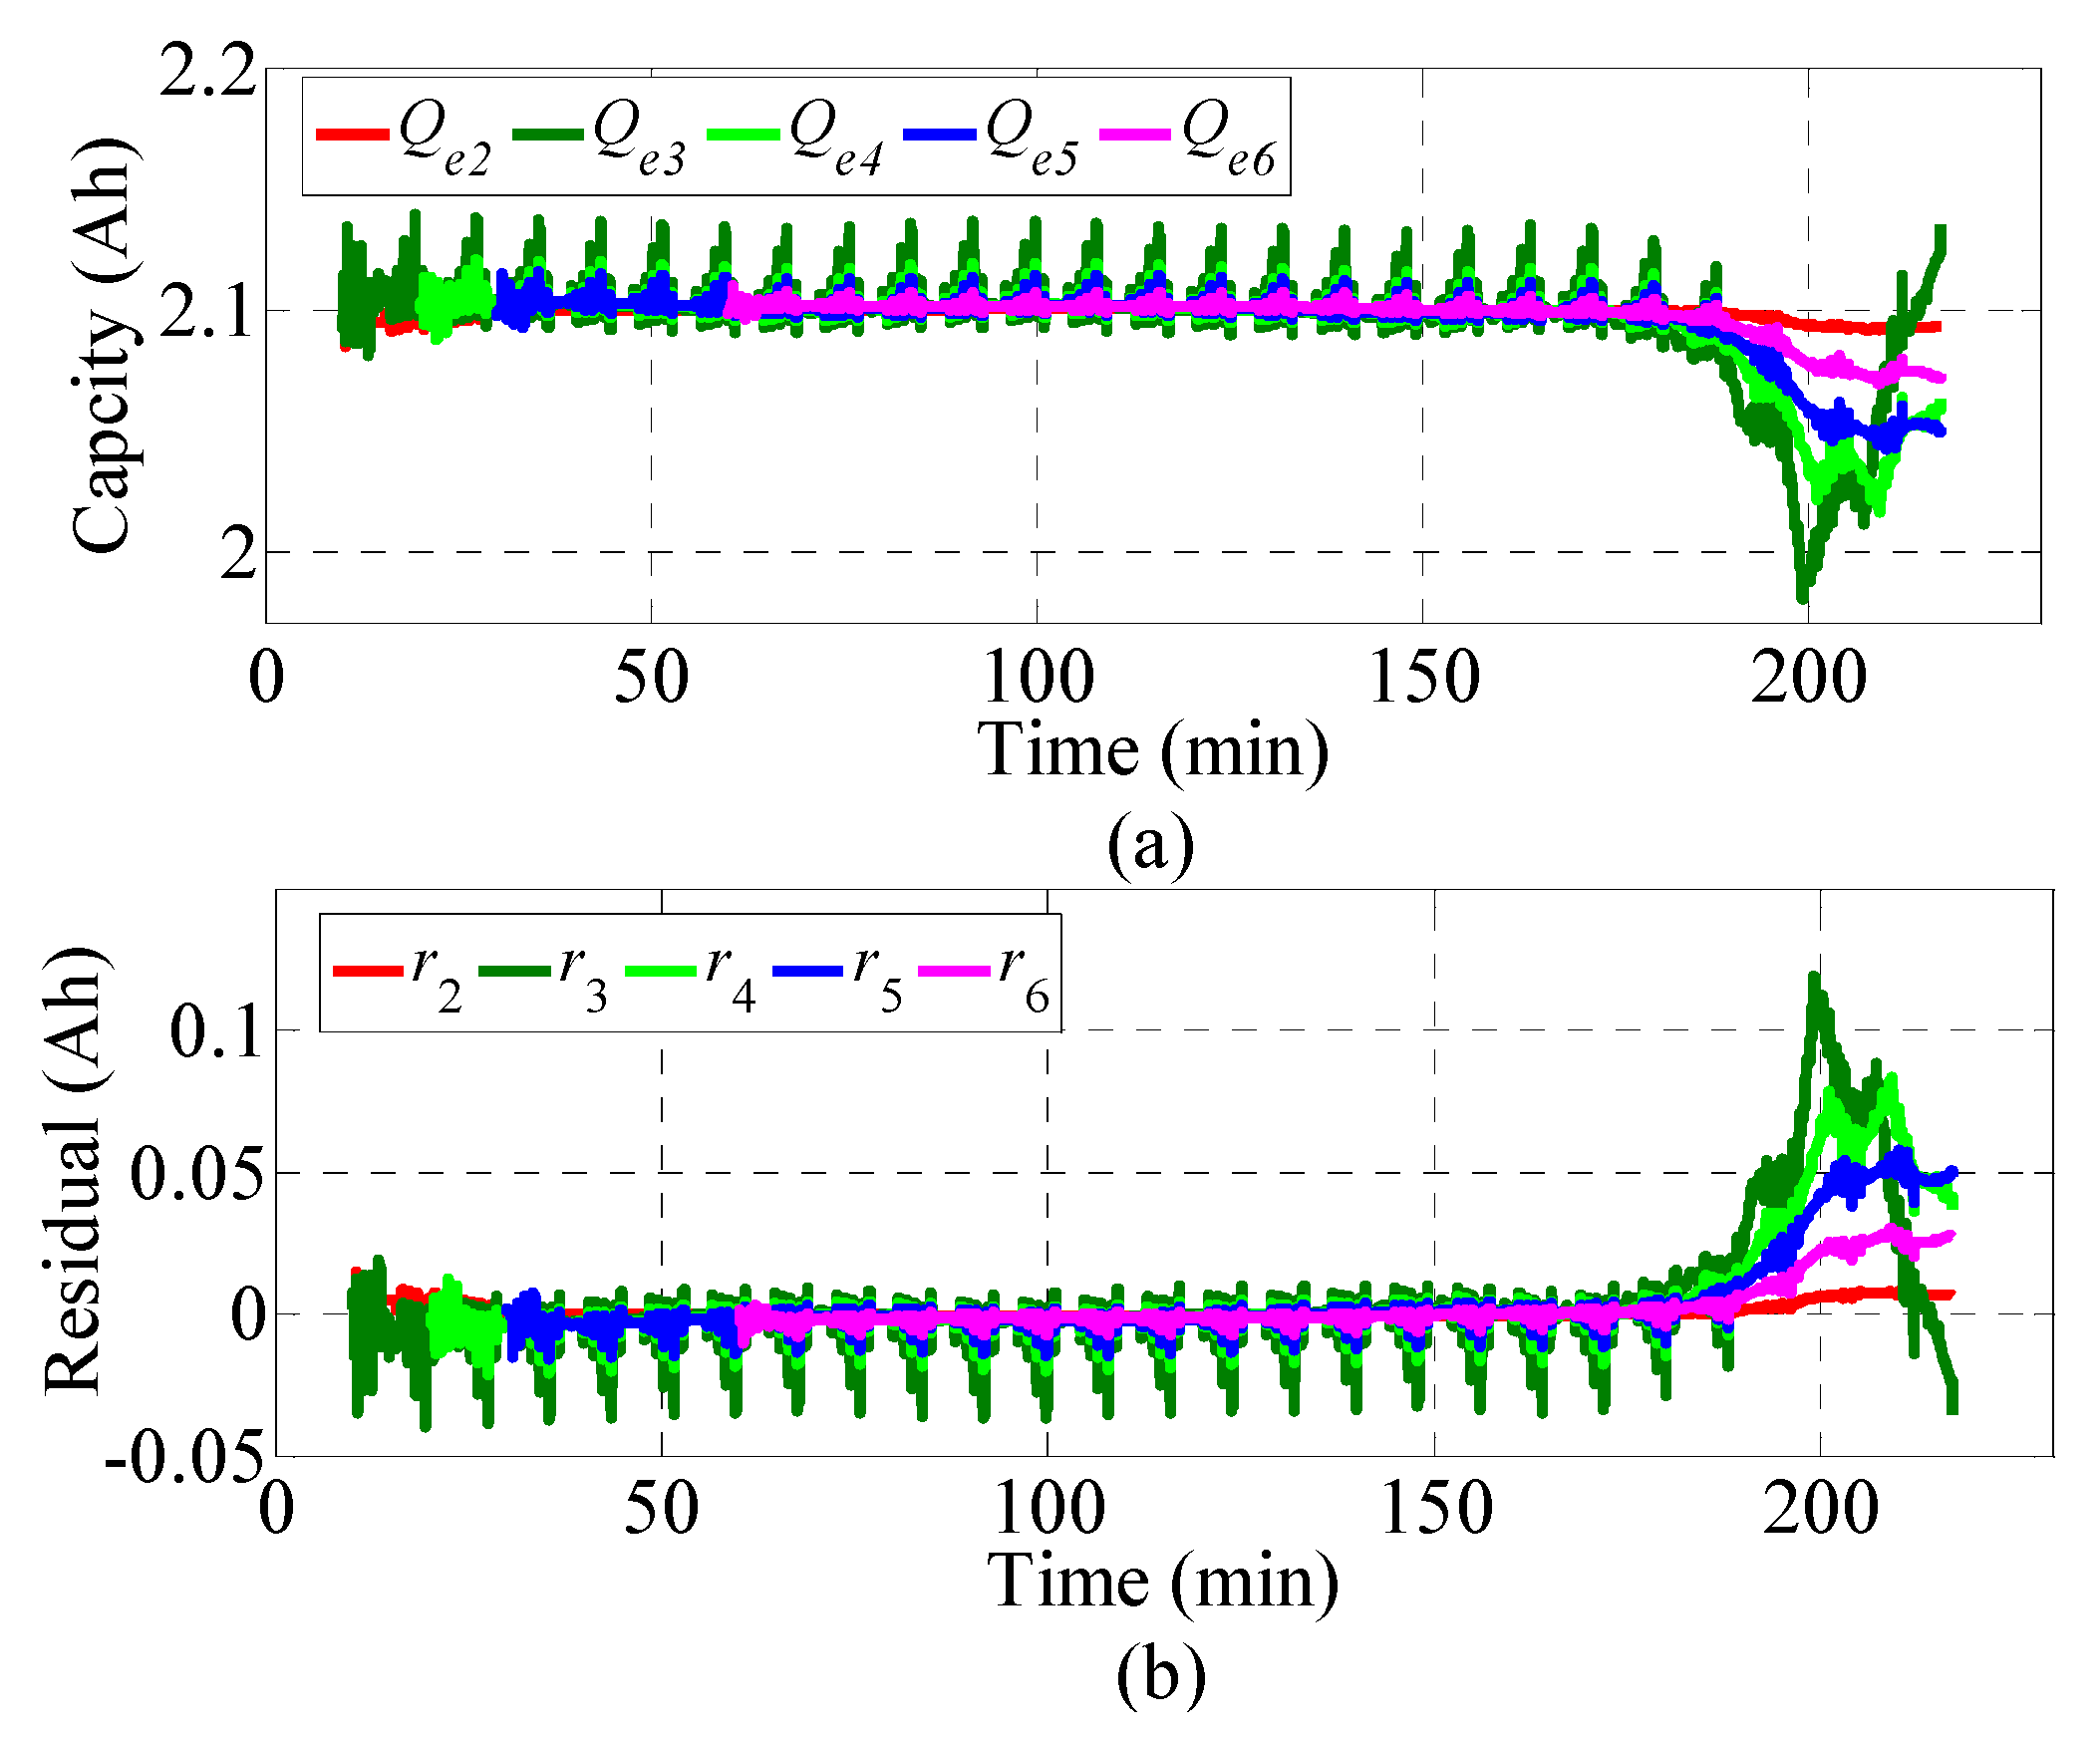
3.2. Residual Generator 2

Once the sensor fails, the predicted voltage based on the Kalman filters for state estimation has a good followability with the actual measured voltage, but the sensor fault will cause the estimated states to deviate from the accurate values. Therefore, changes in states such as SOE [30], SOC [31], and capacity (an index of battery health) [31] can be used for sensor fault diagnosis. Considering that it takes a long time to diagnose sensor faults with changes in SOC and SOE, the estimated capacity error shown in Equation (9) is selected to diagnose sensor faults.
r 2 = Q r Q e
where the reference capacity Qr is a constant value in one charge and discharge cycle, which can be determined as the average value of the estimated capacity Qe of the previous charge and discharge cycle. The estimated capacity Qe is calculated by
Q e ( t 1 , t 2 ) = t 1 t 2 η I m ( t ) z e ( t 1 ) z e ( t 2 ) = Δ Q ( t 1 , t 2 ) Δ z e ( t 1 , t 2 )
where t1 and t2 are two values of k at two different sampling times, and ze(t1) and ze(t2) are estimated SOCs based on the UKF algorithm.
The lithium-ion battery model can also be transformed to the state-space equation
{ [ U p , k + 1 z e , k ] = [ exp ( Δ t / τ k ) U p , k + ( 1 exp ( Δ t / τ k ) ) R p , k I m , k z e , k 1 η I m , k Δ t Q ] + w k U t , m , k = O C V k U p , k I m , k R o , k + v k
where w and v are the process noise and measurement noise. Note that capacity Q here is a constant value, which is determined as the average value of the estimated capacity Qe of the previous charge and discharge cycle. OCVk here is the value obtained by substituting ze,k estimated by UKF into the OCV model.
The specific process of updating the battery state ze,k in Equation (11) according to the UKF algorithm can be found in our previous study [31]. Then, the estimated capacity Qe can be derived from Equation (10). It should be pointed out that there are two issues in directly using Equations (14)–(16) for sensor fault diagnosis. Since the capacity is the ratio of the amount of charge accumulated over a period of time to the change in SOC, Equation (10) does not apply to the initial stage of battery discharge (i.e., high SOC interval) [31]. In addition, the estimation accuracy of capacity is closely related to the selection of t1 and t2. The more electricity is discharged between t1 and t2, the smaller the estimation error of capacity, but the higher the missed alarm rate of fault diagnosis. Conversely, the less electricity is discharged between t1 and t2, the larger the estimation error of capacity, and the higher the false alarm rate of fault diagnosis. After many trials, we suggest that the selection and determination of t1 and t2 should be based on whether the SOC difference between these two times is more than 5%. In view of the unpredictability of the current rate during the battery discharge, multiple groups of t1 and t2 are selected to generate capacity residuals to participate in sensor fault diagnosis. The diagnosis process needs to judge and eliminate residuals with SOC differences of less than 5%. Assuming that the entire discharge process needs to collect n sets of data and the sampling interval is Δt, the capacity residuals can be defined as follows
{ r 2 = Q r Q e ( t 1 , t 2 ) , t 1 = 60 , t 2 = 600 , 1201 , , n r 3 = Q r Q e ( t 1 , t 2 ) , t 1 = 60 + m Δ t , t 2 = 600 + m Δ t , m = 0 , 1 , , ( n 600 ) r 4 = Q r Q e ( t 1 , t 2 ) , t 1 = 60 + m Δ t , t 2 = 1200 + m Δ t , m = 0 , 1 , , ( n 1200 ) r 5 = Q r Q e ( t 1 , t 2 ) , t 1 = 60 + m Δ t , t 2 = 1800 + m Δ t , m = 0 , 1 , , ( n 1800 ) r 6 = Q r Q e ( t 1 , t 2 ) , t 1 = 60 + m Δ t , t 2 = 3600 + m Δ t , m = 0 , 1 , , ( n 3600 )
where t1 starts from 60 instead of 1 because it takes into account the convergence process of the algorithm during state estimation.

3.3. Residual Evaluation

In view of the different applicable SOC intervals of each residual in the battery discharge process, it is necessary to select different residuals according to the SOC interval as follows to determine whether a fault has occurred during residual evaluation.
{ 90 % z e 100 % , | r 1 | | J v | ,   fault   10 % z e 90 % , | r i | | J c | , and   Δ z e 5 %   ,   i = 2 , , 6 , fault 0 z e 10 % , | r i | | J c | , and   Δ z e 5 %   ,   i = 3 , 4 , 5 fault
where Jv and Jc are the thresholds for OCV residual and capacity residuals, respectively. The threshold J directly determines the false alarm rate and missed alarm rate of fault diagnosis. Based on experience, Jv and Jc are defined as 0.1 V and 0.1 Ah, respectively, in this study.

4. Sensor Fault-Tolerant Control Strategy

4.1. Voltage Sensor Fault Identification and Tolerant Control

Active fault-tolerant control after fault detection is of great significance for improving the safety of battery systems, and the accurate fault identification value is the basis for fault-tolerant control. In this section, we propose a new method for determining the values of a sensor fault to improve the effect of fault tolerance.
For voltage sensor faults, the parameters related to the voltage sensor fault value Uf will be derived from the perspective of parameters identification based on the RLS algorithm.
When a voltage sensor fault occurs, the battery terminal voltage Ut,m will be transformed into
U t , m , k = U f , k + O C V e , k a 1 O C V e , k + a 1 U t , m , k 1 + a 2 I m , k + a 3 I m , k 1
When the value of Uf is not known, the coefficient vector φk and parameter vector θk are still defined according to Equation (6), Mk actually represents
M k = U f , k + O C V e , k a 1 O C V e , k
The estimated OCVe is
O C V e , k = M k 1 a 1 U f , k 1 a 1
Since only the voltage sensor fails, the reference OCVr has not changed, so the residual r1 is
r 1 , k = O C V r , k M k 1 a 1 + U f , k 1 a 1
When a voltage sensor fault occurs, a2 and a3 are the coefficients of the current. Their changes can be basically ignored. The main parameters that change are Mk and a1, but as the sampling time increases, Mk and a1 also tend to stabilize, then O C V r , k = M k 1 a 1 , and Equation (18) can be simplified as
U f , k = ( 1 a 1 ) r 1 , k
Since the voltage sensor fault threshold Jv is less than the sensor fault Uf, the value of r1 just exceeding the threshold Jv cannot be regarded as the fault value Uf. Instead, after r1 exceeds the threshold Jv, it will quickly reach a stable value and fluctuate around this value. The average value of the fluctuation value can be regarded as a voltage sensor fault Uf for fault-tolerant control. The mathematical expression is as follows
U f t b t a ( 1 a 1 ) r 1 , k ( t b t a ) / Δ t + 1
where ta is the starting time when r1 reaches a stable value, and tb is the time when r1 reaches and keeps a stable value for a certain period of time.
After the fault value Uf is obtained, parameter identification and state estimation can be fault tolerant by Equations (14) and (20), respectively.
{ [ U p , k + 1 z e , k ] = [ exp ( Δ t / τ k ) U p , k + ( 1 exp ( Δ t / τ k ) ) R p , k I m , k z e , k 1 η I m , k Δ t / Q ] + w k U t , m , k = U f , k + O C V k U p , k I m , k R o , k + v k

4.2. Current Sensor Fault Identification and Tolerant Control

When a current sensor fault occurs, we derive the current sensor fault value If from the perspective of capacity residual generation. Equations (9) and (10) can be transformed into
r ( t 1 , t 2 ) = Q r t 1 t 2 η I m ( t ) z e ( t 2 ) z e ( t 1 ) , r ( t 3 , t 4 ) = Q r t 3 t 4 η I m ( t ) z e ( t 3 ) z e ( t 4 )
where r(t1, t2) is the capacity residual from t1 to t2 when there is no current sensor fault, and r(t3, t4) is the capacity residual from t3 to t4 when a current sensor fault occurs. The selection of t1 and t2 is based on the fact that the SOC change during this period is equal to the SOC change during the t3 and t4 period, i.e., z e ( t 3 ) z e ( t 4 ) = z e ( t 1 ) z e ( t 2 ) . Then, according to Equation (21), the value of the current sensor fault If can be derived as follows
r ( t 3 , t 4 ) r ( t 1 , t 2 ) = t 3 t 4 η I f ( t ) t 3 t 4 η I m ( t ) + t 1 t 2 η I m ( t ) z e ( t 1 ) z e ( t 2 ) t 3 t 4 η I f ( t ) = ( r ( t 3 , t 4 ) r ( t 2 , t 1 ) ) ( z e ( t 1 ) z e ( t 2 ) ) + t 3 t 4 η I m ( t ) t 1 t 2 η I m ( t )
When the current sensor fault If is obtained, the fault-tolerant control of the battery parameters and states is carried out as follows:
U t , m , k = O C V e , k a 1 O C V e , k + a 1 U t , k 1 + a 2 ( I m , k I f ) + a 3 ( I m , k 1 I f )
{ [ U p , k + 1 z e , k ] = [ exp ( Δ t / τ k ) U p , k + ( 1 exp ( Δ t / τ k ) ) R p , k ( I m , k I f ) z e , k 1 η ( I m , k I f ) Δ t Q ] + w k U t , m , k = O C V k U p , k ( I m , k I f ) R o , k + v k
When a sensor fault occurs, Equations (19) and (22) can be used to quickly obtain the fault values and avoid the difficulty in retuning the parameters required to build the augmented model. The process of fault identification and fault-tolerant control is summarized as shown in Figure 3.

5. Verification and Discussion

5.1. Experiments

The effectiveness of the proposed diagnosis scheme and fault-tolerant control strategy was verified by conducting experimental tests and simulating studies on a LiNiMnCoO2 cell. The rated capacity and voltage are 2.1 Ah and 3.6 V, respectively. The dynamic stress test (DST) data when the sensors have no faults, that is, the current and voltage profiles, are shown in Figure 4. The corresponding reference SOC in the sensor fault-free condition is illustrated in Figure 5. To simulate the voltage sensor fault and current sensor fault, a voltage of 0.25 V and a current of 0.25 A were injected into the voltage and current profiles shown in Figure 4, respectively.

5.2. Sensor Fault Detection

In the absence of a sensor fault, the residuals based on OCV and capacity are shown in Figure 6 and Figure 7. The absolute value of residual r1 remains within 0.1 V in the 10–100% SOC interval and exceeds 0.1 V in the 0–10% SOC interval. That is to say, the residual r1 has a higher false alarm rate in the low SOC interval and is more suitable for fault diagnosis in the middle and high SOC intervals. As for the capacity residuals that cannot be used at the beginning of discharge, the residuals obtained by different t1 and t2 have different effects in the discharge process. The residual r2 is relatively smooth and stable throughout the discharge process, which is very close to the reference capacity Qr, but the missed alarm rate is higher in the later stage of the discharge. r3 is the capacity residual obtained by continuously calculating the data of 600 sampling points (that is, the SOC change is less than 5%) during the discharge process. The maximum value exceeds 0.1 Ah in the low SOC interval, which means the false alarm rate is higher in the low SOC range. r4, r5, and r6 are the capacity residuals calculated according to Equation (12) using the data of 1200, 1800, and 3600 sampling points during the discharge process. The SOC change in these residuals exceeds 5%. Note that the smaller the SOC change, the greater the residual value in the low SOC interval, which also means higher sensitivity to a sensor fault. Therefore, for the dynamic operating conditions shown in Figure 4, the residual r1 participates in the sensor fault diagnosis in the high and middle SOC intervals, the residuals of r2 and r3 only participate in the sensor fault diagnosis in the middle SOC interval, and r4, r5, and r6 participate in both the middle and low SOC intervals.
Residual responses for when a voltage sensor fault occurred at the 50th minute are illustrated in Figure 8. r1 exceeds the threshold Jv in 51.1 min, rises rapidly to 0.245 V, and then fluctuates around 0.25 V until the battery is discharged to 10% SOC. r3 exceeds the threshold Jc in 54.5 min, followed by r4, r5, r6, and r2, which is consistent with our expectation that the smaller the SOC change, the higher the sensitivity to a sensor fault. In addition, it can be seen that the OCV residual takes a shorter time to detect the voltage sensor fault than the capacity residuals.
Residual responses for a current sensor fault occurring at the 50th minute are shown in Figure 9. r1 increases slowly after the current sensor fault occurs, exceeds the threshold Jv at 72.4 min, and continues to increase slowly. Similar to the occurrence of a voltage sensor fault, among the five capacity residuals, r3 with a relatively smaller SOC change is still the first to exceed the threshold Jc at 62.4 min. However, unlike the voltage sensor fault diagnosis, the capacity residuals take a shorter time to detect the current sensor fault than the OCV residual.
Since the voltage and current sensor faults are first detected through r1 and r3 shown in Figure 10, the sensor fault values can be calculated by Equations (19) and (22), respectively. For the voltage sensor fault, ta and tb are 56.3 min and 61.3 min, respectively, the average value of the voltage sensor fault Uf is 0.247 V, and the fault error is 0.003 V. If tb is farther from ta, the fault value Uf may be more accurate, but it will cause the later time to start fault-tolerant control. Therefore, this study chooses the mean value of the residual r1 within 5 min as the fault value. Figure 11a shows the fault-tolerant control process of battery parameter identification. The battery static characteristic parameter OCV is automatically corrected to the reference value from 61.3 min based on the voltage fault value and the SOC difference caused by the fault.
For the current sensor fault, the time when r3 reaches the threshold Jc is selected as t4, namely 62.4 min, t3 is set to be 10 min forward from t4, the SOC change between t3 and t4 is calculated, and t1 and t2 are selected when the sensor does not fail. The selection of t1 and t2 is based on the fact that the SOC change during this period is equal to the SOC change during the t3 and t4 period. Then, according to Equation (22), the fault value of the current sensor If is set to 0.245 A, and the error is 0.005 A. Figure 11b shows the fault-tolerant control process of battery state estimation. The battery SOC is automatically corrected to the reference value based on the current fault value and the SOC difference caused by the fault from 62.4 min.

6. Conclusions

In this paper, a hybrid sensor fault diagnosis scheme and fault-tolerant control strategy are proposed. The hybrid fault diagnosis scheme realizes the diagnosis of a current sensor fault and voltage sensor fault by calculating multiple OCV and capacity residuals in parallel. Further, the sensor fault values are derived by postprocessing the residuals applied to the fault-tolerant control of parameter identification and state estimation. Finally, simulations and experimental studies were conducted in a commercial NMC lithium-ion battery cell to verify the fault diagnosis scheme and fault control strategy. One shortcoming of this method is that it is only suitable for faster sampling frequencies and not suitable for operating conditions with large sampling intervals. Taking into account the number of calculations, this study chose five capacity residuals. In view of the different sensitivity of different residuals to faults, selecting the appropriate capacity residuals to meet complex vehicle practical application conditions is the focus of our future research.

Author Contributions

Conceptualization, C.W. and Z.C.; methodology, Q.Y.; validation, Z.C., and J.L.; formal analysis, R.X.; writing—original draft preparation, Q.Y.; writing—review and editing, R.X.; All authors have read and agreed to the published version of the manuscript.

Funding

This work has been supported by the Shandong Provincial Natural Science Foundation Project (ZR2020ME209) and the National Natural Science Foundation of China (Grant No. 51977029).

Institutional Review Board Statement

Not applicable.

Informed Consent Statement

Not applicable.

Data Availability Statement

Data sharing not applicable.

Acknowledgments

The systemic experiments of the lithium-ion batteries were performed at the Advanced Energy Storage and Application (AESA) Group, Beijing Institute of Technology.

Conflicts of Interest

The authors declare no conflict of interest. As Rui Xiong, a co-author of this paper, is an assocaite EIC of Energies, he was blinded to this paper during the review, and the paper is independently handled by other editor.

References

  1. Jaguemont, J.; Boulon, L.; Dube, Y. A comprehensive review of lithium-ion batteries used in hybrid and electric vehicles at cold temperatures. Appl. Energy 2016, 164, 99–114. [Google Scholar] [CrossRef]
  2. Xing, Y.; Ma, E.W.M.; Tsui, K.-L.; Pecht, M. Battery Management Systems in Electric and Hybrid Vehicles. Energies 2011, 4, 1840–1857. [Google Scholar] [CrossRef]
  3. Chen, C.; Xiong, R.; Yang, R.; Shen, W.; Sun, F. State-of-charge estimation of lithium-ion battery using an improved neural network model and extended Kalman filter. J. Clean. Prod. 2019, 234, 1153–1164. [Google Scholar] [CrossRef]
  4. Chen, Z.; Zhang, Q.; Lu, J.; Bi, J. Optimization-based method to develop practical driving cycle for application in electric ve-hicle power management: A case study in Shenyang, China. Energy 2019, 186, 115766. [Google Scholar] [CrossRef]
  5. Xiong, R.; Li, L.; Yu, Q.; Jin, Q.; Yang, R. A set membership theory based parameter and state of charge co-estimation method for all-climate batteries. J. Clean. Prod. 2020, 249, 119380. [Google Scholar] [CrossRef]
  6. Jiang, Y.; Jiang, J.; Zhang, C.; Zhang, W.; Gao, Y.; Li, N. State of health estimation of second-life LiFePO4 batteries for energy storage applications. J. Clean. Prod. 2018, 205, 754–762. [Google Scholar] [CrossRef]
  7. Berecibar, M.; Garmendia, M.; Gandiaga, I.; Crego, J.; Villarreal, I. State of health estimation algorithm of LiFePO4 battery packs based on differential voltage curves for battery management system application. Energy 2016, 103, 784–796. [Google Scholar] [CrossRef]
  8. Yu, Q.; Xiong, R.; Yang, R.; Pecht, M.G. Online capacity estimation for lithium-ion batteries through joint estimation method. Appl. Energy 2019, 255, 113817. [Google Scholar] [CrossRef]
  9. Abada, S.; Marlair, G.; Lecocq, A.; Petit, M.; Sauvant-Moynot, V.; Huet, F. Safety focused modeling of lithium-ion batteries: A review. J. Power Sources 2016, 306, 178–192. [Google Scholar] [CrossRef]
  10. Wang, Z.; Hong, J.; Liu, P.; Zhang, L. Voltage fault diagnosis and prognosis of battery systems based on entropy and Z -score for electric vehicles. Appl. Energy 2017, 196, 289–302. [Google Scholar] [CrossRef]
  11. Feng, X.; He, X.; Lu, L.; Ouyang, M. Analysis on the Fault Features for Internal Short Circuit Detection Using an Electro-chemical-Thermal Coupled Model. J. Electrochem. Soc. 2018, 165, A155–A167. [Google Scholar] [CrossRef]
  12. Yang, R.; Xiong, R.; Shen, W.; Lin, X. Extreme Learning Machine Based Thermal Model for Lithium-ion Batteries of Electric Vehicles under External Short Circuit. Engineering 2020. [Google Scholar] [CrossRef]
  13. Xia, B.; Shang, Y.; Nguyen, T.; Mi, C. External Short Circuit Fault Diagnosis Based on Supervised Statistical Learning. In 2017 IEEE Transportation Electrification Conference and Expo, Asia-Pacific (ITEC Asia-Pacific); IEEE: Piscataway, NJ, USA, 2017; pp. 1–5. [Google Scholar]
  14. Feng, X.; Weng, C.; Ouyang, M.; Sun, J. Online internal short circuit detection for a large format lithium ion battery. Appl. Energy 2016, 161, 168–180. [Google Scholar] [CrossRef] [Green Version]
  15. Xiong, Q.; Yu, L.Y. Open circuit voltage and state of charge online estimation for lithium ion batteries. Energy Procedia 2017, 142, 1902–1907. [Google Scholar] [CrossRef]
  16. Ouyang, M.; Feng, X.; Han, X.; Lu, L.; Li, Z.; He, X. A dynamic capacity degradation model and its applications considering varying load for a large format Li-ion battery. Appl. Energy 2016, 165, 48–59. [Google Scholar] [CrossRef] [Green Version]
  17. Sahraei, E.; Campbell, J.C.; Wierzbicki, T. Modeling and short circuit detection of 18650 Li-ion cells under mechanical abuse conditions. J. Power Sources 2012, 220, 360–372. [Google Scholar] [CrossRef]
  18. Lin, X.; Stefanopoulou, A.G. Analytic Bound on Accuracy of Battery State and Parameter Estimation. J. Electrochem. Soc. 2015, 162, A1879–A1891. [Google Scholar] [CrossRef] [Green Version]
  19. Xia, B.; Mi, C. A fault-tolerant voltage measurement method for series connected battery packs. J. Power Sources 2016, 308, 83–96. [Google Scholar] [CrossRef]
  20. Venkatasubramanian, V.; Rengaswamy, R.; Yin, K.; Kavuri, S.N. A review of process fault detection and diagnosis. Comput. Chem. Eng. 2003, 27, 293–311. [Google Scholar] [CrossRef]
  21. Xiong, R.; Yu, Q.; Shen, W. Review on sensors fault diagnosis and fault-tolerant techniques for lithium ion batteries in electric vehicles. In Proceedings of the 2018 13th IEEE Conference on Industrial Electronics and Applications (ICIEA), Wuhan, China, 31 May–2 June 2018. [Google Scholar]
  22. Zheng, C.; Chen, Z.; Huang, D. Fault diagnosis of voltage sensor and current sensor for lithium-ion battery pack using hy-brid system modeling and unscented particle filter. Energy 2020, 191, 116504. [Google Scholar] [CrossRef]
  23. Liu, Z.; He, H. Model-based Sensor Fault Diagnosis of a Lithium-ion Battery in Electric Vehicles. Energies 2015, 8, 6509–6527. [Google Scholar] [CrossRef]
  24. Liu, Z.; He, H. Sensor fault detection and isolation for a lithium-ion battery pack in electric vehicles using adaptive ex-tended Kalman filter. Appl. Energy 2017, 185, 2033–2044. [Google Scholar] [CrossRef]
  25. Dey, S.; Mohon, S.; Pisu, P.; Ayalew, B. Sensor Fault Detection, Isolation, and Estimation in Lithium-Ion Batteries. IEEE Trans. Control. Syst. Technol. 2016, 24, 2141–2149. [Google Scholar] [CrossRef]
  26. Biron, Z.A.; Pisu, P.; Ayalew, B. Observer-Based Diagnostic Scheme for Lithium-Ion Batteries. In Proceedings of the ASME 2015 Dynamic Systems and Control Conference, Columbus, OH, USA, 28–30 October 2015. [Google Scholar]
  27. Ablay, G. An Observer-Based Fault Diagnosis in Battery Systems of Hybrid Vehicles. In Proceedings of the 2013 8th International Conference on Electrical and Electronics Engineering (ELECO), San Francisco, CA, USA, 18–19 May 2013; IEEE: Piscataway, NJ, USA, 2013; Volume 2013, pp. 238–242. [Google Scholar]
  28. Couto, L.D.; Kinnaert, M. Internal and Sensor Fault Detection and Isolation for Li-ion Batteries. IFAC-PapersOnLine 2018, 51, 1431–1438. [Google Scholar] [CrossRef]
  29. Yu, Q.; Xiong, R.; Lin, C. Model-Based Sensor Fault Detection for Lithium-Ion Batteries in Electric Vehicles. In 2019 IEEE 89th Vehicular Technology Conference (VTC2019-Spring); Institute of Electrical and Electronics Engineers (IEEE): Piscataway, NJ, USA, 2019; pp. 1–4. [Google Scholar]
  30. Xu, J.; Wang, J.; Li, S.; Cao, B. A Method to Simultaneously Detect the Current Sensor Fault and Estimate the State of Energy for Batteries in Electric Vehicles. Sensors 2016, 16, 1328. [Google Scholar] [CrossRef] [Green Version]
  31. Xiong, R.; Yu, Q.; Shen, W.; Lin, C.; Sun, F. A Sensor Fault Diagnosis Method for a Lithium-Ion Battery Pack in Electric Vehi-cles. IEEE Trans. Power Electron. 2019, 34, 9709–9718. [Google Scholar] [CrossRef]
  32. Karimi, S.; Gaillard, A.; Poure, P.; Saadate, S. Current Sensor Fault-Tolerant Control for WECS with DFIG. IEEE Trans. Ind. Electron. 2009, 56, 4660–4670. [Google Scholar] [CrossRef]
  33. Bianchi, F.D.; Ocampo-Martinez, C.; Kunusch, C.; Sánchez-Peña, R.S. Fault-tolerant unfalsified control for PEM fuel cell sys-tems. IEEE Trans. Energy Convers. 2015, 30, 307–315. [Google Scholar] [CrossRef] [Green Version]
  34. Zhao, S.; Duncan, S.R.; Howey, D.A. Observability Analysis and State Estimation of Lithium-Ion Batteries in the Presence of Sensor Biases. IEEE Trans. Control. Syst. Technol. 2016, 25, 326–333. [Google Scholar] [CrossRef] [Green Version]
  35. Xiong, R.; Yu, Q.; Wang, L.Y.; Lin, C. A novel method to obtain the open circuit voltage for the state of charge of lithium ion batteries in electric vehicles by using H infinity filter. Appl. Energy 2017, 207, 346–353. [Google Scholar] [CrossRef]
  36. Yu, Q.-Q.; Xiong, R.; Wang, L.-Y.; Lin, C. A Comparative Study on Open Circuit Voltage Models for Lithium-ion Batteries. Chin. J. Mech. Eng. 2018, 31, 65. [Google Scholar] [CrossRef] [Green Version]
  37. Hu, X.; Sun, F.; Zou, Y.; Peng, H. Online estimation of an electric vehicle Lithium-Ion battery using recursive least squares with forgetting. In Proceedings of the 2011 American Control Conference, San Francisco, CA, USA, 29 June–1 July 2011. [Google Scholar]
  38. Yu, Q.; Xiong, R.; Lin, C.; Shen, W.; Deng, J. Lithium-Ion Battery Parameters and State-of-Charge Joint Estimation Based on H-Infinity and Unscented Kalman Filters. IEEE Trans. Veh. Technol. 2017, 66, 8693–8701. [Google Scholar] [CrossRef]
  39. Li, Z.; Xiong, R.; Mu, H.; He, H.; Wang, C. A novel parameter and state-of-charge determining method of lithium-ion battery for electric vehicles. Appl. Energy 2017, 207, 363–371. [Google Scholar] [CrossRef]
Figure 1. First-order resistor-capacitor battery model.
Energies 14 00829 g001
Figure 2. Sensor fault diagnosis scheme.
Energies 14 00829 g002
Figure 3. Senor fault identification and tolerant control.
Energies 14 00829 g003
Figure 4. Dynamic stress test (DST) test at 25 °C in the sensor fault-free condition: (a) current profile; (b) voltage profile.
Energies 14 00829 g004
Figure 5. Reference state of charge (SOC) in the sensor fault-free condition.
Energies 14 00829 g005
Figure 6. Estimated open-circuit voltage (OCV) and the residual r1: (a) OCV; (b) r1.
Energies 14 00829 g006
Figure 7. Estimated capacity and capacity residuals: (a) capacity; (b) r2, r3, r4, r5, and r6.
Energies 14 00829 g007
Figure 8. Residual responses for a voltage sensor fault: (a) r1; (b) r2, r3, r4, r5, and r6.
Energies 14 00829 g008
Figure 9. Residual responses for a current sensor fault: (a) r1; (b) r2, r3, r4, r5, and r6.
Energies 14 00829 g009
Figure 10. Residual responses for sensor faults: (a) r1 for a voltage sensor fault; (b) r3 for a current sensor fault.
Energies 14 00829 g010
Figure 11. Fault-tolerant control for parameter identification and state estimation: (a) OCV; (b) SOC.
Energies 14 00829 g011
Publisher’s Note: MDPI stays neutral with regard to jurisdictional claims in published maps and institutional affiliations.

