Article

Discounting for Energy Transition Policies—Estimation of the Social Discount Rate for Poland

Department of Investment, College of Finance, University of Economics in Katowice, 40-287 Katowice, Poland
*
Author to whom correspondence should be addressed.
Energies 2021, 14(3), 741; https://doi.org/10.3390/en14030741
Submission received: 10 January 2021 / Revised: 25 January 2021 / Accepted: 27 January 2021 / Published: 31 January 2021

Abstract

:
The transition of the energy system in Poland has a long time horizon and demands a substantial investment effort supported by proper economic evaluation. It requires a precise Social Discount Rate (SDR) estimation as discounting makes the present value of long-term effects extremely sensitive to the discount rate level. However, Polish policymakers have little information on SDR: the predominant practice applies a priori fixed 5% discount rate, while studies devoted only to Poland are quite rare. To eliminate this research gap, our paper aims at estimating SDR for Poland, applicable in energy transition policies. We derive SDR for three datasets varying in length, twofold: using market rates via Consumption Rate of Interest (CRI) and Social Opportunity Cost (SOC) of capital, and prescriptive Ramsey and Gollier approaches based on Social Welfare Function (SWF). The results indicate that the rates based on CRI and SOC deviate substantially with changing data timeframes and market conditions, while prescriptive methods show much higher time stability. Due to long-term planning horizons for energy policies, we argue for adopting, as SDR in Poland, the longest dataset’s Ramsey-based rate of 4.72% which can be reduced to 4.39% by Gollier’s precautionary term (reflecting the uncertainty over future consumption growth), which are our main findings.

1. Introduction

The issue of energy sector transition is a conglomerate of many issues as well as methods of analysis in search of effective solutions. This paper concentrates on the problems of economic evaluation of investment projects, whose implementation is in line with the priorities of Poland’s long-term energy policy, and particularly the issue of discount rate estimation that should be adopted to improve the appraisal process of such investments.
The necessity of using discounting in the appraisal methods is not subject to discussion and it is not our intention to question its necessity. However, an important issue is the methodology of estimating the level of this rate that should be adopted for long-term projects with a significant share of positive externalities. In commercial investment projects, the commonly used method of discount rate estimation is the investor’s cost of capital. This method in regard to the analysed projects cannot be effectively applied for at least two reasons.
First, investments in energy transition are not commercial investments in the strict sense of the word. The effectiveness of these investments is more of a social nature rather than a specifically financial one. Second, the time perspective of such investments is very long (e.g., the European Green Deal perspective reaches 2050 [1] or energy transitions fighting global warming operating with time horizons over centuries [2]) which makes the classic approach to discount rate entirely inapplicable, as it leads to an excessive depreciation of long-term effects, which may, therefore, wrongly indicate ineffectiveness. By the same token, a Social Discount Rate (SDR) should be used instead of a commercial one for the appraisal of this type of investment.
In this context, the paper presents the methodology and results of estimating the level of the SDR for evaluation of the social effectiveness of long-term energy investment projects. Considering the fact that the prevailing practice in Poland is the application of a fixed 5% SDR value based on the EU recommendation for CEE countries, the findings can fill the gap and improve the process of energy investment evaluation, particularly in light of the substantial expenditures needed to meet the goals of the European Green Deal. The results can also be found relevant for policymakers, private and public investors as well as researchers, as the number of studies in this area is still insufficient.

1.1. Policy of Energy Sector Transition in Poland—The Timeframe and Financing Requirements

The plans for energy transition policy in Poland give two premises to focus particularly on the discount rate needed at the evaluation stage: long timeframe and substantial investment needs.
Any sectoral policy, by defining its priorities, covers a specific time horizon. The 2040 perspective is most often mentioned for the transition policy of Poland’s energy sector. It has therefore been assumed that the temporal turning point of the analysis is the perspective of the year 2040 as the time by which Poland’s energy policy will practically have been established and implemented. In November 2018, the document “Poland’s energy policy until 2040” was published [3]. The document is a guidance project, which was refined and updated in September 2020. According to this document, Poland’s policy of changes in the broadly understood energy sector has been based on three pillars: fair transition, zero-emission energy system, and significant improvement in air quality. The main areas of energy policy transition in Poland [4] include such aims as reduction in greenhouse gas emissions by 40% by 2030 (compared to 1990), increase in the share of renewable energy to 32%, increase in energy efficiency by energy saving at the level of 23% by 2030, which, apart from long-term horizons, are inextricably linked with substantial investment needs.
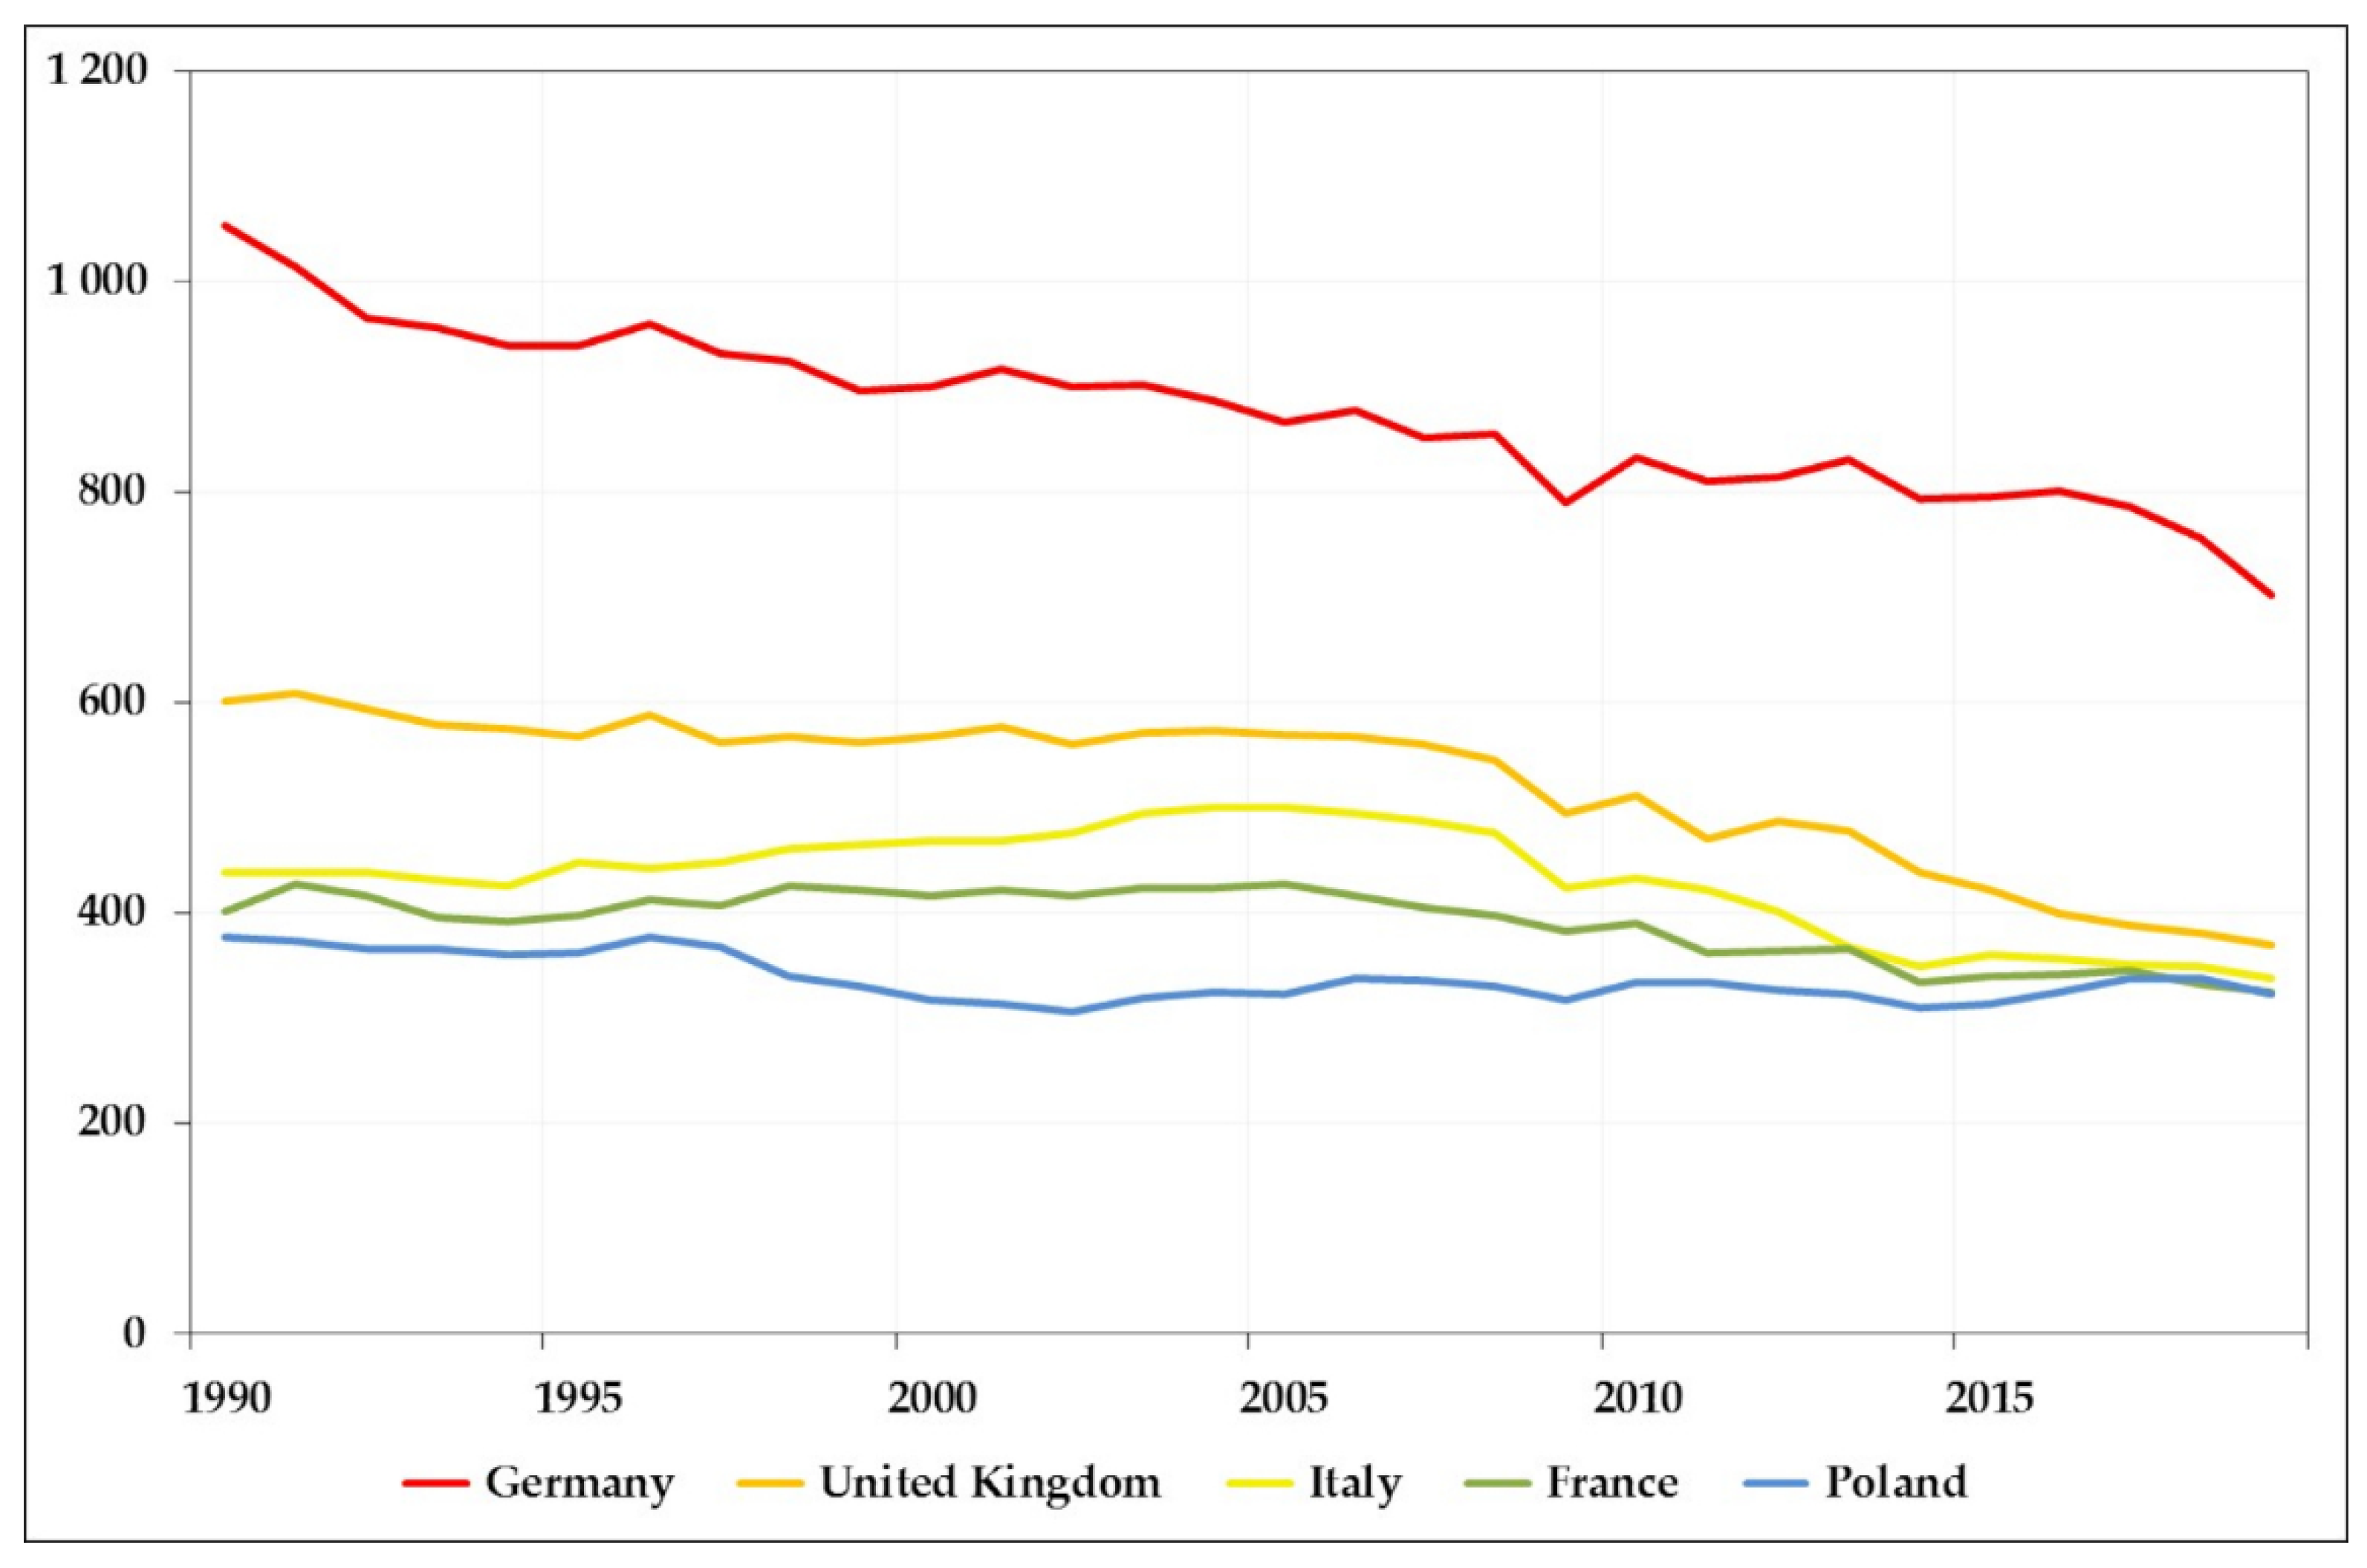
An important and costly goal to be reached is the reduction in CO2 emissions. Poland has a particularly difficult task in this regard. The country ranks 5th in Europe among the largest emitters of carbon dioxide; moreover, after a significant decline in 1990s (by approx. 27.4% compared to 1989), since 2002, CO2 emissions have remained relatively stable and no further improvement can be observed, especially when compared to other top CO2 emitters in the EU (Figure 1). Not only does it illustrate the scale of the problem, but also the scale of necessary expenditure to be made.
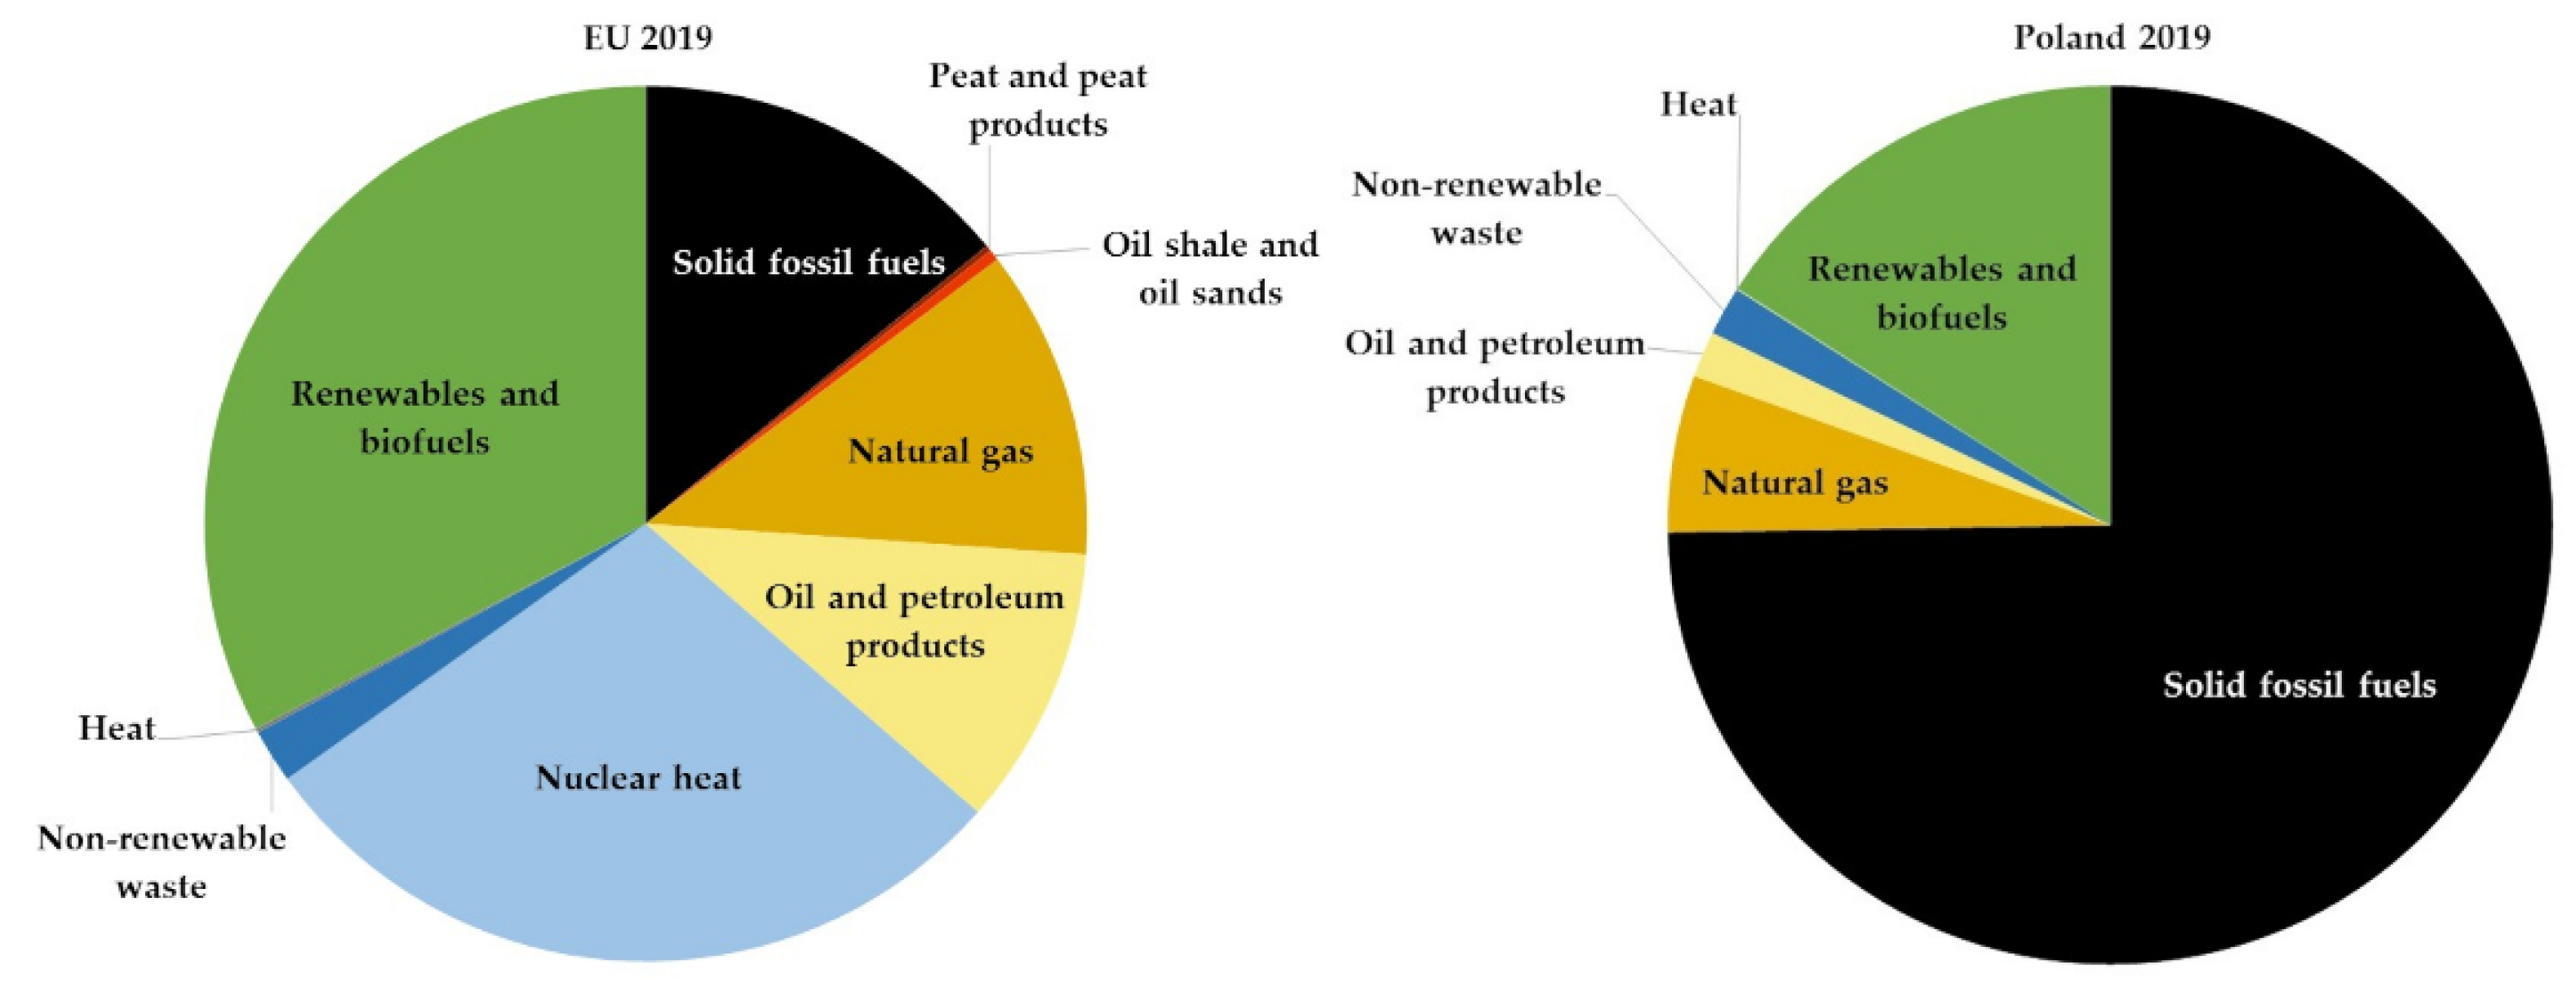
Poland has to accomplish substantial tasks in the field of renewable energy, both for the current period and from the 2040 perspective. Eurostat has published records on the share of renewable energy sources (RES) in the markets of the Community countries [6]. They confirmed the concerns that Poland has failed to fulfil EU guidelines regarding the 20% share of RES in energy consumption by the end of 2020. In 2019, this level was 12.2%, with significantly higher shares of hard coal, lignite, crude oil, and natural gas (see Figure 2 to compare the energy mix structure for Poland and the EU in 2019). The forecasts for 2040 are also not particularly optimistic; the assumed minimum value of 32% will be difficult to achieve and very capital-intensive.
Four basic indicators have been defined for Poland’s energy transition and they should be achieved by 2030 as an implementation stage of the 2040 adopted policy [3]:
  • Share of hard coal in electricity generation at a level not higher than 56% (target for 2030);
  • RES share in final energy consumption at a level of not less than 23%;
  • Implementation of nuclear energy (target for 2033);
  • Reduction in greenhouse gas (GHG) emissions by 30% compared to 1990 emissions.
In the strategic area of increasing energy efficiency for Poland, it is assumed that the final energy savings in the period between 1 January 2021 and 31 December 2030 should amount to no less than 5.6 million tonnes of oil equivalent, and the total cumulative final energy savings in the years 2021−2030, calculated in accordance with the guidelines of the amended EED Directive (Energy Efficiency Directive) with the use of forecasts on the average annual final energy consumption for 2016−2018, will amount to 3.6 thousand tonnes of oil equivalent [4]. This comes from Directive 2018/2002/EU, which aims at saving the final energy by 32.5% compared to the reference scenario. This means that in the years 2021−2030, the total savings in final energy consumption should be equivalent to annual new savings of 0.8% of the average annual final energy consumption in 2016−2018. In the ten-year time perspective, the cost of implementing the tasks set out in the amended Energy Efficiency Act is to amount to approximately EUR 1.5 billion [8].
Key activities will consist of targeted investments that will allow the assumed goals to be attained. The main priorities of capital expenditure are: transition of coal regions, reduction in energy poverty, new industries related to RES and nuclear energy, offshore wind energy, local and prosumer energy, transition of heating, electrification of transport. For Poland, the key issue is the departure from hard coal as the basic energy carrier. Due to the adopted assumptions, the use of hard coal to generate electricity is expected to drop to 37% in 2030 (from the current level of 70%), while in 2040—up to 11%. In urbanized areas, coal should be abandoned as a heat source by 2030, and in rural areas—by 2040.
Implementation of the adopted policy for Poland will require a very wide range of activities and very significant investment expenditure. About EUR 50 billion will be allocated to the national energy and climate transition from EU and national funds under various mechanisms by 2030, including e.g., Cohesion Policy (allocation for Poland of approx. EUR 20 billion), Recovery and Resilience Facility (allocation for Poland of approx. EUR 7 billion), The Just Transition Fund (allocation for Poland of approx. EUR 3.5 billion) [9], or new instruments that will support the transition of the energy system in Poland, such as the Modernization Fund and the National Target Fund, supplied with funds from the sale of CO2 emission allowances. Initial estimates indicate the possibility of obtaining over EUR 10 billion [10].
Assuming investment expenditure at the level of around EUR 50 billion in the next 10 years and accepting an equal spending rate for each year, we have an estimated level of investment expenditure of around EUR 100 billion by the end of 2040, in 2020 prices, for the implementation of Poland’s energy transition strategy. On the other hand, these investments will increase GDP by approx. EUR 50−77 billion, according to the report of the Jagiellonian Institute [11]. However, these estimates are not unambiguous due to the time perspective and complexity of the problem. According to, for example, the Polish Electricity Association, the investment expenditure that will have to be incurred for the transition of the energy sector by 2030 will be in the range of EUR 60−70 billion, and in the perspective of 2050, EUR 130−175 billion [12].

1.2. Social Discount Rate—Methods and Application in Energy Investments

The range of tasks and the anticipated level of investment expenditure presented in the preceding section as well as the unique political, technological, and financial complexity of the expected benefits of energy transition require a number of questions to be asked. In the context of the economic effectiveness of these undertakings, it needs to be highlighted that, first, such projects are not typical commercial activities, where market prices fully reflect the fair value of inputs and outputs due to a considerable amount of externalities, and second, the time frame of energy-related projects in many cases extends far beyond the reach of the financial markets perspective, which is usually not more than 30 years, e.g., green transformation to cut down carbon dioxide emissions or nuclear power plants echo for centuries.
These efficiency questions are usually managed by evaluation via cost–benefit analysis (CBA), which allows for proper adjustments aimed at reflecting social effectiveness instead of private effectiveness. This also includes the price of capital reflecting the social view on how future benefits and costs should be valued against present ones, represented by Social Discount Rate. All those costs and benefits are given in shadow prices used in CBA to reflect their true value for society [13]. What must be highlighted is the fact that choosing an appropriate discount rate is an important stage for any investment project evaluation process. The widely accepted process of evaluation rests on a discounted cash flow approach represented by the Net Present Value criterion that summarises all cash inflows and outflows generated by the project, transforming them first into the present value equivalent. The choice of discount rate may be decisive for the outcome in the analysis where outlays (born today therefore remaining undiscounted) are confronted with future (therefore, discounted) cash flows. For energy-related projects, this task is even more meaningful due to the long timeframe of evaluation as it makes present value extremely sensitive to slight variances in discount rate values (e.g., effect of EUR 1 appearing after 30 years is reduced by ¾ when discounted at 5%; raising the rate to 7% makes present value lower by 7/8 and these discrepancies soar for longer periods) [14].
This transformation via discounting is an essential part of economic analysis as it reflects the returns of alternative opportunities that are lost due to choosing the project being evaluated. In a perfectly competitive economy (complete set of perfectly competitive markets), free from any market distortions, the marginal social opportunity cost of funds (and SDR) would be reflected by market interest rates, equalising the supply side reflected by the social rate of time preference (SRTP) and demand—by the social opportunity cost of capital (SOC). Since the economy and markets are distorted, the price of capital diverges from the optimum and needs to be estimated [15]. However, while SDR is widely applied in the public investment evaluation and its definition seems to be clear and unequivocal, the theoretical approaches to the estimation as well as empirical results to achieve “the proper” value are still widely discussed in the literature and no consensus has been achieved so far [16,17]. This paper concentrates on the two sides of the capital market: SRTP and SOC form two main strands in the literature, making the effort of delivering the proper measure of SDR.
The Social Rate of Time Preference represents discounting appropriate for benefits and costs measured in consumption units [18]. Using this approach for discounting in project evaluation, we implicitly assume that public investments are financed from savings (therefore, crowding out current consumption). Then, the SRTP approach serves for intertemporal exchange in consumption. Some solutions concentrate on intertemporal preferences observed via financial instruments and are based on the consumption rate of interest (CRI) approximated by the long-term real after-tax return on savings [19,20]. This is justified by the fact that intertemporal preferences of individuals towards saving can be applied to assess the government policy influencing the consumption of those individuals. The alternative is a prescriptive approach exercising social welfare function (SWF) maximised over time to deliver the Ramsey formula, which adds up the pure time preference reflecting society’s impatience and the element mirroring the consumption opportunity cost lost by society when investing [15,21]. The latter element is a product of two factors: expected growth rate of per capita consumption and the elasticity of marginal utility of consumption. The prevailing approach across Europe is represented by the Ramsey formula [22], which is also supported by the IPCC [2].
The second branch of the standpoint, the social opportunity cost of capital, focuses on efficiency in using scarce resources. The SOC approach rests on the Pareto criterion where improvement in social welfare is achieved if the investment accepted outperforms the alternatives. The government, while investing, competes for the same lot of funds as the private sector and displaces them in the case of accepting the project. Therefore, to provide welfare maximisation for society, a public investment must yield at least the same level of return as the private one. The return is represented by the marginal rate of return on private investments (return on investments, ROI) [23]. Empirical estimates of SOC use financial market rates, i.e., the real before-tax rate of return on corporate bonds or exercise national income accounts to calculate the profitability of the private sector as a contribution to GDP [24,25].
A separate point of discussion in the literature aims at dealing with the long-term issue, particularly intergenerational investment impacts. In general, these approaches argue for lower discount rates, particularly a declining discount rate (DDR) schedule, as it reduces the sensitivity of distant effects to discounting. However, epistemological roots of the decline vary tremendously. The three of them are the most widely discussed. The enlarged Ramsey formula is a predominant approach to solve this task [2], designed to capture the risk towards level of future consumption via embracing the volatility over future growth rate [26] or certainty equivalent discount factors, referred to as “gamma discounting” [27]. There are two alternative approaches: expert judgements to elicit specific values of long-term SDR [28,29] and questionnaires to investigate the stated intertemporal preferences of the general public [30,31].
While SDR is based on a diversified set of approaches, they also lead to diverging estimates. The highest rates are usually produced by the SOC approach, reaching 6–8% for developed countries [16,23] or even higher for developing countries (e.g., 11% for South Africa [25]). Ramsey-based results vary as well, mainly due to differences in the consumption growth rate, with values of approx. 4% for developed countries, such as the UK, the US, Germany, Italy, or France [32,33], from 2% to over 6% for the EU [34], and for developing countries varying from China’s 15% to negative rates for some African countries [2,17]. The lowest estimates come from the CRI approach (1–3%) [16]. Uncertainty in discounting followed by the Gollier proposal leads to estimates lower by approx. 0.3–0.5% than the regular Ramsey formula [35,36]. In general, DDRs decline to approx. 1%, but the values vary between 0.5% and 4% depending on the approach [29,31,37].
Discounting regimes also vary among official recommendations between countries. The majority of EU countries follow the Ramsey approach [33] (Italy, France, the UK), recommended also in the official EU guidelines [38] or use a CRI regime based on government borrowing rates (Germany, Norway). The US, Australia, and Asian countries generally apply the SOC approach [16,17]. The DDR approach serves for long-term projects (usually with effects ranging above 30 years) in the UK [39], France, and the US (for environmentally-related investments) [36,40].
The majority of works estimating SDR for Poland are based on the Ramsey approach, resulting in values from approx. 3% to 6% [34,41,42]. The official recommendation for SDR applied in Poland, in general, follows a constant 5% discount rate and comes from the EU recommendations on discounting for CBA [38]. Long-term focused discount rates are rare in the literature. Examples include Foltyn-Zarychta [31], who estimates the rate (for intergenerational projects) declining from 5% to 0.4% for a 1000-year perspective, or Saługa [43], who applies the DDR scheme in relation to mining investments.
However, none of those studies focus on the energy sector solely. The EU recommendation of a uniform 5% may reverberate negatively on the number of projects accepted. First, this value is not supported explicitly by any in-depth study concentrating on the economic characteristics of Poland. Second, the recommended value does not account for uncertainty related to long-term intergenerational issues, particularly important for energy-related projects.

1.3. The Aim of the Study

This paper considers the issue of selecting a proper discount rate level in the efficiency calculation. The paper aims at estimating SDR for Poland which can be used for long-term energy sector transition policies. Since the level of discount rate determines the rate of depreciation of future values, and in the case of Poland, we are dealing with the need to incur exceptionally high expenditure with a long period of waiting for effects, adopting the financial discount rate would show the ineffectiveness of such investments. We share the conviction that “(…) the discussion about efficiency of energy transition policy cannot be decoupled from the social discount rate and the compensation that society requires to forego current consumption for future benefits”, especially if we take into consideration that “Discounting and the discount rate are also central elements for the determination of the social cost of carbon (SCC)” [44]. This viewpoint is supported by Steinbach and Staniaszek [45], who differentiate between individual discount rates and social discount rates in energy system analysis. From their perspective, individual discount rates should be applied in modelling individual investment decision making. However, evaluation of the total costs and benefits of energy systems requires a societal perspective to be adopted and, as a result, social discount rates application. As emphasized by Hermelink and de Jager [46], the adopted level of discount rate is crucial to the evaluation results of energy policy options. They also claim that discount rates employed in the EU Impact Assessment for the 2030 energy and climate policy framework should be significantly lowered, as was done by some EU member states (their proposal assumes calculation of the EU Weighted Average Capital Cost that is supposed to be in the range 3–6%). We investigate these problems in the following sections.
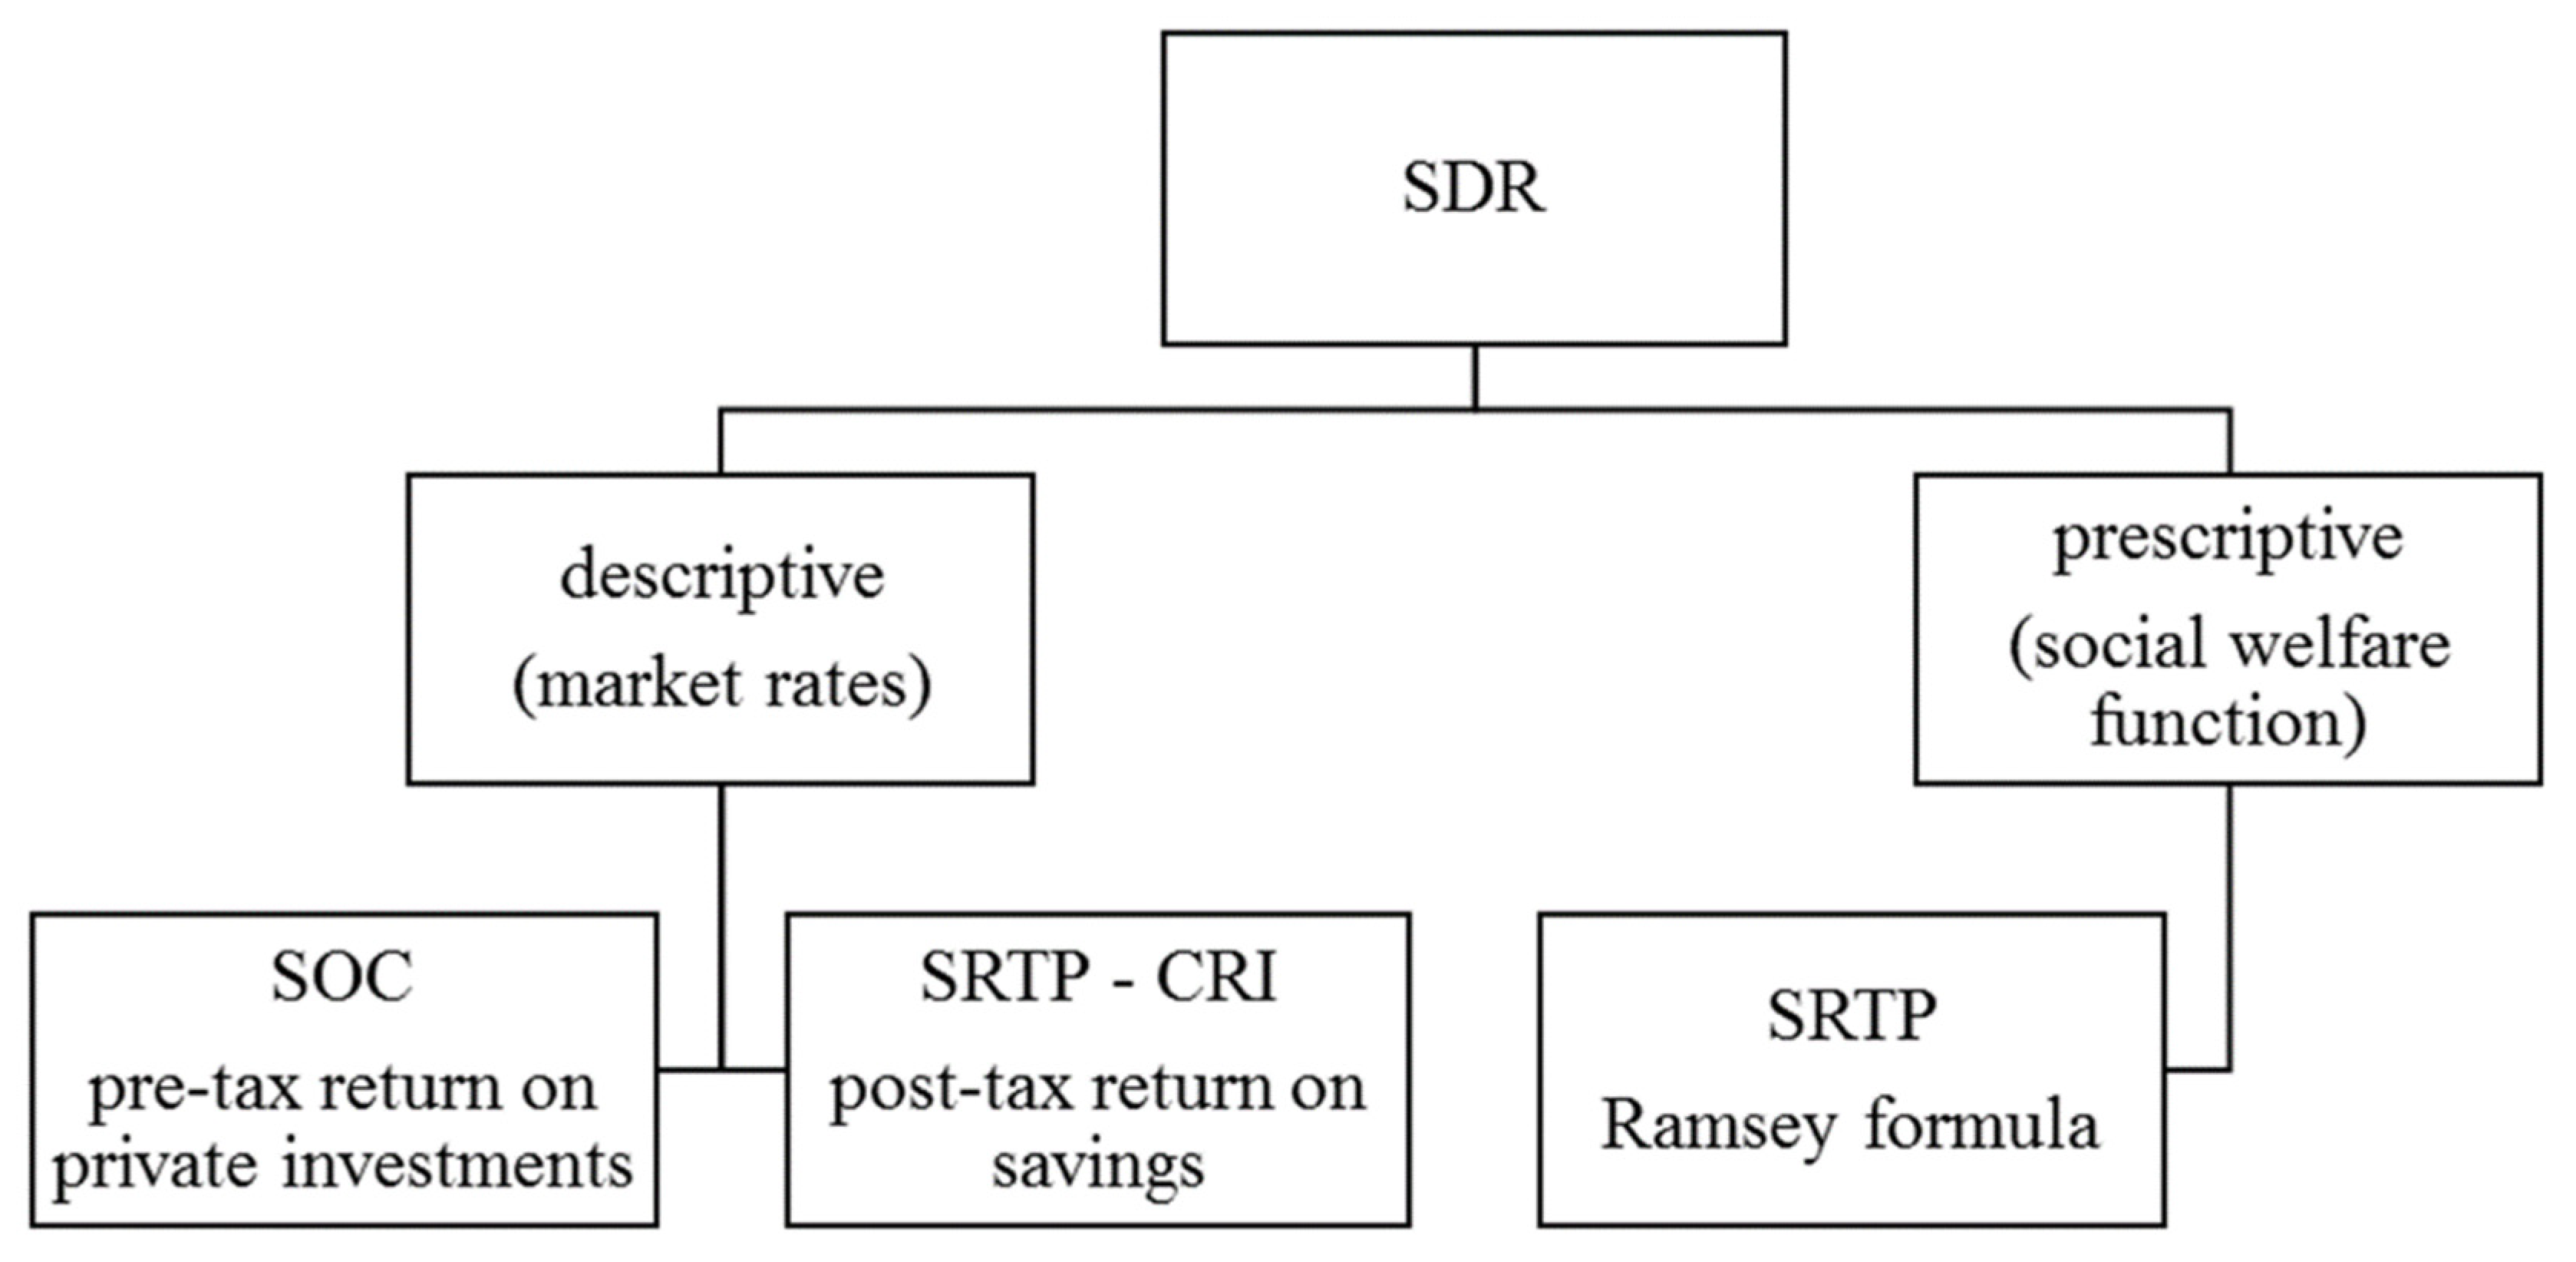
The analysis follows two strands in the literature: descriptive CRI and SOC (both market data-based) and the prescriptive Ramsey formula (social welfare function-based). While the Ramsey formula is the predominant approach of government SDR recommendations in Europe (as mentioned in the preceding section), the paper concentrates on this approach, also investigating CRI and SOC. The overview of approaches undertaken in the paper is summarised by Figure 3.
The descriptive strand analysed rests on market rates of return that approximate CRI and SOC. As recommended by Zhuang et al. [17] and Boardman et al. [20], these are based on the after-tax rate of return on low-risk financial instruments (reflecting CRI-SRTP) and the pre-tax rate of return on riskless private investments, which represents an alternative approach to SOC. The prescriptive approach delivers the value of SDR based on the social rate of time preference approach according to the Ramsey model, with the elasticity of marginal utility of consumption estimated on the basis of the personal taxation method [47]. Additionally, to deal with long-term energy policy-related impacts, we derive SDR based on Gollier’s approach [48] that includes the volatility over the growth rate of per capita consumption. To our knowledge, such combination of methods has not been applied previously for Poland.
The paper is organised as follows: Section 2 starts with describing two market-based approaches (CRI and SOC), followed by insight into the Ramsey formula and its Gollier modification. Next, the sources and treatment of data used in the study are described. The following section presents the results obtained for all approaches for three time horizons reflecting the range of data gathered. This is followed by the discussion including a recommendation of the SDR values that we find the most appropriate to use for energy policy investments. The conclusions section closes the paper.

2. Materials and Methods

2.1. SRTP-CRI Based on Real After-Tax Return on Savings

Consumption Rate of Interest (CRI) takes the angle of capital supply (savers). Boardman et al. [20] as well as Burgess [49] point out that the major distortion that causes the divergence between the demand side (enterprises) and the supply side (consumers) emerges from taxation (apart from such factors as the level of risk, liquidity, or imperfect information). The proper measure of what consumers must forgo to accept the investment is therefore given as their post-tax real returns on savings as these rates represent an agent’s postponed consumption opportunity cost.
The literature presents various estimation methods. Moore et al. [13] refer to an average monthly yield on treasury notes with various maturity lengths. Historical real returns on long-term government bonds are recommended by the U.S. Environmental Protection Agency [40] and Zhuang et al. [17], but using other low-risk securities is also possible [18] as well as consumer borrowing rates [49]. The returns to savers are reduced by tax burden in marginal terms and transformed into real rates, with average inflation (inflation forecasts) based on historical data considered [13]. Harberger and Jenkins [50] argue that the real rates for the majority of countries would stay within the range of 2–3%.

2.2. Social Opportunity Cost (SOC) Based on Market Return on Private Investments

SOC rests on the assumption that both sectors, public and private, compete for the same pool of scarce resources, so any additional investment in a public project leads to the diversion of funds from the private sector. In these circumstances, the appropriate Social Discount Rate is determined by the opportunity cost in the private sector [51].
However, it is argued that not all the components of the private marginal rate of return are included in the opportunity cost [17,52], particularly risk premia and transaction costs. The lower limit of the opportunity cost is therefore the marginal cost of government borrowing (assumed to be equal to marginal cost of taxation). The upper bound for the opportunity cost of public projects is the cost of private sector capital reduced by the post-tax differential private risk premium as well as additional transaction and illiquidity costs.
A straightforward consequence of the conducted analysis is the adoption of various market rates as proxies for the Social Opportunity Cost. According to Boardman et al. and Moore et al. [13,20], the best proxy for the upper bound of the opportunity cost is real, pre-tax rate of return on corporate bonds, as enterprises tend to equate (on the margin) the expected pre-tax investment return with the pre-tax bonds rate. It is also emphasised that the actual opportunity cost is probably significantly lower [20]. The opposite extreme of the opportunity cost estimates is the government borrowing rate, as the taxes on private financing are usually higher than those on the public one and the premium for income covariance is negligible (but generally positive). As a result, we obtain an interval for the Social Opportunity Cost.

2.3. Ramsey Approach—The Prescriptive Social Welfare Function Based Regime

SDR measured via the Ramsey model emerges from the criticism of capital market observed rates. The main point raised by the proponent is that capital markets are far from being perfect, i.e., consumers, as well as private sector investors, face a variety of rates due to information asymmetry, differences in creditworthiness, or dual roles as borrowers and lenders for consumers [15]. The Ramsey formula is based on a prescriptive approach, seen as an appropriate risk-free measure for public investments [53], emerging from the aim of intertemporal maximisation of social welfare function [21]:
W = 0 + e ρ t U ( c t ) d t
where U ( c t ) stands for utility derived by society from consumption in period t and e ρ t is a discount factor (assuming continuous compounding), with ρ as a utility discount rate that represents pure time preference. Transforming the welfare function to obtain the consumption (instead of utility) rate of discount that optimizes the productivity of capital gives the Ramsey formula (taking the premise of constant elasticity in the utility function) as:
SRTP = ρ + η g
where g is the (anticipated) growth rate of per capita consumption and η is the elasticity of marginal utility of consumption η = d U ( c t ) U ( c t ) d c t c t (the percentage reduction in the marginal utility of per capita consumption due to a 1% increase in per capita consumption). The product of g and η represents the fact that as society is becoming richer per capita (g), the additional unit of consumption is valued less according to the diminishing marginal utility of consumption (reflected by η), which acts in accordance with the society’s view to reduce inequality in consumption flows over time [13,14].
The utility discount rate ρ consists of two elements. The first one reflects the risk of death based on mortality rates for a given country. The second element is the myopia of decisions—the society’s impatience to consume sooner than later. However, it should be pointed out that for long-term decisions, some researchers, e.g., Ramsey [21], Eckstein [54], and Parfit [55], suggest to exclude it on ethical grounds, particularly in cases of investments affecting future generations as it makes these generations less important only due to the fact that they are born later.
The growth rate of per capita consumption g is usually based empirically on mean annual growth rates of consumption or GDP, as is done in the works by Evans and Sezer [34], Percoco [56], and Florio and Sirtori [41]; however, more demanding approaches are also used. For instance, Moore et al. [13] as well as Kula [57,58,59] use extrapolation based on the slope of a relationship between time and the natural logarithm of real per capita private consumption expenditure.
The elasticity of marginal utility of consumption, η, reflects the society’s aversion to inequality in consumption level over time or over individuals; however, this can be interpreted also as aversion to risk—the willingness to avoid sudden changes in consumption level. The higher η is, the higher the discount rate is, making current consumption more important than the gains in the future. The estimates of η are usually based on four approaches that include: eliciting stated preferences via surveys [29,60], indirect behaviour evidence based on consumption choices [32], life-cycle behaviour models considering saving choices of individuals or revealed social values based on the level of progressivity of personal tax income [22]. In this paper, we focus on the revealed social values approach, which produces stable estimates, both across time and between countries [33].
Revealed social values, or “the equal sacrifice”, approach emerges from the social planner’s aversion to inequality which represents the tastes and preferences of the society. Inequality aversion is derived from the progressivity of national personal income tax rates, based on the premise that the tax schedule is designed in such a way that the marginal utility of tax burden is equal for all individuals. This represents society’s aversion to inequality and can be transferred from the tax system to other areas as, e.g., intertemporal decisions [61]. The η in the tax method is estimated as [47]:
η = ln ( 1 M T R ) ln ( 1 A T R )
where MTR is the marginal income tax rate, and ATR represents the average tax rate.
The extension of the Ramsey rule via Gollier’s approach [26,48] is proposed for long-term projects, e.g., climate change investments reducing greenhouse gas emissions [2,36]. The modification assumes that the consumption level in SWF is uncertain and the consumption growth fluctuations are independently and normally distributed. Then, the discount rate takes the form:
SRTP = ρ + η μ g 0.5 η 2 σ g 2
where μ g and σ g 2 represent the consumption growth rate mean and variance, respectively. The last element of the equation is interpreted as a precautionary term, reflecting the fact that a social planner, when facing the uncertainty, is willing to save more now to benefit in the future [62].

2.4. Data Sources

The analysis presented in this study is based on two general alternative approaches that determine the discount rate applied in public investment projects appraisal. The descriptive approach that adopts the discount rate used to translate future costs and benefits into current ones, as a consumption rate of interest or social opportunity cost of capital, relies heavily on financial data describing particular components of return on savings and private sector cost of financing. A straightforward consequence of this fact is the necessity of using various financial datasets to estimate the Social Discount Rate.
We followed the convention advocated by Moore et al., Boardman et al., and Spackman, [13,20,52] while estimating SDR based on market data by starting our calculations from CRI represented by the post-tax real rate of return which savers are willing to accept. As a result, the most common choice of an observable proxy for this variable is the after-tax real rate of return on government bonds. Thus, we exploited, i.a., time series provided by the Polish Ministry of Finance covering all domestic issues of Treasury bonds [63]. This dataset includes information about all transactions since February 1994 (bonds sold to financial institutions) or since June 1992 (retail bonds). To obtain the monthly time series of average yield in the case of bonds purchased by institutional investors, we calculated a weighted average of yields considering sales transactions conducted in a particular month. We adopted proceeds from sales as the weights. We omitted all the records for which the yield was unavailable (mainly CPI-linked bonds and floating rate bonds). A similar procedure was applied in the case of retail bonds, with a few minor exceptions. First, as retail bonds are generally sold at par, instead of yield, we used the nominal coupon rate (5-year fixed rate bonds were the only exception—they were sold in tranches and below par; in this case, we exploited yield to maturity calculated using average selling price over tranches). Furthermore, all the floating rate bonds and CPI-linked bonds, for which the first-period coupon rate was available, become the basis for calculations.
Bonds used in the previous calculation differed among themselves by the time to maturity. One of the practices followed by researchers is to consider instruments of constant time to maturity [13]. Having adopted this approach, we also used time series of yields on 10-year Polish fixed rate Treasury bonds provided by the Federal Reserve Bank of St. Louis [64]. This dataset covers the period starting from January 2001. At this point, one issue must be raised. As it is noted, e.g., by Moore et al. [13], there are many proxies serving as the rate of return on a riskless asset reflecting the level of real, after-tax return on savings obtainable by postponing current consumption. A government bond yield is only one among various possible choices, not necessarily the best one if a significant part of the population prefers other means of saving. Therefore, we additionally decided to use the average rate of return earned on personal term-deposits (covering all maturities) according to the data provided by the National Bank of Poland [65]. The analysed time series starts from December 1996.
An additional factor which heavily influences the rate of return on savings is the level of capital gains tax. Before December 2001, all capital gains and equivalents (e.g., dividends, interest on fixed-income securities) were not taxed. From March 2002 until December 2003, the tax rate was equal to 20% of the income (during the interim period December 2001–February 2002, income on newly issued instruments and contracts was proportional accounting to the length of the exemption period) [66,67]. Since January 2004, all capital gains and equivalents have been taxed using a flat tax rate of 19% [68].
At the other extreme is the cost of private sector capital: the Social Opportunity Cost. Unfortunately, it is also problematic to find the best proxy reflecting the cost of private funding. Boardman et al. [20] advocate the application of the real, pre-tax rate of return on corporate bonds instead of any measure that considers the equity rate of return. We share their view that this solution might be treated as optimal due to various reasons. First, it allows us to avoid a rather cumbersome estimation of the effective marginal corporate tax rate. This is a result of equating marginal expected pre-tax return on investment with before-tax cost of capital implied by bond yield. Moreover, in the case of equity profitability, we have at our disposal only average rates of return while marginal ones (which might be significantly lower) are needed. The bond yields are also more stable than equity returns and include a significantly lower risk premium to their holders. The advantages mentioned were the main incentive to follow this approach. Unfortunately, the Polish corporate bond market is relatively thin and is mainly composed of floating rate bonds, which makes assessment of the bond yield impossible or vulnerable to various ad hoc assumptions. As a consequence, we decided to use the time series provided by the National Bank of Poland describing the average interest rate paid by companies on their credit liabilities (independently of the maturity) [65]. The data provided by the NBP cover the period starting from December 1996. This approach also seems more advantageous due to the fact that Polish enterprises commonly finance their activities using the credit channel rather than directly via capital markets (according to the data provided by the Warsaw Stock Exchange and NBP, the nominal value of market debt traded on WSE equals to approx. 5% of total credit to nonfinancial enterprises) [65,69]. What should be highlighted is the fact that the rates of return on Treasury bonds are also used in SOC estimations. The Treasury bond post-tax yield represents the rate for the savers; the pre-tax rate as a proxy for the rate at which the government borrows on the market may represent the cost of capital for policy investments [16]. Although they do not represent SOC in its pure definition, we added them to previously discussed estimates as an approach that links CRI and SOC as well as provides a lower bound for the rates of return on private investments. The calculation of both CRI and SOC, as they are based on market nominal data, requires the consideration of inflation expectations. Unfortunately, despite extensive investigation, we were unable to obtain inflation forecasts of demanded frequency. Therefore, we decided to use as a proxy ex-post inflation rates averaged over 12 consecutive months using geometric rates of return. The database obtained from the Statistics Poland website [70] covers a period starting from January 1982 with monthly frequency. Due to the adopted mechanism of calculating an approximation of expected inflation, the last period for which an appropriate value could have been obtained was October 2019.
The second approach that enables the estimation of Social Discount Rate refers to the Ramsey formula [21]. As this viewpoint rests on optimization of current and future consumption level, the data necessary to evaluate the Social Rate of Time Preference consist of fluctuations in real consumption expenditures. The necessary observations are provided by the Organisation for Economic Co-operation and Development and are available on the OECD Statistics website. In this study, we followed the concept discussed by Groom and Maddison [22] to employ real, quarterly, not seasonally adjusted consumption expenditure on semi-durable goods, non-durable goods, and services per capita. The OECD database provides data about households’ consumption expenditure classified as “other goods and services”, meaning total goods and services excluding durable ones (expressed in millions, in PLN of 2015). The additional question to answer was whether to analyse total or per capita consumption. On the one hand, we share the view expressed by Feldstein [53] that a social utility consumption function should mirror not only per capita consumption, but also the size of the population (i.e., social welfare should raise when a society enjoys a constant per capita consumption level while the population increases). On the other, this task might hardly be achievable and most of the studies presented in the literature employ per capita consumption. The additional argument in favour of this choice in the case of Poland is the fact that its population remained rather stable during the analysed period (coefficient of variation 0.57%). Unfortunately, due to periodic reassessment of population size after general censuses without backward adjustment, we were unable to exploit the data provided by Statistics Poland. As a consequence, we chose to employ data series prepared by the Population Division of the Department of Economic and Social Affairs of the United Nations Secretariat [71]. The data given as of 1 July for every year were linearly interpolated to obtain end-of-quarter values and then averaged to obtain the quarter mean value. These values were then used to obtain quarterly time series of per capita consumption and to estimate its average rate of change as well as the uncertainty connected with future growth. To obtain the rate of growth of per capita consumption, we followed Kula [57,58,59] by fitting the equation:
ln C t = a + g t
To avoid possible bias caused by the COVID-19 pandemic, among explanatory variables, we used a dummy variable for Q2 2020 (significant at p = 0.05). The variance of the growth rate was estimated as the variance of the error term.
The Ramsey equation also employs the elasticity of marginal utility of consumption, estimated in this study via “the equal sacrifice” method proposed by Stern [47]. The appropriate data are delivered by the OECD Tax Database [72] (also used by other European SDR studies, e.g., [41,42]), including the average and marginal tax rates and wedges for four levels of income expressed as a percentage of the average wage (67%, 100%, 133%, 167%). The applied all-in tax rate combines the central and sub-central government income tax as well as employee social security contribution. Despite controversies of whether the social security contribution should be treated as part of the tax wedge [22], we decided to include it as, in many studies, e.g., Florio and Sirtori’s work [41], it is thought to bring the same consequences to the employee as income tax [73,74]. For the highest level of income (167%) at marginal tax levels, we excluded two years from the analysis (2006 and 2008), replacing the original values with the average of two adjacent years due to the extremely high rates provided by the OECD database (40.3% and 37.0% while the average for remaining years was approx. 28%). Although we could not find the details explaining this deviation, we assume that it was caused by introducing a new defined contribution pension system instead of the defined benefit regime. The year 2009 was the first year when the intermedium pensions started to be calculated and paid [75], which could have stimulated individuals with high salaries to retire earlier, benefiting from old pension regulations and thus, increasing the marginal tax rate in a disproportionate manner. It was emphasised by Stern [47] that the most appropriate way to calculate the elasticity of marginal utility of consumption is to weight observations by the number of people to whom they refer. To meet this requirement, we used the data published biannually by Statistics Poland [70] that describe the structure of population while taking into account level of gross salary. As the OECD data are divided into four classes (67%, 100%, 133%, 167%) by level of income expressed as a percentage of average wage, we assigned workers to those classes as well. The first class (“67%”) represents workers of gross salary below 75% of the average, the second class (“100%”)—workers earning between 75% and 125% of the average, the third class (“133%”)—workers of gross salary between 125% and 150%, and the last class (“167%”)—the remaining workers. According to the assumption adopted by Stern [47], “the line was constrained to go through the origin (…), because for low incomes marginal and average tax rates are zero” and we restricted our analysis to only the zero-intercept case while running regressions. This methodology is followed by many authors [76]. The regressions run using weighted and unweighted observations yield almost the same results.
The last variable needed to estimate the Social Discount Rate using the Ramsey equation is the pure rate of discount. In this study, we assumed after Ramsey and Eckstein [21,54] that its component that reflects the pure individuals’ impatience or myopia is equal to zero due to the desire to treat all generations alike and to avoid the introduction of irrationality into the process of decision-making [59], which is particularly important in the case of climate change and energy policy [77]. We consider mortality as the only reason for positive pure discount rate. This component was estimated using death statistics for the entire Polish society since 1946 (restricting analysis to the most recent years does not significantly change the results). The appropriate time series of yearly frequency are provided by Polish Statistics [70].

3. Results

To estimate SDR, we chose:
  • The post-tax households’ deposits real yield and post-tax retail bonds’ real yield as the revealed net rates of return to savers representing the Consumption Rate of Interest.
  • The pre-tax Treasury bonds of all maturities real yield as the lower limit for the Social Opportunity Cost (as they represented, on average, 94.4% of central government domestic debt and 65.6% of central government total debt).
  • The pre-tax corporate credit liabilities real yield as the upper bound for the Social Opportunity Cost.
  • The estimates of the Social Rate of Time Preference obtained using the Ramsey and Ramsey–Gollier approach.
The obtained results on SDR vary between the approaches as well as the period analysed. We estimated the discount rates for three time-horizons: all-available-data horizon (starting from approx. mid-1990s, depending on the approach analysed), EU accession benchmark (July 2004), and—mainly for contrasting purposes—2019.
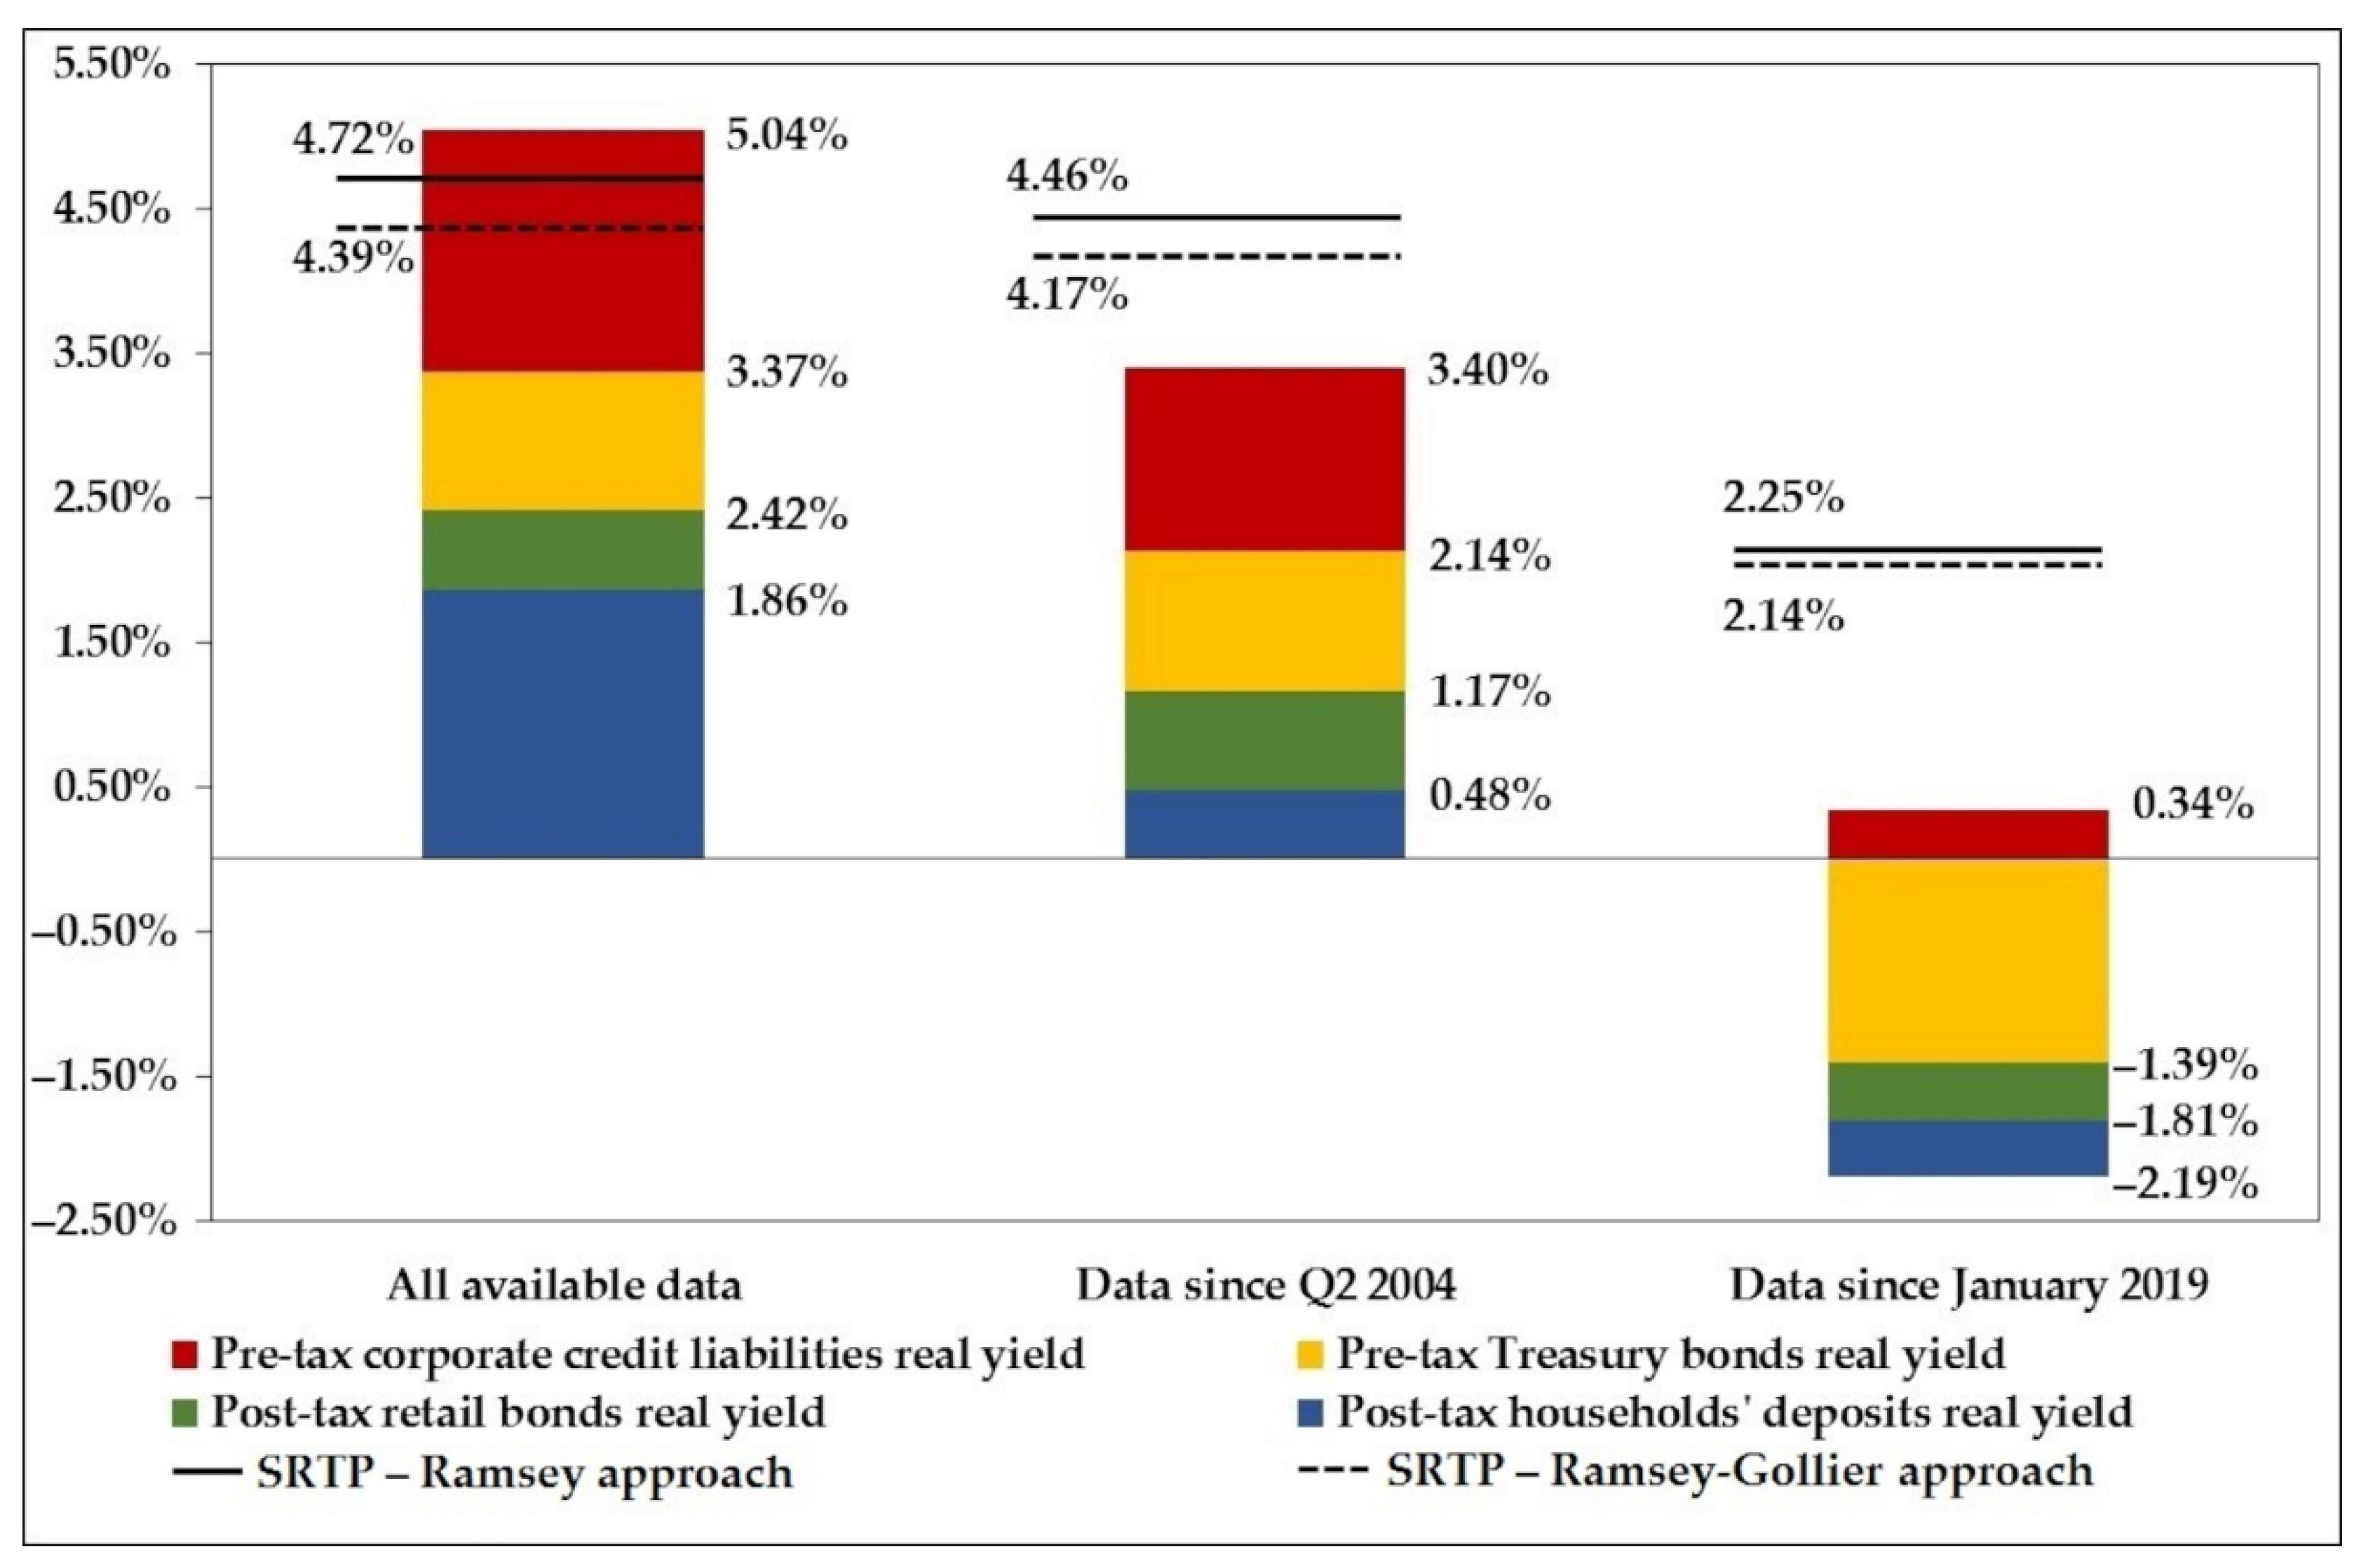
The CRI approach provides the lowest estimates, ranging from negative rates for a single year (2019), with the lowest value −2.19% for the post-tax real rate on personal deposits, then higher, but still relatively low (from 0.49% for deposits to 1.66% for 10-year Treasuries) estimates for the EU accession taken as a benchmark; to the highest numbers for the all data available horizon, where the lower bound (1.86%) is given by deposits and the higher one by Treasury bonds for all maturities (2.78%). SOC also gives negative values based on the pre-tax government bonds rates for 2019, except for the pre-tax return on credit liabilities (0.34%). The post-accession period is illustrated by SOC rates ranging from 1.91% for retail bonds to 3.40% for companies’ loans. Finally, the all available data horizon brings the rate of 5.04% on companies’ loans and values from 3.01% to 3.37% for the pre-tax rate on Treasuries. The values of SDR based on Ramsey face much lower discrepancies. The lowest estimates are also calculated for 2019 (2.25% and 2.14% for Ramsey and its Gollier modification, respectively), which is mainly due to lower consumption growth rate predictions. Two other periods are illustrated by the rates more than twice as high, giving the results of 4.46% and 4.17% (EU accession period) and 4.72% and 4.39% (all available data) for Ramsey and including Gollier’s precautionary effect, respectively. Our results are summarized in Table 1 and Table 2.
Figure 4 additionally illustrates the values of the main variables determining the level of the Social Discount Rate.
Market rates, as we discuss further and as was emphasised by Feldstein [78], despite their alleged objectivity, do not seem to be the most appropriate indicators of the discount rate for public projects due to their observed volatility in this study, particularly clear for 2019 results. The longest horizon based on available data represents the preferred time-range for further discussion, despite the fact that the interval for SDR on the basis of CRI and SOC is definitely substantial. In real terms, the SDR interval is 1.86–5.04%, while considering pre-tax average rate of return on government bonds, it might be contracted to 3.37–5.04%. The average post-tax rate of return on retail bonds, higher by 56 bp, does not take into account that retail bonds represent a very small share of households’ portfolio [79] and, in our opinion, is inadequate to measure the society’s time preference in Poland. The estimates obtained using the Ramsey equation seem much more stable: 4.72%, or having considered possible fluctuations in growth rates, the Ramsey–Gollier equation: 4.39%. The shift in SDR value estimated using the elasticity of marginal utility of consumption, if we consider only the period after joining the European Union by Poland, is not as large as the discrepancies in SDR evaluated as the opportunity cost. The Ramsey (Ramsey–Gollier) formula provides us with the value of 4.46% (4.17%), i.e., decline by 26 bp (22 bp). At the same time, the interval for the Social Opportunity Cost moves down to 2.14–3.40% (by 160 and 123 bp, respectively). For illustrative purposes only, we also presented estimates based on the data starting from January 2019. In this case, the Social Opportunity Cost lies in the interval from −1.39% to 0.34% (fall by 476 and 470 bp, respectively) while the Social Rate of Time Preference is 2.25% (Ramsey, fall by 247 bp) and 2.14% (Ramsey–Gollier, fall by 225 bp).

4. Discussion

The results obtained consist of three proposals of the values presented above, namely SOC, CRI, and Ramsey-based approaches. This part provides comparison with other studies followed by the limitations of each approach.
In the case of the SRTP approach based on the post-tax return to savers, our results for the all available data time range vary from 1.86% to 2.78%. This stays close in comparison with other estimates ranging around 2–3% [16,50]. However, it should be highlighted that personal rates are difficult to compare with other studies due to country-specific legal frameworks [13]. This difficulty also lies in country-specific determinants of capital supply, such as the variety of saving offered or the propensity to save.
It should be emphasised that the time preference rate derived from market data only partially reflects the real society’s attitude towards the exchange of current for future consumption. The calculated values must be treated as a lower limit for the social time preference rate due to various reasons. One of them is the fact that the perception of all individuals as net savers is inappropriate as some are net borrowers facing borrowing rates significantly higher than lending ones. Furthermore, restricted funds availability due to information asymmetry between lenders and borrowers results in a rising demand for government debt (driving the rates down) and a falling demand for private debt (driving the rates up). As overborrowing imposes certain restrictions on borrowers’ behaviour, they tend to not increase their debt despite the fact that interest rates might be below time preference rate [52]. Feldstein [78] notices the problems raised as “an individual’s marginal borrowing and lending rates may not be equal”. We can find that there exists many different borrowing and lending rates which differ due to the transaction’s amount, duration, and risk. This observation undermines the assumption of a single marginal equilibrium lending (or borrowing) rate existing.
Finally, some reservations should be expressed in light of energy policies. The first one emerges from the myopia of financial market offers: the longest available maturity of saving instruments reaches up to 30 years [80]. Such a discrepancy may infringe the cohesion between consumer choices and long-term energy policy investments. The longest instruments used in this study are 10-year government bonds, lagging far behind the timeframe of climate change-related issues. Additionally, what Burgess and Zerbe [23] point out is that a possible discrepancy exists between the personal time preference rates and the views about the rates for government policy decisions. The latter rate is marked in the literature as consumer–citizen divergence [81,82,83].
The main advantage of using the Social Opportunity Cost of capital as a discount rate is the fact that it represents the simple and obvious rule, that “no project should be accepted if its return is less than the return available on alternative projects” [84]. This benchmark estimated in the study ranges from 3.01% to 5.04% for the maximum available period, which is slightly lower than the reported estimates for developed countries, reaching 6–8% [16]; however, this discrepancy can be assigned to the methodology adopted due to the fact that our study employs a return on bonds and loan rates, while Burgess and Zerbe [23] use the National Accounts data to deliver the profitability within the enterprise sector. The main difference seems to lie in the risk premia, lower for credit facilities or equal to zero for Treasury bonds. In the presented method of obtaining the Social Opportunity Cost, we followed the approach excluding the after-tax risk premium for private investors from the opportunity cost while adding a negligible premium for income covariance (Spackman estimated it for the UK at 0.10% [52]). The argument in favour of using the riskless rate of return as the opportunity cost has been stressed by Samuelson [85], who noticed that the government acts as an insurer by pooling multiple various projects and virtually eliminates the idiosyncratic risk.
The problem of including risk premia in the discount rate for the energy generation sector has been raised by Lind [14]. His estimates were based on the methodology implied by the rate of time preference concept (i.e., the after-tax rate of return to savers) and in the case of the whole U.S. economy, oscillated about 4.6% (including market risk premium). The energy industry was an exception. As Lind argued [14], the rates of return in this sector seemed to be non-perfectly but rather weakly correlated with general market returns which lowered the rate to 3% (still above the long-term after-tax rate of return on government bonds equal to 2%). An additional argument in favour of this point of view might be formulated based on legal acts governing Poland’s energy generation sector. According to the regulations, the rate of return in this industry is set by the Energy Regulatory Office using the concept of pre-tax Weighted Average Cost of Capital calculated in compliance with the Miller–Modigliani model [86,87]. It should be noticed that the fall in the pre-tax return to equity calculated according to the rules by 3.79 p.p. since 2011 is caused almost entirely by the fall in the riskless rate of return by 3.80 p.p. (the changes in the level of risk premium, target financing structure, and one-time change in methodology were offsetting each other; adjusted R2, while regressing the pre-tax equity cost against the riskless rate of return and a dummy variable representing a one-time methodological change, equals to 0.964). As a result, the rate of return on invested equity heavily resembles the riskless investment. The implications raised here are the following. First, risk premia can be excluded even if we consider energy investments as purely private. Second, both private and public investments can follow the same discounting regime.
The drawback of the SOC approach is the assumption that public investments crowd out private ones dollar-for-dollar, which is not necessarily true as they are partially financed by funds diverted from consumption or by borrowing from overseas. This objection might be somehow relaxed as Harberger [88] proposed a model which refers to funds diverted from various sources: consumption, private investments, and foreign investors. In this case, the final Social Opportunity Cost is a weighted average of costs of funds of different origin. In this paper, we do not use this method as we rather construct an interval of possible values of the opportunity cost, which serves only as a guideline while our target value is determined using the time preference approach.
Another disputable issue is the alleged objectivity of market-based rates. As observed by Creedy and Passi [89], this approach also requires making certain value judgements, but they are less explicit than in the case of the time preference method and as a result, it is supposed to be more objective. As Creedy and Passi notice, the very decision to employ this approach is based on a hidden assumption that the time preference revealed by the government should be the same as the one revealed by the businesses while making their investment decisions, which differ in terms of aim (maximising the company’s value instead of society’s welfare) and time range (the majority of commercial investments are limited by a 10-year perspective, also reflected in loan repayment schedules; perspectives longer than 10 years are perceived as long-term) [38].
Finally, the issue that applies to both market-based approaches: volatility of market rates. The problem in our study was shown by applying three time perspectives: all data available (collection starts from approx. mid-1990s), mid-2004 (when Poland joined the European Union), and 2019. The values differ significantly between the timeframes, particularly for 2019 (last pre-pandemic year), where almost all market-estimated rates were negative. Market rates are much more volatile than estimates obtained employing the utility function and in the short term rather reflect current monetary policy decisions than long-term society’s preference regarding exchanging future well-being for the current one. Those arguments put into question the effort aimed at estimating the Social Discount Rate as a descriptive variable, based on market rates.
The estimates based on the Ramsey approach give much more stable results both in terms of the time period analysed and international comparisons. Mortality rates (0.96% in this study) are usually estimated at around 1–2% depending on the country and the time period used, but the majority of studies apply 1% as “the most appropriate” value [17,90]. Growth rates vary between countries; however, they stay within the range 3% to nearly 5% in previous studies for Poland [34,41,42]. The η estimates usually stay within the range of 1–2 [17,22] with the average value for Europe suggested to be at 1.5 [41]. Values of η for Poland fall within the range of 1.09 to 1.58 [32,34,41,42]. Our results stay close to the results obtained in 2013 by Florio and Sirtori [41] who used the International Monetary Fund growth forecasts (3.16%), mortality rates (0.97%) as of 2011, and elasticity of marginal utility of consumption equal to 1.09 in 2011. A value similar to ours (4.94%), based on η estimated using the tax method, was obtained by Seçilmiş and Akbulut [42] who analysed transition countries (Czech Republic, Estonia, Hungary, Latvia, Poland, Slovakia); however, their result, received as a panel estimate, is significantly lower (2.75%) mainly due to differences in the method used to estimate the elasticity of marginal utility of consumption (0.48) based on a food demand model. Furthermore, the 2012 results of Addicott et al. [91] based on demographic data are definitely higher than ours (6.69%) as well as the assumed 2002 values obtainable using elasticity of marginal utility of consumption as estimated by Evans [32] (1.38 for the low-income class and 1.58 for the high-income class).
All these results do not take into consideration the issue of uncertainty embedded into future growth rates. Therefore, we recommend, as the most appropriate one, the estimate received by employing the Gollier correction that lowers Ramsey’s SDR by 33 bp for the longest available period. The precautionary effect found here is similar to values in other studies, balancing around 0.1–0.3% for the OECD countries [2,36]; however, they are based on historical growth rate data, where volatility (standard deviation) is rather small, e.g., 3.5–5% for the U.S. and up to 5.1% for Italy [33,35], as this effect is much larger for economies in transition, such as Poland or developing countries [2,92].
It must be noticed that the estimated Social Discount Rate will inevitably differ among various countries. It stems from heterogeneous societies’ views on utility of future and current consumption as well as its growth rate (Ramsey) or the diversity of different socioeconomic factors influencing investments’ efficiency and savers’ propensity to invest (SOC and CRI). This leads to huge differences in hurdle rates recommended by energy sector regulators, which sometimes may be as high as 10% in real terms [93], especially if we take into consideration the fact that they may cover risk premia. Recent studies confirm significant dispersion of discount rates applied to energy investments in various countries [94,95], supporting our viewpoint that we cannot assume a uniform international hurdle rate in energy policies.
The Ramsey approach seems to be well fitted to energy-related investments due to their longevity. The 5th IPCC report [2] points out here the flaw of market rates which aggregate the preferences of people living at present and omit those who will be born in the future. Moreover, the very task of investing intergenerationally is mostly a normative problem [31,55] and the choice of η is an ethical issue as raised by Helgeson et al. [60].
However, the prescriptive character has a major drawback that lies in the form of subjectivity, starting from disputable ethical arguments, supporting, e.g., the omission of impatience in calculating the utility discount rate ρ or estimating η based on various domains (inequality represented in the approach undertaken in this study, inter-temporal substitution, substitution between goods, and risk aversion) implying that the aversion to inequality in consumption level is “the same regardless of whether it occurs between individuals today, across time or across risky scenarios” [22]. Finally, why SOC is favoured over the Ramsey approach is the fact that when seeking the most efficient use of funds, dragged away from private investments, the Ramsey formula does not always secure the Pareto improvement in the consumption level for the society [23]. The choice between SOC and Ramsey should reflect the source of policy funding, distinguishing between consumption or public spending and private investments crowded out at present. It should also take into consideration mixed cases, i.e., when the project displaces private investments today to provide consumption benefits in the future [16,96].

5. Conclusions

The discrepancy between prescriptive and descriptive approaches to SDR has reverberated for a long time in academic discourse. The paper aims at estimating SDR for Poland which could be used for long-term energy sector transition policies. It provides a wide range of values, depending on the estimation method as well as the period analysed. Our recommendation is based on the Ramsey–Gollier SRTP approach for longest available dataset, giving the value of 4.39%.
Considering the choice of the most appropriate proxy for the Social Discount Rate, we have “to avoid the trap of modelling what is easily quantifiable rather than what really matters” [46]. The value obtained in the study, although only slightly lower than the EU recommendations applied at present (5%), may have a substantial impact on the weight of delayed effects, as it increases the present value of EUR 1 spent in 30 years time from 0.23 to 0.28 of its future worth and from 0.09 to 0.12 for a 50-year delay. Considering the long-term perspective and substantial outlays anticipated in the area of energy investments (approx. EUR 50 billion until 2030), a careful estimation of the discount rate is needed more than ever.
Although the Ramsey–SRTP formula, we argue for, is far from being flawless, it offers several advantages over competing approaches. The most vital arguments in favour of choosing this approach are given below.
First, it offers a relatively stable-in-time estimate, not affected by the volatility of financial market rates, which is particularly important for the energy sector with long-time planning horizons and a weak correlation with market returns. Second, as Nesticò and Maselli [33] point out, “the SRTP provides a lower SDR value than that obtained with the SOC method. The first is therefore more advantageous for projects with long-term effects.” The implications well suit energy policies, as their impacts reach decades rather than years. Third, while the CRI-SRTP approach provides even lower estimates, its applicability is dubious, as the saving offer has relatively short maturity dates. Since the Ramsey formula rests on growth predictions, it is not limited by a repayment perspective. Fourth, as observed by Feldstein [53] “the political process may be invoked because the market cannot express the ‘collective’ demand for investment to benefit the future.” The additional argument, based on the longevity of energy policy impacts, is provided by their intergenerational character, where aggregated market preferences obviously omit not-born-yet individuals. The point made here applies to both SOC and CRI, supporting the leading role of the prescriptive method, designed to capture public (instead of private) choices.

Author Contributions

Conceptualization, M.F.-Z.; methodology, R.B., M.F.-Z.; validation, R.B.; formal analysis, R.B.; investigation, R.B., M.F.-Z., K.P.; resources, R.B., M.F.-Z.; data curation, R.B.; writing—original draft preparation, R.B., M.F.-Z., K.P.; writing—review and editing, R.B., M.F.-Z.; visualization, R.B., M.F.-Z.; supervision, M.F.-Z.; project administration, M.F.-Z.; funding acquisition, R.B. All authors have read and agreed to the published version of the manuscript.

Funding

This research received no external funding.

Data Availability Statement

The authors declare that open access databases used in this study are: Polish Ministry of Finance database (2020), Federal Reserve Bank of St. Louis database (2020), National Bank of Poland database (2020), Statistics Poland database (2020), Organisation for Economic Co-operation and Development database (2020), Population Division of the Department of Economic and Social Affairs of the United Nations Secretariat database (2020), European Statistical Office database (2020).

Conflicts of Interest

The authors declare no conflict of interest.

References

  1. Communication from the Commission to the European Parliament, the European Council, the Council, the European Economic and Social Committee and the Committee of the Regions. In The European Green Deal; European Commission: Brussels, Belgium, 2019.
  2. IPCC Reports. Available online: https://www.ipcc.ch/reports/ (accessed on 7 December 2020).
  3. Polityka Energetyczna Polski Do Roku 2040; Ministry of Climate and Environment: Warsaw, Poland, 2018.
  4. Krajowy Plan Na Rzecz Energii i Klimatu Na Lata 2021–2030; Ministry of State Assets: Warsaw, Poland, 2019.
  5. Global Carbon Atlas. Available online: http://www.globalcarbonatlas.org/en/content/welcome-carbon-atlas (accessed on 8 December 2020).
  6. Renewable Energy: Twelve EU States Are Already Exceeding Their Targets for 2020. Available online: https://www.en-former.com/en/eurostat-renewable-energy-figures-goals/ (accessed on 8 December 2020).
  7. European Statistical Office. Available online: https://ec.europa.eu/eurostat (accessed on 20 January 2021).
  8. Projekt Nowelizacji Ustawy o Efektywności Energetycznej z Dnia 20 Maja 2016; Ministry of Climate and Environment: Warsaw, Poland, 2020.
  9. Widuto, A.; Pernilla, J. Just Transition Fund; European Parliament: Brussels, Belgium, 2020. [Google Scholar]
  10. Gawlikowska-Fyk, A.; Borkowski, M. Jak Polska Może Osiągnąć Zwiększone Cele Redukcji Emisji Gazów Cieplarnianych Do 2030 Roku; Forum Energii: Warsaw, Poland, 2020. [Google Scholar]
  11. Lachowicz, M.; Gacki, M.; Moskwik, K. Paliwa i Motory Wzrostu Gospodarczego. Wpływ Cen Surowców i Produkcji Energii Na Polskę; Jagiellonian Institute: Warsaw, Poland, 2020. [Google Scholar]
  12. Wkład Polskiego Sektora Energetycznego w Realizację Globalnej Polityki Klimatycznej; Polish Electricity Association: Warsaw, Poland, 2018.
  13. Moore, M.A.; Boardman, A.E.; Vining, A.R.; Weimer, D.L.; Greenberg, D.H. “Just Give Me a Number!” Practical Values for the Social Discount Rate. J. Policy Anal. Manag. 2004, 23, 789–812. [Google Scholar] [CrossRef]
  14. Lind, R.C.; Arrow, K.J.; Corey, G.R.; Dasgupta, P.; Sen, A.K.; Stauffer, T.; Stiglitz, J.E.; Stockfisch, J.A. Discounting for Time and Risk in Energy Policy; Routledge: New York, NY, USA, 2013; ISBN 1135985189. [Google Scholar]
  15. Arrow, K.J. Discounting and Public Investment Criteria. In Water Research; Johns Hopkins Press: Baltimore, MA, USA, 1966; pp. 13–32. [Google Scholar]
  16. Spackman, M. Social Discounting and the Cost of Public Funds: A Practitioner’s Perspective. J. Benefit-Cost Anal. 2020, 11, 244–271. [Google Scholar] [CrossRef]
  17. Zhuang, J.; Liang, Z.; Lin, T.; Guzman, F.D. Theory and Practice in the Choice of Social Discount Rate for Cost-Benefit Analysis: A Survey; Asian Development Bank (ADB): Manila, Philippines, 2007. [Google Scholar]
  18. Florio, M. Applied Welfare Economics: Cost-Benefit Analysis of Projects and Policies; Routledge: New York, NY, USA, 2014; ISBN 1317814258. [Google Scholar]
  19. Dasgupta, A.K.; Pearce, D.W. Cost-Benefit Analysis: Theory and Practice; Macmillan International Higher Education: New York, NY, USA, 1972; ISBN 1349154709. [Google Scholar]
  20. Boardman, A.; Greenberg, D.; Vining, A.; Weimer, D.L. Cost-Benefit Analysis; Cambridge University Press: Cambridge, UK, 2018; ISBN 9781108401296. [Google Scholar]
  21. Ramsey, F.P. A Mathematical Theory of Saving. Econ. J. 1928, 38, 543–559. [Google Scholar] [CrossRef]
  22. Groom, B.; Maddison, D. New Estimates of the Elasticity of Marginal Utility for the UK. Environ. Res. Econ. 2019, 72, 1155–1182. [Google Scholar] [CrossRef] [Green Version]
  23. Burgess, D.F.; Zerbe, R.O. Appropriate Discounting for Benefit-Cost Analysis. J. Benefit-Cost Anal. 2011, 2, 1–20. [Google Scholar] [CrossRef]
  24. Poterba, J. The Rate of Return to Corporate Capital and Factor Shares: New Estimates Using Revised National Income Accounts and Capital Stock Data; National Bureau of Economic Research, Inc.: Cambridge, MA, USA, 1999. [Google Scholar]
  25. Kuo, C.-Y.; Jenkins, G.P.; Mphahlele, M.B. The Economic Opportunity Cost of Capital in South Africa. S. Afr. J. Econ. 2003, 71, 523–543. [Google Scholar] [CrossRef]
  26. Gollier, C. Time Horizon and the Discount Rate. J. Econ. Theory 2002, 107, 463–473. [Google Scholar] [CrossRef] [Green Version]
  27. Weitzman, M.L. Why the Far-Distant Future Should Be Discounted at Its Lowest Possible Rate. J. Environ. Econ. Manag. 1998, 36, 201–208. [Google Scholar] [CrossRef] [Green Version]
  28. Almansa, C.; Martínez-Paz, J.M. What Weight Should Be Assigned to Future Environmental Impacts? A Probabilistic Cost Benefit Analysis Using Recent Advances on Discounting. Sci. Total Environ. 2011, 409, 1305–1314. [Google Scholar] [CrossRef]
  29. Drupp, M.A.; Freeman, M.C.; Groom, B.; Nesje, F. Discounting Disentangled. Am. Econ. J. Econ. Policy 2018, 10, 109–134. [Google Scholar] [CrossRef] [Green Version]
  30. Cropper, M.L.; Aydede, S.K.; Portney, P.R. Preferences for Life Saving Programs: How the Public Discounts Time and Age. J. Risk Uncertain. 1994, 8, 243–265. [Google Scholar] [CrossRef]
  31. Foltyn-Zarychta, M. Ocena Inwestycji Międzypokoleniowych—Kryteria Etyczne w Ekonomicznej Ocenie Efektywności Projektów Inwestycyjnych; C.H. Beck: Warsaw, Poland, 2018. [Google Scholar]
  32. Evans, D.J. The Elasticity of Marginal Utility of Consumption: Estimates for 20 OECD Countries. Fisc. Stud. 2005, 26, 197–224. [Google Scholar] [CrossRef]
  33. Nesticò, A.; Maselli, G. A Protocol for the Estimate of the Social Rate of Time Preference: The Case Studies of Italy and the USA. J. Econ. Stud. 2020, 47, 527–545. [Google Scholar] [CrossRef]
  34. Evans, D.J.; Sezer, H. Social Discount Rates for Member Countries of the European Union. J. Econ. Stud. 2005, 32, 47–59. [Google Scholar] [CrossRef]
  35. Cropper, M.L.; Freeman, M.C.; Groom, B.; Pizer, W.A. Declining Discount Rates. Am. Econ. Rev. 2014, 104, 538–543. [Google Scholar] [CrossRef] [Green Version]
  36. Arrow, K.J.; Cropper, M.L.; Gollier, C.; Groom, B.; Heal, G.M.; Newell, R.G.; Nordhaus, W.D.; Pindyck, R.S.; Pizer, W.A.; Portney, P.R.; et al. Should Governments Use a Declining Discount Rate in Project Analysis? Rev. Environ. Econ. Policy 2014, 8, 145–163. [Google Scholar] [CrossRef] [Green Version]
  37. Gollier, C.; Koundouri, P.; Pantelidis, T. Declining Discount Rates: Economic Justifications and Implications for Long-Run Policy. Econ. Policy 2008, 23, 758–795. [Google Scholar] [CrossRef]
  38. European Commission. Guide to Cost-Benefit Analysis of Investment Projects. Economic Appraisal Tool for Cohesion Policy 2014-2020; European Commission: Brussels, Belgium, 2015. [Google Scholar]
  39. The Green Book Central Government Guidance on Appraisal and Evaluation 2020; HM Treasury: London, UK, 2020.
  40. Guidelines for Preparing Economic Analyses; U.S. Environmental Protection Agency: Washington, DC, USA, 2010.
  41. Florio, M.; Sirtori, E. The Social Cost of Capital: Recent Estimates for the EU Countries; CSIL Centre for Industrial Studies: Milano, Italy, 2013. [Google Scholar]
  42. Seçilmiş, E.; Akbulut, H. Social Discount Rates for Six Transition Countries. Ekon. Cãsopis 2019, 67, 629–646. [Google Scholar]
  43. Saługa, P.W. Discount Rate Selection for Long-Term Sequential Mineral Projects. Gospod. Surowcami Miner. 2017, 33, 49–70. [Google Scholar] [CrossRef] [Green Version]
  44. Peñalver, D.; Poudineh, R. Social Discount Rate and the Energy Transition Policy. Energy Insights 2020, 75, 1–13. [Google Scholar]
  45. Steinbach, J.; Staniaszek, D. Discount Rates in Energy System Analysis; Buildings Performance Institute Europe: Brussels, Belgium, 2015. [Google Scholar]
  46. Hermelink, A.H.; de Jager, D. Evaluating Our Future. The Crucial Role of Discount Rates in European Commission Energy System Modelling; The European Council for an Energy Efficient Economy & Ecofys: Stockholm, Sweden, 2015. [Google Scholar]
  47. Stern, N. Welfare weights and the elasticity of the marginal valuation of income. In Studies in Modern Economic Analysis: The proceedings of the Association of University Teachers of Economics, Edinburgh, 1976; Basil Blackwell: Oxford, UK, 1977; ISBN 9780631179702. [Google Scholar]
  48. Gollier, C. Pricing the Planet’s Future: The Economics of Discounting in an Uncertain World; Princeton University Press: Princeton, NJ, USA, 2012; ISBN 9781400845408. [Google Scholar]
  49. Burgess, D. The Appropriate Measure of the Social Discount Rate and Its Role in the Analysis of Policies with Long-Run Consequences; Mercatus Symposium; Mercatus Center at George Mason University: Arlington, TX, USA, 2018. [Google Scholar]
  50. Harberger, A.C.; Jenkins, G.P. Musings on the Social Discount Rate. J. Benefit-Cost Anal. 2015, 6, 6–32. [Google Scholar] [CrossRef]
  51. Baumol, W.J. On the Social Rate of Discount. Am. Econ. Rev. 1968, 58, 788–802. [Google Scholar]
  52. Spackman, M. Discount Rates and Rates of Return in the Public Sector: Economic Issues; Government Economic Service Working Paper; HM Treasury: London, UK, 1991; Volume 113.
  53. Feldstein, M.S. The Social Time Preference Discount Rate in Cost Benefit Analysis. Econ. J. 1964, 74, 360–379. [Google Scholar] [CrossRef]
  54. Eckstein, O. A Survey of the Theory of Public Expenditure Criteria. In Public Finances: Needs, Sources, and Utilization; National Bureau of Economic Research, Inc.: Cambridge, MA, USA, 1961; pp. 439–504. ISBN 0870143034. [Google Scholar]
  55. Parfit, D. Reasons and Persons; Oxford University Press: Oxford, UK; New York, NY, USA, 1986; ISBN 9780198249085. [Google Scholar]
  56. Percoco, M. A Social Discount Rate for Italy. Appl. Econ. Lett. 2008, 15, 73–77. [Google Scholar] [CrossRef]
  57. Kula, E. Estimation of a Social Rate of Interest for India. J. Agric. Econ. 2004, 55, 91–99. [Google Scholar] [CrossRef]
  58. Kula, E. Derivation of Social Time Preference Rates for the United States and Canada. Q. J. Econ. 1984, 99, 873–882. [Google Scholar] [CrossRef]
  59. Kula, E. Social Interest Rate for Public Sector Appraisal in the United Kingdom, the United States and Canada. Proj. Apprais. 1987, 2, 169–174. [Google Scholar] [CrossRef] [Green Version]
  60. Helgeson, J.; Dietz, S.; Atkinson, G.; Hepburn, C.; Sælen, H. Siblings, Not Triplets: Social Preferences for Risk, Inequality and Time in Discounting Climate Change. Economics 2009, 3, 1–28. [Google Scholar] [CrossRef] [Green Version]
  61. Cowell, F.A.; Gardiner, K. Welfare Weights; Office of Fair Trading: London, UK, 2000.
  62. Pearce, D.; Atkinson, G.; Mourato, S. Cost-Benefit Analysis and the Environment: Recent Developments; OECD: Paris, France, 2006; ISBN 9264010041. [Google Scholar]
  63. Public Debt—Ministry of Finance—Gov.Pl Website. Available online: https://www.gov.pl/web/finance/public-debt (accessed on 7 December 2020).
  64. Federal Reserve Economic Data FRED St. Louis Fed. Available online: https://fred.stlouisfed.org/ (accessed on 7 December 2020).
  65. Narodowy Bank Polski—Internet Information Service. Available online: https://www.nbp.pl/homen.aspx?f=/en/statystyka/monetary-and-financial-statistics.html (accessed on 7 December 2020).
  66. Rzepińska, A. Opodatkowanie Dochodów z Kapitałów Pieniężnych w Polsce Jako Jedna z Istotnych Determinant Decyzji Gospodarczych Przedsiębiorcy. Kryt. Prawa 2013, 5, 243–264. [Google Scholar] [CrossRef]
  67. Ustawa z Dnia 21 Listopada 2001 r. o Zmianie Ustawy o Podatku Dochodowym Od Osób Fizycznych Oraz Ustawy o Zryczałtowanym Podatku Dochodowym Od Niektórych Przychodów Osiąganych Przez Osoby Fizyczne (Dz.U. 2001 Nr 134 Poz. 1509). Available online: http://isap.sejm.gov.pl/isap.nsf/download.xsp/WDU20011341509/O/D20011509.pdf (accessed on 20 October 2020).
  68. Ustawa z Dnia 12 Listopada 2003 r. o Zmianie Ustawy o Podatku Dochodowym Od Osób Fizycznych Oraz Niektórych Innych Ustaw (Dz.U. 2003 Nr 202 Poz. 1956). Available online: https://isap.sejm.gov.pl/isap.nsf/download.xsp/WDU20032021956/O/D20031956.pdf (accessed on 20 October 2020).
  69. Główny Rynek GPW—Rynek Główny. Available online: https://www.gpw.pl/ (accessed on 7 December 2020).
  70. Główny Urząd Statystyczny. Available online: https://stat.gov.pl/ (accessed on 7 December 2020).
  71. World Population Prospects—Population Division—United Nations. Available online: https://population.un.org/wpp/Download/Standard/Population/ (accessed on 7 December 2020).
  72. OECD Tax Statistics. Available online: https://www.oecd-ilibrary.org/taxation/data/oecd-tax-statistics_tax-data-en (accessed on 7 December 2020).
  73. Reed, H.; Dixon, M. National Insurance: Does It Have a Future? Public Policy Res. 2005, 12, 102–110. [Google Scholar] [CrossRef]
  74. Sawulski, J. Kogo Obciążają Podatki w Polsce? IBS Policy Pap. 2019, 1, 1–11. [Google Scholar]
  75. Kłos, B. Emerytury z Funduszu Ubezpieczeń Społecznych Przyznane w Latach 2009–2013. Anal. BAS 2015, 3, 1–12. [Google Scholar]
  76. Akbulut, H.; Seçilmiş, E. Estimation of a Social Discount Rate for Turkey. Socio-Econ. Plan. Sci. 2019, 67, 78–85. [Google Scholar] [CrossRef]
  77. Kelleher, J.P. Energy Policy and the Social Discount Rate. Ethics Policy Environ. 2012, 15, 45–50. [Google Scholar] [CrossRef]
  78. Feldstein, M. Opportunity Cost Calculations in Cost-Benefit Analysis. Public Financ. 1964, 19, 117–139. [Google Scholar]
  79. Rogowski, W.; Lipski, M. Oszczędności i Kredyty Polskich Gospodarstw Domowych. Nauk. Ekon. 2019, 30, 157–168. [Google Scholar] [CrossRef]
  80. Newell, R.; Pizer, W. Discounting the Benefits of Future Climate Change Mitigation; EW Center on Global Climate Change: Washington, DC, USA, 2001. [Google Scholar]
  81. Orr, S.W. Values, Preferences, and the Citizen-Consumer Distinction in Cost-Benefit Analysis. Politics Philos. Econ. 2007, 6, 107–130. [Google Scholar] [CrossRef] [Green Version]
  82. Foltyn-Zarychta, M.; Zerbe, R. The Economics of CSR: The role of citizen-consumer mix in the social responsible investing. In La Responsabilità Sociale D’impresa tra Diritto Societario e Diritto Internazionale; Università degli Studi di Bari Aldo Moro: Bari, Italy, 2019; Volume 175, pp. 81–113. ISBN 9788849541052. [Google Scholar]
  83. Nyborg, K. Homo Economicus and Homo Politicus: Interpretation and Aggregation of Environmental Values. J. Econ. Behav. Organ. 2000, 42, 305–322. [Google Scholar] [CrossRef]
  84. Burgess, D.F.; Zerbe, R.O. The Most Appropriate Discount Rate. J. Benefit-Cost Anal. 2013, 4, 391–400. [Google Scholar] [CrossRef]
  85. Jorgenson, D.W.; Vickrey, W.; Koopmans, T.C.; Samuelson, P.A. Discussion. Am. Econ. Rev. 1964, 54, 86–96. [Google Scholar]
  86. Metoda Określania Wskaźnika Zwrotu Kosztu Zaangażowanego Kapitału Dla Operatorów Systemów Elektroenergetycznych Na Lata 2016-2020; Energy Regulatory Office: Warsaw, Poland, 2015.
  87. Koszt Kapitału Dla Operatorów Systemów Elektroenergetycznych Na Lata 2011–2015; Energy Regulatory Office: Warsaw, Poland, 2010.
  88. Harberger, A.C. Project Evaluation. Collected Papers; Macmillan: London, UK, 1972; ISBN 9781349016532. [Google Scholar]
  89. Creedy, J.; Passi, H. Public Sector Discount Rates: A Comparison of Alternative Approaches. Aust. Econ. Rev. 2018, 51, 139–157. [Google Scholar] [CrossRef] [Green Version]
  90. A Formula for Success: Reviewing the Social Discount Rate. Available online: https://www.oxera.com/agenda/a-formula-for-success-reviewing-the-social-discount-rate/ (accessed on 7 December 2020).
  91. Addicott, E.T.; Fenichel, E.P.; Kotchen, M.J. Even the Representative Agent Must Die: Using Demographics to Inform Long-Term Social Discount Rates. J. Assoc. Environ. Resour. Econ. 2019, 7, 379–415. [Google Scholar] [CrossRef] [Green Version]
  92. Gollier, C.; Mahul, O. Term Structure of Discount Rates: An International Perspective. Available online: https://www.ethz.ch/content/dam/ethz/special-interest/mtec/cer-eth/cer-eth-dam/documents/research/seminar/2017/Gollier.pdf (accessed on 7 December 2020).
  93. He, X.; Wang, F.; Wallington, T.J.; Shen, W.; Melaina, M.W.; Kim, H.C.; Kleine, R.D.; Lin, T.; Zhang, S.; Keoleian, G.A.; et al. Well-to-Wheels Emissions, Costs, and Feedstock Potentials for Light-Duty Hydrogen Fuel Cell Vehicles in China in 2017 and 2030. Renew. Sustain. Energy Rev. 2021, 137, 110477. [Google Scholar] [CrossRef]
  94. Steffen, B. Estimating the Cost of Capital for Renewable Energy Projects. Energy Econ. 2020, 88, 104783. [Google Scholar] [CrossRef]
  95. Renewable Energy Discount Rate Survey Results 2018; Grant Thornton: London, UK, 2019.
  96. Freeman, M.; Groom, B.; Spackman, M. Social Discount Rates for Cost-Benefit Analysis: A Report for HM Treasury; HM Treasury: London, UK, 2018.
Figure 1. EU countries with the highest level of CO2 emissions (in Mt) [5].
Energies 14 00741 g001
Figure 2. Primary energy production by source in Poland and the EU in 2019 [7].
Energies 14 00741 g002
Figure 3. Main approaches to estimate the Social Discount Rate.
Energies 14 00741 g003
Figure 4. Estimates of Social Opportunity Cost and Social Rate of Time Preference.
Energies 14 00741 g004
Table 1. Estimates of Social Discount Rate for Poland based on market rates.
All Available DataData Since
Q2 2004
Data Since
January 2019
Post-tax average rate of return
on personal term-deposits
1.86%0.48%−2.19%
mean +/− st. dev.[−1.56%; 5.27%][−1.21%; 2.16%][−2.81%; −1.58%]
Post-tax average rate of return
on government bonds
Treasury bonds2.78%1.35%−1.78%
mean +/− st. dev.[−0.62%; 6.18%][−0.22%; 2.93%][−2.35%; −1.21%]
Retail bonds2.42%1.17%−1.81%
mean +/− st. dev.[−0.89%; 5.73%][−0.53%; 2.86%][−2.49%; −1.13%]
10Y Treasury bonds2.25%1.66%−1.54%
mean +/− st. dev.[−0.10%; 4.61%][0.14%; 3.18%][−2.06%; −1.02%]
Pre-tax average rate of return paid by companies on credit liabilities5.04%3.40%0.34%
mean +/− st. dev.[0.92%; 9.15%][1.57%; 5.22%][−0.35%; 1.02%]
Pre-tax average rate of return
on government bonds
Treasury bonds3.37%2.14%−1.39%
mean +/− st. dev.[0.08%; 6.66%][0.45%; 3.82%][−1.95%; −0.84%]
Retail bonds3.01%1.91%−1.43%
mean +/− st. dev.[−0.21%; 6.23%][0.07%; 3.74%][−2.12%; −0.74%]
10Y Treasury bonds3.05%2.52%−1.10%
mean +/− st. dev.[0.84%; 5.25%][0.91%; 4.12%][−1.6%; −0.6%]
All rates are given as real rates of return.
Table 2. Estimates of Social Discount Rate for Poland based on Ramsey and Ramsey–Gollier equation.
All Available DataData Since
Q2 2004
Data Since
January 2019
Mortality component (log)0.9599%0.9599%0.9599%
Elasticity of marginal utility
of consumption
1.11741.11051.0776
Rate of consumption growth (log)3.2711%3.0690%1.1746%
Rate of consumption growth (log) variance0.00520.00460.0018
SRTP–Ramsey approach4.72%4.46%2.25%
SRTP–Ramsey–Gollier approach4.39%4.17%2.14%
All rates are given as real rates of return.
Publisher’s Note: MDPI stays neutral with regard to jurisdictional claims in published maps and institutional affiliations.

