Article

Optimizing the Geometric Parameters of a Straight-Through Labyrinth Seal to Minimize the Leakage Flow Rate and the Discharge Coefficient

School of Mechanical Engineering, Kookmin University, 77 Jeongneung-ro, Seongbuk-gu, Seoul 02707, Korea
*
Author to whom correspondence should be addressed.
Energies 2021, 14(3), 705; https://doi.org/10.3390/en14030705
Submission received: 15 December 2020 / Revised: 9 January 2021 / Accepted: 26 January 2021 / Published: 29 January 2021
(This article belongs to the Special Issue Gas Turbine Cooling Systems Design and Analysis)

Abstract

:
A straight-through labyrinth seal is one of the most popular non-contacting annular seals through which energy dissipation by turbulence viscosity interaction is achieved with a series of teeth and cavities. The geometric parameters of the straight-through labyrinth seal, such as clearance, tooth width, tooth height, cavity width, and tooth inclination angle, affect its performance. The space for installing a labyrinth seal in turbomachinery is limited, and so it is important to optimize its geometry for a fixed axial length in order to minimize the leakage flow rate and the discharge coefficient. The objective of the current study is to understand the effects of changing the geometric parameters of the seal on the leakage flow rate and the discharge coefficient, and to determine the optimized geometry for a fixed axial length. When the whole axial length is fixed, the most effective way to decrease the discharge coefficient is to reduce the cavity width by increasing the number of cavities. However, if the number of cavities is too high, the beneficial effect of more cavities can be reversed. The results of this study will help turbomachinery manufacturers to design a more efficient labyrinth seal. Numerical simulations of leakage flow for the straight-through labyrinth seal were carried out using Reynolds-Averaged Navier–Stokes (RANS) models, and the results for their discharge coefficients and pressure distributions were compared to previously published experimental data.

1. Introduction

Increasing the efficiency of turbomachinery, such as a gas turbine, by decreasing the leakage flow rate has become an important topic in the engineering community. Although contact seals can constrict the leakage flow rate efficiently, they cannot be used in turbomachinery with many parts moving at a high speed because of the possibility of causing damage through friction or heat expansion. Therefore, non-contact seals are used to reduce the leakage flow rate and increase the efficiency of turbomachinery by increasing the flow resistance under a specific pressure difference and reducing the leakage flow rate [1]. One of the most used non-contact seals is the labyrinth seal, because of its high sealing capacity and ease of manufacturing [2]. It is an annular type divided into three categories—stepped, straight, and staggered [3]. Of these, the straight-through seal is a simple and basic type that is the most frequently manufactured. The labyrinth seal consists of a rotor, stator, and a series of teeth and cavities to increase the flow resistance. 
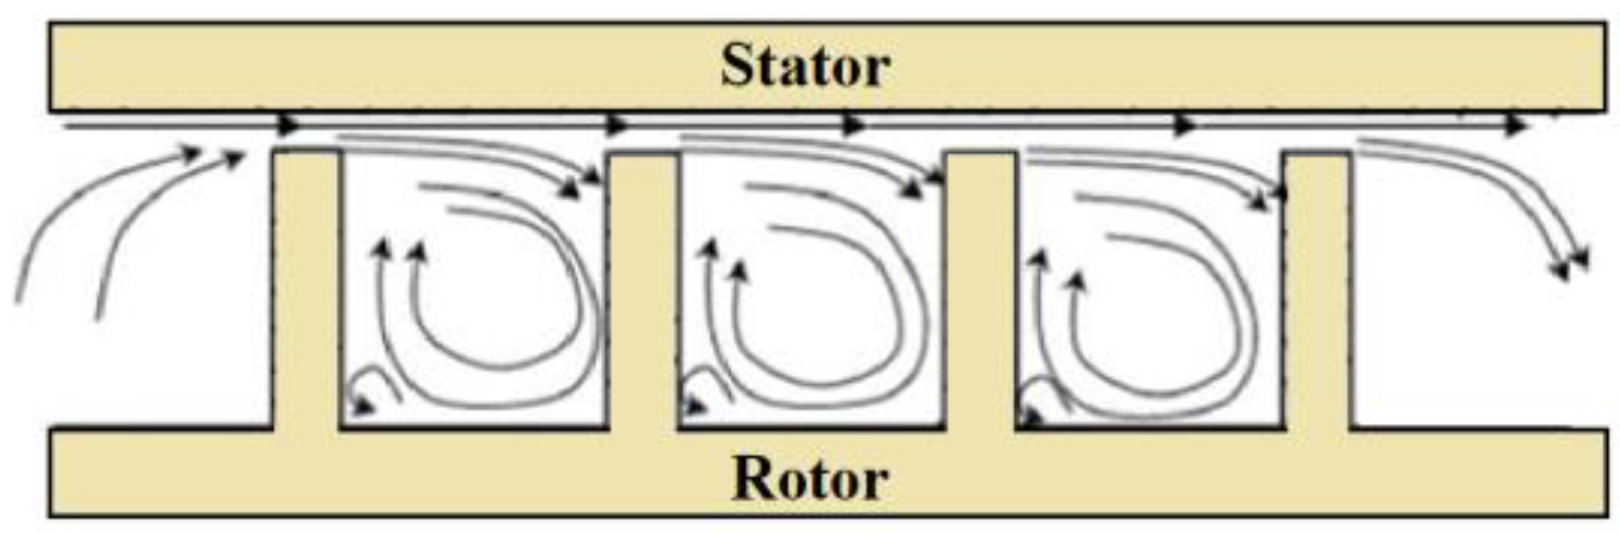
Figure 1 illustrates the typical flow pattern in a straight-through labyrinth seal.
As the fluid flow goes through the clearance above a tooth, the high-pressure head is converted into kinetic energy in the flow, and a jet is generated because of the narrow clearance. A portion of the jet that passes above the tooth goes on to the next tooth, while the remainder interacts with the vortex within the cavity [4]. Meanwhile, part of the kinetic energy is dissipated by the vortex generated in the cavities [5], and as the flow continues on through constrictions made by the series of teeth and cavities, the kinetic energy of the flow is dissipated continuously, leading to a reduction in the leakage flow rate and the discharge coefficient.
Becker [6] explained the fluid flow in labyrinth seals and modeled the flow as a Poiseuille flow and tried to find the friction coefficient, while Martin [7] derived an equation to calculate the leakage flow rate in a labyrinth seal for the first time; he thought that the fluid flow through a labyrinth seal is similar to that in a series of orifices when assuming that the kinetic energy of the flow in the cavity is totally dissipated. Stodola [8] also formulated a leakage flow rate equation using Bernoulli’s principle and the continuity equations; although his equation was similar to Martin’s, he neglected the movement of the kinetic energy in the cavities. Egli [9] investigated the effect of changing the number of teeth on the leakage flow rate and stated that Martin’s equation could be used when the labyrinth seal has four or more teeth; he modified Martin’s equation by applying flow coefficients determined empirically. Dollin and Brown [10] adapted Martin’s equation using a polytropic thermodynamic path function; they reported that Martin’s equation underestimated the leakage flow rate, as he assumed that the flow in the seal is isothermal. Hodkinson [11] analyzed the kinetic energy carryover coefficient in the labyrinth seal by assuming that a portion of the jet is carried over to the next cavity. He also produced an equation to estimate the leakage flow rate through the seal using the kinetic energy carryover coefficient and predicted its value experimentally. Jeri [12] carried out experiments on a labyrinth seal and reported that the optimum ratio of the tooth height to the pitch was slightly less than 1; when the ratio is too high and the teeth are too concentrated, the sealing performance is reduced, and the leakage flow rate is increased.
Bell and Bergelin [13] investigated the effect of the fluid flow’s Reynolds number on the flow coefficients. When the Reynolds number is low, the flow coefficients are dependent on it, whereas when it is high, the flow coefficients are almost constant; they reported that the geometry of the seal affects the flow coefficients considerably. Vermes [14] modified Martin’s equation by assuming a non-isothermal flow; the flow coefficients from Bell and Bergelin [13] and a correction factor for the carried over kinetic energy were used. Wittig et al. [15] predicted the discharge coefficients in the labyrinth seals both experimentally and numerically; he used computational fluid dynamic (CFD) codes and compared the results with the experimental data and reported that the discharge coefficient strongly depends on the size of the clearance, and that increasing the clearance makes the discharge coefficient higher. Saikishan [16] investigated the effects of tooth geometry on leakage flow characteristics using the Reynolds-Averaged Navier–Stokes (RANS) turbulence model; he calculated the discharge and kinetic carryover coefficients by varying geometric parameters and compared his results with the experimental data. Zhao [17] carried out RANS simulations to investigate the effects of changing the cavity depth and length, the number of cavities, and the cavity locations on the leakage loss; he concluded that when the depth and length, or the number of cavities, is increased, the leakage loss is increased. However, he did not compare the CFD results with the experimental data, and the number of cases was insufficient to make generalizations in the conclusions.
There have been several studies on the effect of changing some of the geometrical parameters on the leakage flow rate and the discharge coefficient. However, when the labyrinth seals in turbomachinery are designed by engineers, the space to install the seal is limited, and so it is important to optimize the geometry of the labyrinth seal for a fixed axial length so as to minimize the leakage flow rate and the discharge coefficient. The objective of this study is to understand the effects of changing several geometric parameters of a straight-through seal on the discharge coefficient, and to optimize the geometry for a fixed axial length. The effects of changing the clearance, tooth inclination angle, tooth height, cavity width, and tooth width on the discharge coefficient were investigated using RANS simulations, after which the optimal geometric parameter values to decrease the discharge coefficient were decided upon. Based on this knowledge, an example of the optimized geometry of a labyrinth seal for a fixed axial length was suggested. Actually, RANS could not accurately predict the complex flow structures induced in the labyrinth seal, as all of the turbulent fluctuations were ensemble-averaged, while LES resolves directly large-scale eddies in the turbulent flow, leading to more accurate predictions of the complex flow. However, LES requires much higher computational costs than RANS; therefore, in this study, RANS was used.

2. Geometry and Boundary Conditions

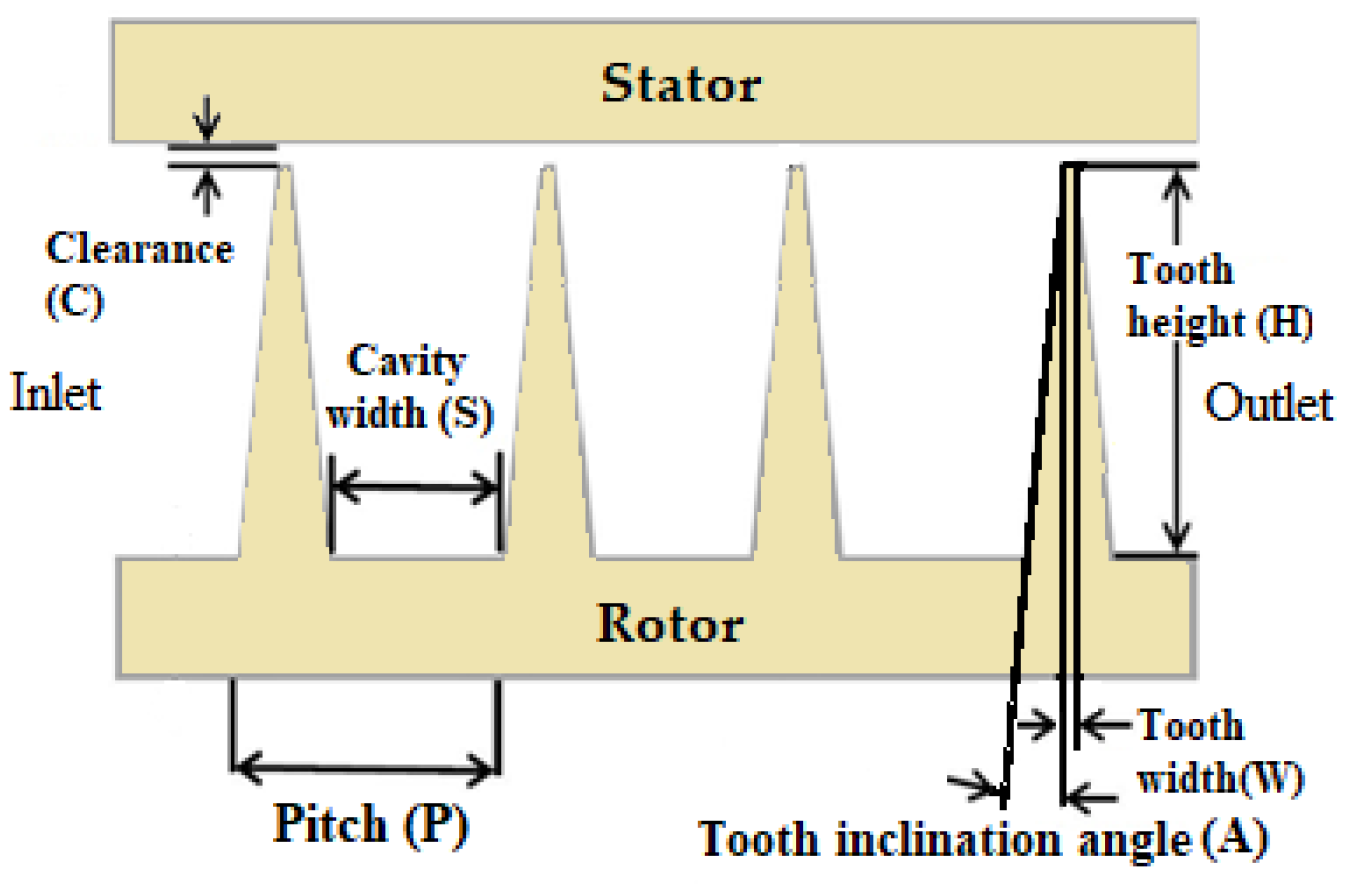
Figure 2 shows the geometrical parameters of a straight-through labyrinth seal in the computational domain. The baseline geometry of the labyrinth seal in the current study was taken from Wittig et al. [15], whose experimental apparatus consisted of five teeth on a flat plate. In their apparatus, the tooth height, width, and inclination angle; the cavity width; the pitch; and the clearance were set to 10.5 mm, 2.5 mm, 0, 9.5 mm, 12 mm, and 0.5 mm, respectively. Air was supplied by a compressor and the maximum flow rate was 0.5 kg/s. The mass flow rate was measured by the orifice meter and it was controlled by the valves located in the orifice meter section. The maximum pressure ratio was 4. The settling chamber was located in front of the labyrinth seal to make the entrance condition similar to that of real turbomachinery. The boundary conditions in the computational domain are specified in Table 1. The turbulence intensity of the mainstream flow at the inlet was 0.2% and the pressure ratios at the inlet were 1.1, 1.5, and 2. The temperature of the main flow was set as 300 K.
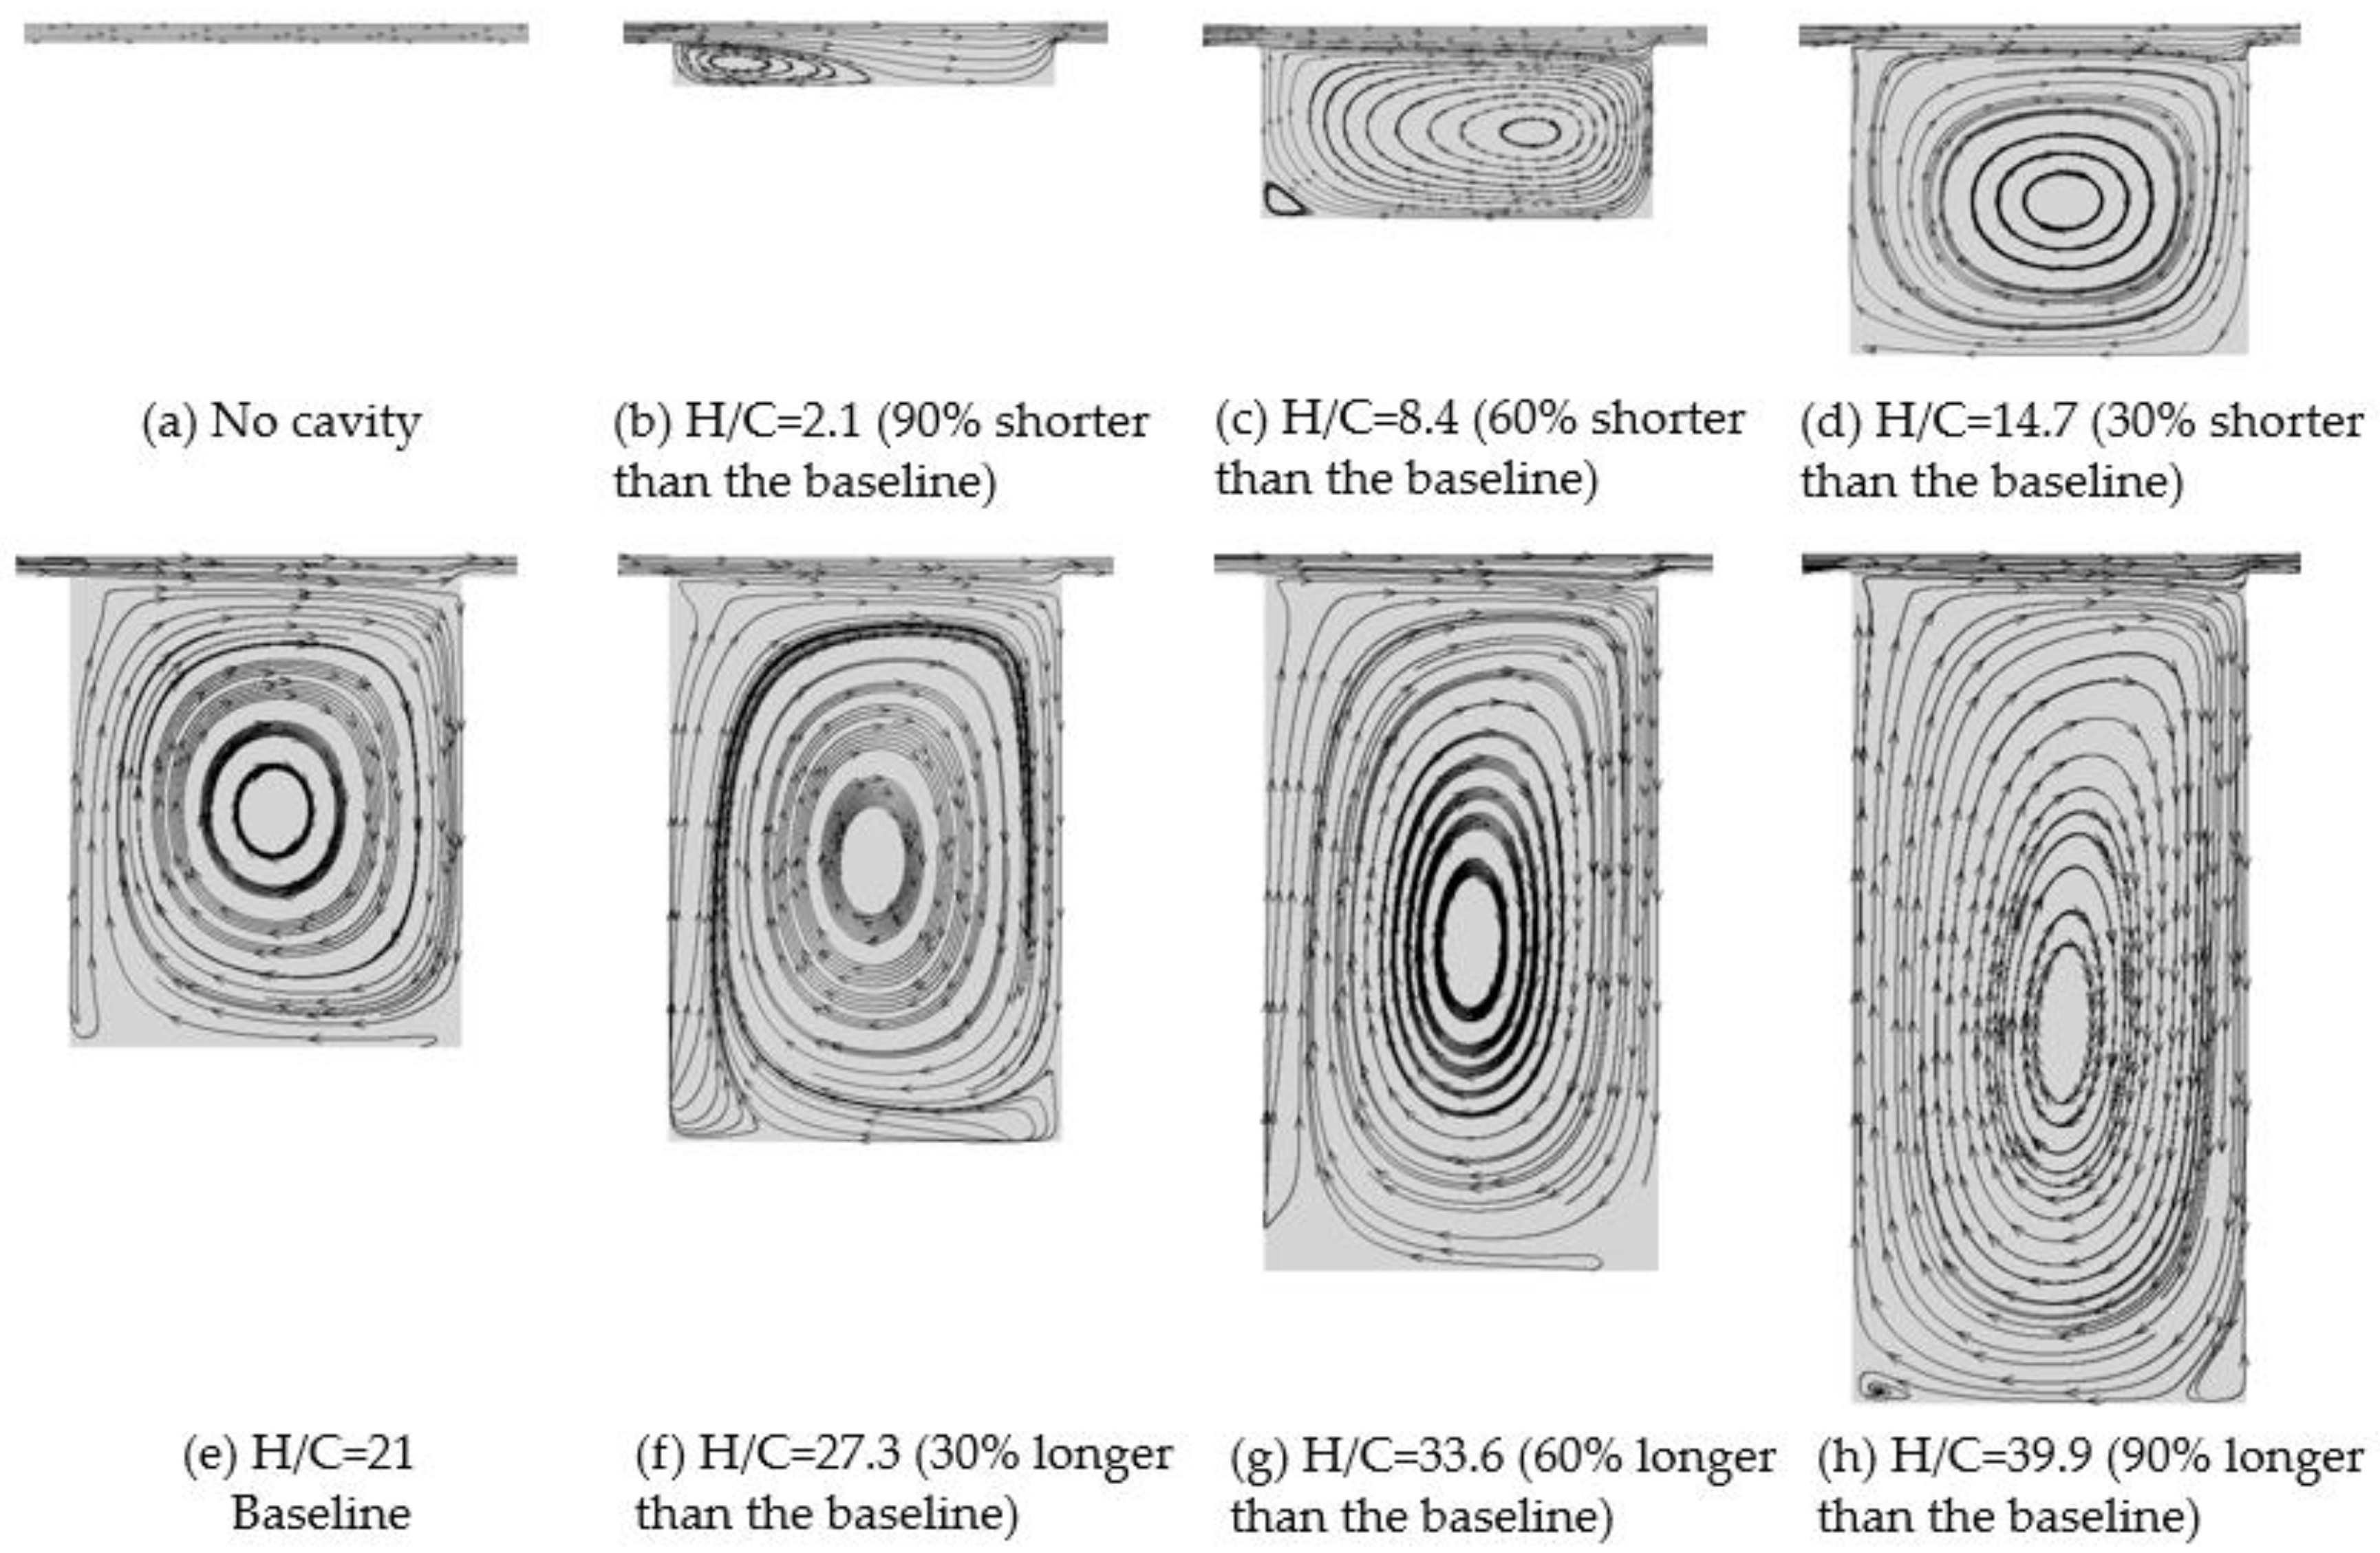
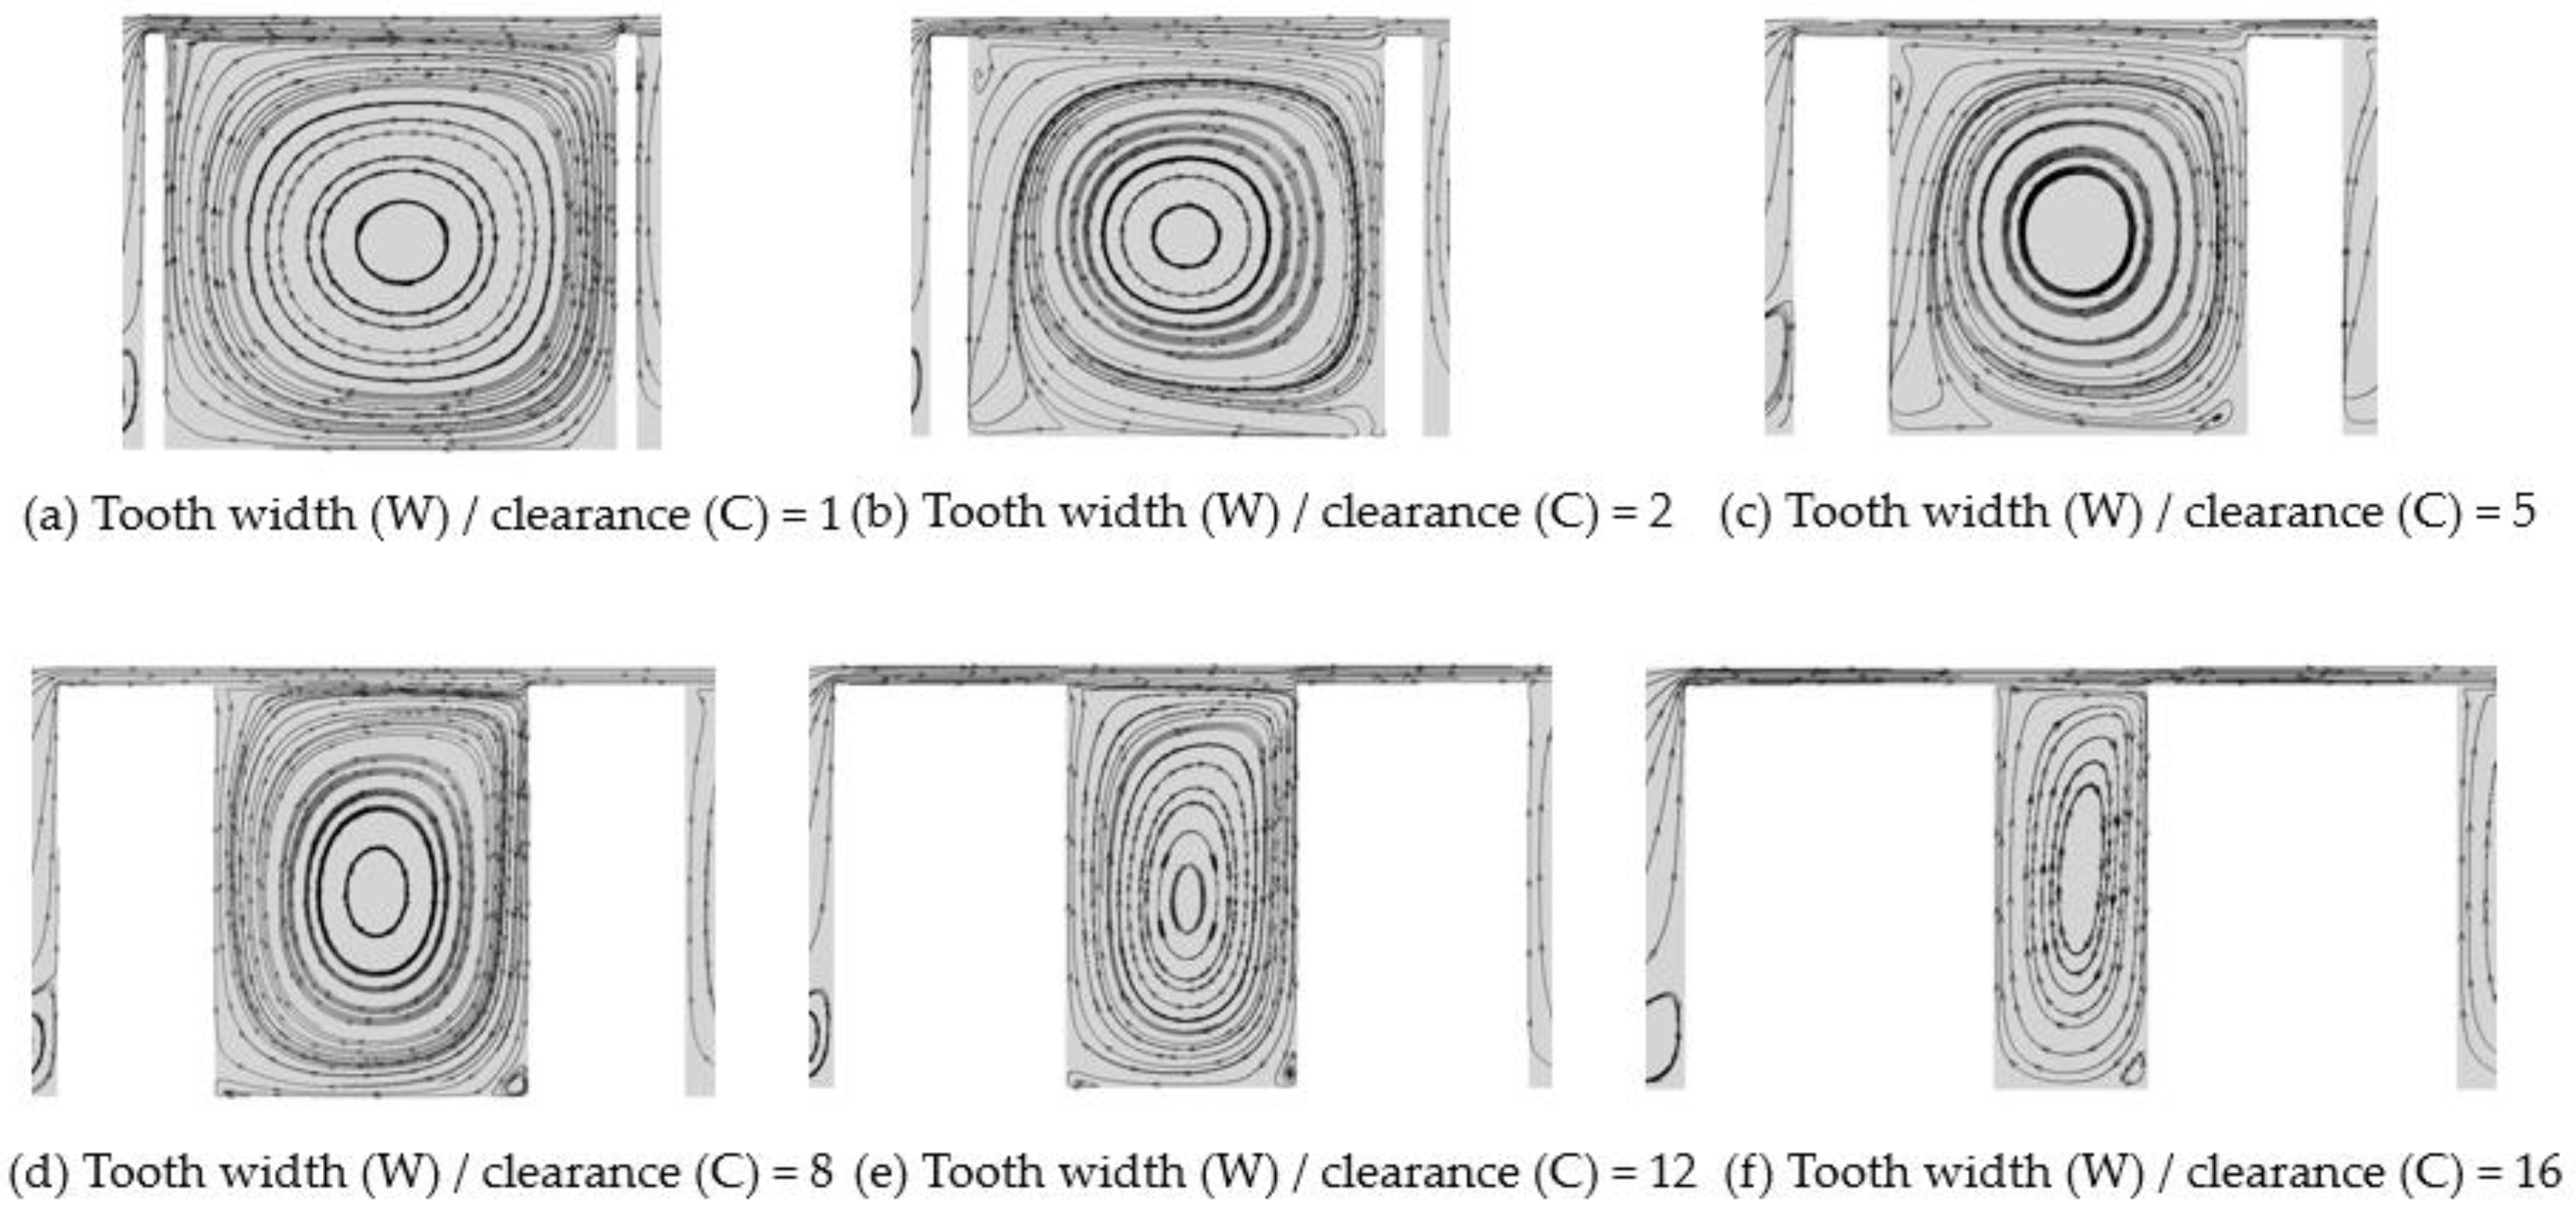
The divergence angle (β) introduced by Hodkinson [11] was measured by the streamline separating the vortex in the cavity and the fluid flow passing to the next cavity, as can be seen in Figure 3. This angle was decided by the line between the lip of the former tooth and the point of the impingement of the jet on the sidewall of the next tooth. If β is increased, a smaller portion of the upstream jet is passed to the next cavity, resulting in a decrease in the leakage flow rate and the discharge coefficient.

3. Validation of Numerical Methods

The CFD calculations were performed using ANSYS Fluent v.19.1 [18], and the meshes were generated in Pointwise v.18.1 [19]. The fluid was assumed to be Newtonian and compressible. The governing equations of the CFD simulations were continuity and momentum equations, while the Navier–Stokes equations are the conservation of momentum and the continuity equations in a differential form. In the RANS approach, all of the turbulent fluctuations in the flow were temporally averaged. The ensemble averages of the conservation of mass (Equation (1)), momentum (Equations (2)–(4)), and energy (Equation (5)) equations for turbulent flows are expressed as follows [20,21,22]:
Conservation of mass (the continuity equation):
× ( ρ u ¯ ) = 0
Conservation of momentum:
× ( ρ u ¯ u ¯ ) =   d p ¯ d x +   × ( μ u ) +   { ( ρ u u ¯ ) x ( ρ u v ¯ ) y   ( ρ u w ¯ ) z }
× ( ρ v ¯ u ¯ ) =   d p ¯ d y +   × ( μ v ) +   { ( ρ v u ¯ ) x ( ρ v v ¯ ) y   ( ρ v w ¯ ) z }
× ( ρ w ¯ u ¯ ) =   d p ¯ d z +   × ( μ w ) +   { ( ρ w u ¯ ) x ( ρ w v ¯ ) y   ( ρ w w ¯ ) z }
Conservation of energy:
0 = k 2 T ρ c p x T u ¯   ρ c p x T v ¯   ρ c p x T w ¯
The six Reynolds stresses, namely, ρ u u ¯ , ρ u v ¯ , ρ u w ¯ , ρ v v ¯ , ρ v w ¯ , and ρ w w ¯ in Equations (1)–(3), and T u ¯ , T v ¯ , and T w ¯ in Equation (4), needed to be modeled [20]. The overbar represents the mean components; while   u ,   v ,   and   w are the fluctuating velocity components; and T is the temperature. Closure for the equations was obtained through Boussinesq′s hypothesis, which is expressed as [22]:
ρ u i u j ¯ = μ t ( u i x j + u j x i 2 3 u k x k δ i j ) 2 3 ρ k δ i j
where μ t is the turbulence viscosity and needs to be modeled as [22]
μ t = ρ C μ k 2 ε
μt is assumed to be the same in all directions, and the assumption shows good results for a lot of simple turbulent flows, even though the assumption is not true [22]. Equations (1)–(7) could not be solved analytically, thus CFD simulations were the only way to obtain solutions for the equations, which required a turbulence model to close the equations mathematically.
The numerical simulations were executed in RANS using the various turbulence models; the RANS runtime using 16 cores of an Intel Xeon Gold 6148 processor was around 6 h for each case. The levels of 10−6 were used as the solution convergence criteria. 
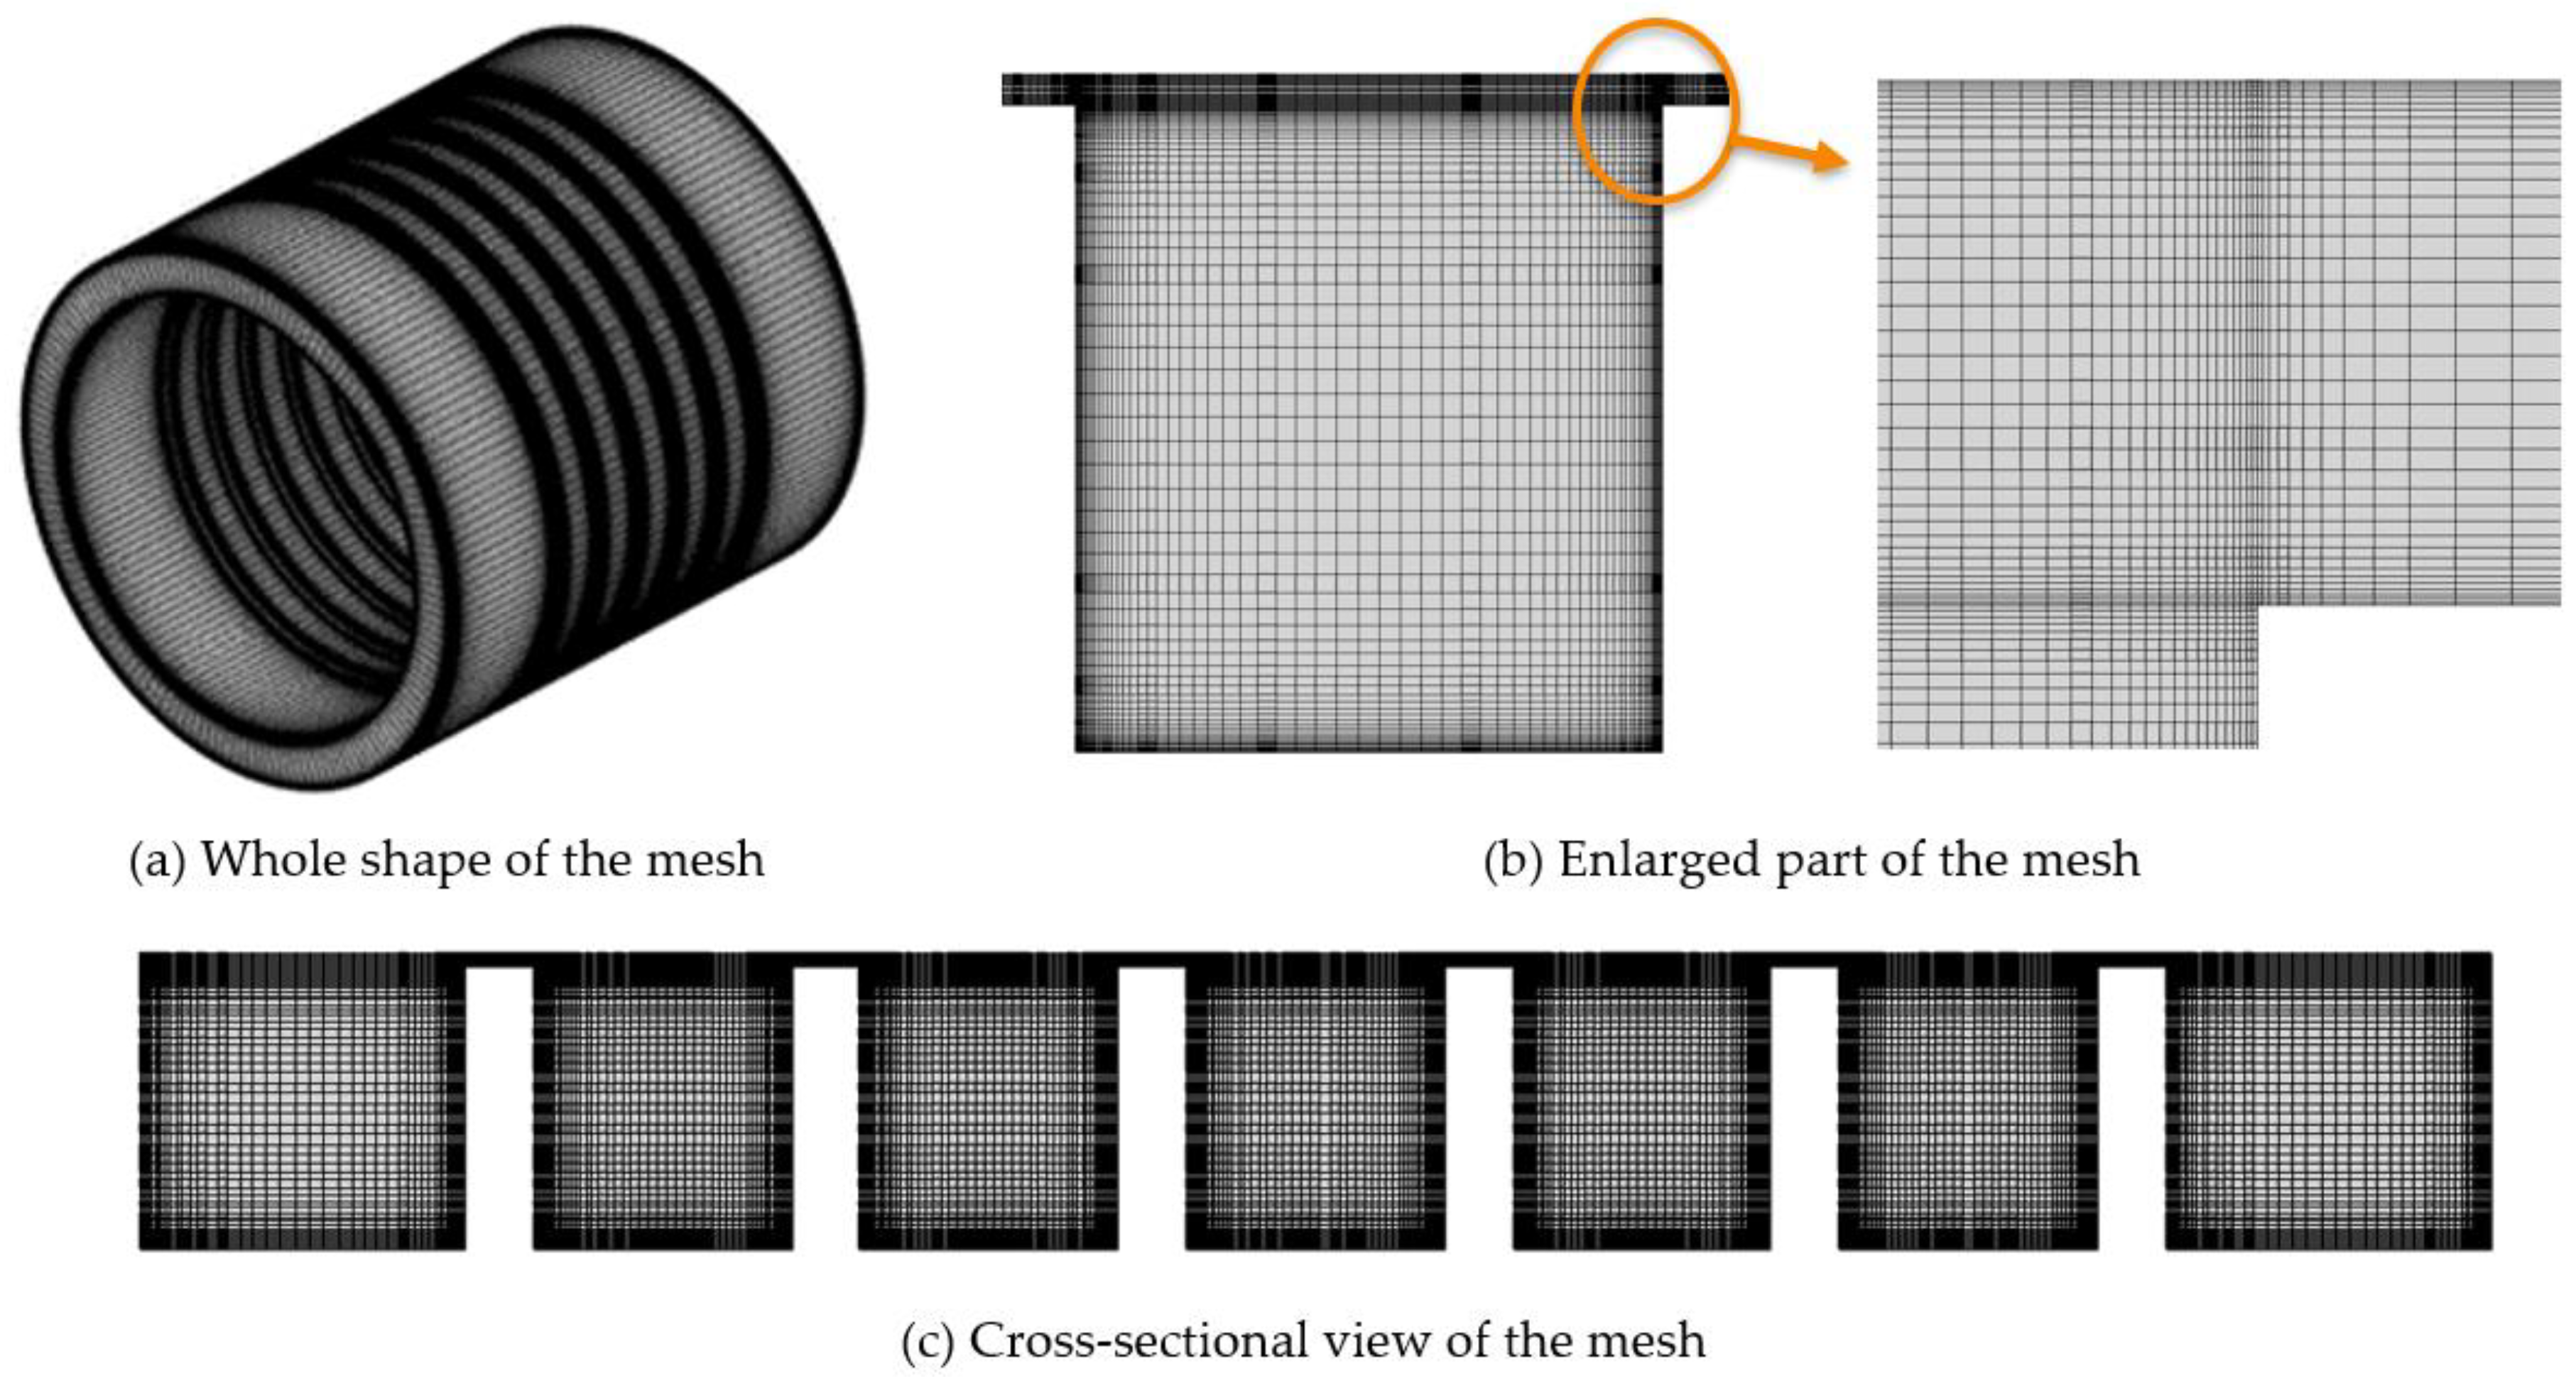
Figure 4 shows the 3D baseline mesh of the straight-through labyrinth seal composed of around 8 million hexahedron cells; the clearance was 0.5 mm, the tooth inclination angle was 0°, the tooth height was 10.5 mm, the cavity width was 9.5 mm, the tooth width was 2.5 mm, and the number of cavities was 5, as described in Wittig et al. [15]. Y+ values around the walls were set to less than 3 so as to capture the normal velocity gradient of the wall in the viscous sublayer accurately.
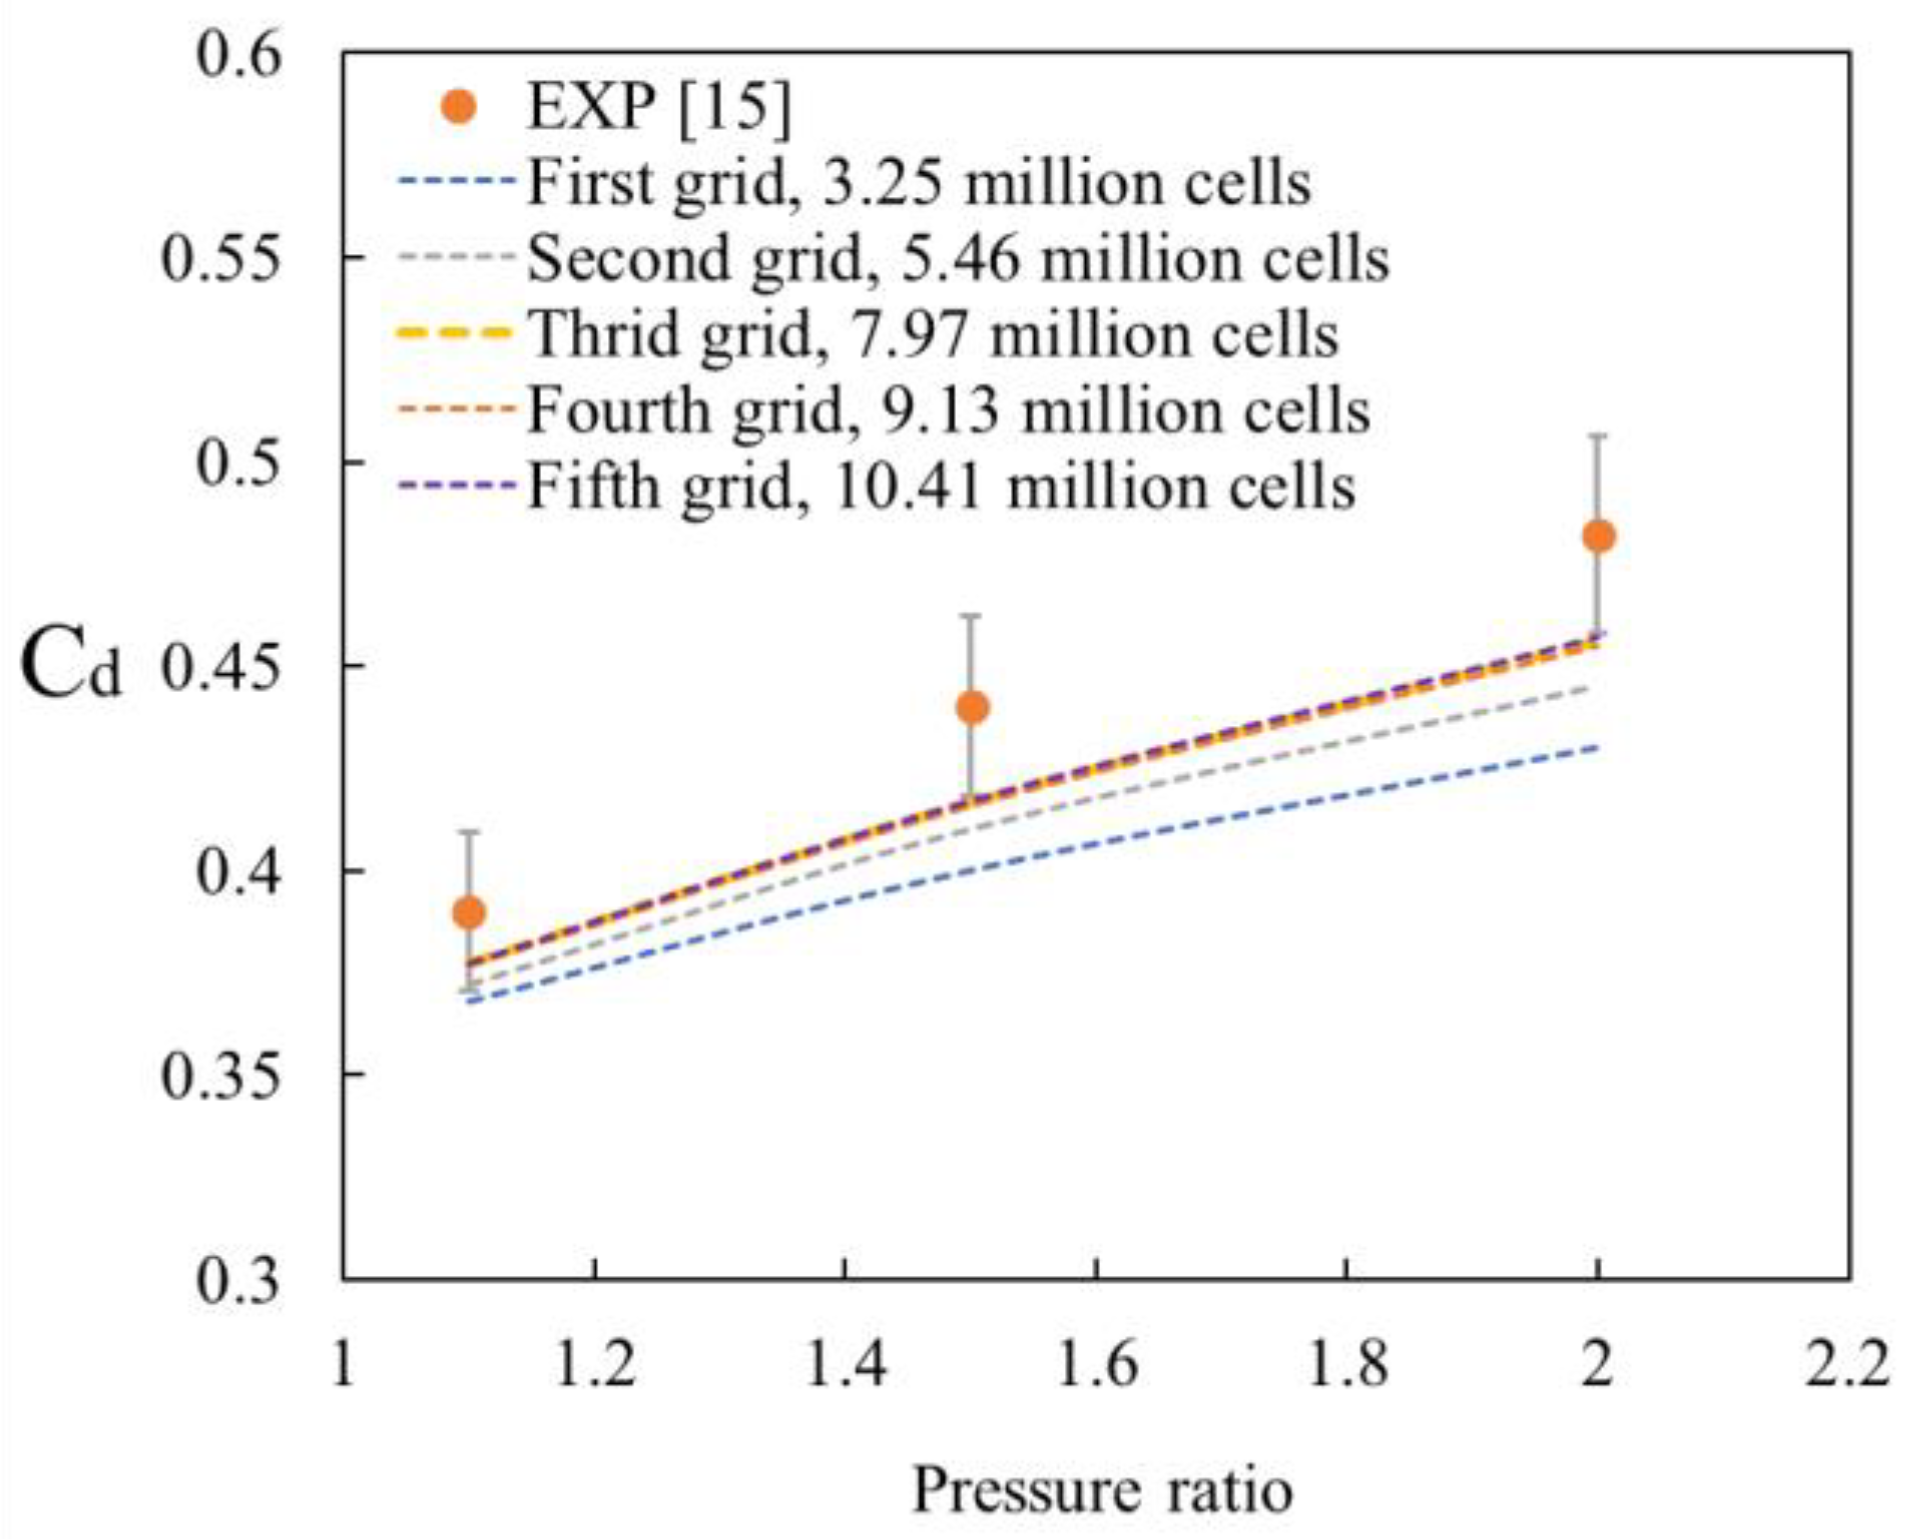
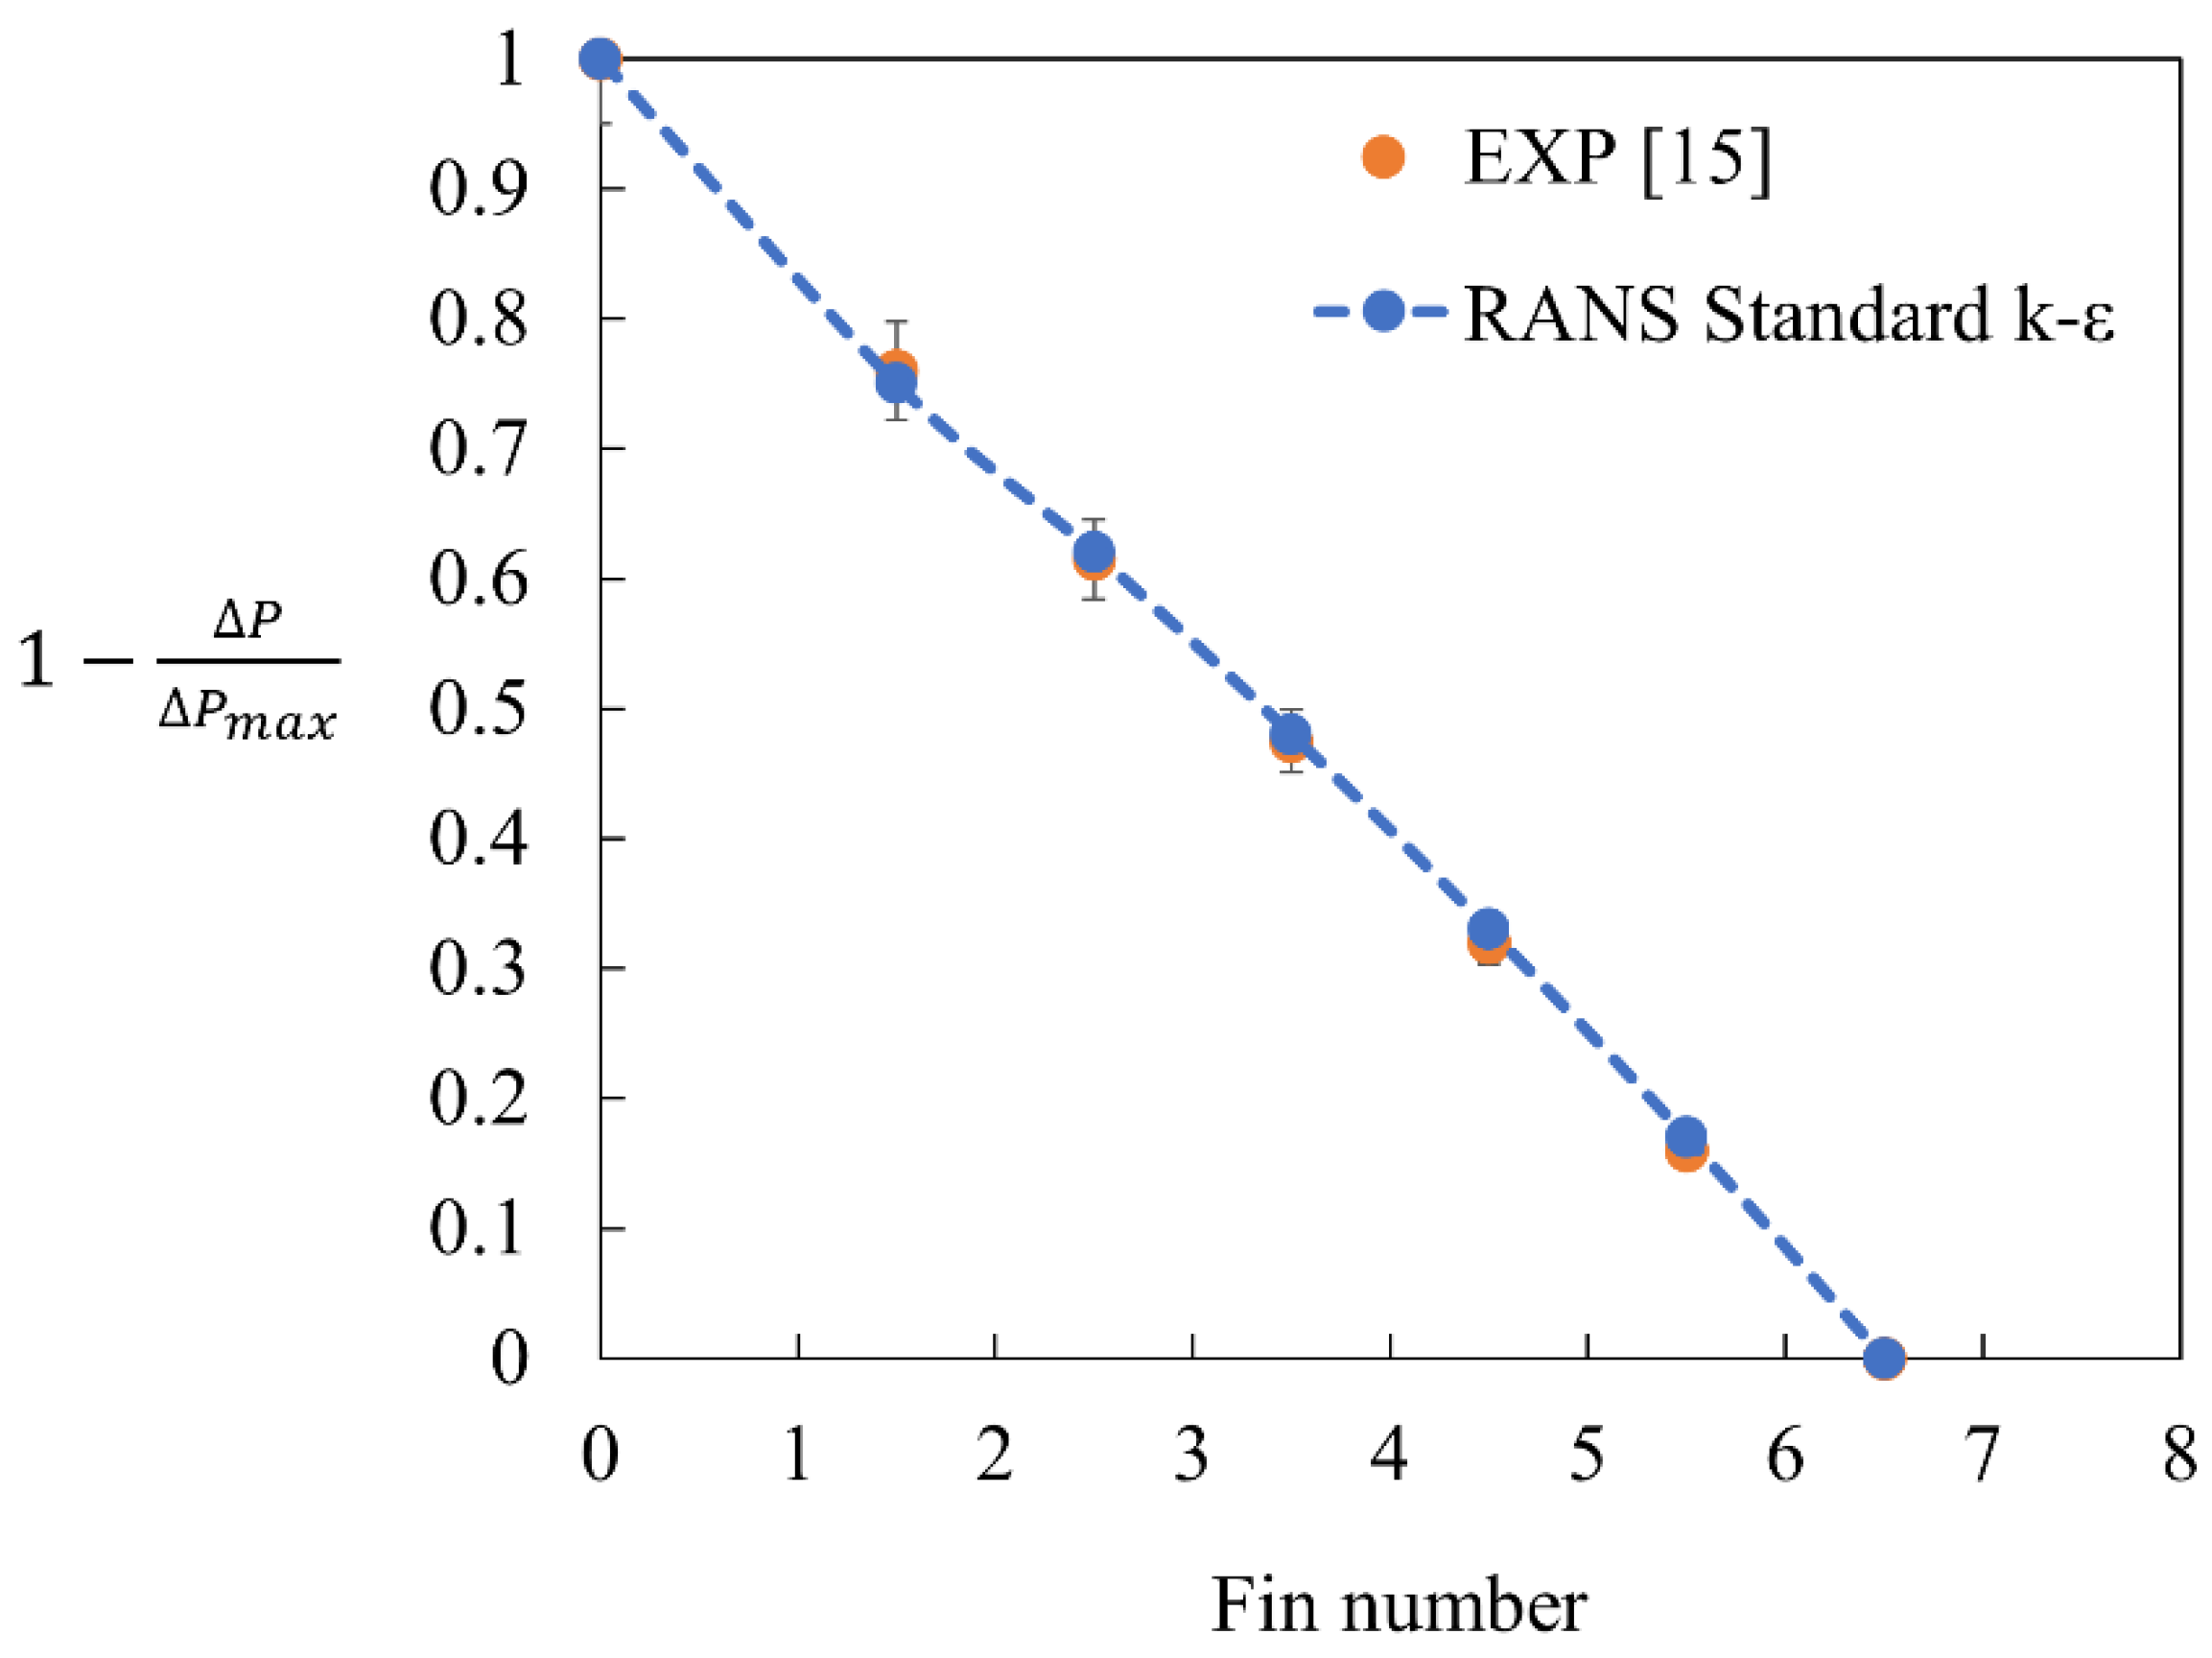
Figure 5 displays the results of the grid sensitivity tests, with the grid description shown in Table 2. The results were obtained using the standard k−ε model in RANS, and the sensitivity test was performed on the five different grids. The discharge coefficient on the third grid with 7.97 million cells matched those of the finer fourth and fifth grids. Thus, the discharge coefficient in the baseline mesh of the labyrinth seal was evaluated on the 7.97 million cells grid. The uncertainty bar (5%) was added in the plot, and the discharge coefficients on the third, fourth, and fifth grid were within the uncertainty error of the experimental data.
For the CFD verification, RANS simulations were carried out using several turbulence models, and the results were compared with the experimental data. 
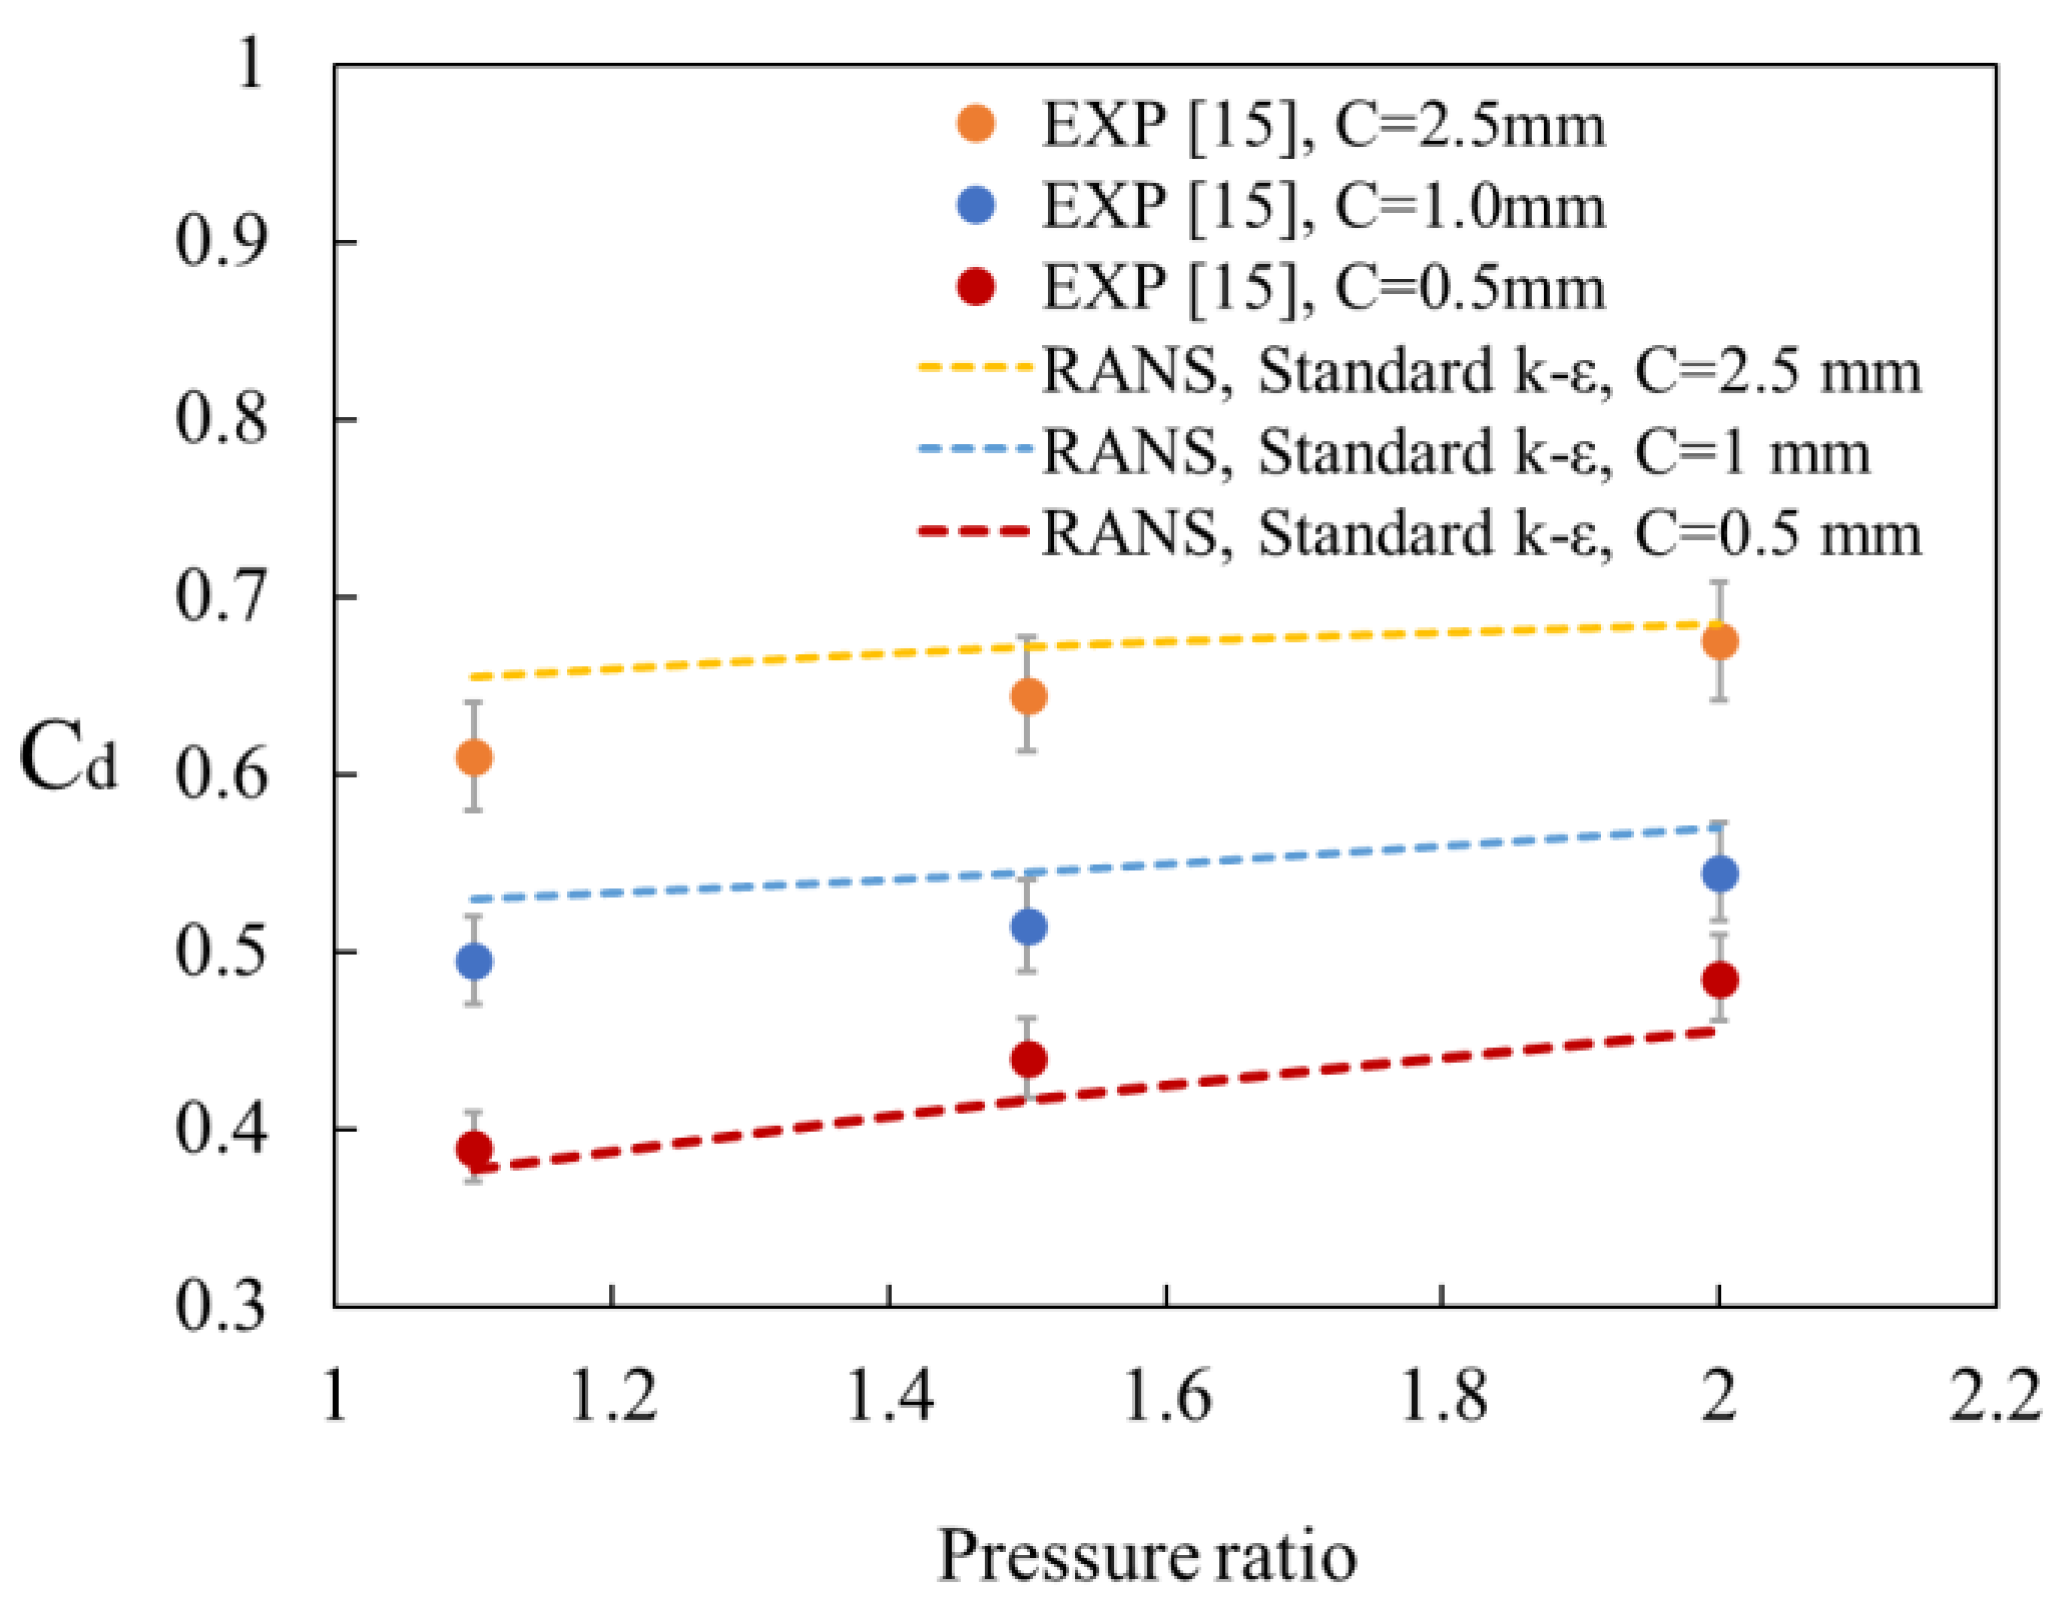
Figure 6 shows the effect of the pressure ratio on the discharge coefficient by using three RANS turbulence models for the clearance of 0.5 mm in the baseline seal. The differences between the RANS and the experimental discharge coefficient results were around 4%, 6%, and 13% for the standard k−ε, k−ω shear stress transport (Menter’s SST), and standard k−ω models, respectively, indicating that the result from the standard k−ε model showed the least difference with the experimental data. As the standard k−ε model under-predicts the discharge coefficient while the k−ω model overestimates it, all numerical simulations in this study from this point forward were executed using the standard k−ε model. In the setting of the fluent, the two-layer model was employed and the one-equation model of Wolfstein was used in the near-wall region, whereas in the fully turbulent region, the standard k-epsilon model was employed [18]. Figure 6 indicates the discharge coefficient according to the ratio of the actual leakage flow rate to the ideal leakage flow rate. Figure 7 shows the pressure distribution based on the pressure measured in each cavity of the baseline labyrinth seal for a pressure ratio of 1.38. It was found that the pressure distribution predicted by the standard k−ε model was a good match with the experimental data.

4. Results

4.1. The Effect of Varying the Clearance

An increase in the clearance increased its cross-sectional area and increased the leakage flow rate, leading to a larger portion of the fluid directly flowing into the next cavity without dissipating its kinetic energy. As the Reynolds number increased, the jet divergence angle decreased, thereby increasing the leakage flow rate and the discharge coefficient. When the clearance increased, more fluid could pass through without being affected by the teeth, thereby decreasing the sealing effectiveness. However, the clearance should not be less than a certain value so as to avoid damage to the seal caused by thermal expansion of the material or friction when the clearance is too small. As shown in Figure 8, when the clearance was increased and the other geometrical parameters were kept constant under the same pressure ratio, the discharge coefficient increased. When the clearances were 0.5, 1.0, and 2.5 mm, the differences between the discharge coefficients predicted by RANS and the experimental data were approximately 4%, 6%, and 4%, respectively. Figure 8 also illustrates that when the pressure ratio was increased from 1.1 to 2, the discharge coefficients increased, because the higher pressure head was transferred to the higher kinetic energy of the fluid flow, and the velocity of the flow increased, thereby leading to increases in the leakage flow rate and the discharge coefficients.
The streamlines in the cavity are shown in Figure 9, showing that when the clearance was increased, the jet divergence angle decreased (Table 3), resulting in increases in the leakage flow rate and the discharge coefficients. The angles of the jet divergence for each case were measured using Tecplot360 [22]. Thus, the clearance should be kept as small as possible within the range in order to avoid any possible damage and for a better sealing performance.

4.2. The Effect of Varying the Tooth Inclination Angle

Increasing the tooth inclination angle decreased the discharge coefficient, as can be seen in Figure 10. When the tooth inclination angle was increased from 0° to 16°, the discharge coefficient decreased by around 2%. However, when the angle exceeded 16°, the discharge coefficient only slightly increased.
Figure 11 illustrates the streamlines in the cavity for tooth inclination angles of 0°, 4°, 8°, 12°, 16°, and 20°. When the tooth inclination angle was increased up to 16°, the angle of the jet divergence increased (Table 4), resulting in lower discharge coefficients. As the tooth inclination angle was increased, the upper-right corner of the cavity (marked by orange circles in Figure 11) was less affected by the vortex because the streamlines of the vortex could not be angular. Furthermore, the jet divergence angle could be increased easily, and so when the tooth inclination angle was increased up to 16°, the jet divergence angle increased, resulting in a decrease in the discharge coefficient. However, when it exceeded 16°, the upper-right corner of the cavity less affected by the vortex was not widened but was a little bit narrowed, leading to a slight increase in the discharge coefficient. In this study, it is found that the critical value of the angle was around 16°, but this value depends on the ratio of the cavity width to the tooth height.

4.3. The Effect of Varying the Tooth Height

The discharge coefficient distribution for a clearance of 0.5 mm and tooth heights of 0 mm (no cavity), 1.05 mm (90% shorter), 4.2 mm (60% shorter), 7.35 mm (30% shorter), 10.5 mm (baseline), 13.65 mm (30% longer), 16.8 mm (60% longer), and 19.95 mm (90% longer) are shown in Figure 12, while Figure 13 illustrates the streamlines for each case. The discharge coefficients were lower with a cavity than without one, indicating that the cavity plays an important role in increasing the sealing performance. When the ratio of the tooth height to the clearance was increased from 14.7 (30% shorter) to 39.9 (90% longer), the discharge coefficient decreased by only around 1.7%. This is because when the tooth height increased, the vortex in the cavity expanded upward and downward, and a little more kinetic energy was dissipated, as can be seen in Figure 13. However, it did not affect the jet divergence angle and the discharge coefficient by much. On the other hand, when the ratio of the tooth height to the clearance was decreased from 14.7 (30% shorter) to 2.1 (90% shorter), the discharge coefficient slightly decreased. This can be attributed to the low ratio values of the tooth height to the tooth width. As shown in Figure 13b, when the ratio of the tooth height to the clearance was 2.1, the vortex generated on its left-hand side could not fill up the whole area of the cavity. Thus, after passing the clearance, the jet diverged at the bottom of the cavity, leading to an increase in the jet divergence angle and a decrease in the discharge coefficient. Although the benefit of increasing the tooth height was almost negligible, the discharge coefficient increased when there was no cavity or the ratio of the tooth height to the clearance was less than 2, which is disadvantageous to the sealing performance, because the vortex was either not generated or was too small to reduce the kinetic energy of the flow.

4.4. The Effect of Varying the Cavity Width

The effect of changing the cavity width when the whole axial length of the labyrinth is fixed was investigated, because when engineers design labyrinth seals for placement in turbomachinery, the axial length of the labyrinth is often fixed. Assuming the tooth width is fixed, this effect is closely related to varying the number of teeth in a fixed axial length. As can be seen in Figure 14, for a fixed whole axial length of 86.5 mm, when the ratio of the cavity width to the clearance increased from 3 to 115, the number of cavities was reduced from 10 to 1, respectively, and the discharge coefficient increased by around 25%. The effect of increasing the number of cavities on the discharge coefficient was stronger than the effect of increasing the cavity width. However, when the number of cavities was too high (e.g., 15) and the ratio of the cavity width to the clearance was 3, the discharge coefficient became higher than that when the number of cavities was 10 and the ratio of the cavity width to the clearance was 7. This is because when the ratio of the tooth height to the cavity width was too high, a strong vortex was generated in only the upper section of the cavity (Figure 15a–e), which caused less kinetic energy to dissipate, leading to an increase in the leakage flow rate and the discharge coefficient.

4.5. The Effect of Varying the Tooth Width

As stated earlier, it was important to ascertain the effect of changing the tooth width on the discharge coefficient when the whole axial length of the labyrinth is fixed. Figure 16 shows that when the tooth width to clearance ratio increased from 1 to 16, the discharge coefficient increased by around 7%. This result indicates that when the space in the turbomachinery to install the labyrinth seal was limited, increasing the tooth width negatively affected the sealing performance, while increasing the number of cavities was more effective at decreasing the discharge coefficient. Figure 17 illustrates the streamlines for each case.

4.6. Sensitivity Analysis of the Geometrical Parameters

Based on the results in Section 4.1, Section 4.2, Section 4.3, Section 4.4 and Section 4.5, the sensitivities of the geometrical parameters (clearance; tooth inclination angle, height, and width; and cavity width) toward changing the discharge coefficient were calculated as percentages. The sensitivity for each parameter was calculated when the values of the other parameters were fixed. The calculated value for each parameter represents the maximum rate of change of the discharge coefficient when the parameter was changed, and the axial length was fixed. As illustrated in Figure 18, the most effective geometrical parameter for decreasing the discharge coefficient was the clearance, while the secondary most effective parameter for improving the sealing performance was the cavity width, which is closely related to the number of cavities, because reducing the cavity width for a fixed axial length requires more cavities. Furthermore, the third most effective parameter for decreasing the leakage flow rate was the tooth width, although decreasing the cavity width and increasing the number of cavities was actually more effective. Meanwhile, changing the tooth inclination angle and the tooth height was not as effective at increasing the sealing performance as changing the other parameters.

4.7. An Example of Optimized Geometry for a Straight-Through Labyrinth Seal

Here, an example of the optimized geometry of the labyrinth seal for a fixed axial length is suggested based on the results of Section 4.6, the geometric parameters for which are specified in Table 5. From the results in Section 4.1, Section 4.2, Section 4.3, Section 4.4, Section 4.5, Section 4.6 and Section 4.7, we found that low clearance, a tooth inclination angle of 16°, a high-number of cavities, and a short tooth width were advantageous, whereas a high tooth height was not, for decreasing the discharge coefficient when the whole axial length was fixed. Thus, for the suggested geometry of the labyrinth seal, the clearance was set as 0.5 mm (the baseline) and the tooth inclination angle was set as 16°. Meanwhile, the tooth height was decreased compared with the baseline, and the number of cavities was increased while the cavity width and the tooth width were reduced.
Figure 19 shows the streamlines for the baseline and suggested optimal design of the labyrinth seal, with the same entire axial length. Even though the sizes of the vortices in the cavities with the suggested optimal design were much smaller than those for the baseline, the results in Table 6 indicate that the sealing performance of the suggested optimal design of the labyrinth seal was better than that of the baseline, as the discharge coefficient for the former was lower by around 23%, 14%, and 12% under the pressure ratios of 1.1, 1.5, and 2, respectively. Table 6 shows that the discharge coefficients for the suggested optimal design of the labyrinth seal were lower than those of the baseline, while the jet divergence angles for the suggested optimal design of the labyrinth seal were higher than those of the baseline.
Figure 20 illustrates the contours of the static pressure of the labyrinth seal under a pressure ratio of 2. In the suggested optimally designed seal, the static pressure dropped faster than that in the baseline seal as the fluid flowed downstream, indicating that the pressure head was converted more rapidly to kinetic energy, thereby showing a better sealing performance.

5. Conclusions

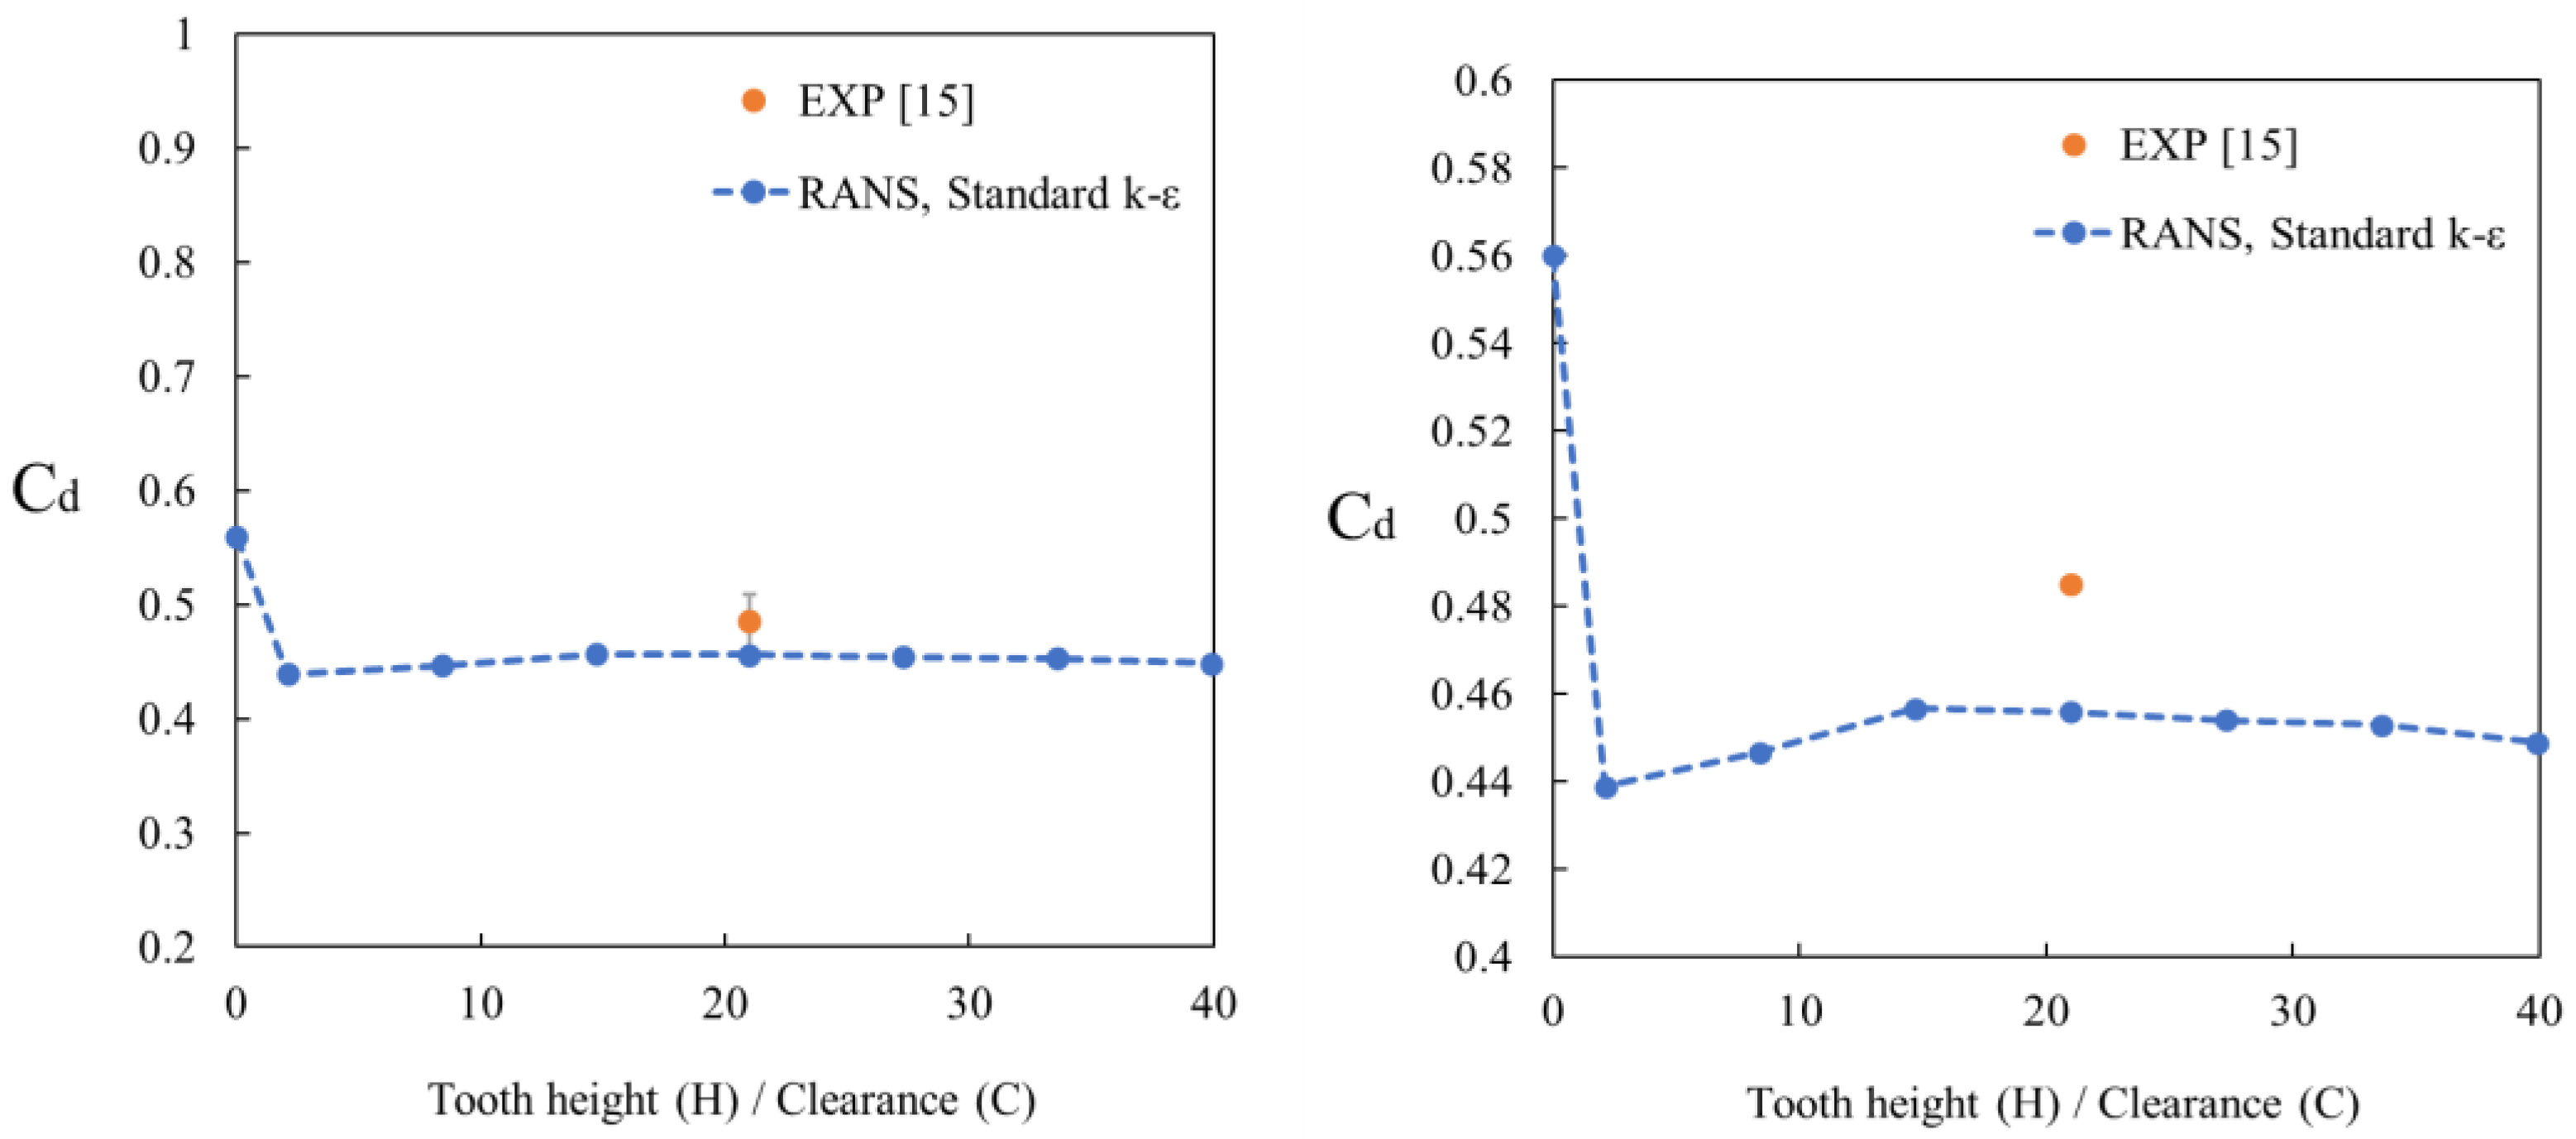
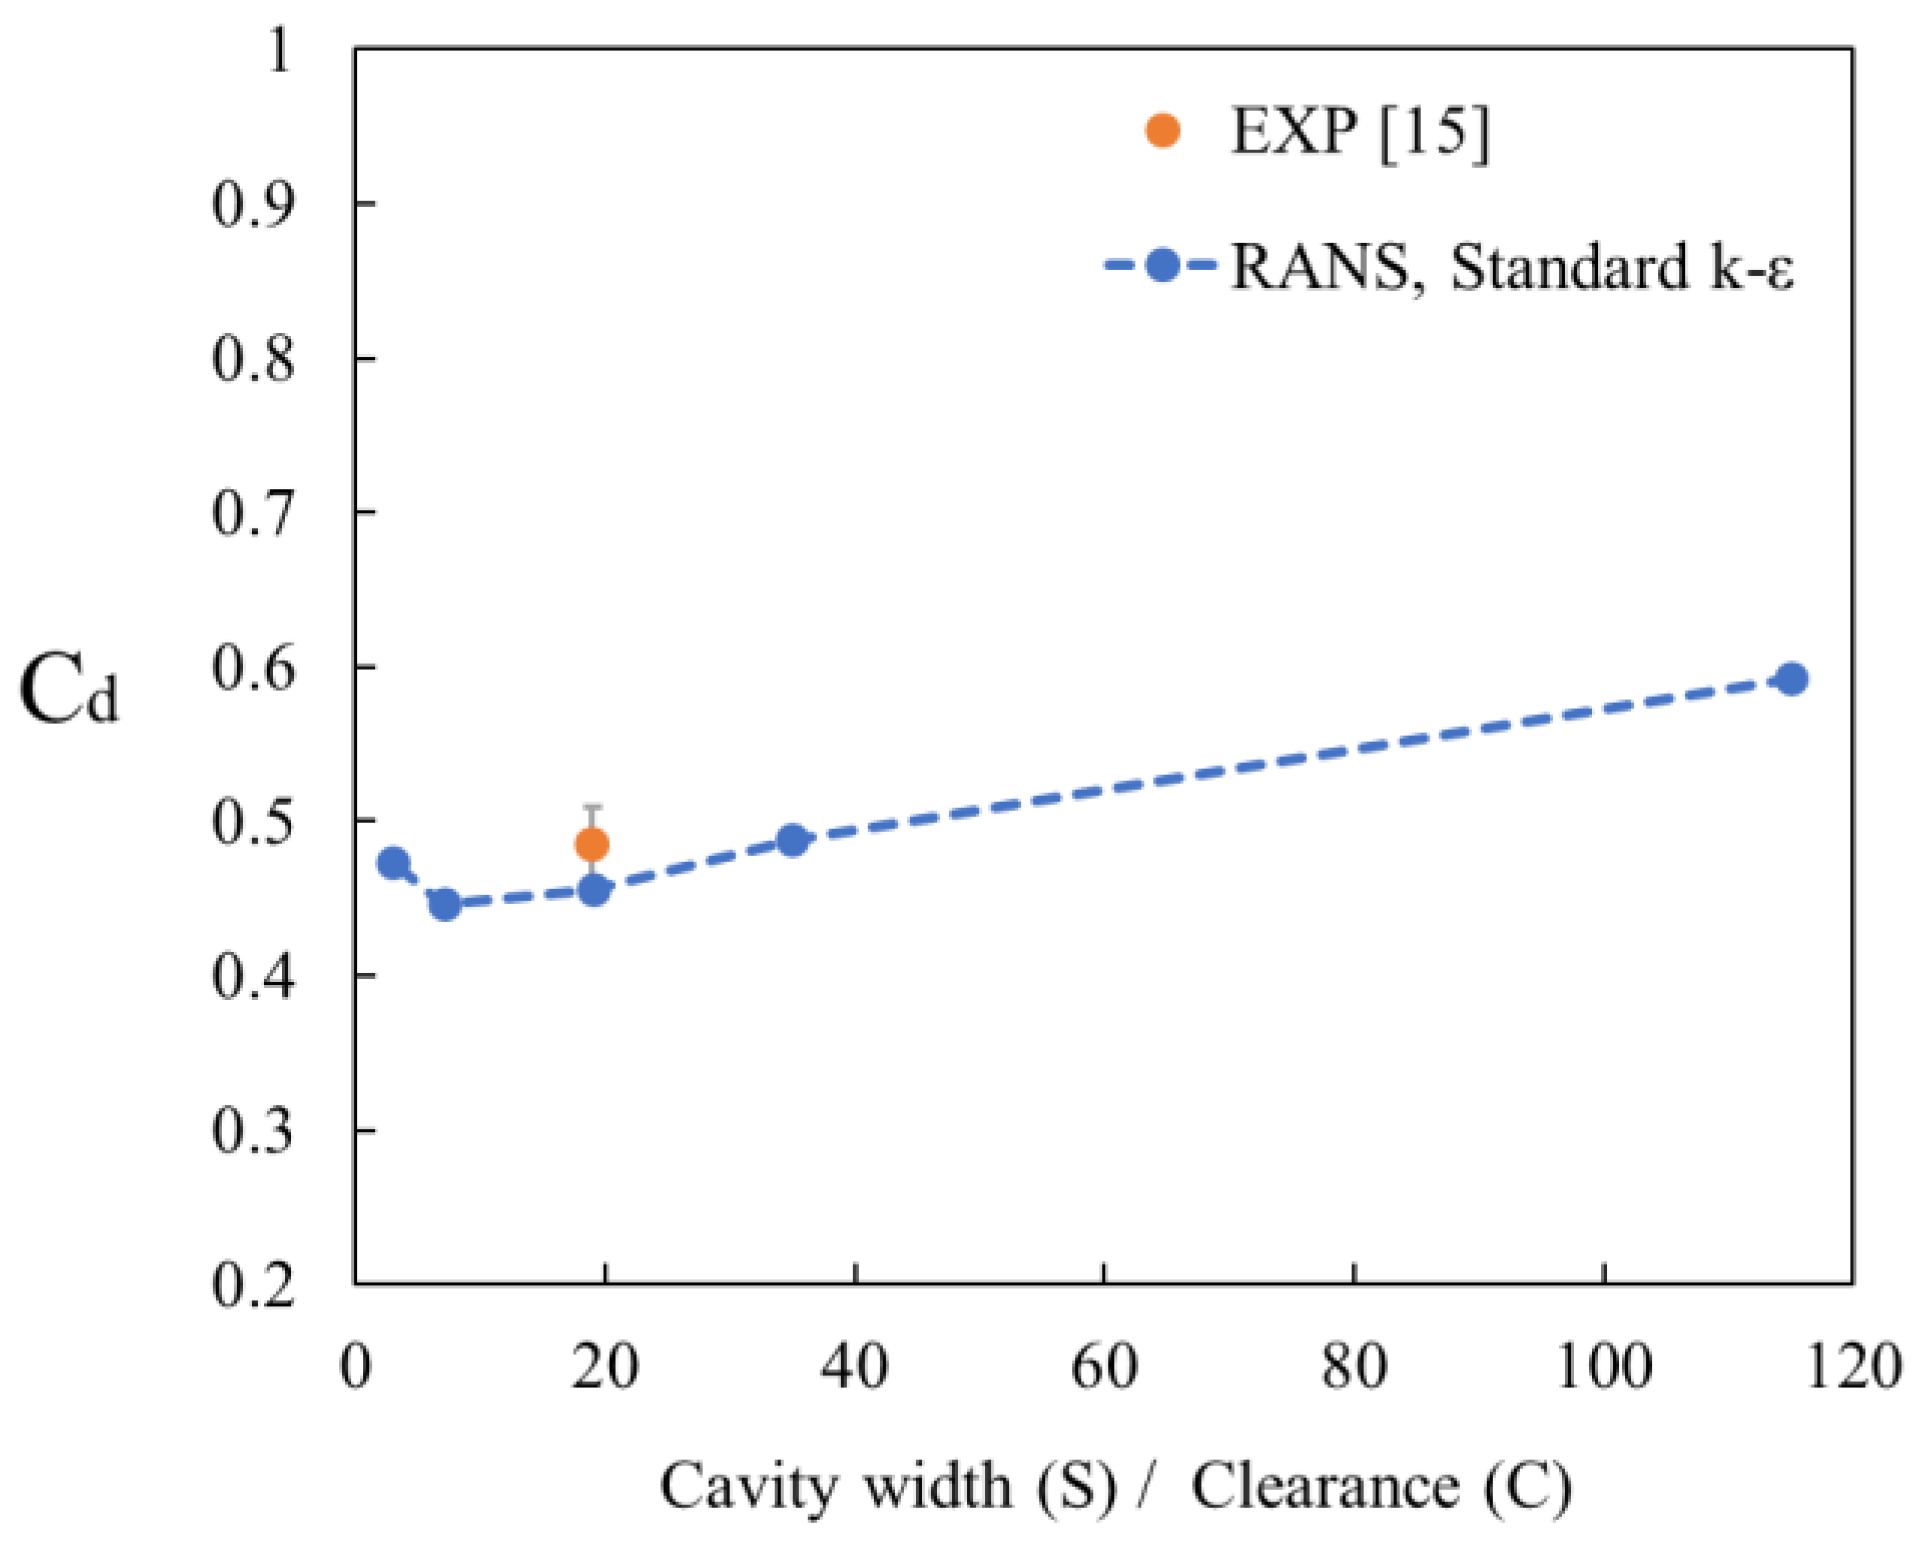
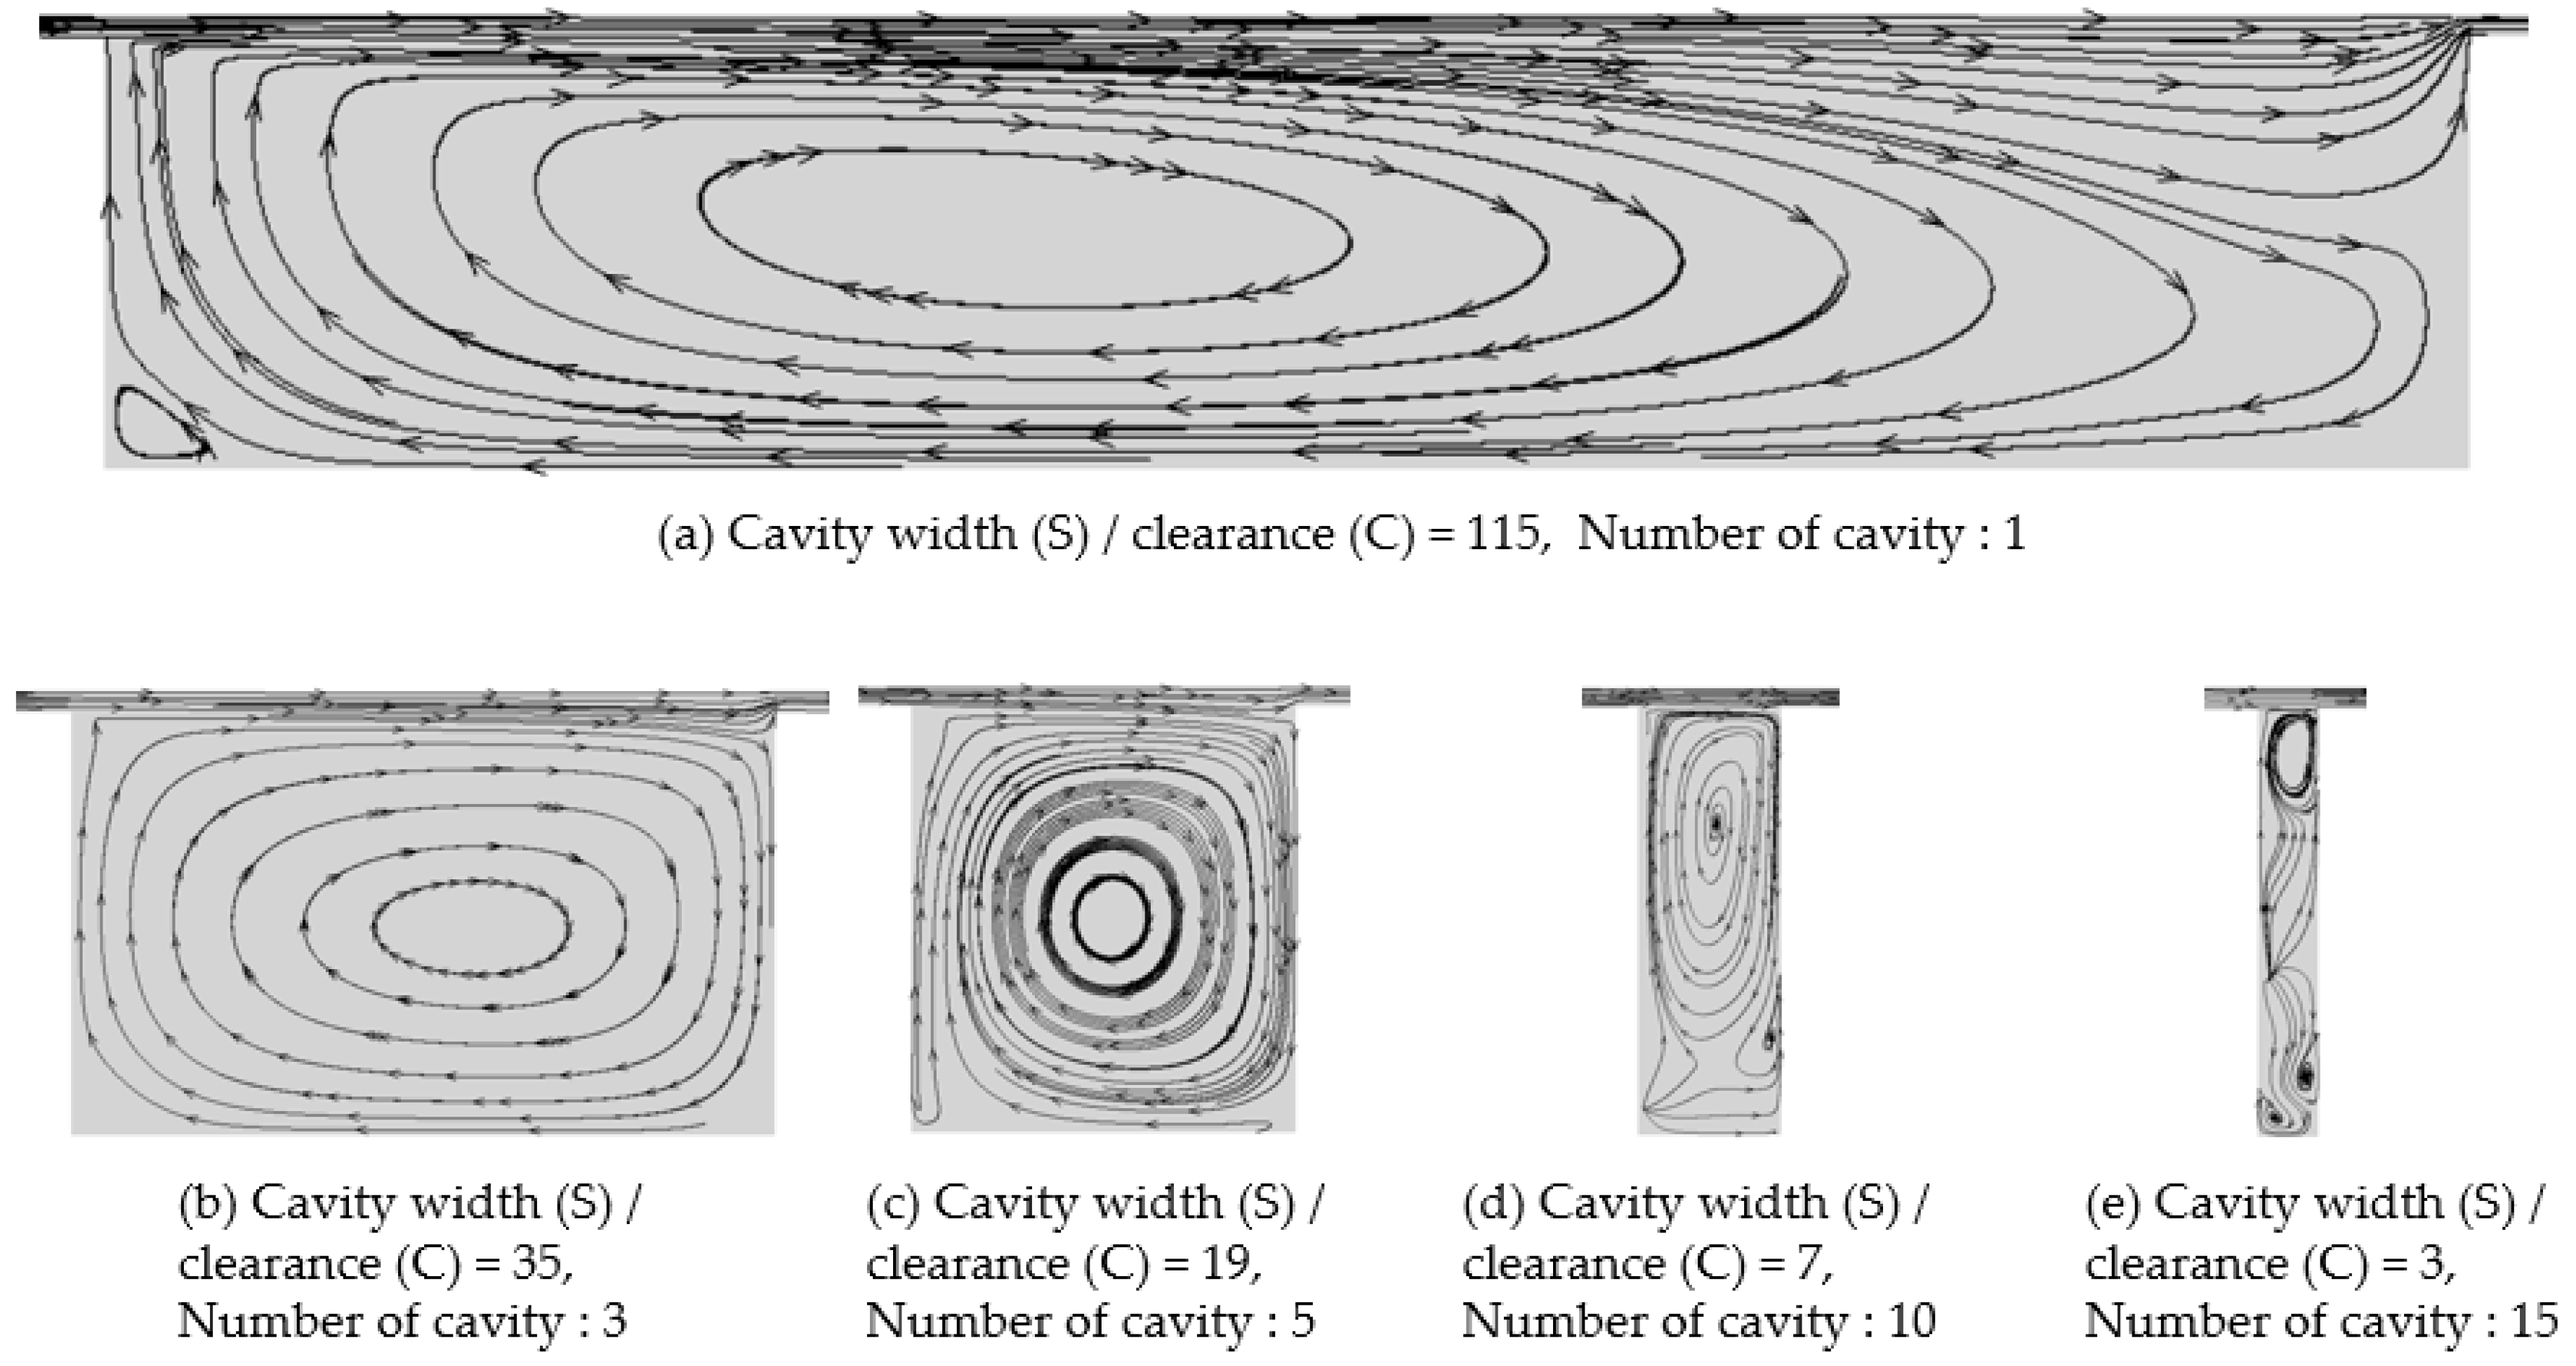
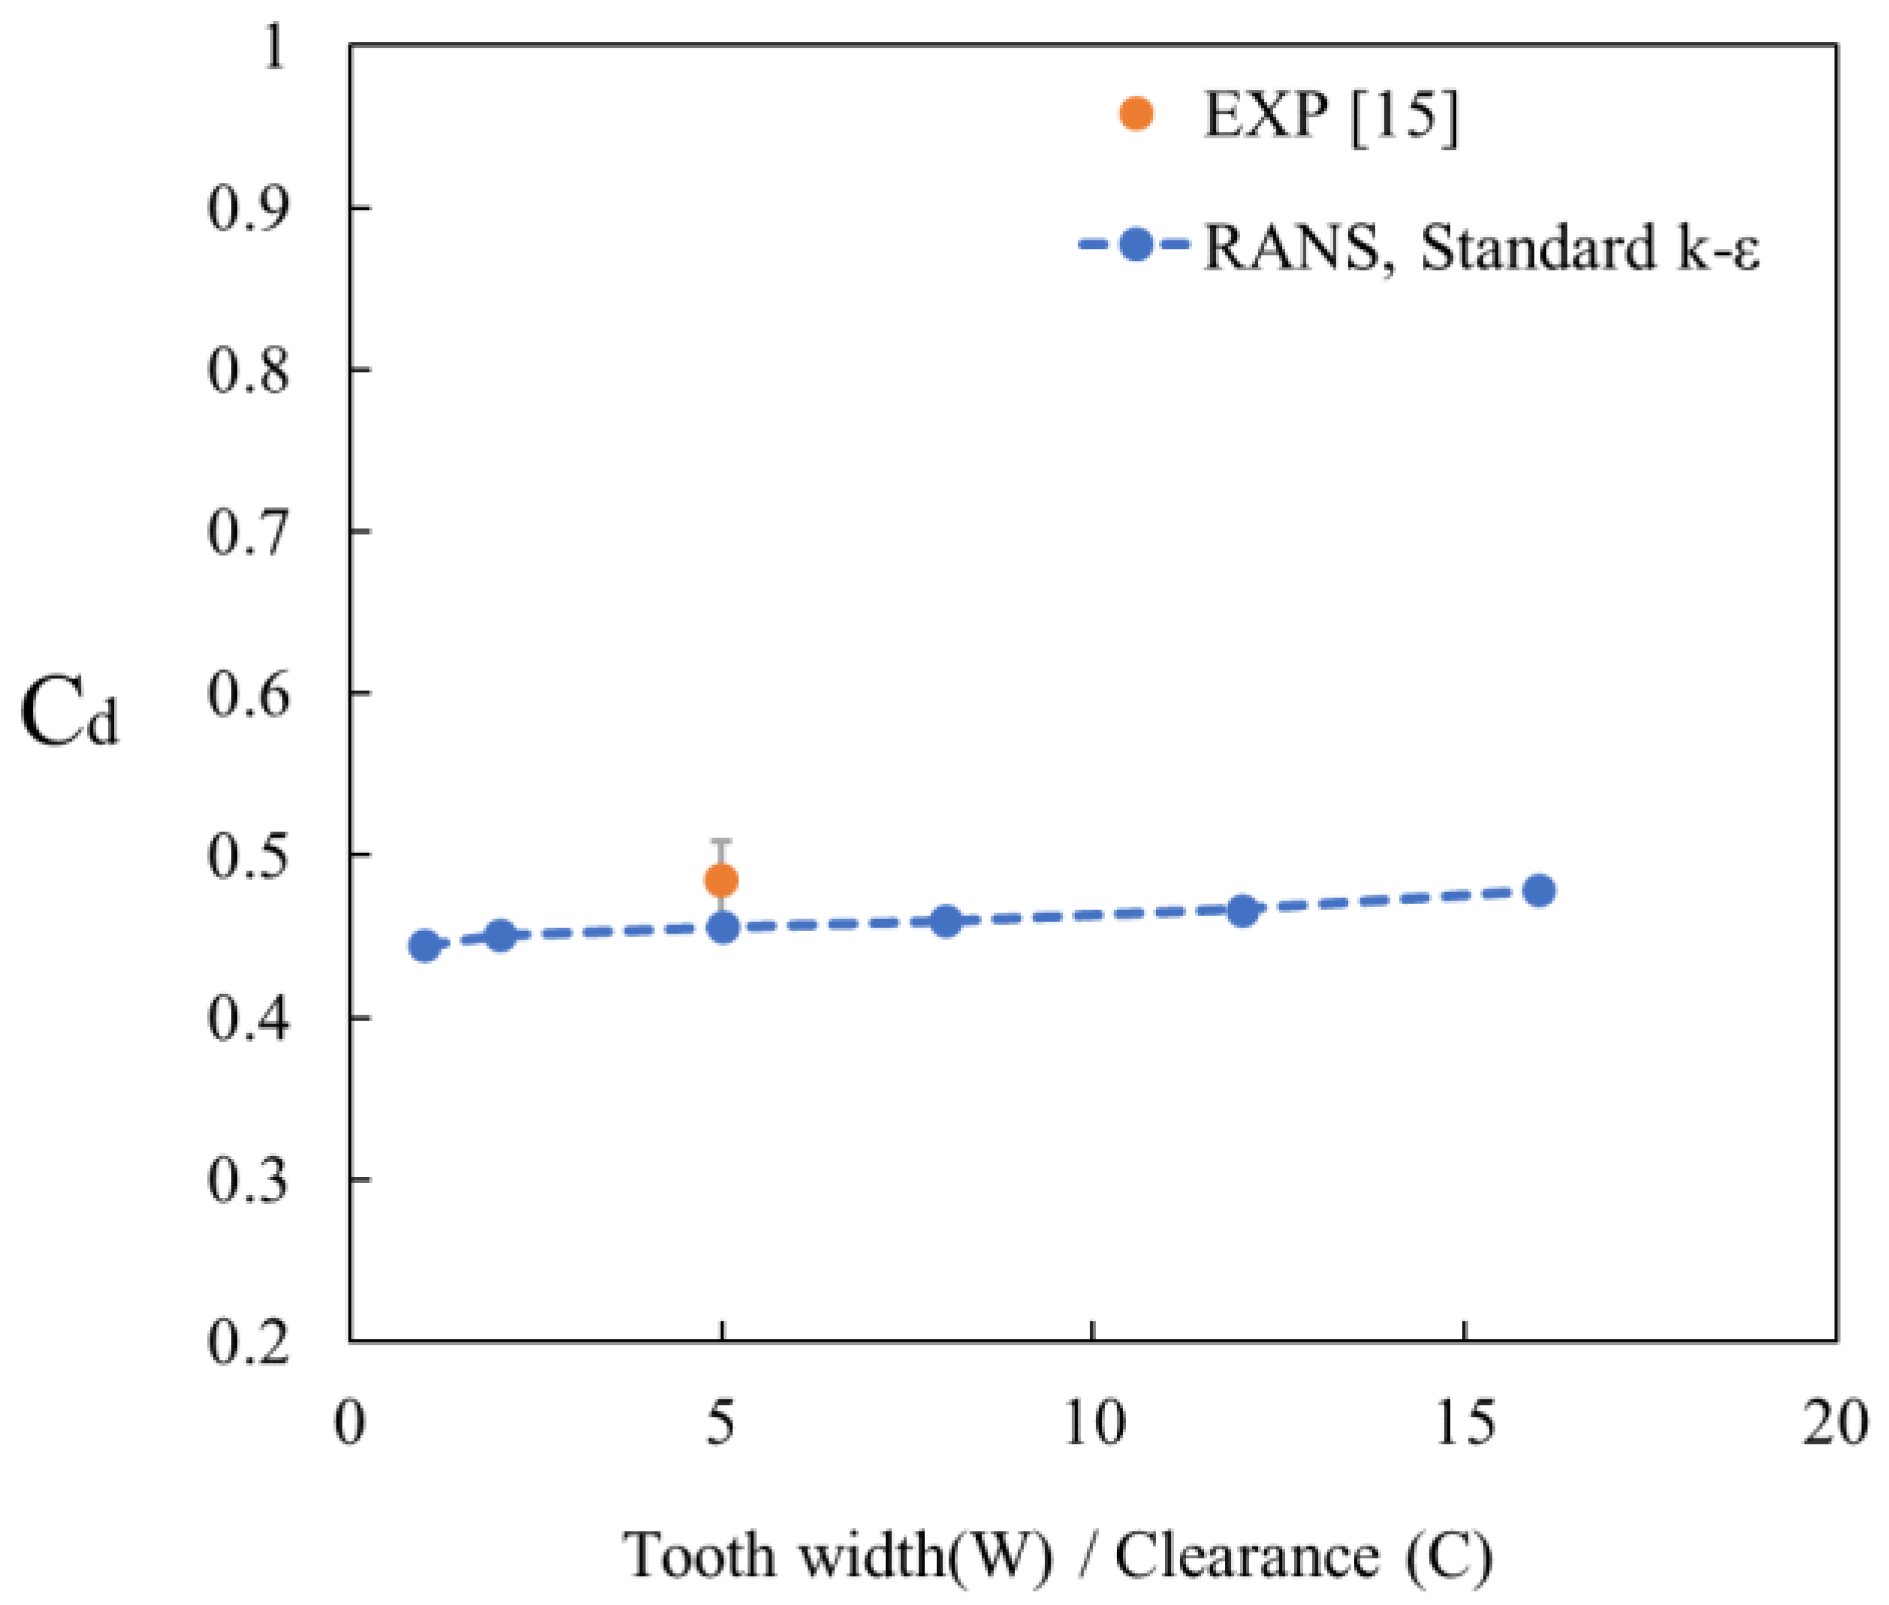
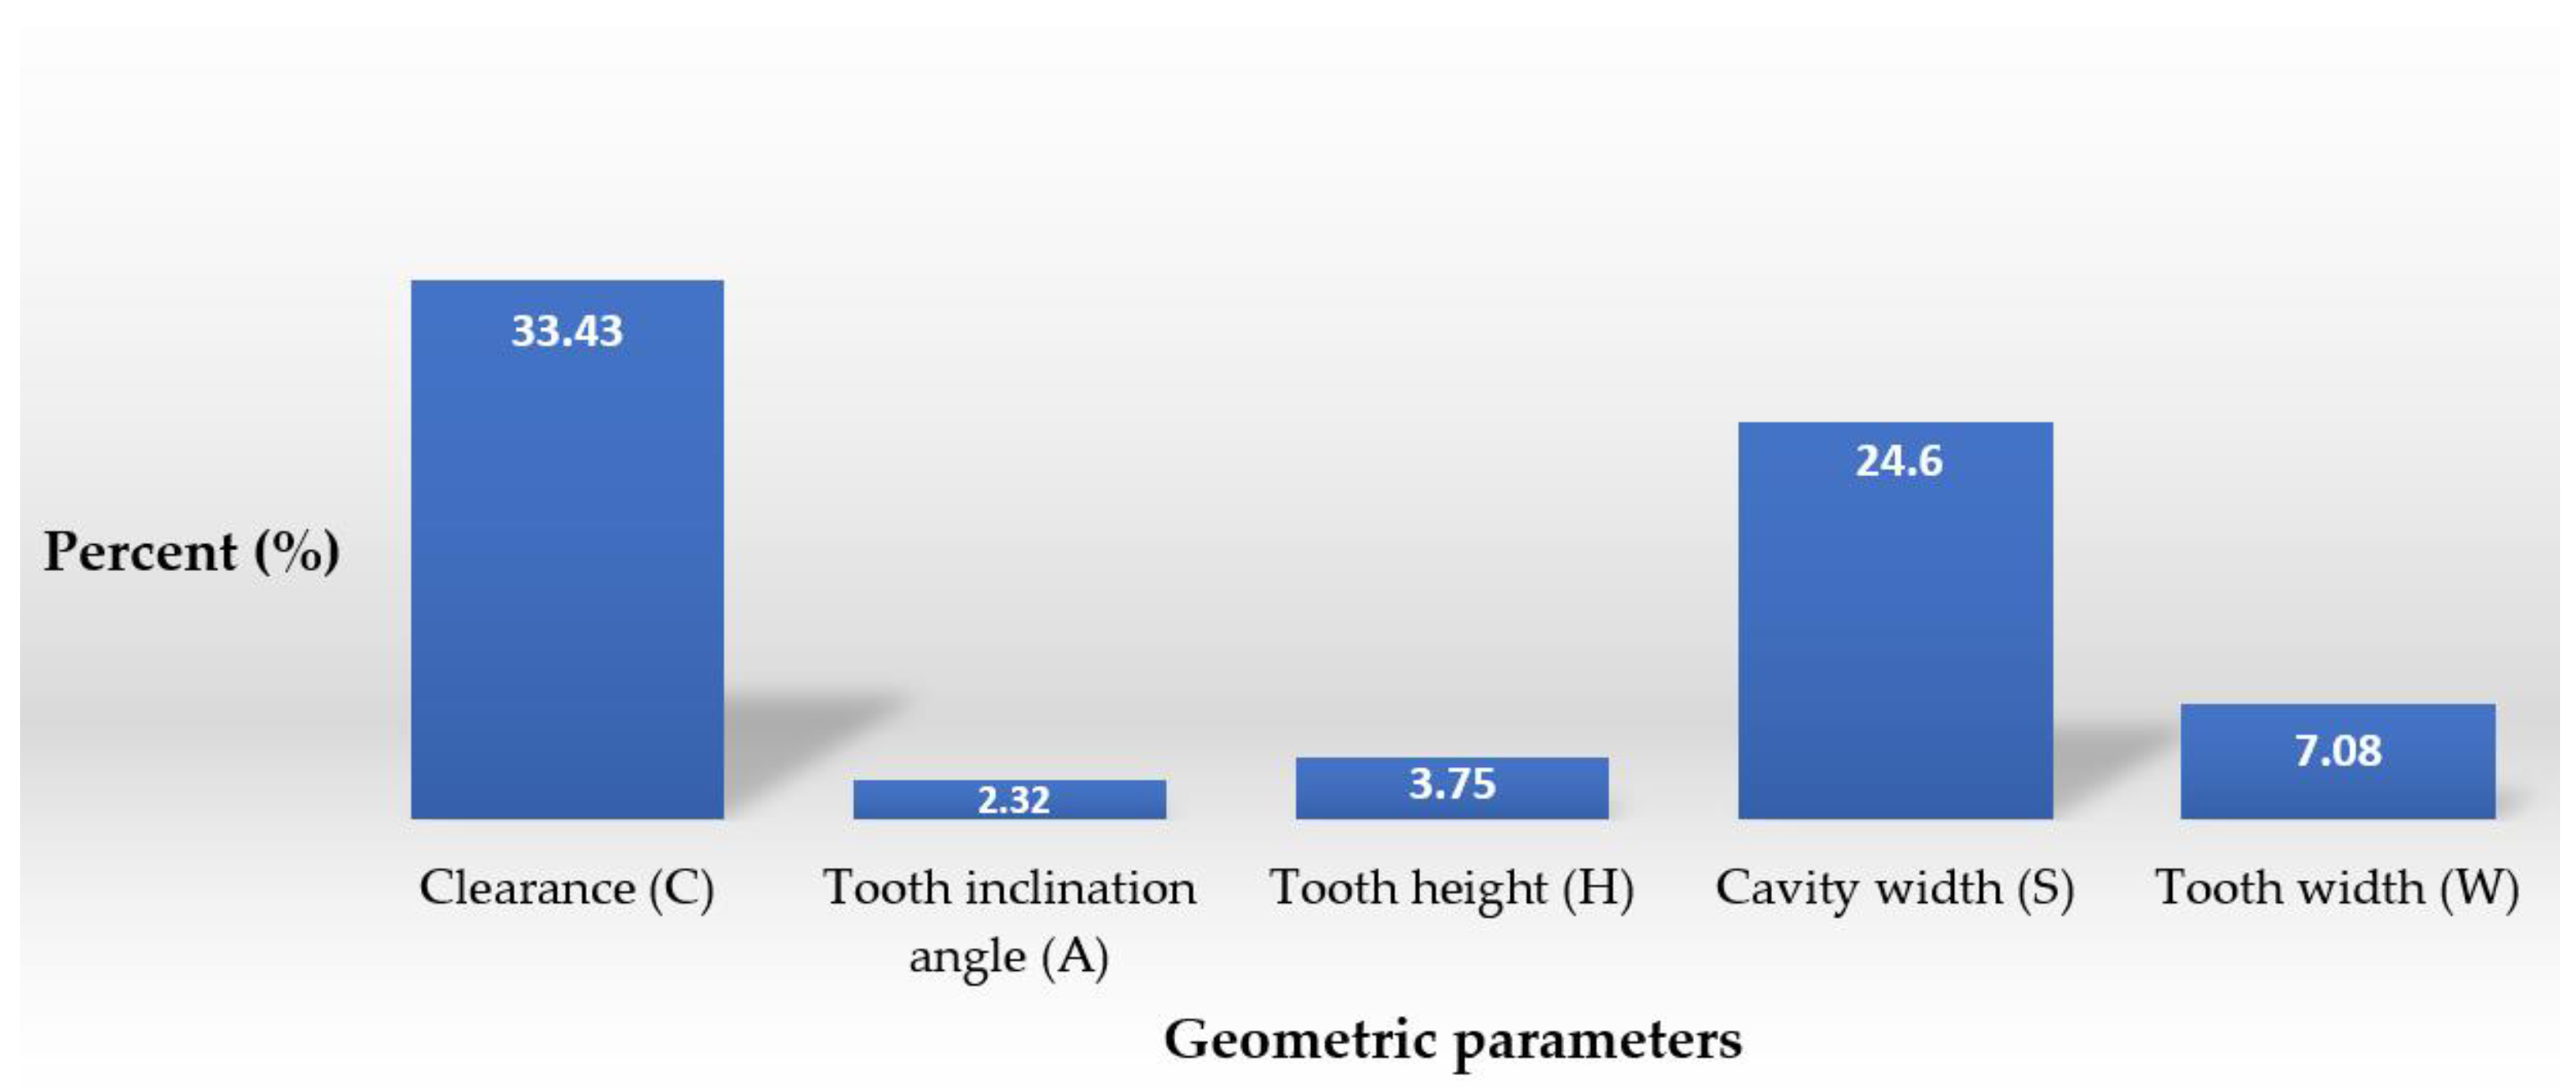
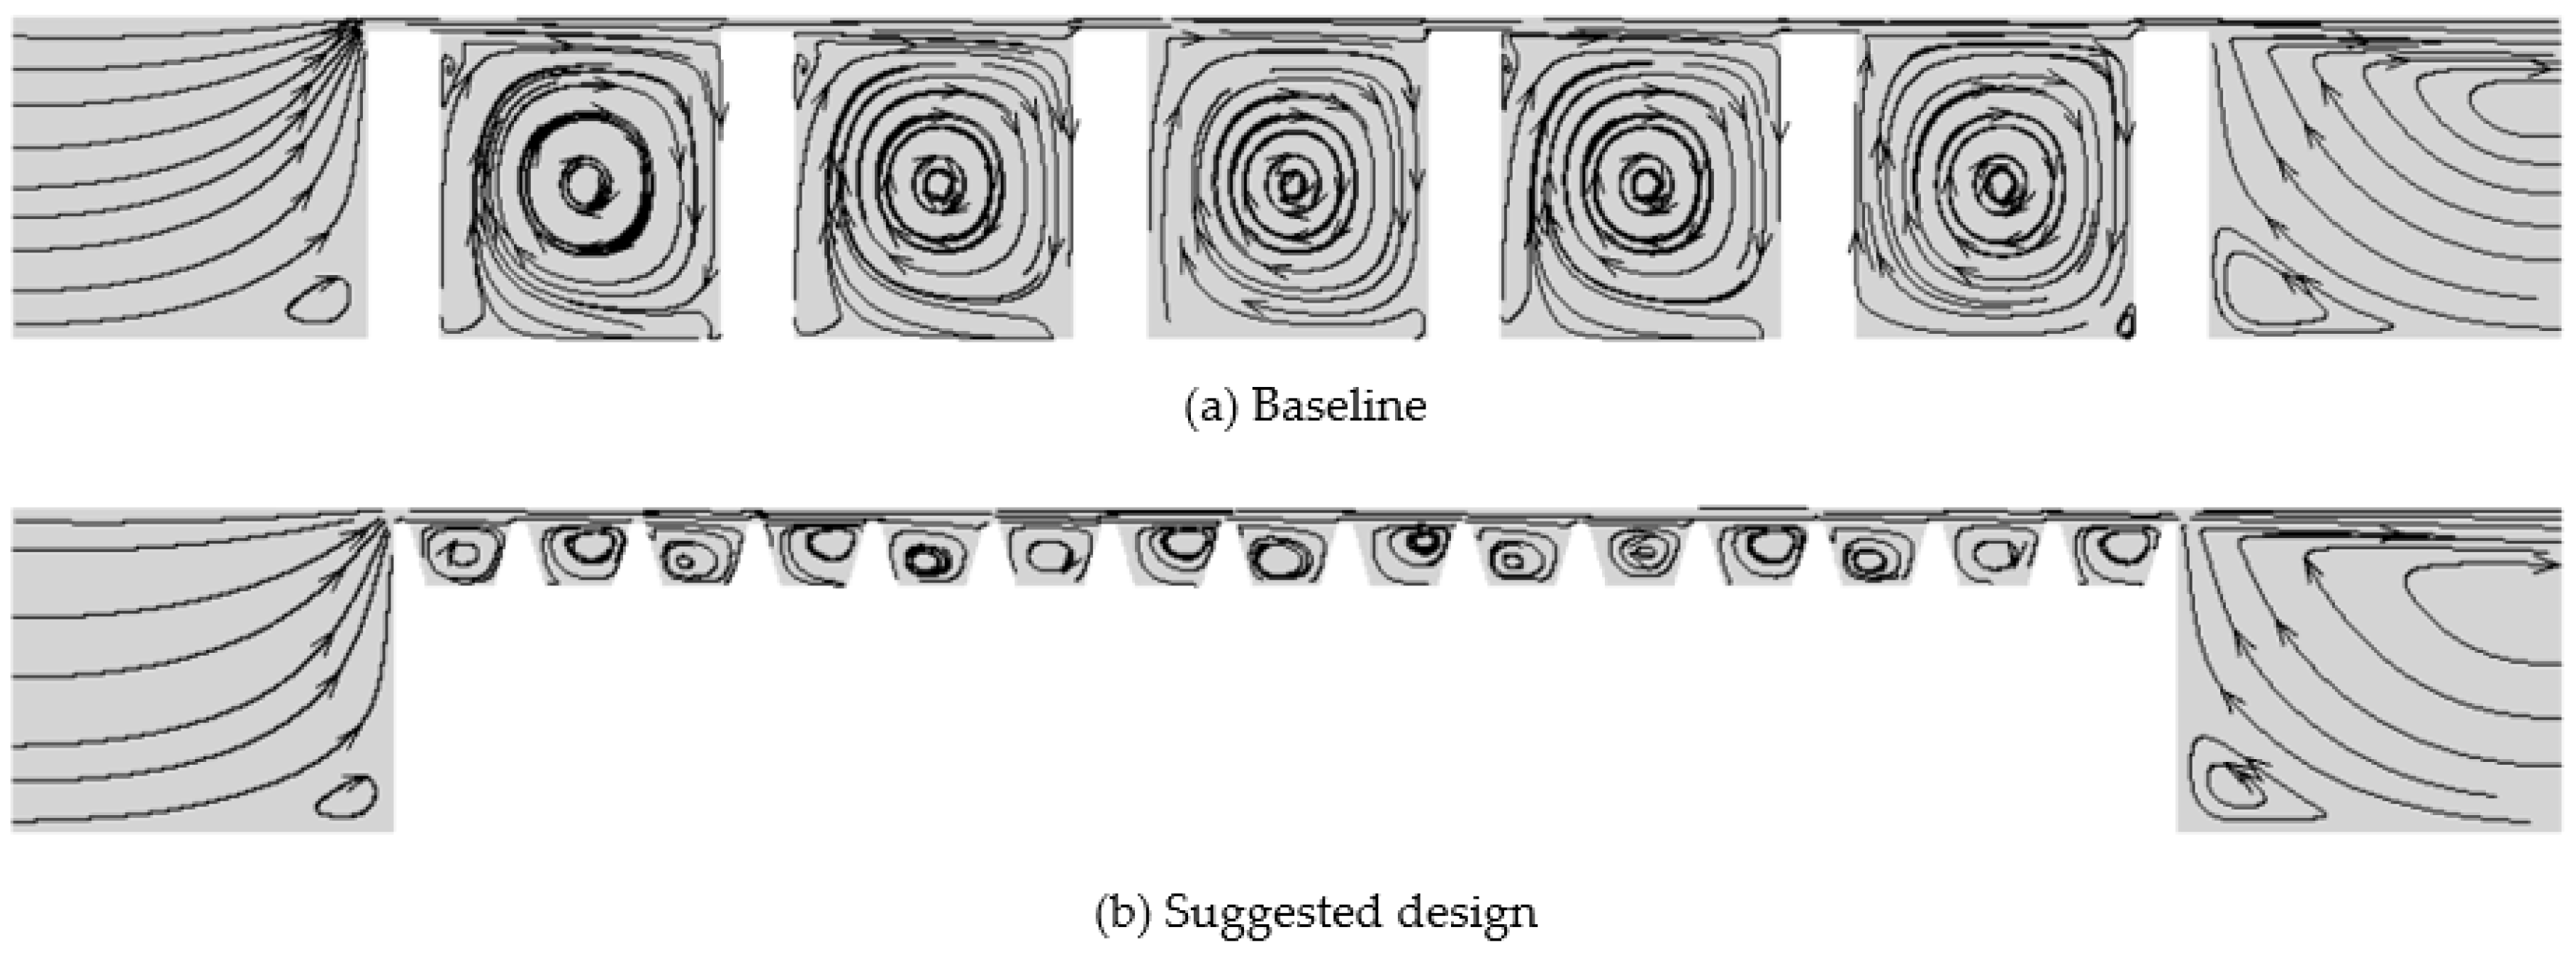
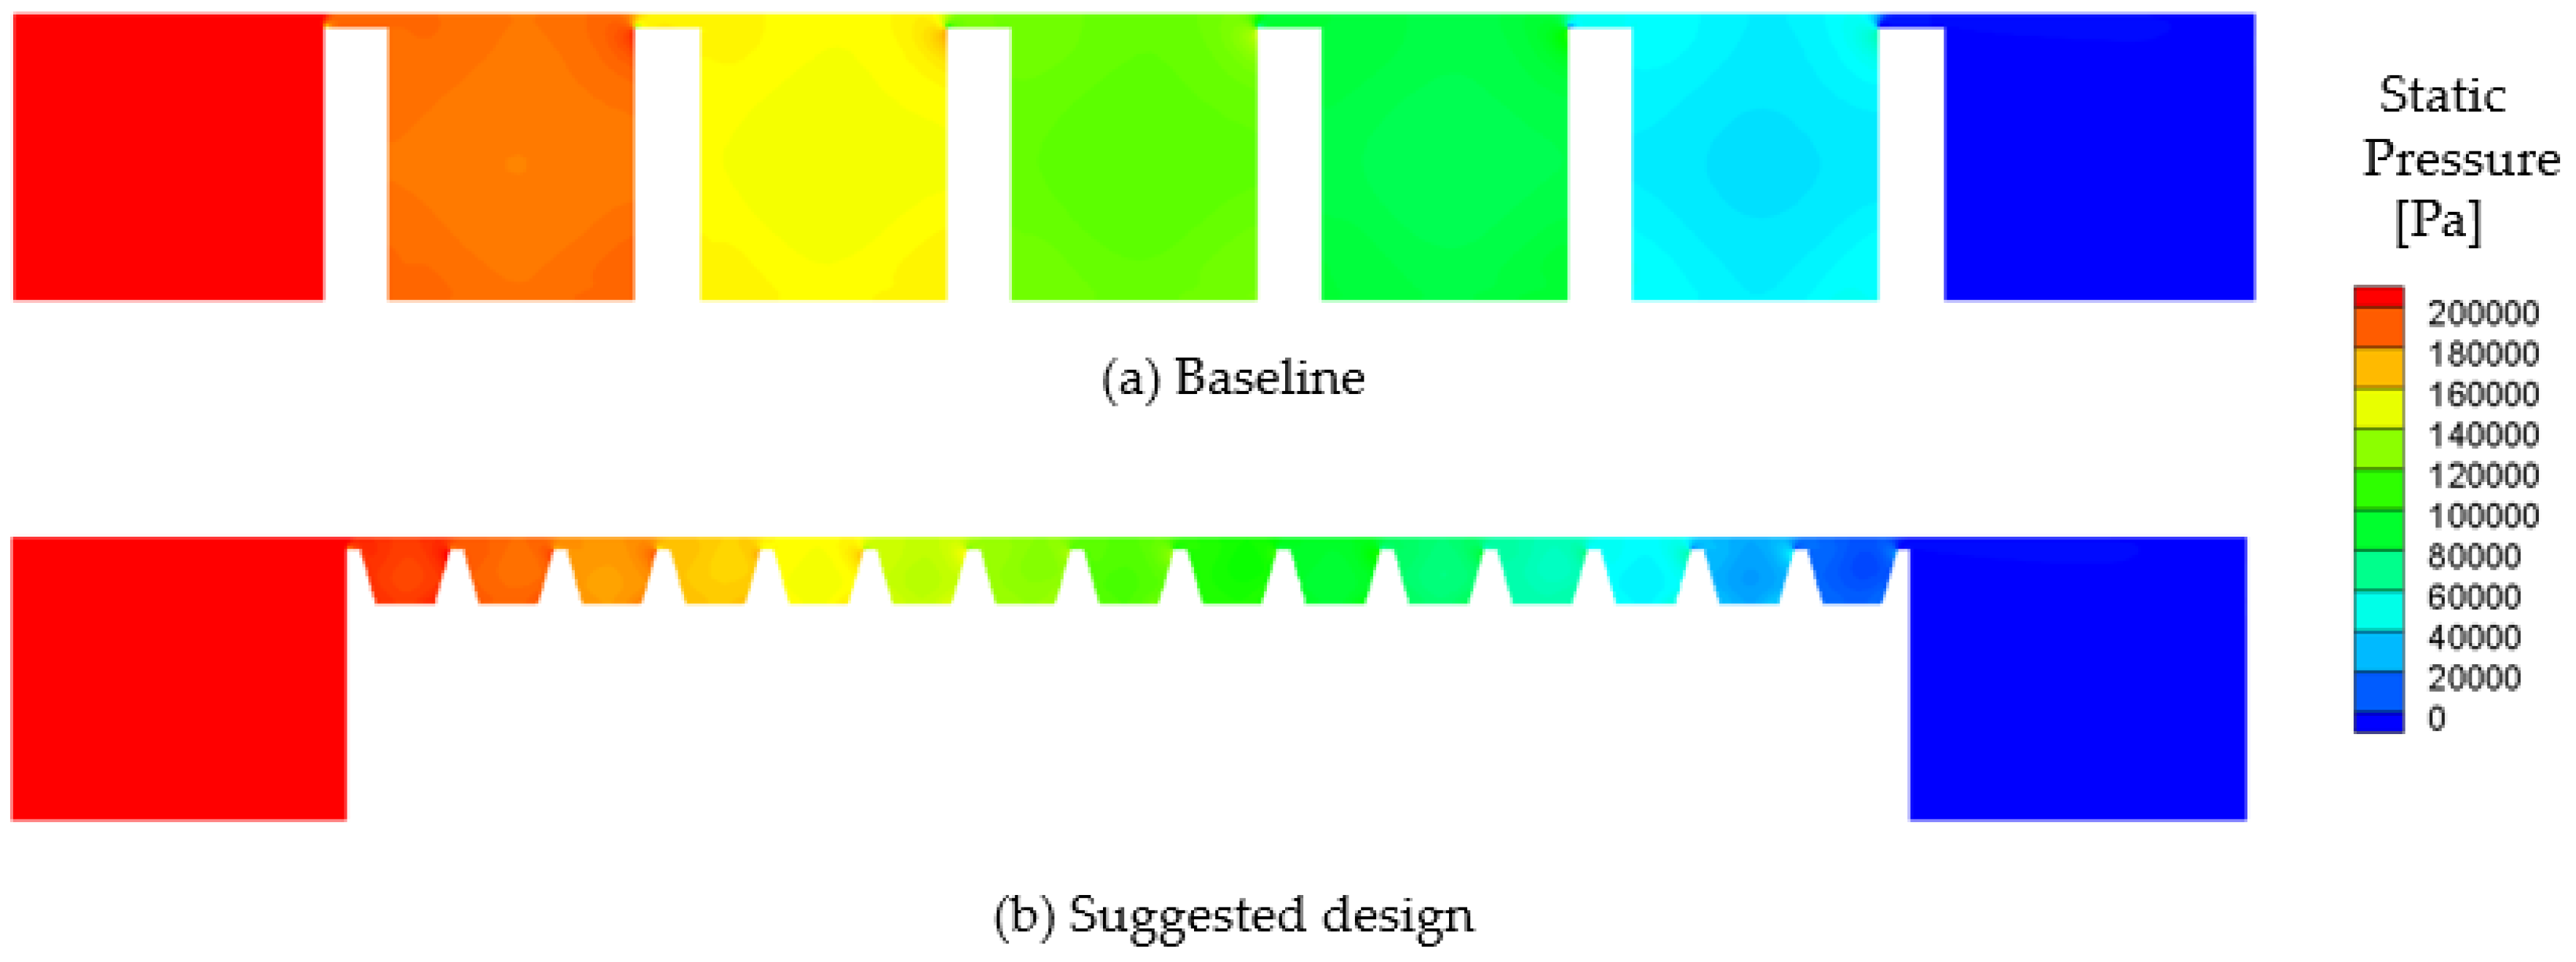
A straight-through labyrinth seal is one of the most popular non-contacting annular seals. Kinetic energy dissipation through the turbulence viscosity interaction is achieved by the labyrinth seal consisting of a series of teeth and cavities. The effects of changing several geometric parameters of the labyrinth seal on the discharge coefficient were investigated using CFD simulation and RANS models. As the space to install labyrinth seals in a gas turbine is limited, it is important to determine the optimal geometry of the seal per unit length so as to minimize the leakage flow rate and the discharge coefficient. First, the clearance should be kept as small as possible within the range to avoid any possible damage and for a good sealing performance. Decreasing the tooth inclination angle decreased the discharge coefficient slightly, but an angle exceeding 16° negatively affected the reduction in the discharge coefficient. Increasing the tooth height was not beneficial, but when it was small, there was a positive effect on decreasing the discharge coefficient. When the whole length was fixed, increasing the number of cavities was more useful for increasing the sealing capacity, as its effect on the discharge coefficient was stronger than when increasing the cavity width. In addition, when the whole axial length was fixed, increasing the number of cavities was more helpful to increase the sealing capacity than increasing the tooth width. The most effective parameter for decreasing the discharge coefficient was the clearance, whereas the second most effective parameter for improving the sealing performance was the cavity width. The third most effective parameter for decreasing the leakage flow rate was the tooth width. Changing the tooth inclination angle and the tooth height was not as effective decreasing the discharge coefficient and increasing the sealing performance. Based on our investigations, an example using the optimized geometry of the labyrinth seal with a fixed axial length is suggested. The discharge coefficient for the labyrinth seal with the suggested optimal design was lower by around 23%, 14%, and 12% under the pressure ratios of 1.1, 1.5, and 2, respectively.

Author Contributions

S.I.B. carried out the simulations, analyzed the CFD data, and helped to write the paper. J.A. supervised the research, analyzed the CFD data, and helped to write the paper. All authors have read and agreed to the published version of the manuscript.

Funding

This research was funded by the UAV High Efficiency Turbine Research Center Program of Defense Acquisition Program Administration and Agency for Defense Development in South Korea.

Institutional Review Board Statement

Not applicable.

Informed Consent Statement

Not applicable.

Data Availability Statement

Not applicable.

Acknowledgments

This work was supported by the UAV High Efficiency Turbine Research Center Program of Defense Acquisition Program Administration and Agency for Defense Development in South Korea.

Conflicts of Interest

The authors declare no conflict of interest.

Nomenclature

A c Cross-sectional area of the seal
Cd
Cp
k
Discharge coefficient = m ˙ / m i d ˙ = Real mass flow rate / Ideal mass flow rate
Specific heat of fluid
Turbulence
k
T o , i n
Isentropic coefficient
Temperature at the inlet
u
u’
P o u t
P o , i n
R
Flow velocity [m/s]
Root-mean-square of the turbulent velocity fluctuations (m/s)
Pressure at the outlet
Pressure at the inlet
Specific gas constant
PRPressure ratio
m i d ˙ m ˙ i d = P o , i n A c T o , i n 2 k R ( k 1 ) [ ( P o u t P o , i n ) 2 k ( P o u t P o , i n ) k + 1 k ]
xX-direction coordinate
yY-direction coordinate
zZ-direction coordinate
Greek symbols
βJet divergence angle
ρ
ν
Density (kg/m3)
Local kinematic viscosity (m2/s)
µLocal dynamic viscosity (m2/s)
ε
ω
Dissipation rate of turbulent kinetic energy
Specific dissipation rate of turbulent kinetic energy
Subscripts
idIdeal

References

  1. Sultanian, B.K. Gas Turbines Internal Flow Systems Modeling; Cambridge University Press: Cambridge, UK, 2018; p. 356. [Google Scholar]
  2. Ding, X.J.; Yang, Y.L.; Xiao, G.J.; Luo, M.W.; Li, Z.; Huang, S.H. Investigation of Flow and Leakage in Labyrinth Seal. J Fluid Mach. 2006, 34, 14–18. [Google Scholar]
  3. Zhang, W.; Zhang, Y.; Yang, J.; Li, C. Influence of tilting rotor on characteristics of fluid-induced vibration for labyrinth seals. J. Vibroeng. 2016, 18, 5416–5431. [Google Scholar] [CrossRef]
  4. Gamal, A.J.M.; Vance, J.M. Labyrinth Seal Leakage Tests: Tooth Profile, Tooth Thickness, and Eccentricity Effects. J. Eng. Gas Turbines Power 2008, 130, 012510. [Google Scholar] [CrossRef]
  5. EI-Gamal, H.A.; Awad, T.H.; Saber, E. Leakage from Labyrinth Seals under Stationary and Rotating Conditions. Tribol. Int. 1996, 29, 291–297. [Google Scholar] [CrossRef]
  6. Becker, E. Strömungsvorgänge in Ringformigen Spalten (Labyrinth-Dichtungen). Ver. Deut. Ing. 1907, 51, 1133–1141. [Google Scholar]
  7. Martin, H.M. The Labyrinth Packings. Engineer 1908, 85, 35–36. [Google Scholar]
  8. Stodola, A. Steam and Gas Turbines, 6th ed.; McGraw-Hill: New York, NY, USA, 1927; pp. 189–194. [Google Scholar]
  9. Egli, A. The Leakage of Steam Through Labyrinth Seals. Trans. ASME 1935, 57, 115–122. [Google Scholar]
  10. Dollin, F.; Brown, W.S. Flow of Fluids Through Openings in Series. Engineer 1937, 164, 223–224. [Google Scholar]
  11. Hodkinson, B. Estimation of the Leakage Through a Labyrinth Gland. Proc. Inst. Mech. Eng. 1939, 141, 283–288. [Google Scholar] [CrossRef]
  12. Jeri, J. Flow Through Straight-Through Labyrinth Seals. Proc. Seventh Int. Cong. Appl. Mech. 1948, 2, 70–82. [Google Scholar]
  13. Bell, K.J.; Bergelin, O.P. Flow through Annular Orifices. Trans. ASME 1957, 79, 593–601. [Google Scholar]
  14. Vermes, G. A Fluid Mechanics Approach to the Labyrinth Seal Leakage Problem. J. Eng. Power 1961, 83, 161–169. [Google Scholar] [CrossRef]
  15. Wittig, S.; Schelling, U.; Kim, S.; Jacobsen, K. Numerical Predictions and Measurements of Discharge Coefficients in Labyrinth Seals. In Proceedings of ASME 1987 International Gas Turbine Conference and Exhibition; Anaheim, CA, USA, 31 May–4 June 1987.
  16. Suryanarayanan, S. Labyrinth Seal Leakage Equation. Master’s Thesis, Texas A&M University, College Station, TX, USA, 2008. [Google Scholar]
  17. Zhao, W.; Nielsen, T.K.; Billdal, J.T. Effects of Cavity on Leakage Loss in Straight-Through Labyrinth Seals. In Proceedings of the 25th IAHR Symposium on Hydraulic Machinery and Systems; Timişoara, Romania, 20–24 September 2010, IOP Publishing Ltd.: Bristol, UK, 2010; Volume 12, p. 012002. [Google Scholar]
  18. ANSYS Fluent Theory Guide Version 19. Available online: https://www.ansys.com/products/fluids/ansys-fluent (accessed on 14 December 2020).
  19. Pointwise Version 18. Available online: http://www.pointwise.com/ (accessed on 14 December 2020).
  20. Cengel, Y.A.; Cimbala, J.M. Fluid Mechanics: Fundamentals and Applications, 3rd ed.; McGraw Hill Education: Uttar Pradesh, India, 2014. [Google Scholar]
  21. Cebeci, T.; Shao, J.P.; Kafyeke, F.; Laurendeau, E. Computational Fluid Dynamics for Engineers; Springer: Heidelberg, Germany, 2005; p. 396. [Google Scholar]
  22. Tecplot 360. Available online: https://www.tecplot.com/products/tecplot-360/ (accessed on 14 December 2020).
Figure 1. Schematic of a cross-sectional area of a straight-through labyrinth seal.
Energies 14 00705 g001
Figure 2. Geometrical parameters of a straight-through labyrinth seal.
Energies 14 00705 g002
Figure 3. The divergence angle of the jet.
Energies 14 00705 g003
Figure 4. Baseline mesh of the labyrinth seal (a) whole shape of the mesh, (b) enlarged part of the mesh, and (c) cross-sectional view of the mesh.
Energies 14 00705 g004
Figure 5. Grid sensitivity test of the Reynolds-Averaged Navier–Stokes (RANS) calculation for the effect of the pressure ratio on the discharge coefficient of the baseline labyrinth seal.
Energies 14 00705 g005
Figure 6. Effect of pressure ratio on the discharge coefficient of the baseline labyrinth seal. Cd—discharge coefficient.
Energies 14 00705 g006
Figure 7. Pressure distribution in the labyrinth seal for a pressure ratio of 1.38. Fin number refers to the number assigned to six fins in the baseline labyrinth seal.
Energies 14 00705 g007
Figure 8. Effect of changing the clearance on the discharge coefficient of the labyrinth seal. Cd—discharge coefficient.
Energies 14 00705 g008
Figure 9. (ac) The effect of changing the clearance (C) on the streamlines of the labyrinth seal under a pressure ratio of 2.
Energies 14 00705 g009
Figure 10. The effect of varying the tooth inclination angle on the discharge coefficient of the labyrinth seal under a pressure ratio of 2. The y-axis units on the right-hand side plot have been expanded. Cd—discharge coefficient.
Energies 14 00705 g010
Figure 11. (af) The effect of varying the tooth inclination angle (A) on the streamlines of the labyrinth seal under a pressure ratio of 2.
Energies 14 00705 g011
Figure 12. Effect of changing the ratio of the tooth height to the clearance (H/C) on the discharge coefficient of the labyrinth seal under a pressure ratio of 2. The x-axis units on the right-hand side plot have been expanded. Cd—diffusion coefficient.
Energies 14 00705 g012
Figure 13. (ah) The effect of changing the ratio of the tooth height to the clearance (H/C) on the streamlines of a straight-through labyrinth seal.
Energies 14 00705 g013
Figure 14. The effect of the cavity width of the clearance (S/C) ratio on the discharge coefficient of a straight-through labyrinth seal under a pressure ratio of 2 when the whole axial length is fixed.
Energies 14 00705 g014
Figure 15. (ae) The effect of the cavity width to the clearance (S/C) ratio on the discharge coefficient of a straight-through labyrinth seal under a pressure ratio of 2 when the whole axial length is fixed.
Energies 14 00705 g015
Figure 16. The effect of varying the tooth width to clearance (W/C) ratio on the streamlines of a straight-through labyrinth seal under a pressure ratio of 2 when the whole axial length was fixed.
Energies 14 00705 g016
Figure 17. (af) The effect of changing the tooth width to clearance (W/C) ratio on the streamlines of a straight-through labyrinth seal.
Energies 14 00705 g017
Figure 18. Sensitivity analysis of the geometric parameters for decreasing the discharge coefficient.
Energies 14 00705 g018
Figure 19. Streamlines of the labyrinth seal under a pressure ratio of 2 for (a) baseline and the (b) suggested design.
Energies 14 00705 g019
Figure 20. Contours of the static pressure in the labyrinth seal under a pressure ratio of 2 for (a) baseline and the (b) suggested design.
Energies 14 00705 g020
Table 1. Boundary conditions of the computational fluid dynamic (CFD) domain.
SurfaceBoundary Condition
InletPressure inlet
OutletPressure outlet
StatorWall
RotorWall (no rotation)
Table 2. Specifications of mesh arrangements in the grid sensitivity test.
GridNumber of Cells in the r DirectionNumber of Cells in the θ DirectionNumber of Cells in the z DirectionTotal Cells Number
First701005903,245,000
Second901206605,456,400
Third1101307307,967,700
Fourth1151357659,134,100
Fifth12014080010,413,200
Table 3. Jet divergence angles for several clearances.
Clearance (mm)Jet Divergence Angle (°)
0.51.66689
1.01.47669
2.50.90164
Table 4. Jet divergence angles for several tooth inclination angles.
Tooth Inclination Angle (°)Jet Divergence Angle (°)
01.66689
42.05151
82.16896
122.62472
162.80864
202.77528
Table 5. The baseline and suggested optimal geometrical parameters.
Clearance (mm)Tooth Inclination Angle (°)Tooth Height (mm)Cavity Width (mm)Tooth Width (mm)Number of Cavities
Baseline0.5010.59.52.55
Suggested geometry0.5162.13.50.515
Table 6. Jet divergence angle and discharge coefficients for the baseline and suggested optimal geometry for a labyrinth seal under pressure ratios of 1.1, 1.5, and 2.
Pressure RatioJet Divergence Angle (°)Discharge Coefficient
BaselineSuggested GeometryBaselineSuggested Geometry
1.12.146593.088460.37730.2904
1.51.829682.391750.41660.3593
21.666892.031370.4540.39978
Publisher’s Note: MDPI stays neutral with regard to jurisdictional claims in published maps and institutional affiliations.

