Article

Building Energy Performance Analysis after Changing Its Form of Use from an Office to a Residential Building

by
Przemysław Markiewicz-Zahorski
1,
Joanna Rucińska
2,
Małgorzata Fedorczak-Cisak
3,* and
Michał Zielina
4,*
1
Faculty of Architecture, Cracow University of Technology, 24 Warszawska Street, 31-155 Kraków, Poland
2
Division of Air Conditioning and Heating, Faculty of Building Services, Hydro and Environmental Engineering, Warsaw University of Technology, Nowowiejska 20, 00-653 Warsaw, Poland
3
Faculty of Civil Engineering, Cracow University of Technology, 24 Warszawska Street, 31-155 Kraków, Poland
4
Faculty of Environmental Engineering and Energy, Cracow University of Technology, 24 Warszawska Street, 31-155 Kraków, Poland
*
Authors to whom correspondence should be addressed.
Energies 2021, 14(3), 564; https://doi.org/10.3390/en14030564
Submission received: 20 December 2020 / Revised: 8 January 2021 / Accepted: 17 January 2021 / Published: 22 January 2021

Abstract

:
Lowering energy consumption is one of the most important challenges of the modern world. Since the construction sector accounts for 40% of total energy consumption worldwide, the Parliament of the European Union has developed a Directive, according to which all newly designed and thermally upgraded buildings should meet the requirements of almost zero energy demand (nZEBs) from 1 January 2021. At the same time, in Poland, but also in many other countries in the world, there is a growing oversupply of office space in large cities with a simultaneous increase in demand for apartments, which is caused, among other things, by the increase in the share of remote work and the COVID-19 pandemic. Consequently, this is forcing owners to change the use of buildings from office to residential. This article analyses the possibilities of changing the function of an office building to a multi-family residential building. For both functional solutions, a comparative energy analysis was carried out, taking into account different work schedules and the requirements for new buildings with zero energy demand. The analyses have shown that changing the form of use of an office building to a multi-family building without significant financial and technical costs is possible. On the other hand, the reverse change of the form of use is much more difficult and, in many cases, practically impossible. Due to the fact that many offices are now multinational corporations, this issue is global.

Graphical Abstract

1. Introduction

One of the major ideas followed by states around the world is sustainable development [1]. According to the 2030 Agenda for Sustainable Development, adopted by all United Nations Member States in 2015, among 17 sustainable development goals, there are lowering energy consumption, decreasing greenhouse gas emissions and achieving energy independence, while improving quality of life. It is not possible to achieve these goals without using renewable energy sources (RES) [2] and increasing energy performance in construction and transport, i.e., sectors with the highest energy consumption indicators. The growing demand for energy on the one hand, and the need to limit energy supplied to buildings on the other, lead to a global demand for energy-efficient buildings. This requires the smart design of these buildings so as to ensure the energy performance demanded by clients [3,4]. Over their entire life cycle, buildings consume around 80% of energy over the course of their occupancy [5]. The European Energy Performance of Buildings directives 2002/91/EC [6], 31/2010/EU [7] and 2018/844/EU [8] formulate energy goals to be achieved by Europe with increasing precision and rigour. At the same time, domestic legislative and executive regulations are being amended to implement the provisions of these directives. Directive 31/2010/UE introduced a new “near-zero energy building” standard—it “means a building that has a very high energy performance. The nearly zero or very low amount of energy required should be covered to a very significant extent by energy from renewable sources, including energy from renewable sources produced on-site or nearby”.
The EU Directive on the Energy Performance of Buildings [7] obligates Member States to change requirements so that all new buildings would be nearly zero-energy buildings by 31 December 2020. Every European Union Member State must introduce its own definition of a building with near-zero energy consumption [9]. No codified international regulations are offered in this respect. On 1 January 2014, the Ordinance of the Minister of Infrastructure concerning the technical conditions to be met by buildings and their placement (hereinafter referred to as the Polish building code) [10], which defines the applicable standards for architectural and construction solutions applied in Poland, saw major changes intended to lower the energy required to cover buildings’ need for heating. The regulations were worded in a manner that tightens provisions in three stages. The first increase in requirements took place in January 2014, the following entered into force in January 2016, and the final shall become effective in January 2021. The final requirement threshold shall correspond to the Polish definition of near-zero energy buildings.
  • Requirements Placed before nZEBs
As stipulated in the Directive, the near-zero energy building (nZEB) standard is already in force in specific cases and shall apply to all newly built buildings and those subjected to thermal refurbishment as of January 2021. The Polish Ordinance on the technical conditions to be met by buildings and their placement [11], which is an implementation of the Directive on the energy performance of buildings, defines the nZEB standard’s requirements via general requirements and detailed requirements. Detailed requirements concern minimum heat transfer coefficient U [W/(m2K)] for the building’s envelope, calculated as per PN-EN ISO 6946:2008 [12]. The general requirements concern the non-renewable primary energy indicator EP [kWh/(m2annum)]. We have listed in Table 1 the thermal insulation requirements for the building envelope’s major elements, as per the nZEB standard.
The EP indictor’s value, which denotes the building’s calculation demand for non-renewably primary energy, comprises the following elements:
  • EPH+W [kWh/(m2annum)]—partial maximum EP indicator value for the purposes of heating, ventilation and domestic hot water (DHW) preparation.
  • ΔEPC [kWh/(m2annum)]—partial maximum EP indicator value for the purposes of cooling.
  • ΔEPL [kWh/(m2annum)]—partial maximum EP indicator value for the purposes of installed lighting.
The requirements for primary energy used for heating, ventilation and domestic hot water preparation have been listed in Table 2.
Primary energy indicators for the purposes of cooling are expressed by the following formulas:
∆EPC = 5 × Af,C/Af
And for remaining buildings:
∆EPC = 10 × Af,C/Af
where Af—heated usable floor area [m2] and Af,C—cooled usable floor area [m2].
  • Primary energy indicators: ∆EPL = 0
  • For other buildings: for t0 < 2500 ∆EPL = 25; for t0 ≥ 2500 ∆EPL = 50
    where t0—number of hours during which the lighting installation operates.
The general requirements for EP depend strictly on the building’s form of use. A different limit value shall apply to office buildings (public and commercial), and a different one to residential buildings (apartment building). Therefore, one should ask whether one should also comply with energy performance requirements defined for the target function while changing a building’s form of use.
  • Selected aspects of nZEB design
NZEBS are characterised by very low energy demand, both for operational energy and the primary energy required by regulations. Building energy performance and energy performance certificate calculations, as stipulated in national methodologies, do not account for individual user behaviours or building use schedules. In effect, design guidelines for Heating, Ventilation, Air Conditioning (HVAC) systems as featured in energy calculations can lead to an underassessment or overdimensioning of relevant systems and installations. This results in the danger of adversely affecting indoor environment quality and greater-than-expected energy consumption.
In [5] (Azar, Elie), the authors demonstrated that forecasts obtained via software commonly used for energy estimation typically depart from actual energy consumption levels. Accounting for diverse and dynamic energy use patterns among users contributes to fewer differences in projected and actual energy consumption. The authors illustrated their argument with a case study of an office in a university building, in which over 25% of changes in projected energy use were obtained via the method proposed versus the traditional, commonly used method that featured static use parameters. In [13] (Ali, Qadeer), the authors warned that energy-efficient buildings have trouble with performance. Among the several reasons for this, the authors pointed to critical user behaviours. Similarly to other researchers, the authors noted that traditional energy simulation software did not account for dynamic user behaviour changes that change over time. The authors, while studying office buildings in Pakistan, estimated the potential at a level of 25.4% with correct assessment of user behaviour dynamics. In [14] (Kamińska), the authors performed an experimental assessment of energy consumption in an existing public building located in Poland, accounting for user behaviour impact. User behaviour analysis demonstrated that ensuring comfort is associated with a wide range of temperature settings for different users and the opening of windows was performed randomly and was difficult to project. The study demonstrated that regulating heating can result in energy savings of around 10%.
The authors of [15] (Menzes) pointed to substantial evidence indicating that buildings do not perform as well as expected, using the term ‘performance gap’ to discuss the main reasons for discrepancies between energy modelling estimates and the operational parameters of buildings (after a twelve-month responsibility period). The authors pointed to the introduction of non-realistic user behaviour input parameters into simulations. In their case study, the authors analysed user behaviours, focusing primarily on lighting, energy and cooking equipment in an office building in a high-density development. Their findings showed that by combining monitoring data with a predictive energy model, it was possible to increase the model’s accuracy to within 3% of actual electrical energy consumption. In [16] (Mjörnell, K.), the authors noted that over the past several years, the number of residential building users has increased due to, among other things, migrations. The question they sought to answer was how does the doubling or tripling of resident numbers and the associated humidity load affect the risk of poor air quality and damage caused by damp. The authors of [17] (De Wilde, Pieter) performed a review of the literature concerning gaps in energy performance. They identified three main types of gaps: (1) between projections and first-rule measurements, (2) between machine learning and measurements, and (3) between projections and certification issuance in legislation.
Research points to the fact that energy-efficient buildings have problems with achieving the intended energy performance. One of the reasons for this is the fact that building user behaviours are dynamic, change over time, are repetitive, and have a specific temporal scope and location. Additionally, traditional design-stage energy simulation software utilises static models, which are uniform for the entire period of occupant indoor stay. Corrections that account for changing user behaviours can lead to energy use optimisation.
We propose an innovative approach to planning building energy demand. Apart from an analysis of differences in energy demand resulting from static and dynamic simulations that assume a building use schedule, we propose projecting changes to the building’s form of use from a multi-family building to an office building during the design stage. Based on dynamic user activity schedules, we determined an optimal level of building energy demand so that the form-of-use change can be possible without adversely affecting energy conditions. Research has shown that the gap between actual energy performance and the one projected in design documentation, which is described as a performance gap, can be as much as 2.5 times greater than planned energy consumption.
We also analysed the necessity of providing nZEB residents with comfort in the event of the necessity of changing a building’s form of use.
Ensuring comfort is discussed increasingly often in academic literature [18]. Passive buildings and nZEBs are characterised by very high envelope thermal insulation levels and a high air-tightness. With the simultaneous use of passive solar radiation, a lack of solar shielding elements, or in cases where HVAC systems are not designed well (see energy gap), the occurrence of indoor space overheating becomes increasingly prevalent.
Danish researcher Ole Fanger was the precursor of the study of thermal comfort. In his work [19], he defined thermal comfort as a neutral feeling between feeling cold and feeling too hot. This affects several parameters, such as indoor air temperature, radiation temperature, relative humidity, air movement, as well as clothing thermal resistance and the user metabolism rates. These parameters have been incorporated into the Fanger model, which projects the satisfaction of mass users accounting for environmental and physiological parameters. Fanger’s work has served as the basis for international standards [20,21,22].
The phenomenon of comfort is currently considered a major building parameter that ensures good user well-being [23,24,25,26], which should be analysed during the design stage in tandem with energy performance. Comfort level is tested in different types of buildings, such as residential buildings [27,28], naturally ventilated office buildings [29,30], air-conditioned office buildings [31], or public and commercial buildings [32,33,34]. Comfort studies at the stage of use of historical buildings were presented in their works by the authors. [35,36,37].
Many scholars explore ways to provide optimal comfort in buildings, particularly low-energy buildings. In [23] (Majewski, G.), researchers analysed the indoor environment in two modern, intelligent buildings in Poland. They presented air temperature, radiative temperature, relative humidity and carbon dioxide concentration measurements performed in 117 spaces over the course of one year and a half. The thermal comfort of residents was assessed using a survey questionnaire. It turned out that the impact of temperature on the sensations felt by respondents was the most important element that ensured good resident well-being.
In [29], (Moujalled, B.) the authors noted that the ISO 7730 standard [38] defines a thermal comfort norm that is acceptable in air-conditioned buildings, but found that in the case of naturally ventilated buildings a much larger temperature range was accepted and preferred by users. This was concluded on the basis of field studies in naturally ventilated buildings in France.
The authors of [39] (Hens, H.) also discussed naturally ventilated and air-conditioned office spaces. Their findings also indicated that a departure from naturally ventilated spaces and opting for air-conditioned ones increased distress associated with thermal comfort. At the same time, reasons for the use of air-conditioning in office spaces listed by the authors include high internal loads and excessive solar gains, which lead to indoor space overheating. The number of dissatisfied respondents with a Predicted Mean Vote (PMV) of zero was much higher than the standard Predicted Mean Vote/ Predicted Percentage Dissatisfied (PMV/PPD) curve.
Comfort studies in public buildings were conducted by the authors of [32] (Ricciardi, P.), who compared comfort measurements taken in an ancient Italian theatre with a survey. They also concluded that survey data differed from measurement data, as confirmed by a greater variability of personal experiences due to the possibility of only reporting integers. The authors postulated for the seven-degree comfort scale to be adjusted to a thirteen-degree scale, to include half-point values.
Comfort studies are performed by researchers in every climate zone. In [27] (Djamila, Harimi), the researchers presented a field study performed in non-air-conditioned residences in the city of Kota Kinabalu, Malaysia. They described and analysed the hot and humid indoor climate in the buildings in terms of air temperature, globe temperature, relative humidity and wind speed. They concluded that internal comfort temperature is the most essential comfort factor.
Many indications as to adaptation criteria concerning thermal comfort and its significance in applying design strategies to passive office, educational and senior nursing homes were featured in [33] (Guedes, M.C.).
Simulations performed by researchers in [40] (Kim, J.) indicate that HVAC system control strategies have a significant impact on energy conservation. By regulating temperature and providing user thermal comfort, energy consumption can be reduced by as much as 25.4% (PMV) and 27% for the ASHRAE comfort range in comparison to typical temperature listings, without accounting for comfort parameters.
However, optimising energy-efficient buildings should not be solely focused on thermal comfort. The different aspects of indoor space use comfort were discussed by the authors of [41,42,43,44]. Visual comfort is also an important aspect of indoor space use comfort. Thermal and visual comfort are closely related, for instance, by the need to provide windows of appropriate size that let daylight into the building. The proper application of natural daylight in a building’s design can aid in saving relatively large amounts of energy and also preserve a high level of user visual comfort. In [45] (Plympton, P.), the authors presented a study performed on 21,000 students in three states. The study found that students achieved better educational outcomes in classes illuminated with daylight and pointed to the health benefits of daylight-based illumination.
Optimally designed artificial illumination that utilises daylight has an effect on building energy performance. Field studies and simulation analyses performed by researchers have demonstrated that the well-thought-out application of daylight allows for saving, depending on design solutions, between 30 and 70% of energy [46,47,48].
In addition, windows that provide access to sunlight that positively affects visual comfort also introduce shortwave solar radiation into interiors. This radiation transforms into thermal, longwave radiation in the interior, which has difficulty passing through glass. In cases where there are air-tight or very well-insulated buildings, accompanied with poorly designed ventilation, this leads to indoor space overheating.
Choosing the proper type of window glass is complicated, as aspects of energy performance and daylight are simultaneously assessed. Optimisation techniques offer sustainable solutions to contradictions in window glazing choice in energy-efficient buildings [41].
In [49], authors presented a study on optimising window surface area relative to the surface of a wall fitted with solar shielding elements, accounting for daylight performance and energy consumption.
Many publications feature guidelines about optimal glazing size depending on window type, material and structural solutions or location. In monograph [50], the author describes the influence of insulating, dynamic and spectral properties of partitions on the heat balance of energy-efficient buildings. In [51], the authors presented studies of the impact of glazed-surface-to-wall ratios in different microclimate regions of Saudi Arabia. The study found that the proportion between glazing and wall surface should be 10%, both in areas with hot and arid conditions and in hot and humid conditions. The authors of [52] presented an optimisation of translucent partitions in a building in order to minimise thermal load and improve thermal comfort in a green building in China. The thermal load on the building was 36% lower post-optimisation than in the case of a typical energy-efficient building.
Equipping windows and glass façades with shading systems that can minimise indoor space overheating is equally important to selecting the size and type of glazing, depending on user needs arising from different building functions. The application of properly selected shading systems reduces the load on the ventilation and air-conditioning system and thus lowers building energy demand. The authors of [53] presented a study which found that the application of shading mechanisms is especially important in cities characterised by high temperature and solar radiation intensity. In [54], the authors analysed different types of shading systems based on thermal comfort, depending on building orientation, location and window characteristics. A simulation of different configurations of an office opened in Rome was presented in [55] with the intent to compare the performance of internal and external shading systems in terms of thermal and visual comfort and general primary energy consumption. A study of indoor space overheating and the impact of shading barriers on improving thermal comfort was presented in [12]. At present, when frequent natural disasters and climate change require rapid responses by changing a building’s form of use, designers should optimally design said building’s space and installations so as to facilitate such changes and make them possible with minimal financial expenditure.
However, fire safety regulations applicable in Poland were found to make converting an office building into a residential building much easier than doing the reverse. As per the relevant Polish legislation [56], buildings and parts of buildings considered to be independent fire zones are assigned to one of five occupancy-related fire hazard categories (ZL). Office buildings, which are counted among public and commercial buildings, belong to the ZLIII category, while apartment buildings, considered residential buildings, belong to the ZLIV category. Depending on the ZL category and building height, one of five building fire resistance classes is assigned to the building. This means that all distinctive elements of the building, relevant to its fire resistance class, should have the same fire protection rating (fire protection rating related to load bearing/integrity and insulation, expressed in minutes). The fire resistance class for office buildings is a level higher than for residential buildings across all height intervals (low-rise, medium-height, tall and high-rise buildings). This is why changing the form of use of an office building to a residential building is simple and does not require any further expenditure, while the reverse is very costly, technically complicated or outright impossible.
Requirements concerning evacuation route travel distance between a room’s exit leading to said route and an exit to a different fire zone or outside the building, as measured along the axis of the evacuation route, are referred to as “evacuation (exit) approach (travel distance)” in regulations. The permissible evacuation exit approach travel distances for ZLIII fire zones, i.e., for office buildings, are: 30 m with one exit approach, and 60 m with at least two exit approaches. For ZLIV buildings, i.e., for residential buildings, these distances are much longer: 60 m with one exit approach, and 100 m with at least two exit approaches. This is why, in many cases, only a one-way adaptation of a building—from an office building to a residential building—is possible. Buildings are typically designed with minimal surplus in these distances.
The possibility of adapting building use from an office building to a residential building can prove useful in the context of the latest events associated with the COVID-19 pandemic. The General Statistics Office in its reports for the second quarter of 2020 [57], i.e., after the first wave of the pandemic, stated that over 10% of all employees in Poland switched to remote working. This is a trend that is expected to rise due to ongoing restrictions concerning social distancing as a result of successive waves of the pandemic and due to the rapid development of information technologies that support remote working. It should also be noted that, in many developed countries, the share of persons engaging in remote work is much higher than in Poland. It is also probable that once the threat of COVID-19 comes under control, businesses will treat the possibility of recurring pandemics with much greater seriousness. These and other symptoms can point to the current model of office work having to evolve in the direction of a much greater share of remote work, which shall lead to a growing oversupply of office spaces on the real estate market.
We have analysed the possibility of changing the form of use of an office building to a residential building during occupancy. Alongside changes in technical solutions, we have also analysed the impact of the form-of-use change on energy demand and thermal comfort.
In this paper, we have presented energy consumption analyses for the design of a multi-family building, after which it was redesigned into an office building. These two functions are assumed to be characterised by extremely different use schedules, which affects energy demand. We have calculated energy demand using two methods: the monthly balance method and the hourly balance method, analysing any differences in outcome and their causes. This research aspect is important from the standpoint of the energy gap that can occur in the design of low-energy buildings using software based on monthly energy balances.
Another matter that we have discussed in this paper is ensuring comfort of use in both types of functionality under analysis. To this end, we performed an analysis involving the use of windows with different parameters, including windows without solar blinds and with blinds. For both forms of use under analysis, we analysed whether it was necessary to use a cooling system or whether solar protection devices were sufficient to prevent overheating.
At the beginning of the study, the authors adopted several hypotheses to verify. The first one assumes that it is possible to transform an office building into a residential one while maintaining the required energy standard and thermal comfort of users, without significant investment costs. The second hypothesis assumes the possibility of the reverse transformation, from the residential function of the building to the office function, while maintaining the thermal comfort of users and without significant costs. Another hypothesis assumes that it is possible to achieve an almost zero energy standard for a medium-sized building located in the area of a humid continental climate using modern HVAC systems together with photovoltaic systems.
The primary objective of this research was to analyse the possibility of changing the purpose of the building from office to residential function. This investigation is highly desirable since currently in Poland, but also in many other countries in the world, the transition of many employees to remote working has resulted in an oversupply of office space in the commercial real estate market. On the other hand, in the centres of large developing cities there is a demand for residential space in attractive locations.
This research was also aimed at analysing the impact of a building’s function change on energy consumption and non-renewable primary energy indicators.
Another aim was to analyse the results of calculations carried out with two mathematical models, one taking into account the hourly balanced method and the other taking into account the monthly balanced method. One or another model is used in different countries.
This paper also analysed the possibilities of obtaining zero energy standard for the analysed medium-sized building.

2. Materials and Methods

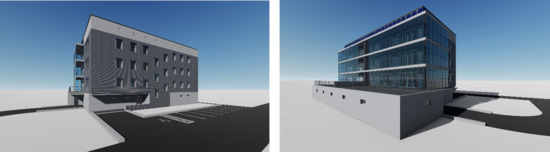
2.1. Overview of the Building under Analysis

The building under analysis is a four-storey building, without a basement, covered with a ventilated, two-part flat roof.
At ground-floor level, there is an entrance zone with an entrance that is shaded via a recess in the façade, along with a vestibule, a bicycle/pram storage space, a three-run stairwell, a passenger lift and a vestibule leading to a multi-space car park and ancillary spaces. The ground-floor level extends towards the south, creating a wide terrace accessible from the first floor.
The building’s three floors each have separate, independent office space complexes, and in case of changing the building’s form of use to housing—two apartments each.
Figure 1, Figure 2, Figure 3 and Figure 4 include views of the arrangement of the building for both of the forms of use under analysis, a cross section and the building’s elevations.
The total usable floor area of the building is 1673.6 m2. Six office units were assumed to be featured in each case, with each type of unit having a floor area of 166.0 m2. An apartment building with six apartment units for four people each was assumed, while in the case of an office building, six office units with open offices were assumed, for 17 persons each. Table 3 displays the usable floor area, user numbers and usage schedules for both forms of use.
The building was designed to be energy-efficient. In Table 1, we shall present the primary envelope thermal protection parameters for the building. According to the Polish building code, the assumed air-tightness of the building is n50 < 1.5 1/h
The construction technologies used in the building are traditional, based on masonry walls consisting of porous ceramics with an external thermal insulation layer, tied with a reinforced concrete tie-beam and beams, cast reinforced concrete deck slabs and monolithic stairs.
The minimum window area to floor area ratio that is up to code is 1:8. In the case of the building under study, this ratio is around two times higher, with the largest glazed surface located on the south-facing façade, which enables achieving a positive energy balance for windows.
On the other hand, the Polish building code, due to thermal regulation requirements and other provisions associated with energy conservation, features a limitation of maximum window area. In residential and accommodation building types, windows, glazed and translucent partition area A, expressed in m2, with a heat transfer coefficient no lower than 0.9 W/(m2K), calculated as per their modular dimensions, cannot exceed A0max, which is calculated from:
A0max = 0.15 Az + 0.03 Aw
where Az is the sum of the areas of the floor plan of all above-grade storeys (along the outer outline of the building) in a 5 m strip along the external walls, and Aw is the sum of the areas of the remaining part of the floor plans after subtracting Az.
The building under analysis has windows with an area that is much greater than A0max, which is why all of its windows were designed to have a heat transfer coefficient of 0.9 W/(m2K). This is also the thermal insulation value for windows defined in the Polish standard for nZEBs.
We have listed window surfaces for all orientations in Table 4.

2.2. Overview of Analysis Tools

The operational energy demand for both forms of use under analysis was calculated using two methods: the hourly balance method and the monthly balance method. In the literature, it was indicated that calculating energy balance using standard software based on monthly balances can lead to erroneous energy demand projections and the occurrence of an energy gap, which is why further in the paper we have presented an analysis of the differences between the monthly balance and hourly balance approach, which allows for accurate indoor space occupancy schedules.
  • Monthly balance analysis method
Analyses using the monthly balance method were performed using Audytor OZC software, which is used to support calculations for projected building heat load as per the PN EN 12831 standard, for energy demand calculations following the PN-EN ISO 52016 standard and for preparing energy performance certificates as per applicable Polish regulations. The software calculates building partition moisture analyses as per the PN-EN ISO 13788 standard. All calculations performed complied with the Polish Ordinance of the Minister of Investment and Development of 6 September 2019 amending the ordinance concerning building or building section energy performance calculation and energy performance certificate methodology, as well as with the Ordinance of the Minister of Infrastructure and Development of 17 July 2015 concerning the announcement of a codified text of the ordinance of the Minister of Infrastructure concerning the technical conditions to be met by buildings and their placement.
  • Hourly balance analysis method
EnergyPlus™ is a whole building energy simulation program that engineers, architects, and researchers use to model both energy consumption—for heating, cooling, ventilation, lighting and plug and process loads—and water use in buildings. Some of the notable features and capabilities of EnergyPlus include:
  • Integrated, simultaneous solution of thermal zone conditions and HVAC system response that does not assume that the HVAC system can meet zone loads and can simulate un-conditioned and under-conditioned spaces.
  • Heat balance-based solution of radiant and convective effects that produce surface temperatures, thermal comfort and condensation calculations.
  • Sub-hourly, user-definable time steps for interaction between thermal zones and the environment; with automatically varied time steps for interactions between thermal zones and HVAC systems. These allow EnergyPlus to model systems with fast dynamics while also trading off simulation speed for precision.
  • Combined heat and mass transfer model that accounts for air movement between zones.
  • Advanced fenestration models including controllable window blinds, electrochromic glazings, and layer-by-layer heat balances that calculate solar energy absorbed by windowpanes.
  • Illuminance and glare calculations for reporting visual comfort.

2.3. Data assumed in the Model

Model of the analysed building is presented in Figure 5.
The zone division follows Figure 1 and Figure 2. Occupancy schedules and thermal gain loads following NCM (National Calculation Method) were used [48]. The temperature during the heating season was 21 °C for the office building and 20 °C for the apartment building, while during the cooling season a temperature of 24 °C was assumed for both buildings. A system of four-pipe fan coil units was assumed to maintain the required temperature. Its source of heat was assumed to be a gas-powered condensation boiler, while cooling was provided by a compressor unit. Domestic hot water was also assumed to be prepared using the boiler.
We analysed primary energy demand for the residential and office building as per Polish regulations. Apart from the energy demand for heating, cooling, domestic hot water preparation and ancillary devices in HVAC systems for the residential building and the energy demand for heating, cooling, domestic hot water preparation, lighting and ancillary HVAC system devices for the office building, we also analysed energy demand for technical appliances in the office building, including computers, while for the residential building we accounted for lighting and household appliances. We calculated energy demand indicators as per Polish regulations, as well as energy demand indicators that accounted for the additional elements mentioned. The calculations for both buildings were performed using a simulation method in DesignBuilder v6.1.6.5—a program used for dynamic holistic simulations—as well as the monthly balance method compliant with Polish building energy performance regulations.
  • Calculation assumptions:
    • —Windows (alternative 1) with a U-value of U = 0.9 W/m2K and a solar heat gain value of g = 0.35
    • —Gas-powered heating with a non-renewable expenditure coefficient of wi = 0.8
    • —Electrical-based cooling with an expenditure coefficient of wi = 3.0
The efficiency of the systems defined in the Polish regulations for determining the energy performance of buildings was used.
The analysis is based on current standard schedules according to the National Calculation Methodology (NCM) modelling guide by the British Department for Communities and Local Government. The current weather data are arranged by the World Meteorological Organization for regions and Countries.

3. Results

3.1. Building Technical Installation Remodelling Potential Analysis

The central heating system energy demand for the building under analysis was found to be at a level that was similar for office and residential use. A slightly higher difference was visible in the necessary amounts of ventilated air, cooling energy and energy required for domestic hot water preparation. This was caused by the large difference in user numbers (17:4 for a single unit) and the number of appliances used (office appliances relative to household appliances), which generates varied thermal gains. In turn, the difference in energy demand for domestic hot water preparation stemmed from its greater demand in a residential building relative to an office building. Converting an office building into an apartment building does not require new expenditures and only results in a lower consumption of the installed ventilation and cooling systems. Meanwhile, when an opposite adaptation is considered, i.e., converting a residential building into an office building, it would require the costly remodelling of the mechanical ventilation and air-conditioning system.

3.2. Business Model Transformation Analysis

The alternative business model that is changing an office building’s form of use into that of an apartment building and its sale instead of renting could potentially be an attractive option, particularly under the conditions of an economic crisis and the oversupply of office spaces. Converting an office building into an apartment building is possible with relatively little modifications and investment. The opposite functional change is, from the standpoint of regulations, technical difficulties and costs, irrational. The costs of renting office space can vary. They depend on numerous factors such as floor area, finishing standards and furnishing. However, location remains a key factor and it largely determines the cost of renting office space. This is not only about the fact of whether the office space in question is located in a city or outside of it. It is the prestige of the district in which a given office building is located that is of key significance. Furthermore, prices also depend on many factors associated with the building itself—on floor area, finishes and furnishing, parking spaces, etc. The sale of apartments depends on similar factors, so it can be assumed that a comparable feedback between price and quality also takes place here.
  • Construction—the average cost of investing in the construction of an office building in a prestigious big-city location in Poland is, on average EUR 2000/m2. In the building under analysis, each office unit has a floor area of 166 m2. Thus, the construction of each of the office space units in the building under analysis amounts to EUR 2000/1 m2 × 166 m2 = EUR 332,000
  • Rental—office space rental prices in the Polish capital, Warsaw, in 2020 were within the range of EUR 15–25/1 m2/month depending on the district. Thus, the price of yearly rental of a single office unit in the building under analysis would be 166 m2 × EUR 20/1 m2/month × 12 months = EUR 39,840. This would provide a return on investment time of around 8–10 years, without including the cost of servicing debt.
  • Sale of an office unit as an apartment—the price for an apartment in a prestigious location in Warsaw was, at the time of writing, around EUR 3400/1 m2. Thus, the price of an apartment in the building under analysis would amount to 166 m2 × EUR 3400/1 m2 = EUR 564,000. Thus, the profit from the sale of an office space unit as an apartment would be EUR 564,000 − EUR 332,000 = EUR 232,400, which is around 40% of the sale price.

3.3. Comparison of Energy Demand Calculations Performed Using the Monthly Balance Method with Calculations Performed Using the Hourly Balance Method for the Apartment Building after its Adaptation into an Office Building

Analogous calculations were performed for the solutions under analysis using the monthly and hourly balance methods. In the calculations, we assumed a number of heating and cooling hours for each of the building’s functions as listed in Table 5. In both cases, the conditions of thermal comfort were maintained, including the required temperatures during heating and cooling seasons. The hours of heating and cooling are determined on the basis of the energy balance, taking into account the required temperature standards for individual building spaces.
As shown in Figure 6, when counting building energy demand using the hourly and monthly balance methods, it can be observed that occupational and final energy demand for both of the buildings are similar. The greatest differences were apparent in the case of the primary energy indicator. A much higher value of this indicator appeared in calculations for the office building. This was caused by the fact that numerous people work in such buildings and electrical energy consumption is higher due to distinctive occupancy schedules and the use of, for instance, lighting. In addition, the non-renewable primary energy demand indicator (EPtotal) also included devices such as computers and other office appliances. When changing the building’s form of use, one should, apart from building services solutions, also properly select energy sources so that the requirements featured in regulations for the different type of building are complied with. When changing a building’s form of use from a residential to an office one, there is a very high probability of it becoming necessary to equip the building with renewable energy sources.
The dependencies stipulated in the Polish building code, following Table 2, allowed us to determine the limit values of the primary energy demand indicator. Based on these indicators, we calculated the permissible primary energy indicators for both functions of the buildings and have presented them in Table 6.
For the purposes of the analysis, it was assumed that both buildings under analysis were equipped with cooling systems and their partition thermal insulation parameters complied with the Polish definition of nZEBs. In this part of the analysis, we assumed that the buildings were heated by gas and the cooling systems were powered by electricity.
Based on the results of the analysis, which have been presented in Figure 7, which accounts for permissible values listed in Table 6, it can be stated that even a building designed as energy-efficient and that meets thermal insulation standards for partitions is incapable of meeting the condition for primary energy demand. In the case of the apartment building, the condition was exceeded by between 150 and 250%, and in the case of the office building, it was 120 to 250% above the permissible value, depending on whether the calculations were performed for monthly or hourly balances. The necessity of maintaining non-renewable demand levels at an appropriately low level will probably pose a significant problem for architects in Poland, as well as other European countries, in the near future.

3.4. Bridging the Energy Gap with Alternative Renewable Energy Installations to Make the Building Zero Energy

To determine the greatness of the need for renewable energy source installations that would allow the building to meet restrictive nZEB requirements, three options of equipping the building with photovoltaic panels were analysed.
Alternative 1. Panels on the flat roof with an incline of 35 degrees = 66 units × 1.5 = 99 m2. It was assumed that the panels occupied the entire area of the roof (Figure 8).
Alternative 2. Same as alternative 1, but additional full panels were added to the attic wall of the two-part flat roof = 36 units × 1.5 m2 = 54 m2 (Figure 9).
Alternative 3. Same as alternative 2, but 50% see-through panels were added as a skin in front of the windows = 72 units per floor × 3 = 216 units × 1.5 m2 = 342 m2 (50% power output was assumed per unit of see-through panel surface). We assumed two panels stacked vertically with small gaps to enable air flow (Figure 10).
In all alternatives, the dimensions of every PV panel were 1.0 × 1.5 m, which resulted in an area of 1.5 m2/1 panel.
The results of the calculations carried out with the use of hourly and monthly balance methods, aimed at determining the energy gap to be bridged in order to meet the nZEB requirements using particular RES installation variants and for different building functions, are presented in Table 7 and Table 8.
The zero values presented in Table 7 and Table 8 indicate a possibility of attaining the necessary non-renewable primary energy demand indicator while using the solutions proposed.
As demonstrated by the analysis, to meet the requirements set forth in the Polish building code concerning the permissible non-renewable primary energy demand indicator values, one should supply a considerable amount of energy using PV panels. This is a problem from the standpoint of architecture as the roof is often used to place mechanical ventilation systems, which leaves no place for PV panels, while see-through panels, which in this case were shown to meet the requirements, are very expensive.

3.5. Results of Energy Demand Calculations for the Residential Building and after the Change of the Form of Use of the Office Building

The demand for operational energy for both building uses has been presented in Figure 11a (demand for partial elements of operational energy) and 11b (demand for partial elements of operational energy).
The analysis showed that complete demand for operational energy in both buildings was similar. The greatest differences were in domestic hot water and cooling energy demand. In the case of domestic hot water production energy demand, it is much lower in office buildings in general, while energy demand for cooling was observed to be higher by 100%. This is based on the amount of water required to satisfy demand in the buildings and the occupancy schedules and internal gains in both building types. Office building spaces are characterised by a much higher demand for cooling energy when the heat load caused by thermal gains from devices and solar radiation is the highest.
The final energy demand for both building uses has been presented in Figure 12a (demand for partial elements of operational energy) and Figure 12b (demand for total final energy).
The analysis demonstrated that final energy demand was similar in both cases. The calculations assumed the same installation effectiveness. As final energy demand is calculated as the sum of products of operational energy demand for each system divided by the total system performance, in the case of operational energy demand, the greatest differences are observed in domestic hot water preparation energy demand and energy demand for cooling.
Primary energy demand for both building uses has been presented in Figure 13a (demand for partial primary energy elements) and Figure 13b (demand for total primary energy).
In the case of comparing primary energy, the office building was found to have a much greater demand. This was caused by the office building requiring more energy for cooling, lighting, ancillary equipment and appliances.
As a part of the analysis, we tested how thermal comfort conditions and results would have looked had the buildings lacked a cooling system. The primary energy demand for buildings equipped with cooling and for buildings without cooling is shown in Figure 14.
As shown in the analysis, primary energy demand for buildings without cooling was lower than energy demand for buildings with cooling systems. However, buildings without cooling systems do not provide thermal comfort conditions. During summer, the temperature in the residential building was higher than 24 °C for 3467 h and in the office building for 4640 h, with the same system operation schedules and the same air flow. To improve thermal comfort during summer, one would have to periodically increase air flow and apply additional shading mechanisms. However, analysis of these solutions was not included in this paper.

3.6. Thermal Comfort Analysis Results, Assuming Different Window Sets with an Option of Windows without Solar Blinds and with Blinds for a Residential Building and after the Change of Form of Use for the Office Building

For the primary energy demand of various types of glazing and windows with and without solar blinds for the residential building, windows with a solar heat gain value of g = 0.25, g = 0.35 and g = 0.35 equipped with solar blinds were assumed.
The analysis of results for the residential building presented in Figure 15 found that the lowest primary energy demand was obtained for the alternative with windows with a solar heat gain value of g = 0.25. This means that glazing parameters that are often used in office buildings are also the most beneficial in terms of total energy balance in a residential building.
Based on an analysis of results for the office building shown in Figure 16, it was found that, similar to the case of the residential building, the lowest primary energy demand occurred for the alternative with windows that had a heat gain value of g = 0.25. For all alternatives under analysis, the temperature was maintained throughout the year. Differences in total primary energy demand were found not to exceed 4%.
Figure 17 and Figure 18 show that differences in total final energy demand reached several percentage points, both for the office and residential building. This means that neither of the alternatives under analysis negatively affected the building’s energy performance in its basic version. The differences in final energy demand between the assumed alternatives in the office and residential buildings were at a similar level, which means that there was no need to perform costly glazing replacement during the process of changing the form of use from office use to residential use.

4. Discussion

Designing near-zero energy buildings (nZEBs) is an essential matter in the context of changing regulations in European Union Member States. As demonstrated in this paper, the introduction of new legislative requirements brings with it a series of consequences that designers must account for. Based on a hypothetical case study, we demonstrated that changing a building’s form of use can in many cases be possible without major financial expenditure, provided that it has been pre-planned during the design stage. Business model changes based on transforming an office building into an apartment building and its sale, as opposed to the rental of apartment units, can prove attractive, particularly during a period of economic crisis and the oversupply of office spaces—especially at present, with the growing share of people engaging in remote work due to the COVID-19 pandemic. Converting an office building into an apartment building is possible with relatively little modifications and costs. However, for the opposite, such a change, seen from the perspective of regulations, technical difficulties and costs, is largely irrational.
When analysing the aspect of technical requirements, we wish to highlight that general PE requirements are closely related to a building’s form of use and are different for office buildings (public and commercial buildings) and for multi-family residential buildings.
Due to the fact that we assumed a change in the form of use of a public and commercial building to a residential building with different PE limit values, we encountered the question of there being a loophole in regulations associated with the adaptation of requirements to the new form of use.
Our analyses also demonstrated that meeting national primary energy requirements can prove problematic when we account for the availability of space for installing photovoltaic panels for electrical energy production. Further analyses indicated that using windows with different heat gain values, as well as the application of louvres, had a negligible impact on primary energy, but was nevertheless important from the standpoint of ensuring thermal comfort to users.
Ensuring thermal comfort, as indicated by the review of the literature, is an important aspect in building design. Polish technical regulations lack clearly formulated requirements for designers concerning this aspect. The requirements for thermal comfort, as stipulated in the Polish building code [10], are vague: “The building should be designed and built in such a manner as to limit overheating during summer”. The second requirement stipulated in the code concerns the total heat gain value for windows, glass and translucent partitions.
In addition, the code should feature a requirement for in-situ thermal comfort testing during occupancy, specifically during summer.
The research conducted has its limitations and cannot be treated universally. Not every building can be transformed into a different function. This requires individual and multi-criteria analysis. In addition to energy efficiency, it should take into account aspects such as safety of use and compliance with applicable regulations, proper lighting of rooms with daylight, the economic aspect of functional transformation and its cost-effectiveness, etc.
Despite various limitations, the vision for the future is quite clear—transformations in the functions of existing buildings will be necessary for various reasons and will undoubtedly be more beneficial than changes by demolishing the existing cities.

5. Conclusions

The study presented in this paper allowed us to formulate several conclusions.
It is relatively simple to transform an office building into a residential one while maintaining the required energy standard and thermal comfort of users, without significant investment costs. However, the reverse change, from residential to office function, is very costly, and in some cases even impossible from a technical point of view, mainly due to fire regulations.
It is possible to achieve an almost zero energy standard for a medium-sized building located in the area of a humid continental climate using modern HVAC systems together with photovoltaic systems. However, the energy gap and renewable energy demand indicator are larger for office buildings than for residential buildings and, therefore, their elimination requires more efficient photovoltaic systems.
The calculations assuming the dynamics of room use (taking into account the hourly balance method) gave similar results to the calculations omitting these dynamics (taking into account the monthly balance method). However, a slightly higher utility energy and a lower primary energy were obtained on the basis of the monthly balance method than the hourly balance method. This or that model is used in different countries. For example, in Poland, the monthly balance method is used, while in the UK, the hourly balance method is used.
The conducted analyses mainly concern the Polish market and Polish regulations. Using them in other countries would require taking into account local and national methodology of energy performance calculations. However, due to similar standards related to the required energy efficiency, which in Europe result from the EU Directives, very similar results and conclusions on a global scale should be expected.
The directions of further research are mainly energy analysis of large, south-facing window glazing in terms of positive energy gains and overheating during summer, which leads to unacceptable drops in thermal comfort, which is associated with the application of air-conditioning. Since the standard schedules do not take into account epidemic states, the preparation of modified schedules and their inclusion in the calculations will be subject to further work.

Author Contributions

Conceptualization, P.M.-Z. and M.F.-C.; Data curation, M.F.-C.; Formal analysis, P.M.-Z., J.R. and M.F.-C.; Investigation, P.M.-Z., J.R. and M.F.-C.; Methodology, P.M.-Z. and M.F.-C.; Project administration, M.Z.; Resources, M.F.-C.; Software, J.R.; Supervision, M.F.-C.; Writing—original draft, P.M.-Z., J.R. and M.F.-C.; Writing—review and editing, P.M.-Z., M.F.-C. and M.Z. All authors have read and agreed to the published version of the manuscript.

Funding

This research received no external funding.

Informed Consent Statement

Informed consent was obtained from all subjects involved in the study.

Data Availability Statement

Not applicable.

Conflicts of Interest

The authors declare no conflict of interest.

References

  1. Piasecki, M. Metoda oceny budynku pod kątem zrównoważonego rozwoju. Mater. Bud. 2010, 5, 34–36. [Google Scholar]
  2. Radziszewska-Zielina, E.; Rumin, R. Analysis Of The Profitability of Investment In Renewable Energy Sources On The Example of A Semi-Detached House. E3S Web Conf. 2016, 10, 79. [Google Scholar] [CrossRef] [Green Version]
  3. Foletti, C.; Farisè, S.; Grassi, B.; Strazza, D.; Lancini, M.; Poesio, P. Experimental investigation on two-phase air/high-viscosity-oil flow in a horizontal pipe. Chem. Eng. Sci. 2011, 66, 5968. [Google Scholar] [CrossRef]
  4. Švajlenka, J.; Kozlovská, M. Effect of accumulation elements on the energy consumption of wood constructions. Energy Build. 2019, 198, 160. [Google Scholar] [CrossRef]
  5. Azar, E.; Menassa, C.C. Agent-based modeling of occupants and their impact on energy use in commercial buildings. J. Comput. Civ. Eng. 2012, 26, 506–518. [Google Scholar] [CrossRef]
  6. European Parliament. Directive 2002/91/EC of the European Parliament and of the Council of 16 December 2002 on the Energy Performance of Buildings; European Parliament: Brussels, Belgium, 2002. [Google Scholar]
  7. European Parliament. Directive 2010/31/EU of the European Parliament and of the Council of 19 May 2010 on the Energy Performance of Buildings; European Parliament: Brussels, Belgium, 2010. [Google Scholar]
  8. European Parliament. Directive (EU) 2018/844 of the European Parliament and of the council of 30 May 2018; European Parliament: Brussels, Belgium, 2018. [Google Scholar]
  9. Atanasiu, B.; Offermann, M.; Manteuffel, B.V.; Grözinger, J.; Boermans, T.; Polska, B.; Pawlak, P.; Witczak, K.; Dębowy, A.; Rapf, O.; et al. ImplementIng Nearly Zero-Energy BuIldIngs (nZeB) in Poland-Towards a definition and Roadmap Executive Summary; Buildings Performance Institute Europe (BPIE): Brussels, Belgium, 2012. [Google Scholar]
  10. Holling of the Minister of Infrastructure and Development of 17 July 2015 on the Announcement of the Consolidated Text of the Regulation of the Minister of Infrastructure on the Technical Conditions to be Met by Buildings and Their Location; Minister of Infrastructure: Warsaw, Poland, 2015.
  11. Fedorczak-Cisak, M.; Nowak, K.; Furtak, M. Analysis of the Effect of Using External Venetian Blinds on the Thermal Comfort of Users of Highly Glazed Office Rooms in a Transition Season of Temperate Climate—Case Study. Energies 2019, 13, 81. [Google Scholar] [CrossRef] [Green Version]
  12. PN-EN ISO-ISO 6946:2017-Building Components and Building Elements—Thermal Resistance and Thermal Transmittance—Calculation Methods; Polish Standardization Committee: Warsaw, Poland, 2017.
  13. Ali, Q.; Thaheem, M.J.; Ullah, F.; Sepasgozar, S.M.E. The performance gap in energy-efficient office buildings: How the occupants can help? Energies 2020, 13, 1480. [Google Scholar] [CrossRef] [Green Version]
  14. Kaminska, A. Impact of heating control strategy and occupant behavior on the energy consumption in a building with natural ventilation in Poland. Energies 2019, 12, 4304. [Google Scholar] [CrossRef] [Green Version]
  15. Menezes, A.C.; Cripps, A.; Bouchlaghem, D.; Buswell, R. Predicted vs. actual energy performance of non-domestic buildings: Using post-occupancy evaluation data to reduce the performance gap. Appl. Energy 2012, 97, 355–364. [Google Scholar] [CrossRef] [Green Version]
  16. Mjörnell, K.; Johansson, D.; Bagge, H. The Effect of High Occupancy Density on IAQ, Moisture Conditions and Energy Use in Apartments. Energies 2019, 12, 4454. [Google Scholar] [CrossRef] [Green Version]
  17. De Wilde, P. The gap between predicted and measured energy performance of buildings: A framework for investigation. Autom. Constr. 2014, 41, 40–49. [Google Scholar] [CrossRef]
  18. Grassi, B.; Piana, E.A.; Beretta, G.P.; Pilotelli, M. Dynamic Approach to Evaluate the Effect of Reducing District Heating Temperature on Indoor Thermal Comfort. Energies 2021, 14, 25. [Google Scholar] [CrossRef]
  19. Fanger, P.O. Calculation of Thermal Comfort, Introduction of a Basic Comfort Equation; ASHRAE Transacions: Peachtree Corners, GE, USA, 1967; p. 73. [Google Scholar]
  20. PN ISO 7726: 2001. Ergonomics of the Thermal Environment. Instruments for Measuring Physical Quantities; Polish Standardization Committee: Warsaw, Poland, 2001. [Google Scholar]
  21. PN-EN 15251:2012-Wersja Polska. Available online: http://sklep.pkn.pl/pn-en-15251-2012p.html (accessed on 19 September 2019).
  22. PN-EN ISO 7730: 2006. Ergonomics of the thermal Environment—Analytical Determination and Interpretation of Thermal Comfort Using the Calculation of PMV and PPD Indicators and Criteria of Local Thermal Comfort; Polish Standardization Committee: Warsaw, Poland, 2005. [Google Scholar]
  23. Majewski, G.; Orman, Ł.J.; Telejko, M.; Radek, N.; Pietraszek, J.; Dudek, A. Assessment of thermal comfort in the intelligent buildings in view of providing high quality indoor environment. Energies 2020, 13, 1973. [Google Scholar] [CrossRef]
  24. Radziszewska-Zielina, E.; Czerski, P.; Grześkowiak, W.K.-S.P. Comfort of Use Assessment in Buildings with Interior Wall Insulation based on Silicate and Lime System in the Context of the Elimination of Mould Growth. Arch. Civ. Eng. 2020, LXVI, 89–104. [Google Scholar]
  25. Dudzik, M.; Strȩk, A.M. ANN Architecture Specifications for Modelling of Open-Cell Aluminum under Compression. Math. Probl. Eng. 2020, 2020, 2834317. [Google Scholar] [CrossRef] [Green Version]
  26. Dudzik, M. Towards characterization of indoor environment in smart buildings: Modelling PMV index using neural network with one hidden layer. Sustainability 2020, 12, 6749. [Google Scholar] [CrossRef]
  27. Djamila, H.; Chu, C.M.; Kumaresan, S. Field study of thermal comfort in residential buildings in the equatorial hot-humid climate of Malaysia. Build. Environ. 2013, 62, 133–142. [Google Scholar] [CrossRef]
  28. Romańska-Zapała, A.; Bomberg, M.; Fedorczak-Cisak, M.; Furtak, M.; Yarbrough, D. Buildings with environmental quality management (EQM) Part 2: Integration of hydronic heating/cooling with thermal mass. J. Build. Phys. 2018, 41, 397–417. [Google Scholar] [CrossRef]
  29. Moujalled, B.; Cantin, R.; Guarracino, G. Comparison of thermal comfort algorithms in naturally ventilated office buildings. Energy Build. 2008, 40, 2215–2223. [Google Scholar] [CrossRef]
  30. Yarbrough, D.W.; Bomberg, M.; Romanska-Zapala, A. On the next generation of low energy buildings. Adv. Build. Energy Res. 2019, 1–8. [Google Scholar] [CrossRef]
  31. Damiati, S.A.; Zaki, S.A.; Wonorahardjo, S.; Ali, M.S.M.; Rijal, H.B. Thermal Comfort Survey in Office Buildings in Bandung, Indonesia. In Proceedings of the Int. Joint Conference Senvar-Inta-Avan 2015 “Wisdom Trop. Past Present Future, International Joint Conference of SENVAR-iNTA-AVAN, Johor, Malaysia, 24–26 November 2015; pp. 53–64. [Google Scholar]
  32. Ricciardi, P.; Buratti, C. Thermal comfort in the Fraschini theatre (Pavia, Italy): Correlation between data from questionnaires, measurements, and mathematical model. Energy Build. 2015, 99, 243–252. [Google Scholar] [CrossRef]
  33. Guedes, M.C.; Matias, L.; Santos, C.P. Thermal comfort criteria and building design: Field work in Portugal. Renew. Energy 2009, 34, 2357–2361. [Google Scholar] [CrossRef]
  34. Dudzik, M.; Romanska-Zapala, A.; Bomberg, M. A Neural Network for Monitoring and Characterization of Buildings with Environmental Quality Management, Part 1: Verification under Steady State Conditions. Energies 2020, 13, 3469. [Google Scholar] [CrossRef]
  35. Piasecki, M.; Radziszewska-Zielina, E.; Czerski, P.; Fedorczak-Cisak, M.; Zielina, M.; Krzyściak, P.; Kwaśniewska-Sip, P.; Grześkowiak, W. Implementation of the Indoor Environmental Quality (IEQ) Model for the Assessment of a Retrofitted Historical Masonry Building. Energies 2020, 13, 6051. [Google Scholar] [CrossRef]
  36. Fedorczak-Cisak, M.; Kowalska-Koczwara, A.; Nering, K.; Pachla, F.; Radziszewska-Zielina, E.; Śladowski, G.; Tatara, T.; Ziarko, B. Evaluation of the criteria for selecting proposed variants of utility functions in the adaptation of historic regional architecture. Sustainability 2019, 11, 1094. [Google Scholar] [CrossRef] [Green Version]
  37. Fedorczak-Cisak, M.; Kowalska-Koczwara, A.; Pachla, F.; Radziszewska-Zielina, E.; Szewczyk, B.; Śladowski, G.; Tatara, T. Fuzzy Model for Selecting a Form of Use Alternative for a Historic Building to be Subjected to Adaptive Reuse. Energies 2020, 13, 2809. [Google Scholar] [CrossRef]
  38. ISO Standard 7730. Ergonomics of the Thermal Environment-Analytical Determination and Interpretation of Thermal Comfort Using Calculation of the PMV and PPD Indices and Local Thermal Comfort Criteria; International Organization for Standardizati: Geneva, Switzerland, 2005. [Google Scholar]
  39. Hens, H.S.L.C. Thermal comfort in office buildings: Two case studies commented. Build. Environ. 2009, 44, 1399–1408. [Google Scholar] [CrossRef]
  40. Kim, J.; Song, D.; Kim, S.; Park, S.; Choi, Y.; Lim, H. Energy-saving potential of extending temperature set-points in a VRF air-conditioned building. Energies 2020, 13, 2160. [Google Scholar] [CrossRef]
  41. Ballarini, I.; De Luca, G.; Paragamyan, A.; Pellegrino, A.; Corrado, V. Transformation of an office building into a nearly zero energy building (NZEB): Implications for thermal and visual comfort and energy performance. Energies 2019, 12, 895. [Google Scholar] [CrossRef] [Green Version]
  42. Fedorczak-Cisak, M.; Furtak, M. Energy efficient building in the context of development strategy of Malopolska. In Proceedings of the CESB 2013 PRAGUE—Central Europe towards Sustainable Building—CESB: Sustainable Building and Refurbishment for Next Generations, Pague, Czech Republic, 26–28 June 2013. [Google Scholar]
  43. Fedorczak-Cisak, M.; Furtak, M.; Gintowt, J.; Kowalska-Koczwara, A.; Pachla, F.; Stypula, K.; Tatara, T. Thermal and vibration comfort analysis of a nearly zero-energy building in Poland. Sustainability 2018, 10, 3774. [Google Scholar] [CrossRef] [Green Version]
  44. Fedorczak-Cisak, M.; Kotowicz, A.; Radziszewska-Zielina, E.; Sroka, B.; Tatara, T.; Barnaś, K. Multi-Criteria Optimisation of an Experimental Complex of Single-Family Nearly Zero-Energy Buildings. Energies 2020, 13, 1541. [Google Scholar] [CrossRef] [Green Version]
  45. Plympton, P.; Conway, S.; Epstein, K. Daylighting in Schools: Improving Student Performance and Health at a Price Schools Can Afford Preprint; National Renewable Energy Laboratory (U.S.): Golden, CO, USA, 2000.
  46. Doulos, L.; Tsangrassoulis, A.; Topalis, F. Quantifying energy savings in daylight responsive systems: The role of dimming electronic ballasts. Energy Build. 2008, 40, 36–50. [Google Scholar] [CrossRef]
  47. Onaygil, S.; Güler, Ö. Determination of the energy saving by daylight responsive lighting control systems with an example from Istanbul. Build. Environ. 2003, 38, 973–977. [Google Scholar] [CrossRef]
  48. Li, D.H.W.; Lam, T.N.T.; Wong, S.L. Lighting and energy performance for an office using high frequency dimming controls. Energy Convers. Manag. 2006, 47, 1133–1145. [Google Scholar] [CrossRef]
  49. Xue, P.; Li, Q.; Xie, J.; Zhao, M.; Liu, J. Optimization of window-to-wall ratio with sunshades in China low latitude region considering daylighting and energy saving requirements. Appl. Energy 2019, 233–234, 62–70. [Google Scholar] [CrossRef]
  50. Kisilewicz, T. Wpływ Izolacyjnych, Dynamicznych I Spektralnych Właściwości Przegród Na Bilans Cieplny Budynków Energooszczędnych; Cracow University of Technology: Cracow, Poland, 2008. [Google Scholar]
  51. Alwetaishi, M. Impact of glazing to wall ratio in various climatic regions: A case study. J. King Saud Univ. Eng. Sci. 2019, 31, 6–18. [Google Scholar] [CrossRef]
  52. Lin, Y.; Zhou, S.; Yang, W.; Li, C.Q. Design optimization considering variable thermal mass, insulation, absorptance of solar radiation, and glazing ratio using a prediction model and genetic algorithm. Sustainability 2018, 10, 336. [Google Scholar] [CrossRef] [Green Version]
  53. Palmero-Marrero, A.I.; Oliveira, A.C. Effect of louver shading devices on building energy requirements. Appl. Energy 2010, 87, 2040–2049. [Google Scholar] [CrossRef]
  54. Bellia, L.; Marino, C.; Minichiello, F.; Pedace, A. An overview on solar shading systems for buildings. Energy Procedia 2014, 62, 309–317. [Google Scholar] [CrossRef] [Green Version]
  55. Atzeri, A.; Cappelletti, F.; Gasparell, A. Internal versus external shading devices performance in office buildings. Energy Procedia 2014, 45, 463–472. [Google Scholar] [CrossRef] [Green Version]
  56. Markiewicz, J. Dziennik Ustaw Rzeczypospolitej Polskiej; Ministry of Infrastructure: Warsaw, Poland, 2015.
  57. Wpływ Epidemii COVID-19 na Wybrane Elementy Rynku Pracy w Polsce w II Kwartale 2020 r., Portal Sprawozdawczy GUS Do Badania “Popyt na pracę”. Available online: https://stat.gov.pl/files/gfx/portalinformacyjny/pl/defaultaktualnosci/5820/4/3/1/wplyw_epidemii_covid-19_na_wybrane_elementy_rynku_pracy_w_polsce_w_trzecim_kwartale_2020_2.pdf (accessed on 9 October 2020).
Figure 1. Repetitive floor plan, shown for office use, including: reception hall, secretariat, director’s room, accounting room, conference room, office space, kitchen with dining annex, men’s and ladies’ room, archive room or cloakroom near the entrance.
Energies 14 00564 g001
Figure 2. Repetitive floor plan for residential use, including: entrance hall, toilet and laundry room, parents’ bedroom, two children’s rooms, two bathrooms, an open office and a library, a large day section and an open kitchenette enabling good access to daylight and solar gains during winter (low incidence angle of solar rays).
Energies 14 00564 g002
Figure 3. Transverse cross-section of the building with extended ground-floor bays due to the presence of a multi-space car park and distinctive balconies from the south, with a reach that protects south-facing apartments during summer (high incidence angle of solar rays) and enables the insulation of the interior and passive solar gains during winter (low incidence angle of solar rays).
Energies 14 00564 g003
Figure 4. Elevations—large glazed surfaces facing south enable passive solar gains during winter.
Energies 14 00564 g004
Figure 5. Model of the building.
Energies 14 00564 g005
Figure 6. Comparison of energy demand for apartment building and office building, using: (a) Comparison of energy demand for apartment building and office building using hourly balance method, (b) Comparison of energy demand for apartment building and office building using monthly balance method; (ED—Energy Demand, FE—Final Energy, PE—Primary Energy, WT—calculations in accordance with Polish standards).
Energies 14 00564 g006
Figure 7. Comparison of energy demand using hourly and monthly balance methods for: (a) Energy demand for apartment building using different methods (the hourly and monthly balance methods), accounting for limit values, (b) Energy demand for office building using different methods (the hourly and monthly balance methods), accounting for limit values.
Energies 14 00564 g007
Figure 8. Model 1 of the building.
Energies 14 00564 g008
Figure 9. Model 2 of the building.
Energies 14 00564 g009
Figure 10. Model 3 of the building.
Energies 14 00564 g010
Figure 11. Operational energy. (a) Operational energy for both building uses with cooling. (b) Operational energy indicators for both building uses with cooling.
Energies 14 00564 g011
Figure 12. Final energy. (a) Final energy for both building uses with cooling, (b) Final energy indicators for both building uses with cooling.
Energies 14 00564 g012
Figure 13. Partial primary energy. (a) Partial primary energy for both building uses with cooling, (b) Primary energy indicator for both building uses with cooling.
Energies 14 00564 g013
Figure 14. Primary energy demand for apartment building (a) and office building (b), equipped with cooling and without cooling.
Energies 14 00564 g014
Figure 15. The primary energy demand of glazings and windows with and without solar blinds for the residential building.
Energies 14 00564 g015
Figure 16. The primary energy demand of glazings and windows with and without solar blinds for the office building.
Energies 14 00564 g016
Figure 17. The final energy demand of glazings and windows with and without solar blinds for the residential building.
Energies 14 00564 g017
Figure 18. The final energy demand of glazings and windows with and without solar blinds for the office building.
Energies 14 00564 g018
Table 1. Heat transfer coefficient U [W/(m2K)] for selected building elements.
Item No.Building ElementU-Value [W/(m2K)]
1 January 2021
1Internal wall ti ≥ 16 °C0.20
2Floor0.30
3Steep/flat roof ti ≥ 16 °C0.15
4Windows ti ≥ 16 °C0.90
5Doors1.30
Table 2. Partial primary energy (EP) coefficient values for the purposes of heating, ventilation and domestic hot water preparation.
Item No.Building TypePartial EPH+W Indicator Values for the Purposes of Heating, Ventilation and Domestic Hot Water Preparation [kWh/(m2annum)]
Since 1 January 2021
1Residential building:
a)
Single-family
70
b)
Multi-family
65
2Accommodation building:75
3Public and commercial building:
a)
healthcare
190
b)
others
45
4Ancillary, storage and production building70
Table 3. Usable floor area schedules for residential and office use.
Residential Use—ApartmentsOffice Use
Car parks529.7 m2529.7 m2
Circulation147.9 m2147.9 m2
Apartments/office units996.0 m2996.0 m2
Total usable floor area 1673.6 m21673.6 m2
Total no. of users6 × 4 persons = 24 persons6 × 17 persons = 102 persons
Occupancy scheduleMon-Fri: 16.00–9.00
Sat–Sun: 24 h
Mon-Fri: 9.00–16.00
Sat–Sun: 0 h
Table 4. Listing of window surfaces for each of the building’s orientations.
Glazing Size for Individual Apartments/Office Premises
Windows on the south-facing façadeWindows on the west- or east-facing façadeWindows on the northern façade
24.4 m2 (58%)13.9 m2 (33%)3.9 m2 (9%)
All windows for a single apartment/office unit = 42.2 m2
Floor area to glazed surface area ratio = 166.0 m2: 42.2 m2 = 3.9
Table 5. Number of heating and cooling hours for different building uses.
ConditionsMulti-Family Residential Building (Hours)Public and Commercial Building—Office Building (Hours)
Heating—no. of hours46606440
Cooling—no. of hours37876146
Table 6. Permissible primary energy indicator values for both functions of the building.
Item No.Partial Primary Energy Indicator Value ConcerningMulti-Family Residential Building (Hours)Public and Commercial Building—Office Building (Hours)
1Heating65 (kWh/m2annum)45 (kWh/m2annum)
2Cooling5 (kWh/m2annum)10 (kWh/m2annum)
3Lighting0 (kWh/m2annum)50 (kWh/m2annum)
Total70 (kWh/m2annum)105 (kWh/m2annum)
Table 7. Calculation results for energy gap to be bridged in order to meet the near-zero energy building (nZEB) requirements, hourly balance method.
AlternativePanel PlacementEnergy Gap Necessary to be Bridged in Order to Meet the Condition Concerning the Maximum Permissible Non-Renewable Primary Energy Demand Indicator as Stipulated in the Polish Building Code [kWh/annum]
Apartment BuildingOffice Building
Alternative 1PV panels placed on flat roof28,66060,588
Alternative 2Additional PV panels placed on the attic wall of the two-part flat roof 18,38450,312
Alternative 3Additional see-through panels placed on the façades027,086
Table 8. Calculation results for energy gap to be bridged in order to meet the nZEB requirements, monthly balance method.
AlternativePanel PlacementEnergy Gap Necessary to Be Bridged in Order to Meet the Condition Concerning The Maximum Permissible Non-Renewable Primary Energy Demand Indicator as Stipulated in the Polish Building Code (kWh/annum)
Apartment BuildingOffice Building
Alternative 1PV panels placed on flat roof011,573
Alternative 2Additional PV panels placed on the attic wall of the two-part flat roof 01297
Alternative 3Additional see-through panels placed on the façades00
Publisher’s Note: MDPI stays neutral with regard to jurisdictional claims in published maps and institutional affiliations.

