1. Introduction
Compressed air as an energy source and its corresponding compressor systems are used in almost every industrial branch. For instance, in the glass industry, it is used at four bar gauge to shape the respective form of various glass jars by blowing the compressed air into a mold where the liquid glass is then formed [
1]. Other applications are in the plastic industry where it conducts various tasks such as transportation of the granules, controlling of cutting processes, or locking of casting molds [
2]. The handling or controlling of production processes uses compressed air for a wide range of pneumatic applications. The minimum configuration of a compressed air system is the compressor itself, some kind of distribution system such as hoses or pipes, and a consumer. Dependent on the application, companies install additional equipment for drying, filtration, storage, valves, or controls to meet the respective requirements.
Although compressed air plays an important role in industry, only little is known about the amount of the total energy consumption for compressed air in different countries or continents. If there are some data available, it is lacking detail, so that the approach used cannot be verified [
3]. In Germany, for example, the working group energy balances provide some numbers, but it remains unclear how they are obtained. In the Energy Balance for Germany, the electric power demand of compressed air accounts for 6.7% of the industrial electric power demand (2017) [
4]. In addition, the electric power demand for the production of compressed air within companies often lacks attention due to more important topics or the unavailability of test equipment. Already in 2001, Radgen and Blaustein illustrated that in compressed air systems, economic energy efficiency potentials of up to 33% are present in a compressed air system [
5]. In this paper, a new key figure for evaluating the performance and energy consumption of the air compressors will be provided as well as a method to gather the respective data.
The purpose of the analysis was to provide a new, simple key figure that can be used to evaluate the efficiency of compressed air systems. It is important to understand that the new key figure is not meant to be a new indicator for thermodynamic efficiency but can provide insights in the operating efficiency of a compressor. Previous research (for example, Radgen and Blaustein, 2001) [
5] focused on the name plate power of air compressors only to evaluate real electric power demand and neglect the operating efficiency of compressors. Throughout the operation and under consideration of the respective compressor technology (piston, screw, etc.), technological losses occur and impact the real electric power consumption. Such losses can stem from friction, insufficient cooling, electrical losses within the motor, or leakage within the compressor block. In addition, these losses can of course vary over time. Saidur et al. stress the importance of focusing on operating conditions, since energy costs contribute to 78% of the life cycle costs in compressed air energy use [
6]. Information on compressed air systems and how to improve them are mainly focused on general information, as shown in Mousavi et al. (2014) [
7]. These publications use the specific energy consumption to assess the systems. Taking the specific energy consumption into account requires the measurement of the flow rate. Measurement of the flow rate not only requires high precision measurement equipment, it is also necessary to perform constructive changes in the compressed air system. Further methods of analysis of compressed air systems also use long-term monitoring of the electric energy consumption in different load stages [
8], mathematical modeling and exergy analysis [
9], or compressed air system audits [
10]. The key figure in this paper helps to estimate the operating efficiency of compressed air production by focusing on the pressure ratio of operating pressure to the maximum design outlet pressure. Since there are very similar pressure levels within industry branches, the key figure can also provide a benchmark to the compressor performance of each company within an industry branch. It could also provide a benchmark figure for national best practice programs such as “Druckluft-effizient” in Germany [
11] or as proposed in New Zealand [
12]. The study focuses on the pressure value, since it is one of the most frequently used indicators defining compressed air systems. Earlier research such as from Kaya et al. [
13] or Kissock [
14] has already covered theoretical saving potentials by reducing the pressure level. Compressor work for isentropic compression in general can be calculated with respect to the pressure level by considering the mass (m), the specific heat capacity (c
p), the entering air temperature (T
1), and the pressure ratio in absolute pressure (p
2/p
1), as it is represented in formula one.
Looking at the formula, the fractional savings of lowering the pressure level can be derived. As stated above, the pressure ratio (p
2/p
1) must be calculated by absolute pressure levels. Assuming an absolute atmospheric pressure of one bar, the formula for fractional savings can be adjusted to gauge pressure (b
g), as shown in formula two.
Looking at the theoretical approach, it becomes clear there is no link to the installed equipment and therefore can make only little contribution to support the evaluation of equipment within the company. This is probably why there is little to no research on the actual electric power consumption and the influences of age, technology, or maximum outlet pressure.
The key figure is called the compressed air electric ratio (CAER) and is defined as the ratio of the real electric power demand of a compressor to its nominal power. With the CAER, the user can easily identify saving potentials such as lowering the pressure level, investing in more efficient systems, or shortening maintenance cycles. It also gives companies the opportunity to compare the compressed air systems in between different facilities within the company as well as different compressors within a production site.
2. Materials and Methods
For measuring the real electric power demand, a three-phase-four-conductors measurement device from Chauvin Arnoux (PEL 103) was used. The device uses three current clamps working on the principle of a Rogowski coil to measure the currents for each single phase. In addition, the voltage of each conductor including the neutral conductor is taken directly. The device is calibrated, and its measurement errors are ±0.5% for current and ±0.2% for voltage.
The analyzed air compressors are located at the University of Stuttgart as well as in different companies throughout the mechanical engineering branch. In total, 34 measurements had been taken on 17 different compressors. An existing dataset of 10 compressors was analyzed as well. Then, the analysis consisted of 24 screw and 4 piston compressors ranging from 5.5 to 160 kW. Since most of the measurements were conducted under a production environment, certain simplifications had to be accepted. Values for air pressure at the compressor outlet, the free air delivery, or the load stage (in %) were obtained from the displays of the compressors. In some cases, the pressure range and its average value needed to be taken into account, since there was no display at all. Only one of the series of measurements could be conducted under laboratory conditions, where pressure and volume flow rate could be measured precisely. All pressure values are given in bar gauge [barg]. Another important value is the pressure ratio of the operating pressure to the maximum compressor outlet pressure. The name plate data from all analyzed compressors had been collected before the measurements. In the following sections, we discuss the different challenges of the measurements for VFD compressors and fixed speed compressors.
2.1. Fixed Speed Compressors
Measuring fixed speed compressors showed not many difficulties. Problems occurred only due to a little number of minutes under full or idle load condition. Another was the lack of time of the responsible technicians to supervise the measurement. The analysis followed the following steps. The compressor data such as age or power rating were collected. The measurement equipment was installed, and the measurement was conducted for at least fifteen minutes. Later, all the data were analyzed, and the three known load conditions of air compressors without speed control were differentiated: full load, idle, and off (noLoad).
The measurement equipment collects a value at each second of the electric power demand. The average, the standard deviation, the highest, and the lowest of these values were documented. The last step was to compare the measured average values of each load condition with the nameplate power rating of the compressor (compare
Table 1).
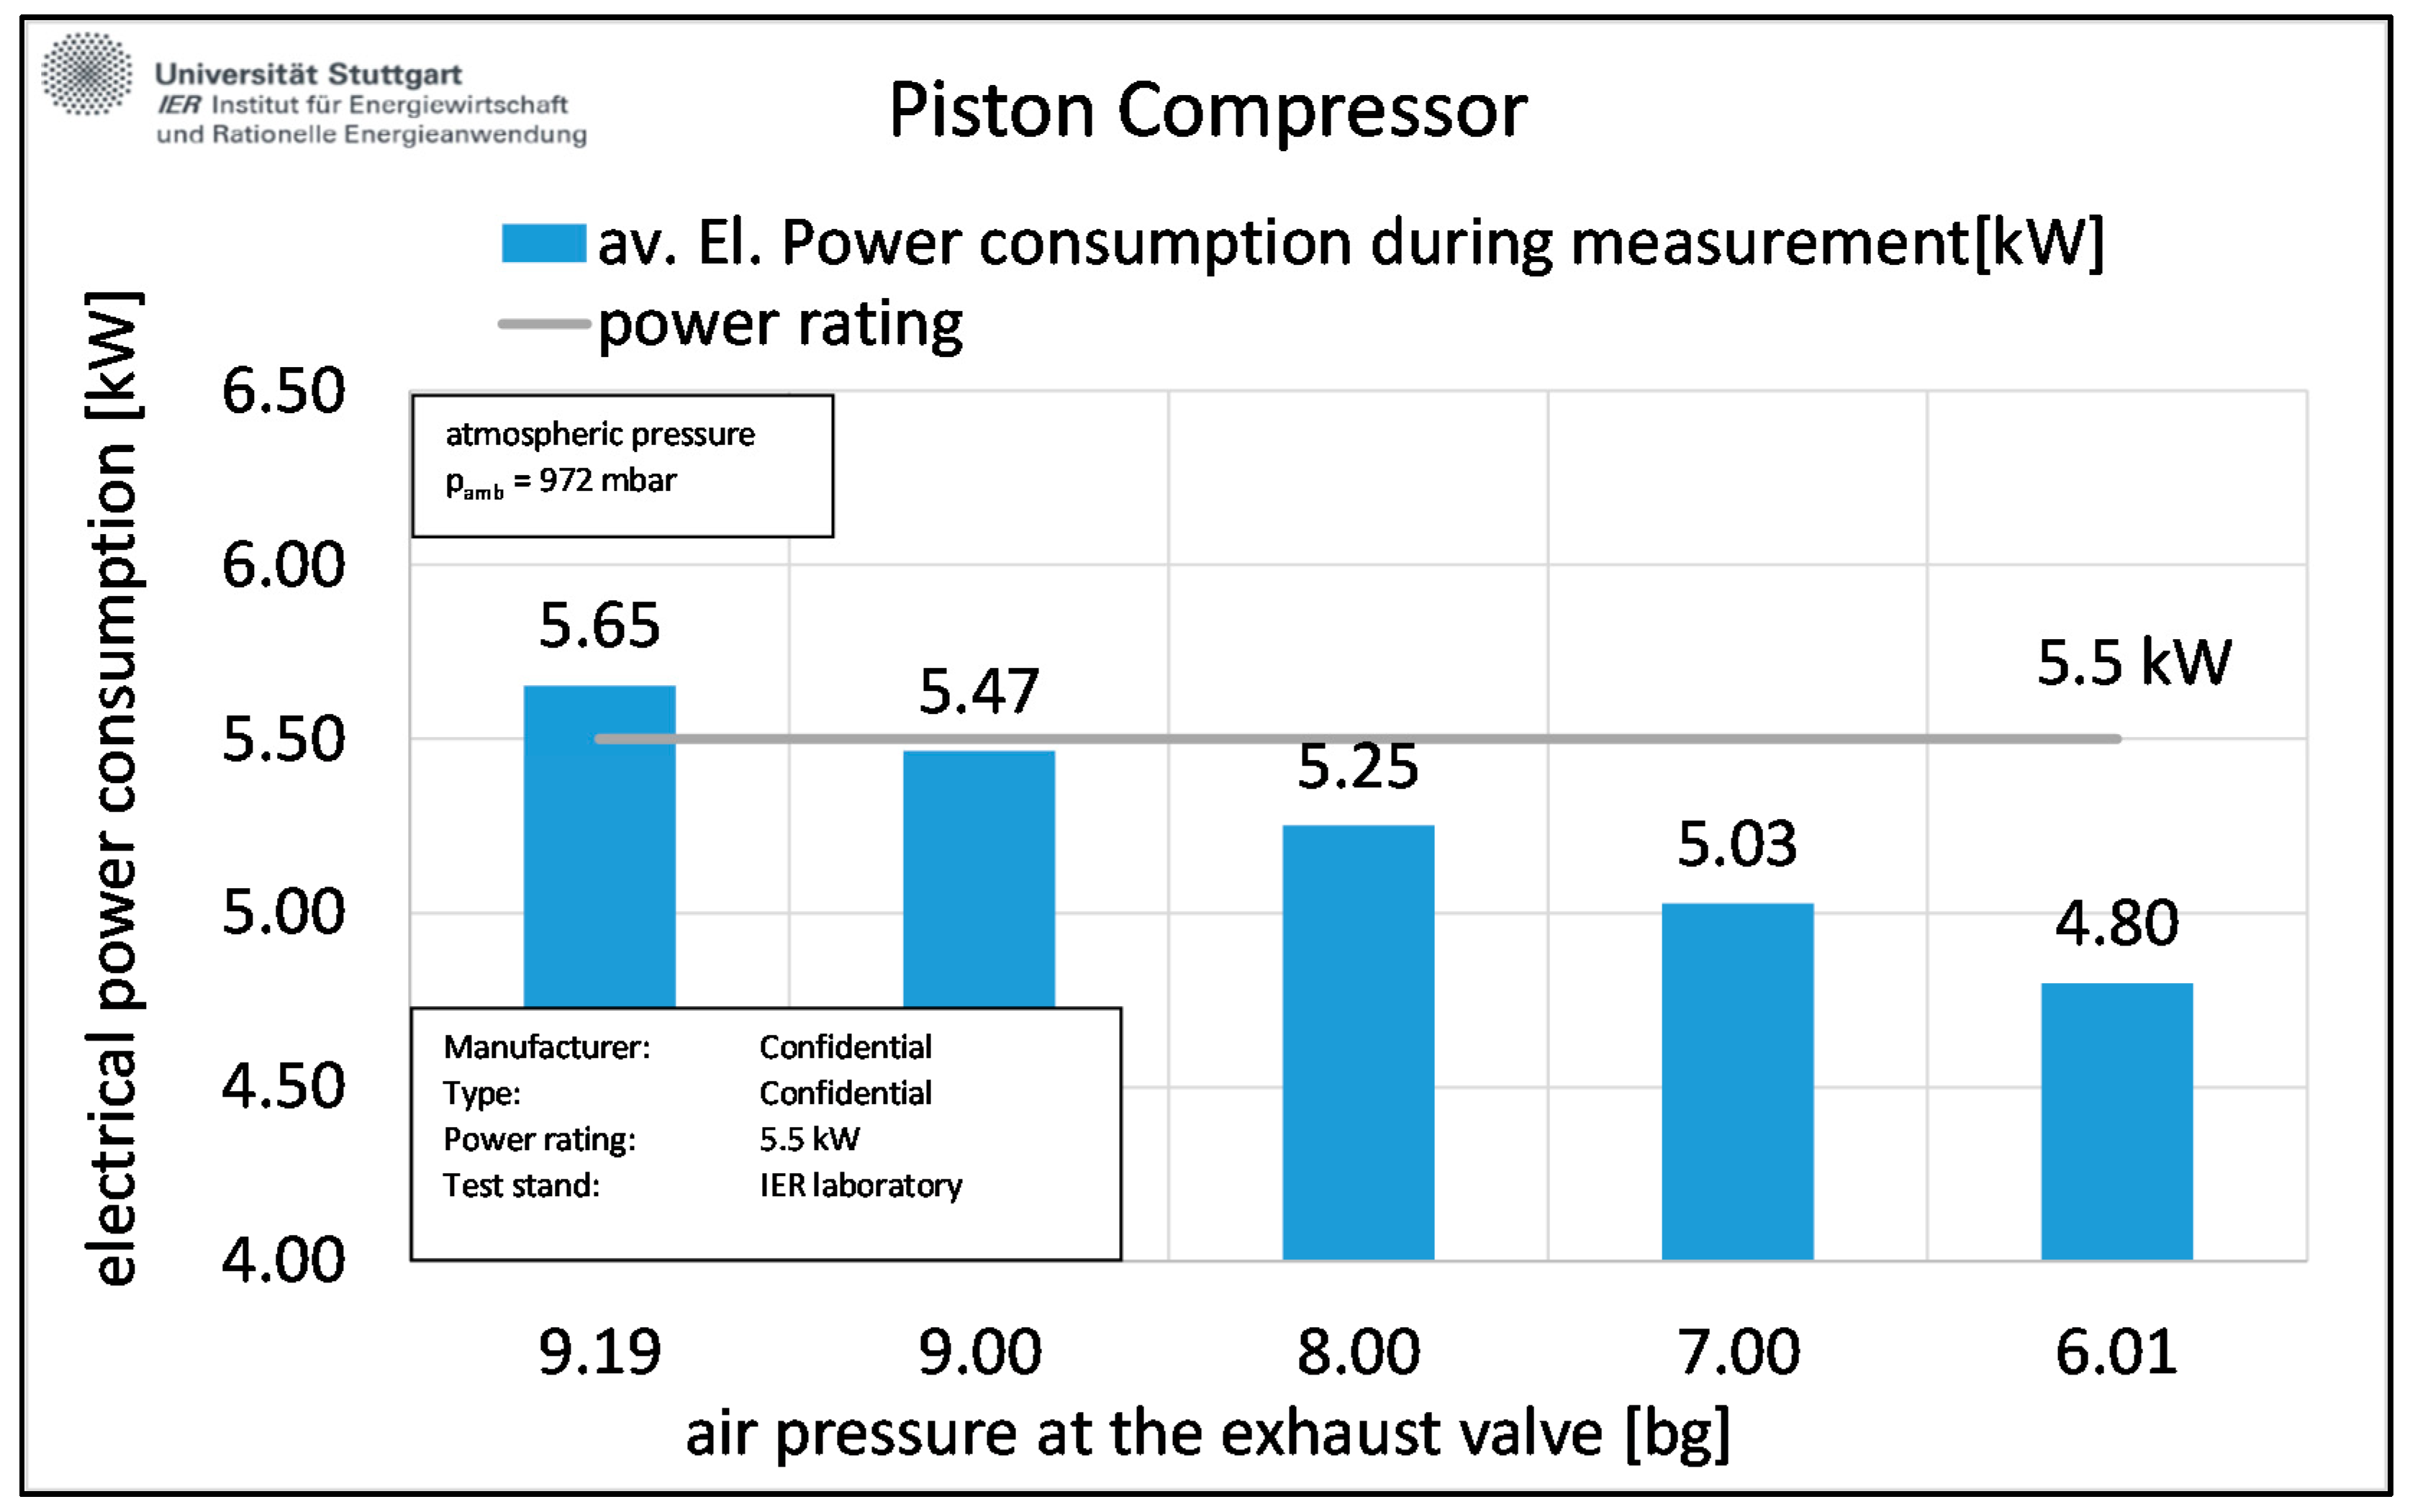
In addition to the measurements in the field, one compressor was measured in a laboratory environment. In this measurement, the pressure of the compressor could be controlled independently and different pressure levels on the same compressor could be compared, in contrast to the field measurements where the pressure could not be changed.
2.2. VFD Compressors
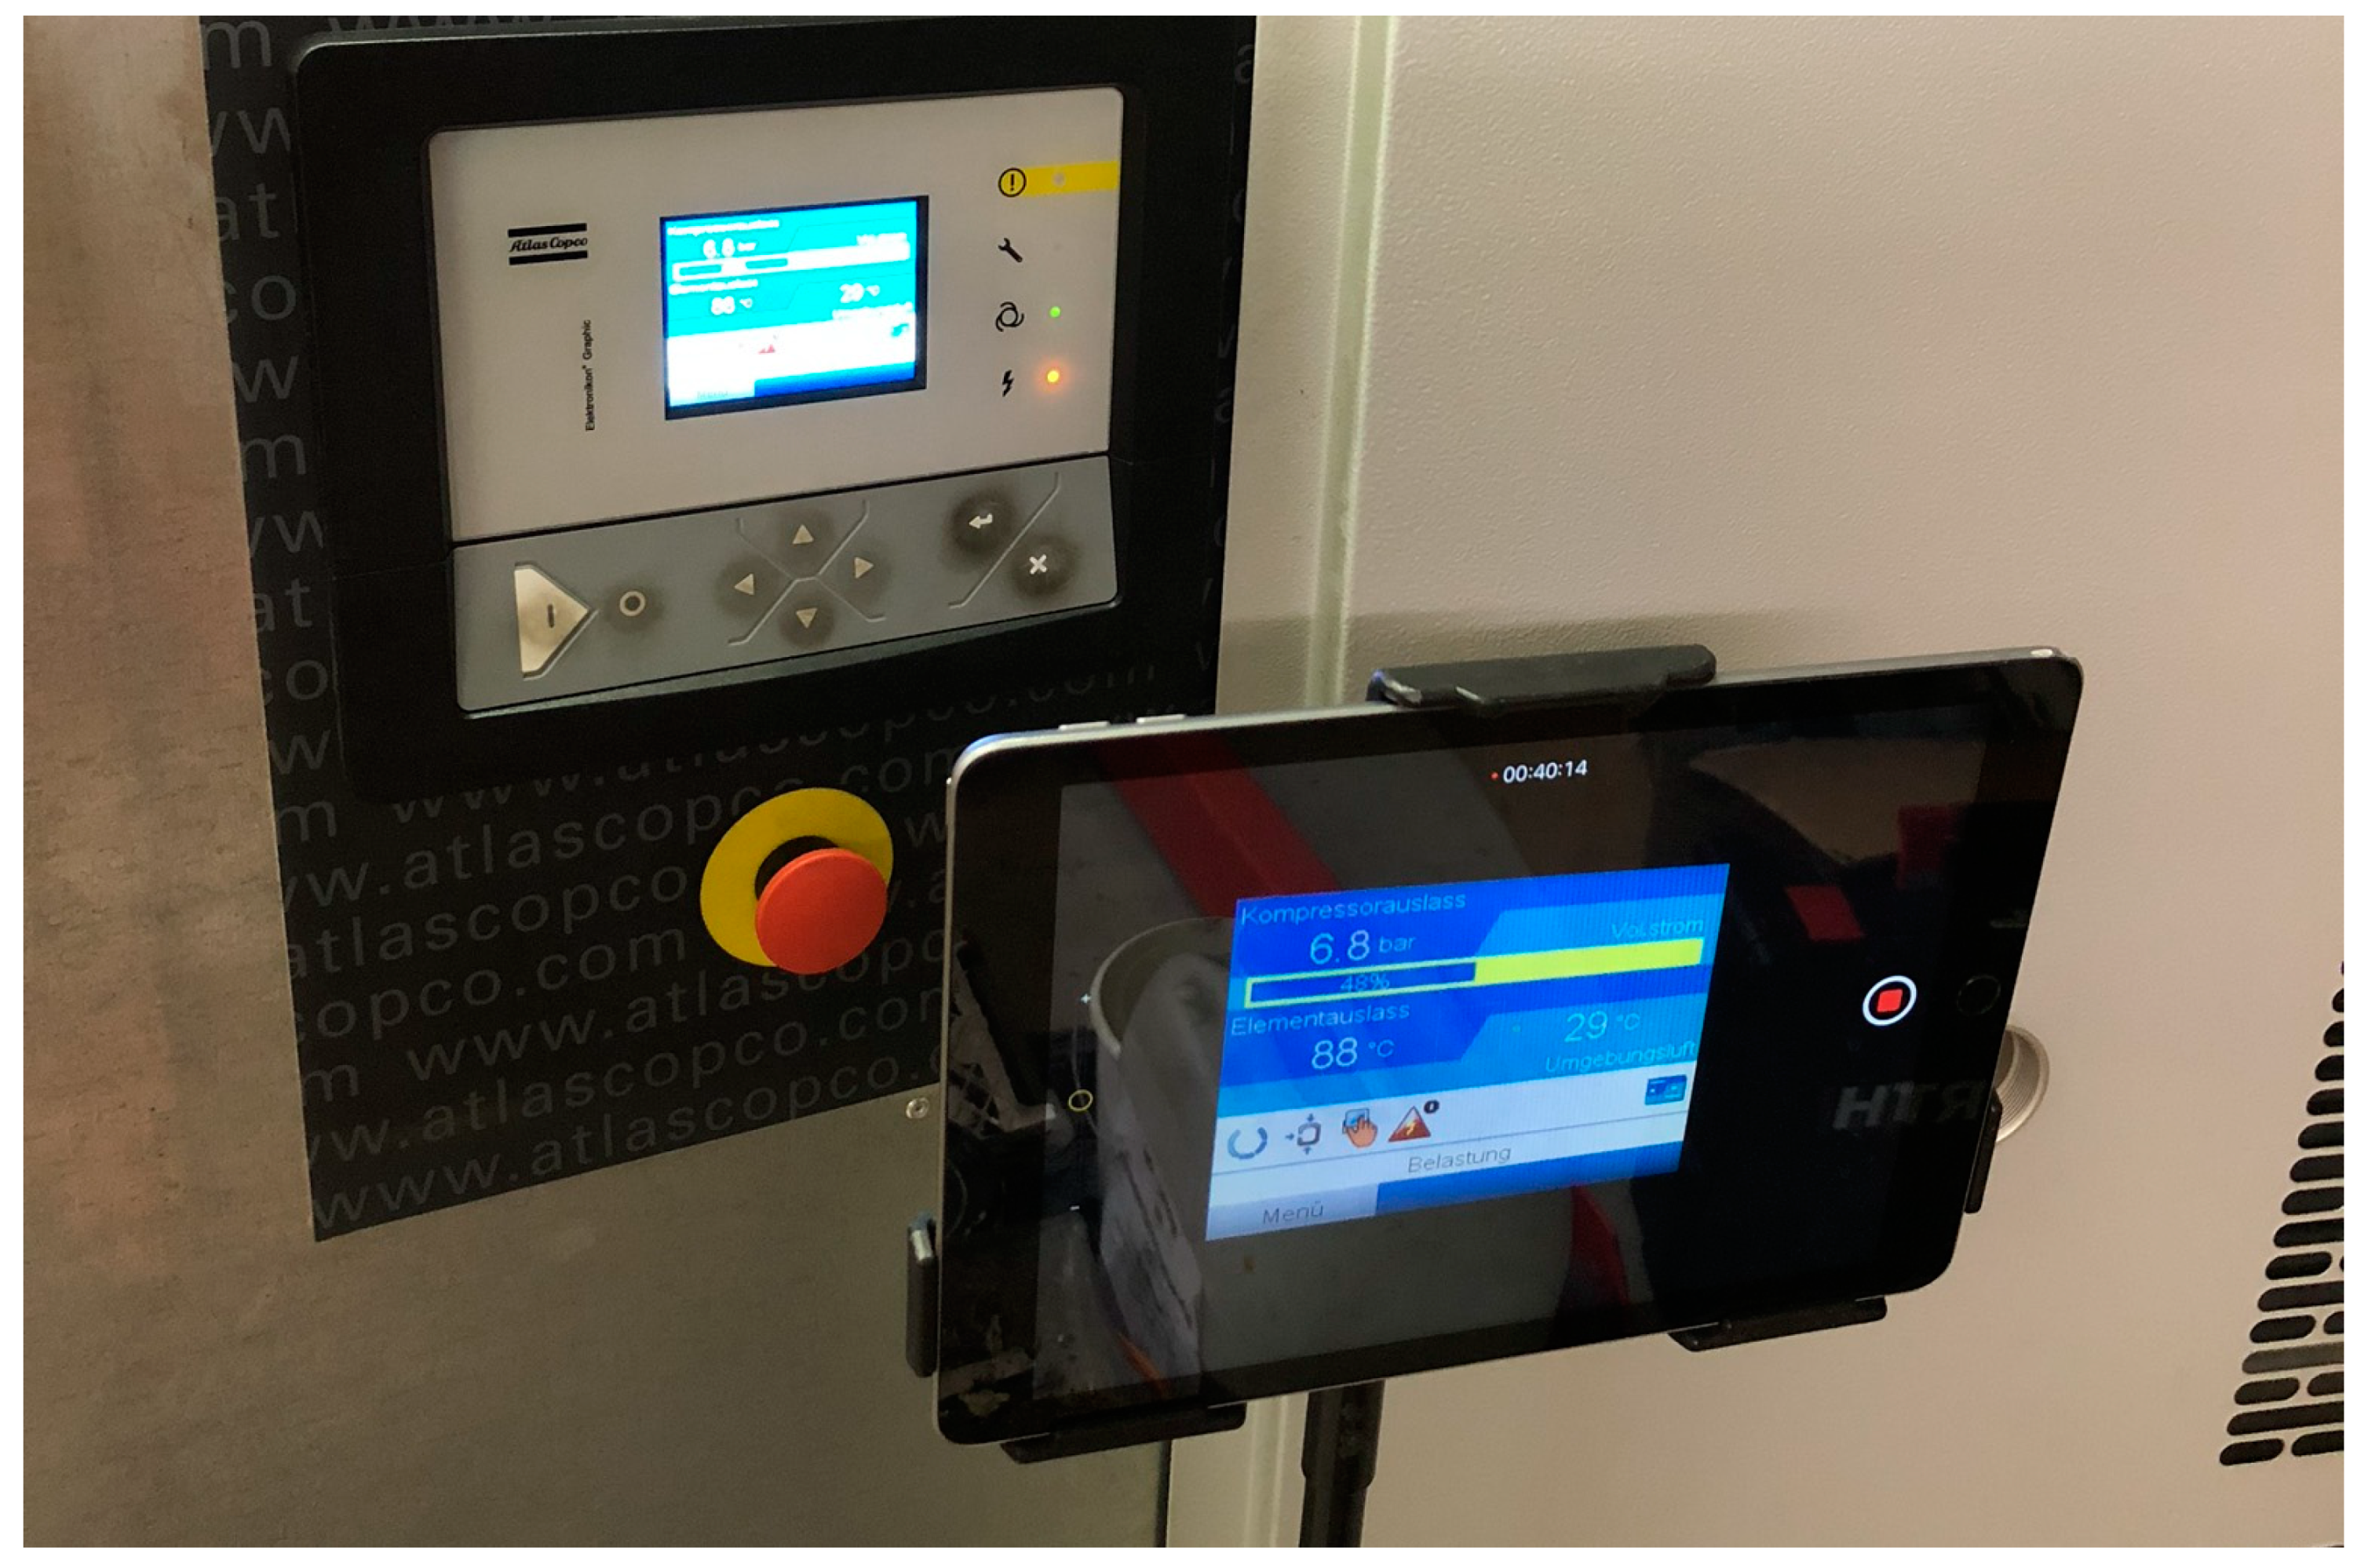
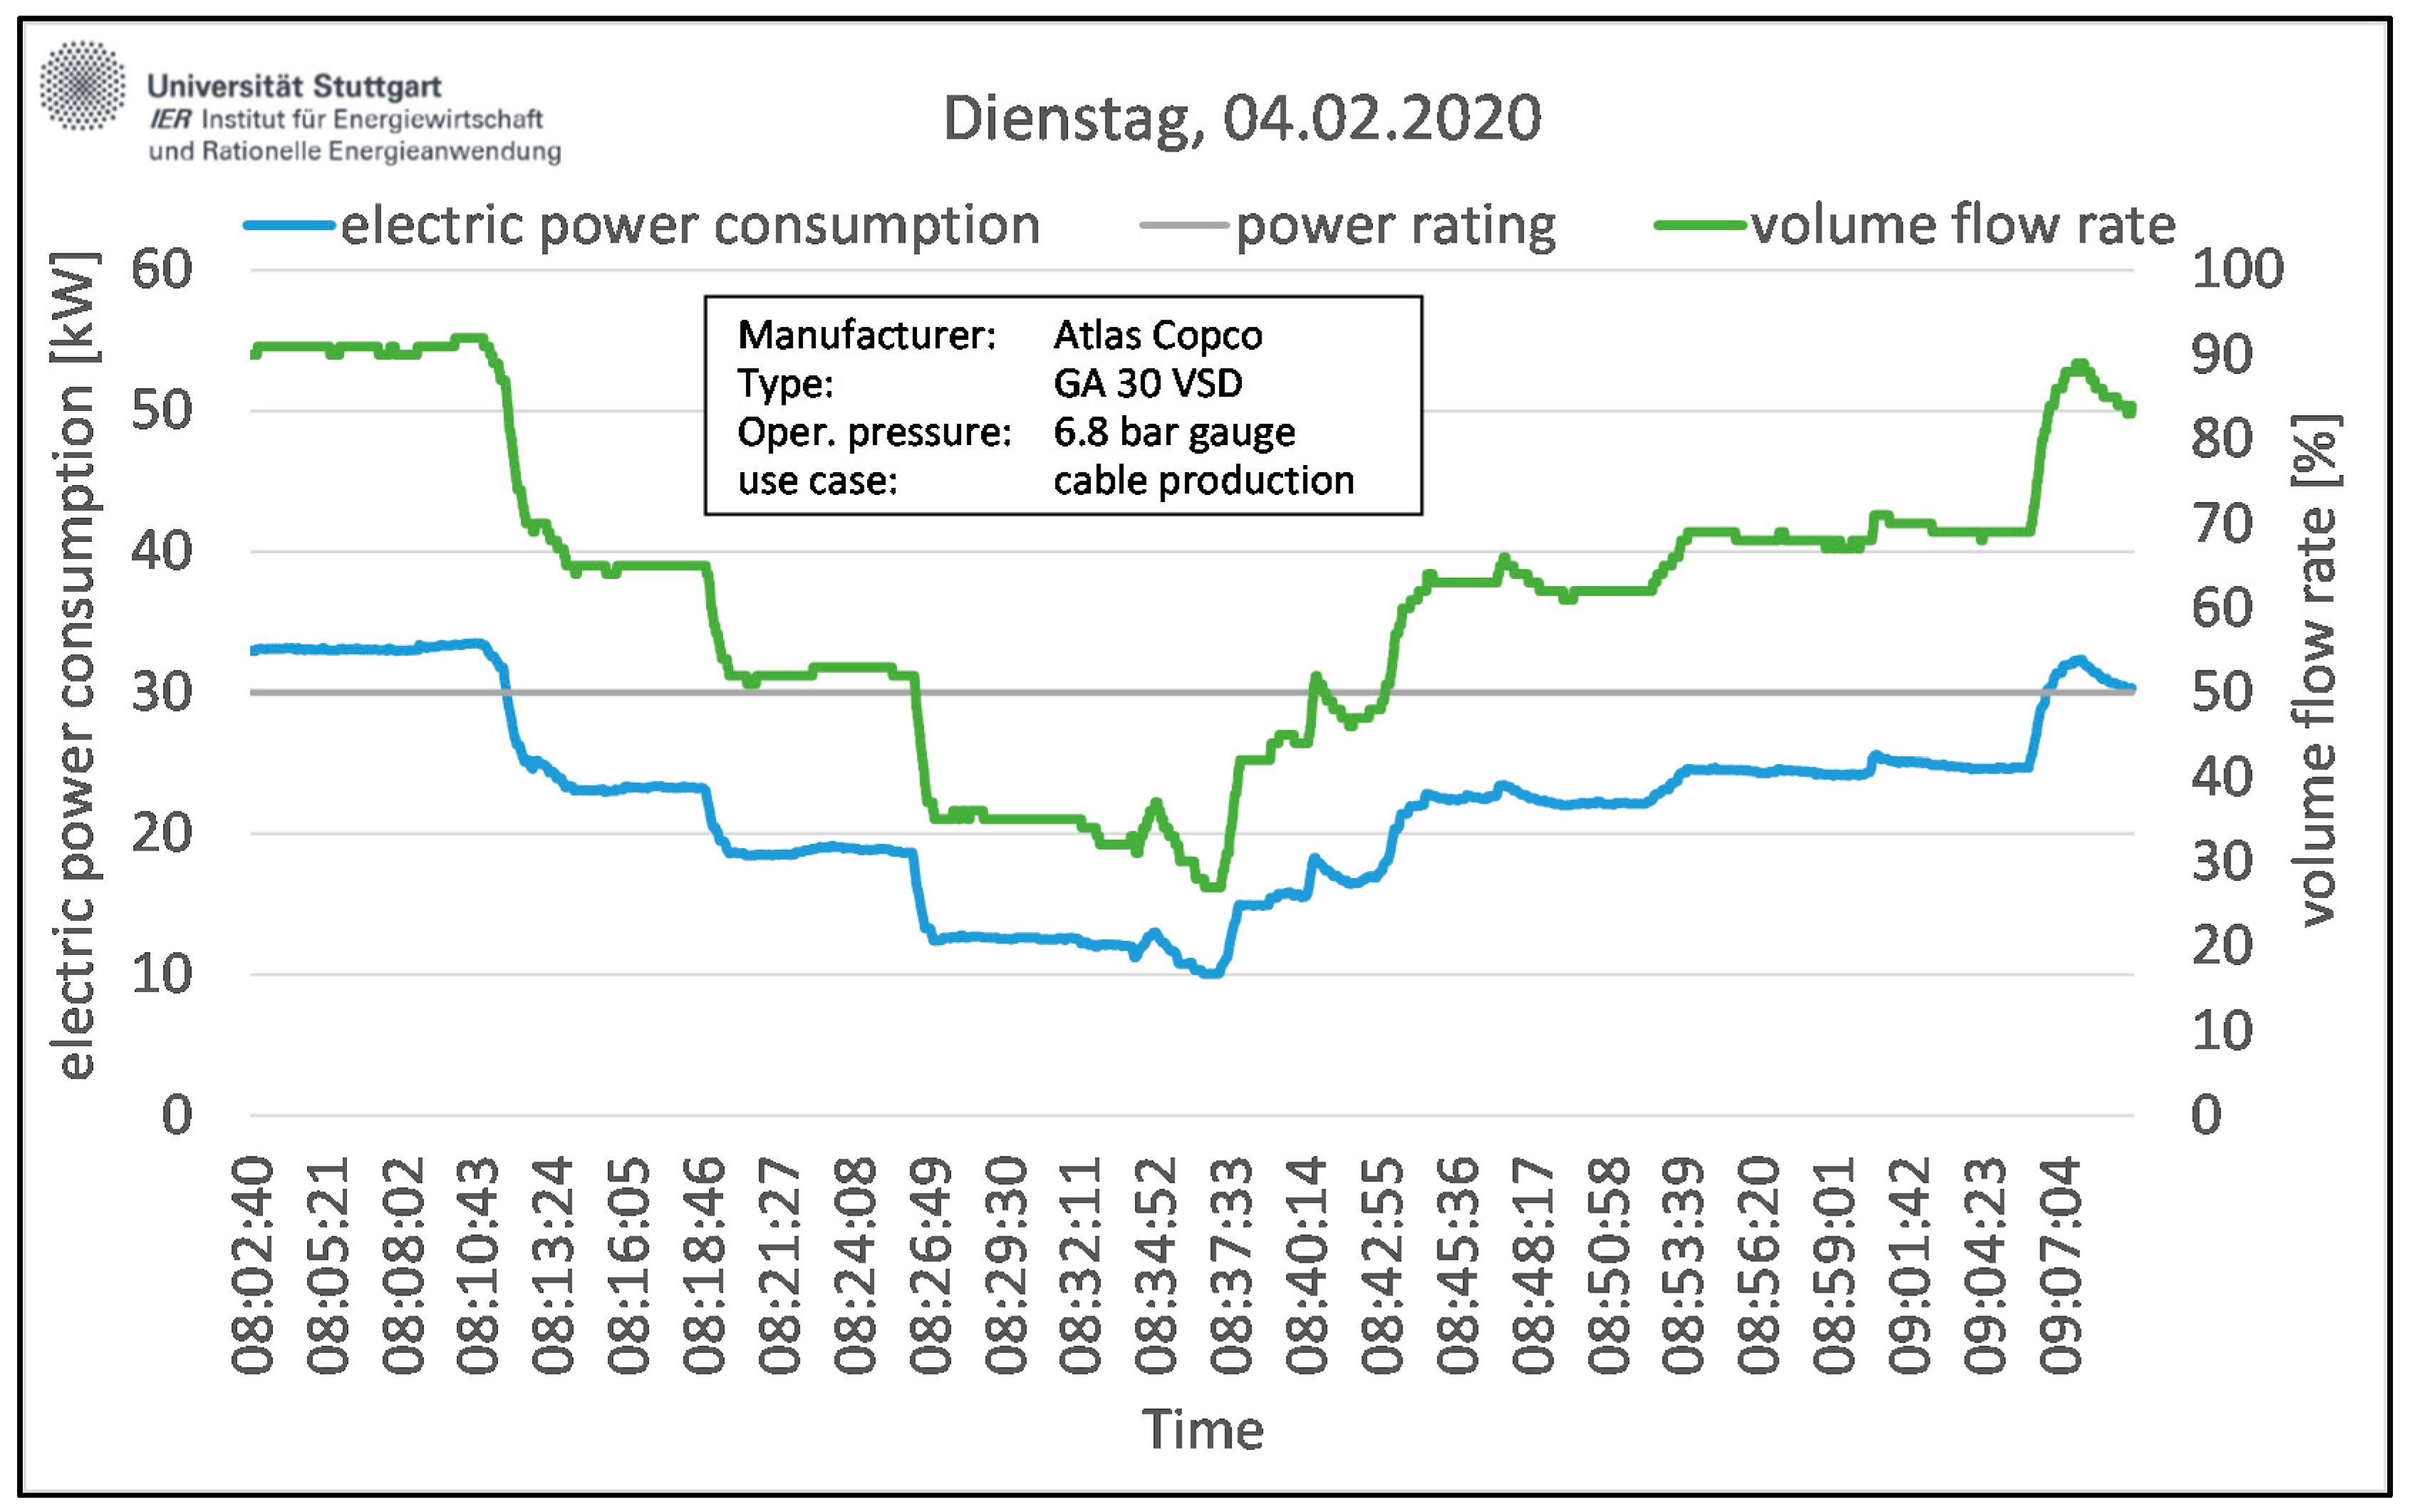
For measuring and interpreting VFD compressors, certain obstacles had to be overcome. The compressors were measured in production environments; therefore, it was not possible to install measuring devices for volume flow rate or shaft speed. Since the loading of the compressor has to be taken into account for comparing electric power demand and power rating, a different approach was required. A portable camera device was used to register the load condition of the compressor shown on the compressor display (see
Figure 1). The combination of the measurements of the electric power demand and the load in values of percentage from the video are presented in
Figure 2.
Then, all the power values for a single load stage were consolidated. The mathematical average, the standard deviation, and range for each load stage were analyzed to verify the data. Power values could be consolidated for every single load stage value from 20 to 99%. When only few data available, groups of percentage values can be merged, for instance in groups of five load percentage values (e.g., 40–45%). Then, the resulting average power values gave the CAER for each load condition of compressors with speed control.
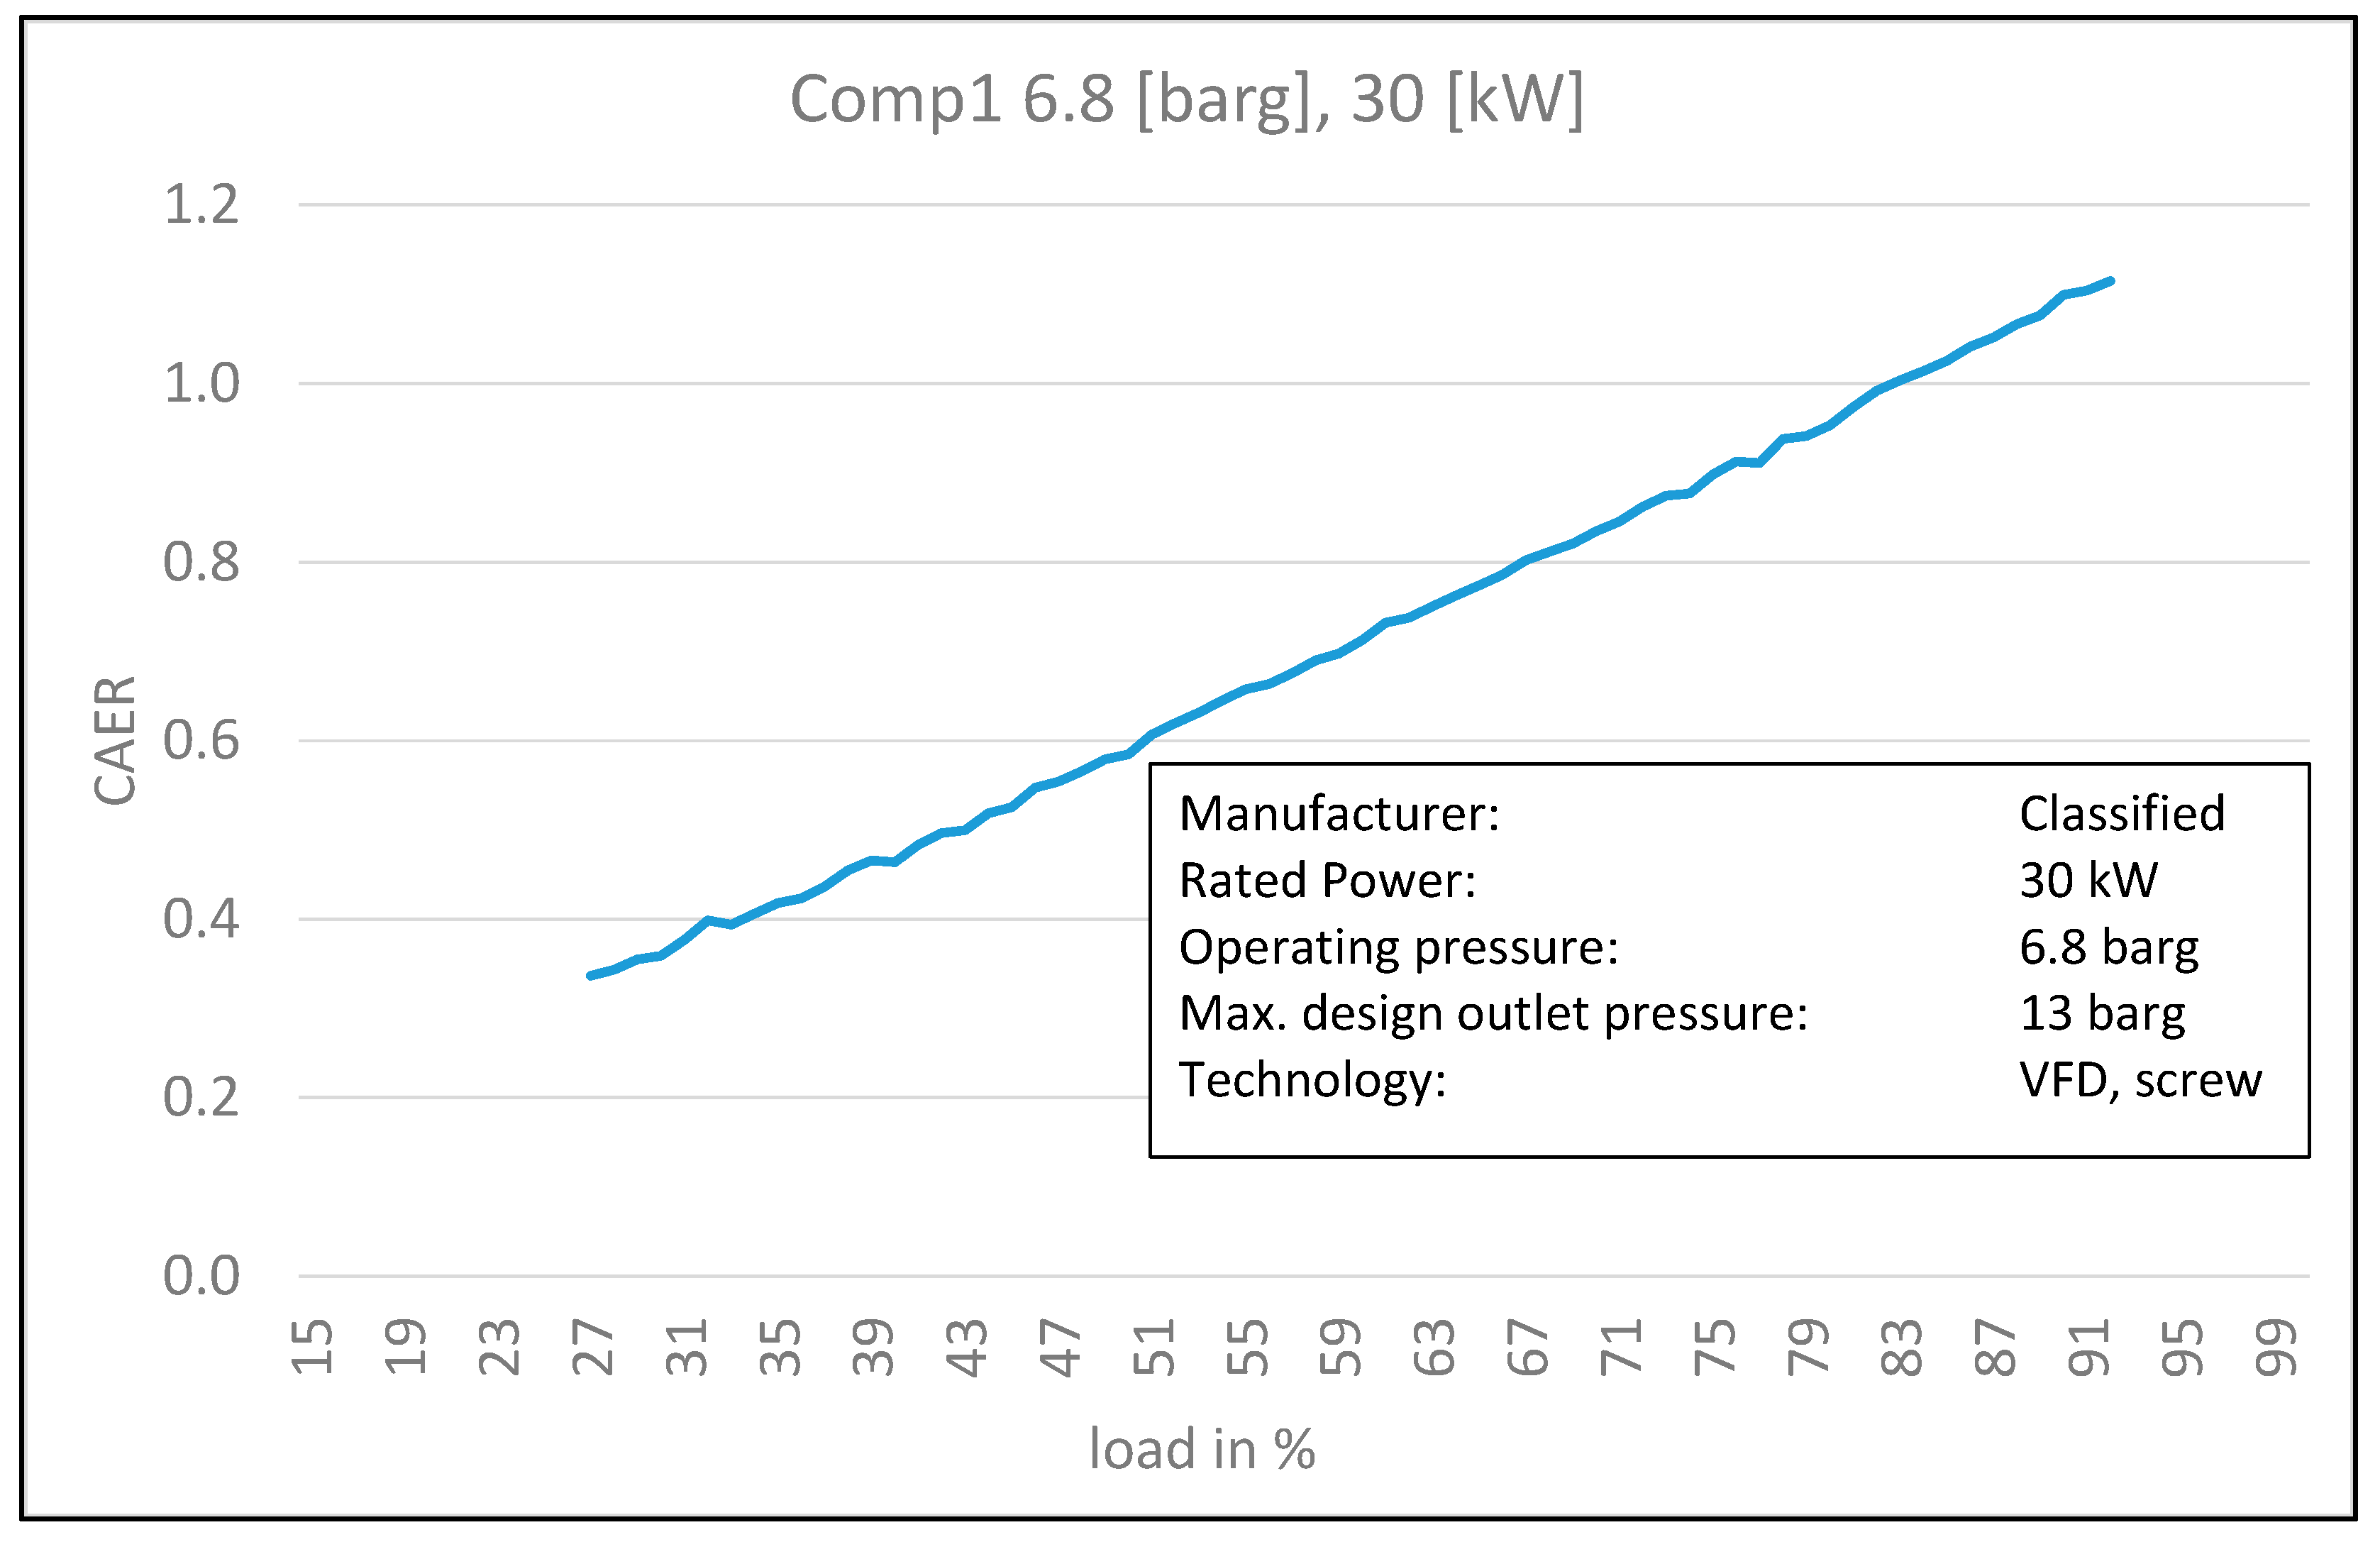
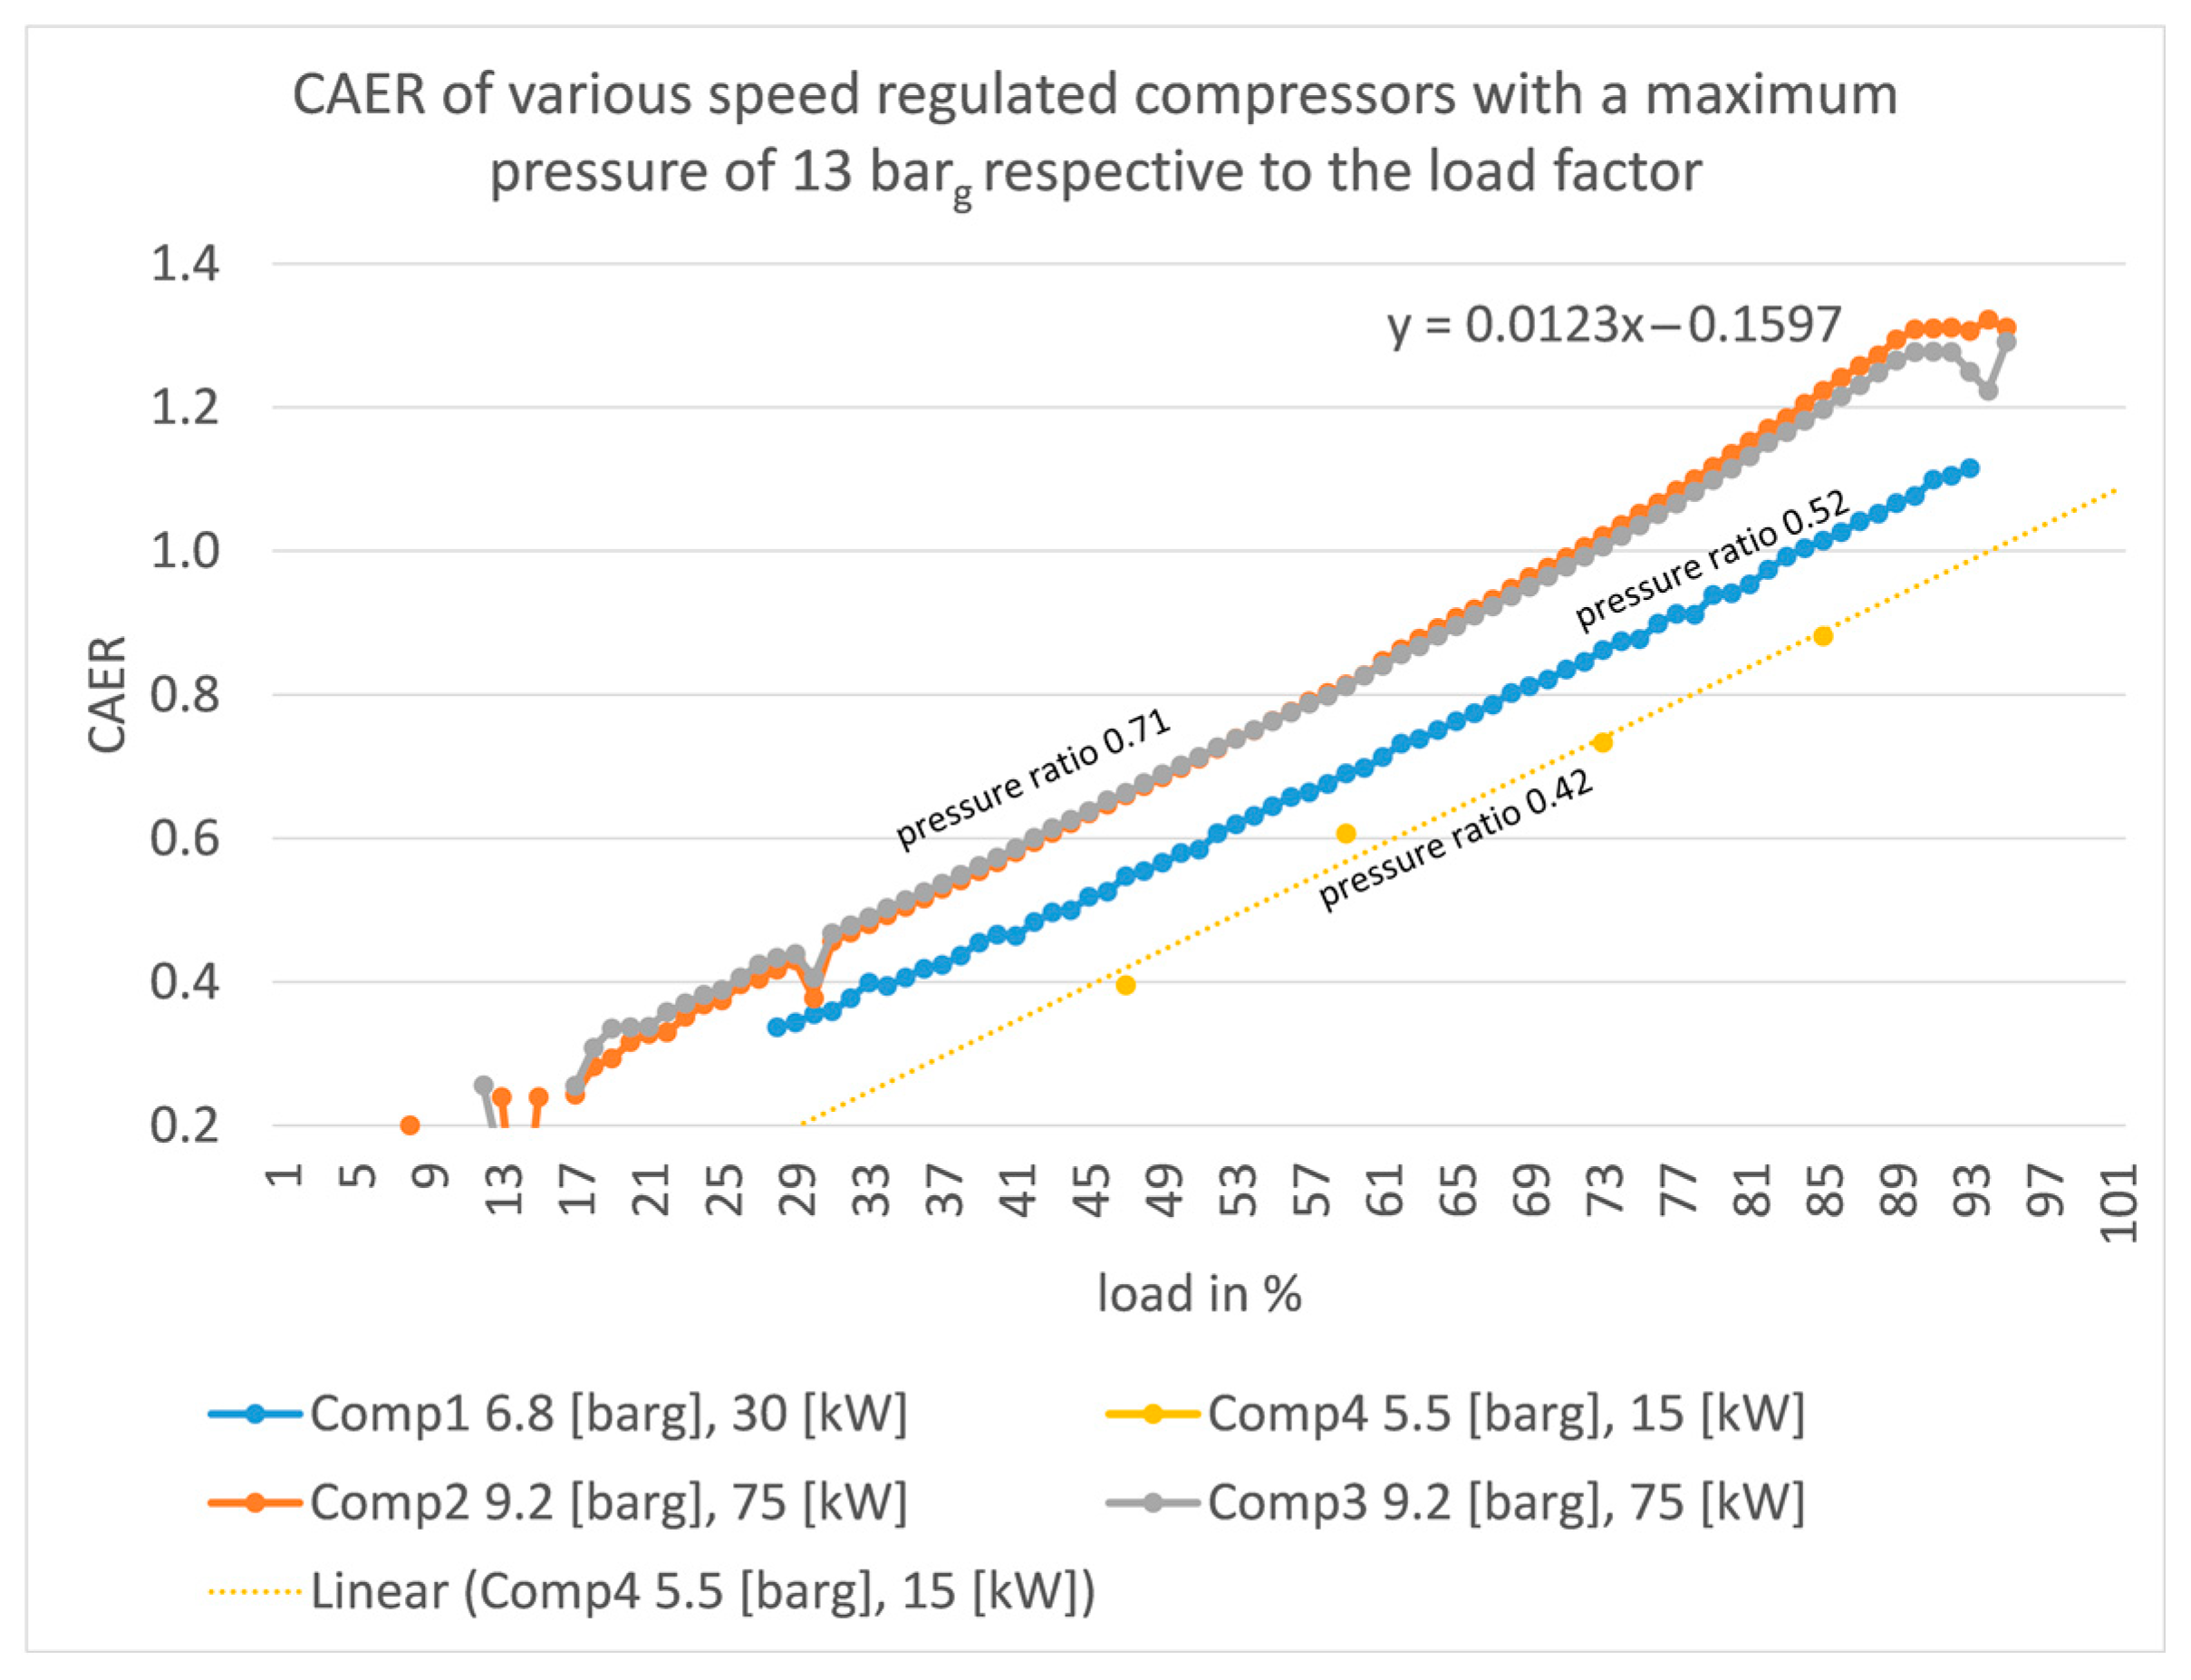
Figure 3 shows the resulting graph of a 30 kW, VFD-controlled screw compressor where there were data for all load stages from 27% up to 92%.
3. Results and Discussion
The variation coefficient for a majority of the data is below 2%. In some cases, higher values up to 10% were also accepted. This concludes that the average value is a good representative of the actual value, since there are few standard deviations. For compressors without speed regulation, the results were as expected. According to the work of Phelan et al., the required power depends on the pressure at the compressor outlet (see
Figure 4) [
13]. Therefore, the CAER for the respective pressure levels are decreasing, as shown in
Table 1.
Since the laboratory compressor is a rather small one, the results in
Table 2 show compressors with higher power ratings. Every line of the table represents one series of measurements, which lasted between 20 min and several days. The measurements were conducted with compressors from six different manufacturers where there are big market players as well as smaller companies. The power ratings range from small compressors with 5.5 kW up to 132 kW. All the measurements were taken in full load conditions. Two series of measurements with 22 kW compressors were conducted in idle condition, and both resulted a CAER of 0.19 and 0.21. In
Figure 5, the results for four different VFD compressors are displayed. Each of the compressors has a maximum outlet pressure of 13 barg.
The analysis shows that the CAER for fixed-speed and VFD compressors can provide interesting insights. For instance, companies are now enabled to easily estimate their compressed energy consumption. The following calculation examples show how companies can profit from the CAER.
Table 3 shows two examples of display information found during the measurements. The information is presented as a simple model for the operating hours showing the amount of hours in each load condition.
If a company operates both a VFD and a fixed speed compressor, it can estimate the electric power demand by using the compressor data, using the 132 kW fixed speed screw compressor from measurement series 15 running at a pressure ratio of 0.58. Using the operating hours model (8760 h per year as a basis) in
Table 3, the electric power demand can be calculated as follows.
The CAERFullLoad is given as 0.9. Together with the mathematical average value for CAERIdleLoad of 0.2 (average value of the two no-load measurements), the electric power demand is 382.8 MWh. The CAER of the no-load condition is 0.
Similar to the calculation of fixed speed compressors, the electric power demand of the VFD compressor can be evaluated but in a more complicated matter. For each load stage, average CAER values have to be calculated, so the following formula can be applied:
To understand the methodology, compressor 4 from
Figure 5 is used. Since there seems to be a linear gradient over the various load stages for VFD compressors, at least two electric measurements have to be executed. For this compressor, the linear regression gives the linear function:
Since
Table 3 gives only ranges of load conditions, the average value of each load range is calculated using the arithmetic average of the respective boarder values. Therefore, the specific CAER values for 20%, 40%, 60%, 80%, and 100% load stage can be calculated (lines 2, 4, 6, 8, and 10), and the average CAER value for each sector can be estimated (lines 1, 3, 5, 7, and 9). The resulting electric power demand of each LoadCluster is finally calculated as shown as in
Table 4 and resulting in an annual total electric power demand of 8634.75 kWh.
4. Future Scope
This research is designed to present the first findings of measurements for the CAER. Since there are many influencing factors yet to be examined, future research should also include centrifugal and other compressor technologies such as scroll or tooth compressors. In addition, the influence of age, different cooling systems, and the differences between all existing compressor technologies must be part of further examinations. The final goal of the research would be a publicly accessible database including all measurements concerning the CAER and make the influence of age, cooling, and technology more transparent to the compressed air consumer.
Since there is a huge variety of electric energy costs, this research neglected a cost-oriented perspective. Future results on research of the CAER could emphasize this topic considering saving potentials for companies and support the decision process for replacing existing equipment.
To simplify or even extend the measurement, the use of clamp-on measurement devices for electric power measurement or air delivery could be examined.
5. Conclusions
The paper identified impact factors on the energy consumption of air compressors. The data show that not only the operating pressure itself but the pressure ratio between the operating pressure level and the maximum capacity pressure level of the compressor seems to influence the CAER. The higher the pressure ratio, the higher the CAER and therefore the higher the electric power demand.
At this stage of the research, several assumptions can be made: For fixed speed compressors, it also seems that the higher the pressure ratio is, the more differentiated the data gets. The pressure ratios 0.6 and 0.8 seem to have similar CAERs with 0.87 and 1.02, respectively. As soon as more data are gathered, the CAER can be a simple key figure to analyze the energy consumption of fixed compressors and the corresponding energy costs.
For VFD compressors,
Figure 5 indicates the impact of the pressure ratio on the electric power demand. With a pressure ratio of 0.71, the CAER is 1 at already 70% to 74% of the load. For VFD compressors, the CAER is given as a linear function, as given in the example above. In this stage of the research, companies with VFD compressors still need to measure at least two load stages to calculate their CAER function. Future research could analyze further compressor types to provide a catalogue of CAER functions to companies.
To verify this assumption and to analyze the influence of different technologies, more series of measurement need to be conducted. This paper shows a first overview over a wider range of power ratings. The next step is to analyze compressors with the same power ratings but different technologies and manufacturers. Further research must then analyze these compressors under different pressure ratios.
The heavy influence of the pressure ratio can also influence the decision processes in companies when reinvesting in new compressors. Since the operating expenses of compressors are often very high compared to its investment, the decision for a compressor with a higher maximum pressure capacity should be taken into account. The CAER also helps to calculate potential savings by lowering the operating pressure level. Using the equations above, companies can calculate the impact of lowering the pressure ratio using the CAER before and after the system change
Another advantage of the CAER is that it gives the opportunity to set a benchmark within companies or industry branches. Even if two compressors are run within the same facility, they can be compared using the CAER.
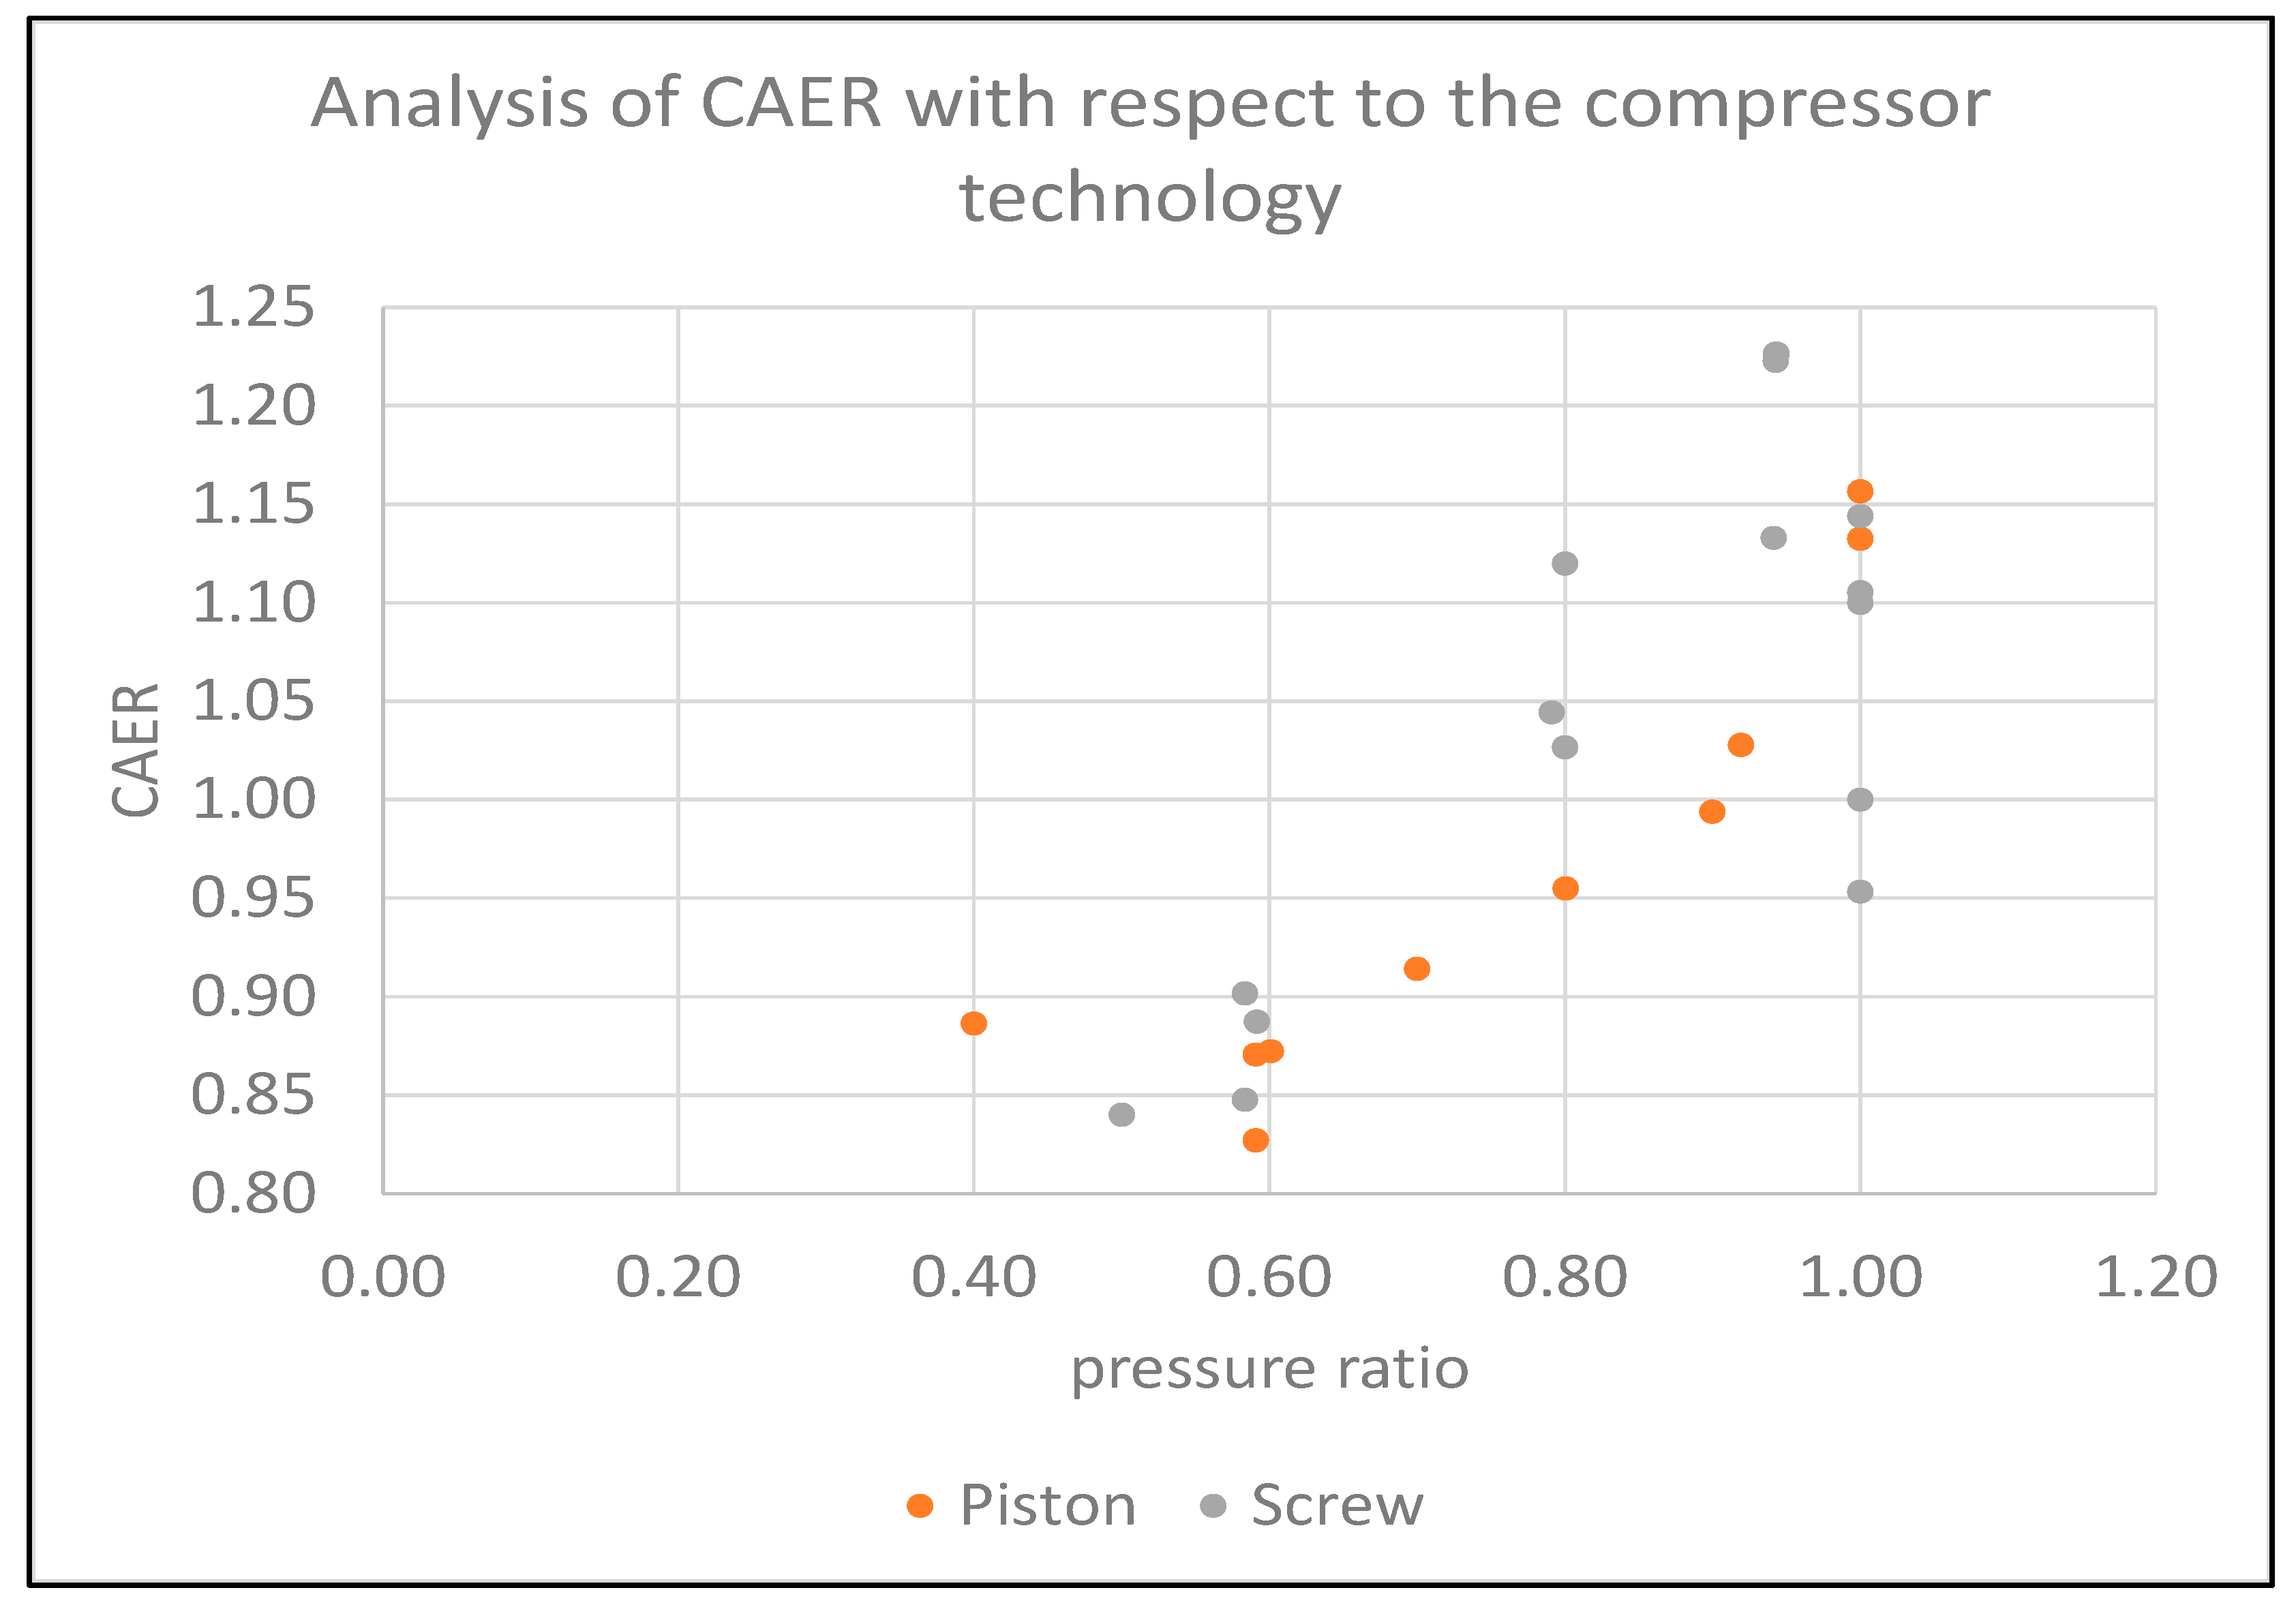
Figure 6 shows how the CAER values even within similar pressure ratios vary, especially the higher the pressure ratio gets. These effects need to be further analyzed but can provide companies an insight of actual differences within its compressor system. Possible differences may result in different ages, different maintenance cycles, another compressor generation with more efficient motors, or the compressor technology.
The CAER can also be a tool to identify the electric power demand of the compressed air in a larger scope than just single companies. Since the pressure levels in some industry branches such as the glass industry are very similar, the CAER together with operating hour models and the installed compressors could help estimate the respective electric power demand of the branch. Up until today, research only focused on name plate values. The CAER can also help to identify the influence of efficiency ratings of different motor generations under operating conditions. In addition, the comparison of different compressed air systems within a branch or a single company can help to identify energy saving potentials.
The methodology of collecting the data showed only few problems. Measuring the full load power consumption of fixed speed compressors is simple and can provide a short analysis of the installed compressors. The fluctuations of the electric power demand are small, and therefore, the time was reduced down to 20 min. After the conducted series of measurements, the target value for CAER in load condition should be at least below 1 for “good” systems and below 0.9 for “excellent” systems. Measuring the idle condition was more problematic, because in production environments, this condition is difficult to create. The presented data show an average value of 0.2. Calculating the CAER of VFD is more complicated especially when the load stages fluctuate very fast. The collection of the load stages via camera display is time consuming but simple.


