Article

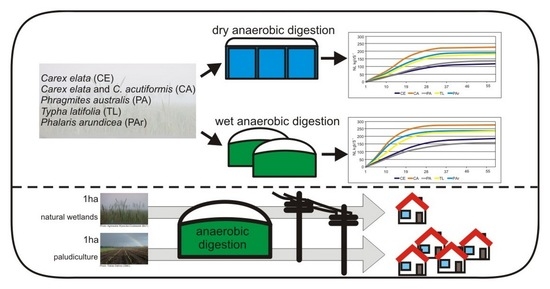
Specific Methane Yield of Wetland Biomass in Dry and Wet Fermentation Technologies

by
Robert Czubaszek
1,*,
Agnieszka Wysocka-Czubaszek
1,
Wendelin Wichtmann
2 and
Piotr Banaszuk
1
1
Faculty of Civil Engineering and Environmental Sciences, Bialystok University of Technology, Wiejska 45A Str., 15-351 Bialystok, Poland
2
Succow Foundation, Partner in the Greifswald Mire Centre, Ellernholzstraße 1, 17489 Greifswald, Germany
*
Author to whom correspondence should be addressed.
Energies 2021, 14(24), 8373; https://doi.org/10.3390/en14248373
Submission received: 9 November 2021 / Revised: 6 December 2021 / Accepted: 8 December 2021 / Published: 12 December 2021
(This article belongs to the Topic Anaerobic Digestion Processes)

Abstract

:
Our study evaluated the specific methane yield (SMY) of selected wetland species subjected to wet and dry anaerobic digestion: Carex elata All. (CE), a mixture (~50/50) of Carex elata All. and Carex acutiformis L. (CA), Phragmites australis (Cav.) Trin. ex Steud. (PA), Typha latifolia L. (TL) and Phalaris arundinacea L. (PAr). Plants were harvested in late September, and therefore, the study material was characterised by high lignin content. The highest lignin content (36.40 ± 1.04% TS) was observed in TL, while the lowest (16.03 ± 1.54% TS) was found in CA. PAr was characterised by the highest hemicellulose content (37.55 ± 1.04% TS), while the lowest (19.22 ± 1.22% TS) was observed in TL. Cellulose content was comparable in almost all plant species studied and ranged from 25.32 ± 1.48% TS to 29.37 ± 0.87% TS, except in PAr (16.90 ± 1.29% TS). The methane production potential differed significantly among species and anaerobic digestion (AD) technologies. The lowest SMY was observed for CE (121 ± 28 NL kgVS−1) with dry fermentation (D–F) technology, while the SMY of CA was the highest for both technologies, 275 ± 3 NL kgVS−1 with wet fermentation (W–F) technology and 228 ± 1 NL kgVS−1 with D–F technology. The results revealed that paludi-biomass could be used as a substrate in both AD technologies; however, biogas production was more effective for W–F. Nonetheless, the higher methane content in the biogas and the lower energy consumption of technological processes for D–F suggest that the final amount of energy remains similar for both technologies. The yield is critical in energy production by the AD of wetland plants; therefore, a promising source of feedstock for biogas production could be biomass from rewetted and previously drained areas, which are usually more productive than natural habitats.

Graphical Abstract

1. Introduction

Environmental problems caused by the depletion of natural resources, elevated greenhouse gas (GHG) emissions, loss of biodiversity, and growing demand for energy, food, and space are the main challenges for humankind in this century. Extensive fossil fuel combustion is a primary source of GHG. It results in widespread and rapid changes in the atmosphere, ocean, cryosphere, and biosphere, affecting weather and climate extremes in every region across the globe [1]. A contribution to solving climate change and biodiversity loss is using biomass for energy production [2]. Nowadays, the demand for biomass is increasing globally. However, the EU’s Green Deal priorities and the EU’s green recovery may substantially impact the biomass market, forcing it to be adapted to environmental, social, and economic sustainability in Europe and worldwide. According to the World Energy Outlook Special Report [3], 570 Mtoe of biogas can be produced from the feedstock available for sustainable production. Still, only a fraction (35 Mtoe) is generated today. Complete utilization of sustainable potential could cover around 20% of worldwide gas demand.
Energy crops have been no longer considered as an environmentally sound energy source in recent years. Their expanded cultivation has been proven to cause biodiversity loss and increased competition for the land area for food and fodder [4,5]. Energy crops (primarily maize) provide about half of the biogas production [6]; however, their cultivation is associated with the risk of increased erosion, N2O emissions, and eutrophication. High-yielding maize requires a substantial supply of nutrients, especially nitrogen, and significant external inputs of energy, mainly coming (in mechanized production) from fossil fuels [7]. These factors entail the social opposition to biogas production from maize; therefore, diversification of the feedstock used in biogas plants may be an essential factor in improving their acceptance [8]. The disadvantages of production of renewables are even more significant when cultivation takes place on drained peatlands or organic soils. In this case, in addition to the problems mentioned above, there are very high emissions of CO2 that result from the mineralization of the aerated peat [9].
Numerous studies indicate the need to reduce energy biomass to industrial and municipal waste, sewage sludge, and biomass from landscaping and vegetation management in nature-protected areas and rewetted peatlands [10]. A new source of feedstock may be biomass from biotopes management and paludiculture [11] (i.e., agriculture and forestry on wet and rewetted peatlands): Phragmites australis, Typha spp., and sedges [12]. A current publication confirmed that there is significant mitigation potential from rewetting and changing to paludiculture, as the total greenhouse gas emissions are reduced remarkably, approximately by 70–80%, compared with agricultural use of drained peatlands [13]. Furthermore, there is great potential to remove nutrients from the peatlands through harvesting and thus reduce pollution of the run-off water [14]. A disadvantage of harvesting wet and rewetted peatlands is the limited trafficability of the terrain, which requires the use of special harvesting technology [15]. On the other hand, most of these peatlands need regular mowing, including removal of the biomass to preserve sites for the promotion of adapted biodiversity [16], which makes it particularly important that sensible utilisation of the biomass produced is possible.
The biomass yield harvested from less productive natural wetland habitats is usually lower than that obtained from paludiculture in rewetted peatlands, which are often considered to be highly productive habitats [14]. The biomass can be converted into energy in various ways. One of the directions may be the production of biochar, which, compared with fresh biomass, has a higher energy density and thus a higher calorific value. As a result, it is a promising energy vector used in combustion and gasification processes [17]. Another exciting and sustainable option is anaerobic digestion (AD), which delivers energy and a digestate that can be applied as a valuable organic soil fertilizer. Recent studies on biogas production from wetland plants demonstrated a specific methane yield (SMY) ranging from 102 to 412 NL CH4 kgVS−1, depending on the harvest time, plant species, and part of the plant subjected to digestion [18,19,20], while both SMY and biomass yield are mainly determined energy per area. The wetland biomass varies depending on the species composition, habitat fertility, and harvest time. A wide range of biomass yield from 3 up to even 41 tDM ha−1 is typical for Phragmites australis, partly because of the local conditions and partly due to genetically fixed differences between populations. In general, the above-ground biomass of common reed in Europe increases from north to the south [21]. However, other authors have shown Phragmites australis yields of between 5 and 16 tDM ha−1 [22,23,24]. Typha latifolia and Phragmites australis on rewetted peat and mineral soils produce up to 10–30 tDM ha−1 biomass [14]. Most studies have revealed that the aboveground biomass of Phalaris arundinacea ranges from 5 to 10 tDM ha−1, depending on the fertilization rate [25,26,27] and weather conditions [28]. According to Hartung et al. [24], in paludiculture conditions, the yield of Phalaris arundinacea can reach 15 tDM ha−1. The yields of Carex elata are highly variable and range from 3.7 tDM ha−1 in less productive mossy variants of Caricetum elatae communities to 9.9 tDM ha−1 in highly productive habitats [29]. Maucieri et al. [20] noted the yield of Carex acutiformis to be between 4.8 and 15.7 tDM ha−1.
Anaerobic digestion of wetland biomass can be performed in wet (W–F; up to 10% of total solids TS) or dry conditions (D–F; TS usually between 15 and 35%). Recent research revealed advantages of the D–F for processing wetland biomass, especially late-mown sedges and reed, characterised by a high dry matter and fibre content. When fermentation takes place in a discontinuous or batch-wise process (garage fermenter), it is easier to operate, does not need the additional power for stirring and shredding, and therefore requires lower energy inputs [30]. Dry fermentation technology avoids the problem of foam formation, sedimentation, and surface crusting, and often does not require the size reduction of feedstock or the removal of inert materials and plastics [31,32]. Despite various process parameters and the feedstock, the core communities of microorganisms in digesters operating under dry and wet conditions are similar [33]. The methane yield in both technologies is comparable at the laboratory scale [34] and the industrial scale [35]. Vogel et al. [36] found dry fermentation of landscape material to be more effective than combined dry–wet fermentation. Biogas yield from dry fermentation (percolation system, retention time: 30 days) amounted to 540–750 NL kgVS−1. A comparison of nine plants with anaerobic digestion operating with wet and dry technology and fed mainly with food and green wastes revealed wet AD plants to have a more favourable energy balance and economic performance. In contrast, dry AD plants offered greater flexibility in the type of feedstock accepted, shorter retention times, reduced water use, and more flexible management of and opportunities for marketing the end-product [37].
This study aimed to evaluate the specific methane yield (SMY) of selected wetland species subjected to wet and dry anaerobic digestion.

2. Materials and Methods

2.1. Biomethane Potential Test

2.1.1. Inoculum and Substrates

The inoculum was collected from a digestate storage tank of a mesophilic agricultural biogas plant that processed maize silage, with 10–20% of food and agricultural wastes. The inoculum was degassed at a temperature of 38 °C. The inoculum for the dry fermentation experiment was centrifuged at 3500 rpm for 30 min. The liquid fraction was discarded, and the solid part was used for the experiment.
The plant material was collected in September 2019 from a natural wetland. Late mowing was an extensive vegetation manipulation aiming to reproduce and maintain the former species composition and recover the diverse species composition that existed before secondary plant succession, especially Phragmites australis and Salix spp. The following species were included in the research: Carex elata All. (CE), a mixture (~50/50) of Carex elata All. and Carex acutiformis L. (CA), Phragmites australis (Cav.) Trin. ex Steud. (PA), Typha latifolia L. (TL), and Phalaris arundinacea L. (PAr). Plants after harvest were cut in 2–4 cm pieces and ensilaged without additives.

2.1.2. The Experimental Set-Up

Wet Fermentation

We measured the biomethane potential (BMP) of wet fermentation in a batch assay using the OxiTop system (WTW, Weilheim, Germany). The OxiTop bottles with a total volume of 1 L and a working volume of 287 mL were incubated at the temperature of 38 ± 1 °C in a thermostatic incubator. The bottles were filled with 200 mL of the inoculum, and wetland plant silage was added at a ratio of 2:1 VSinoculum to VSsubstrate. Distilled water was added to obtain total solids (TS) of 5% in the reactors. Bottles with 200 mL of inoculum and water were used as a control. The bottles were flushed with nitrogen for 2 min to maintain anaerobic conditions. Batch BMP trials were conducted in triplicate.

Dry Fermentation

The ensilaged plant material was tested for specific methane yield in a dry fermentation system. The batch assay was performed in eudiometers. The bottles with a total volume of 1 L were incubated at the temperature of 38 ± 1 °C in a water bath. The bottles were filled with 200 g of solid inoculum with TS of 11.91 ± 0.15%, and wetland plant silage was added at a ratio of 1:1 VSinoculum to VSsubstrate. Bottles with 200 g of the inoculum were used as control. The bottles were purged with nitrogen gas for 2 min to ensure an anaerobic environment. Batch BMP trials were conducted in triplicate.

2.1.3. Chemical Analyses

In substrates, inocula, and digestates, the total solids (TS) and volatile solids (VS) were measured. In substrates and inocula, the pH, total Kjeldahl nitrogen (TKN), total phosphorus (TP), potassium (K), and organic carbon (TOC) content were also determined. The TS content was determined by drying the biomass to a constant weight at 105 °C, and VS content was determined after incineration at 550 °C for 5 hours in a muffle furnace according to standard methods [38]. TKN was determined by the Kjeldahl method in the Vapodest 50 s analyser (Gerhardt, Königswinter, Germany). After nitric acid/hydrogen peroxide microwave digestion in ETHOS One (Milestone s.r.l., Milan, Italy), the content of P was determined by the ammonium metavanadate method using a UV-1800 spectrophotometer (Shimadzu, Kyoto, Japan). The K content was measured using flame photometry (BWB Technology, Newbury, UK). TOC content was determined in the TOC-L analyser with SSM-5000A Solid Sample Combustion Unit (Shimadzu, Kyoto, Japan).
The crude fibre (CF), neutral detergent fibre (NDF), acid detergent fibre (ADF), and acid detergent lignin (ADL) of the plant samples were analysed with the FibreBag system (Gerhardt, Königswinter, Germany). Cellulose was calculated as the difference between ADF and ADL, and hemicelluloses as the difference between NDF and ADF. The ADL was considered to be lignin, assuming that the fraction of lignin-bound nitrogen is negligible. All the analyses were run in triplicate. All the results are given on a dry weight basis.

2.1.4. Biogas Calculations

In the OxiTop experiment, biogas production was continuously measured based on pressure changes in the reactor by the OxiTop measuring head. In eudiometers, the volume of biogas was measured by confining liquid displacement. The portable biogas analyser DP-28BIO (Nanosens, Tarnowo Podgórne, Poland) was used to measure the composition of the biogas, which was sampled with 20-mL gas-tight glass syringes. The measurements were performed every day during the first 10 days of the experiment and then twice weekly. The SMY was calculated as NL CH4 kgVS−1 (NL = normal litre, i.e., gas volume corrected to 0 °C and 1.013 bar).
The kinetics of methane production were determined using the modified Gompertz model [39]:
G = × e x p { e x p [ R m a x × e G 0 )   +   1 }
where:
G(t)—cumulative methane production at specific time t (mL);
G0—methane production potential (mL);
Rmax—maximum methane production rate (mL day−1);
λ—duration of lag phase (minimum time to produce methane) (days);
t—cumulative time for methane production (days);
e—mathematical constant (2.71828).
Based on the plotted curves, the time (days) when 50% (T50) and 95% (T95) of the possible methane had been reached was determined.

2.2. Statistical Analysis

One-way ANOVA was used to test the statistical differences in the chemical composition of substrates and the differences in methane production among plants processed by one technology at the accepted statistical significance level of p < 0.05. The statistical differences in methane production between two different technologies for each substrate were analysed with Student’s t-test at the accepted statistical significance level of p < 0.05. All the statistical analyses were performed using STATISTICA 12 software (StatSoft, Kraków, Poland).

2.3. Energy Calculations

Energy calculations were performed for two scenarios: energy production from the AD of less productive wetland plants harvested from natural habitats, and highly productive wetland plants from paludiculture on rewetted peatlands. The energy generated was calculated for wet (W–F) and dry fermentation (D–F) systems. The calculations used SMY, which was determined during laboratory tests. In W–F, thermal energy consumption in the biogas plant was assumed to be 30%, and electricity use was considered to be 9% of produced energy. In D–F, the overall energy consumption in the biogas plant was presumed to be 5% of produced energy. Biogas was converted to electricity and heat in the CHP unit in both technologies. The CHP unit’s electrical and thermal conversion efficiency was assumed to be 38% and 43%, respectively.
The amount of energy obtained from wetland biomass through direct combustion was determined based on the average net calorific value of the analysed plants (16.73 GJ tDM−1), which was calculated from data reported in the literature [40,41,42,43,44,45,46,47,48]. An operational moisture of biomass of 15% was taken from Roos [49], and the efficiency of the biomass boiler was assumed to be 80%. To calculate the calorific value at the operational moisture (optimal for biomass combustion), the following formula was used [50]:
Q n e t ,   O M   = Q n e t ,   D M   × 100 O M 100 0.02443 × O M
where:
Qnet,OM—the net calorific value as received (at operating moisture) (MJ kg−1);
Qnet,DM—the net calorific value in dry matter (MJ kg−1);
OM—the operating moisture content (wt%, wet basis);
0.02443—the correction factor of the enthalpy of vaporisation for water at 25 °C (MJ kg−1 per 1% of moisture).
Energy production per 1 hectare for low-productivity wetland plants was calculated based on the BMP results and yields measured during the biomass harvest in 2019. The yields were equal to 6.8, 2.1, 8.6, 5.0, and 5.6 tDM ha−1 for CE, CA, PA, TL, and PAr, respectively. Calculations for high-productivity habitats were based on yields taken from Hartung et al. [24]. Energy generation per 1 ha was compared with that of maize, which yield was taken from Statistics Poland [51].

3. Results

3.1. Characteristics of the Inocula and Substrates

The chemical composition of the inocula differed significantly. The inoculum used for the wet fermentation experiment was characterised by lower TS, VS, and TOC but higher TKN and K content. In contrast, the TP in both inocula was similar and amounted to around 9.5 g kgDM−1 (Table 1). Typically, a solid fraction of the digestate contains 25–35% of TKN, 55–65% of TP, and 60–70% of TOC [52]. Significant differences were found for wetland biomass. We measured the highest TS in CE and PA. VS content ranged from 91.82 ± 0.19% TS in PA to 95.50 ± 0.25% TS in CE. All studied plants differed significantly (p < 0.05) in N, P, and K content; only TOC was similar in all the plant material (Table 1). Significantly (p < 0.05) lower TS characterised CA and TL.
The highest crude fibre (44.06 ± 0.23% TS) and lignin (36.40 ± 1.04% TS) content was observed in TL, while hemicellulose content was the lowest (19.22 ± 1.22% TS). The cellulose concentration in Typha was similar to that in CA, CE, and PA. Carex elata was lowest in crude fibre (32.43 ± 1.46% TS), while its lignin (20.79 ± 2.82% TS) was similar to that of PA and PAr. Cellulose content was comparable in almost all plant species and ranged from 25.32 ± 1.48% TS to 29.37 ± 0.87% TS (Table 2). The exception was TL, where cellulose was significantly lower and averaged 16.90 ± 1.29% TS (p < 0.05).
Organic matter degradation is a valuable indicator of AD efficiency. Both wet and dry AD resulted in TS and VS reductions; however, higher values were obtained by D–F technology. In W–F BMP, the TS reduction was the lowest for CE (16.6%) and PA (18.8%) and was the highest for CA (21.1%) and TL (20.6%), while VS reduction ranged from 19.7% for PA to 26.9% for PAr. Digestate collected from D–F BMP was characterised with TS reductions from 17.1% for CE to 28.8% for CA and VS reductions from 13.1% for CE to 29.3% for CA.

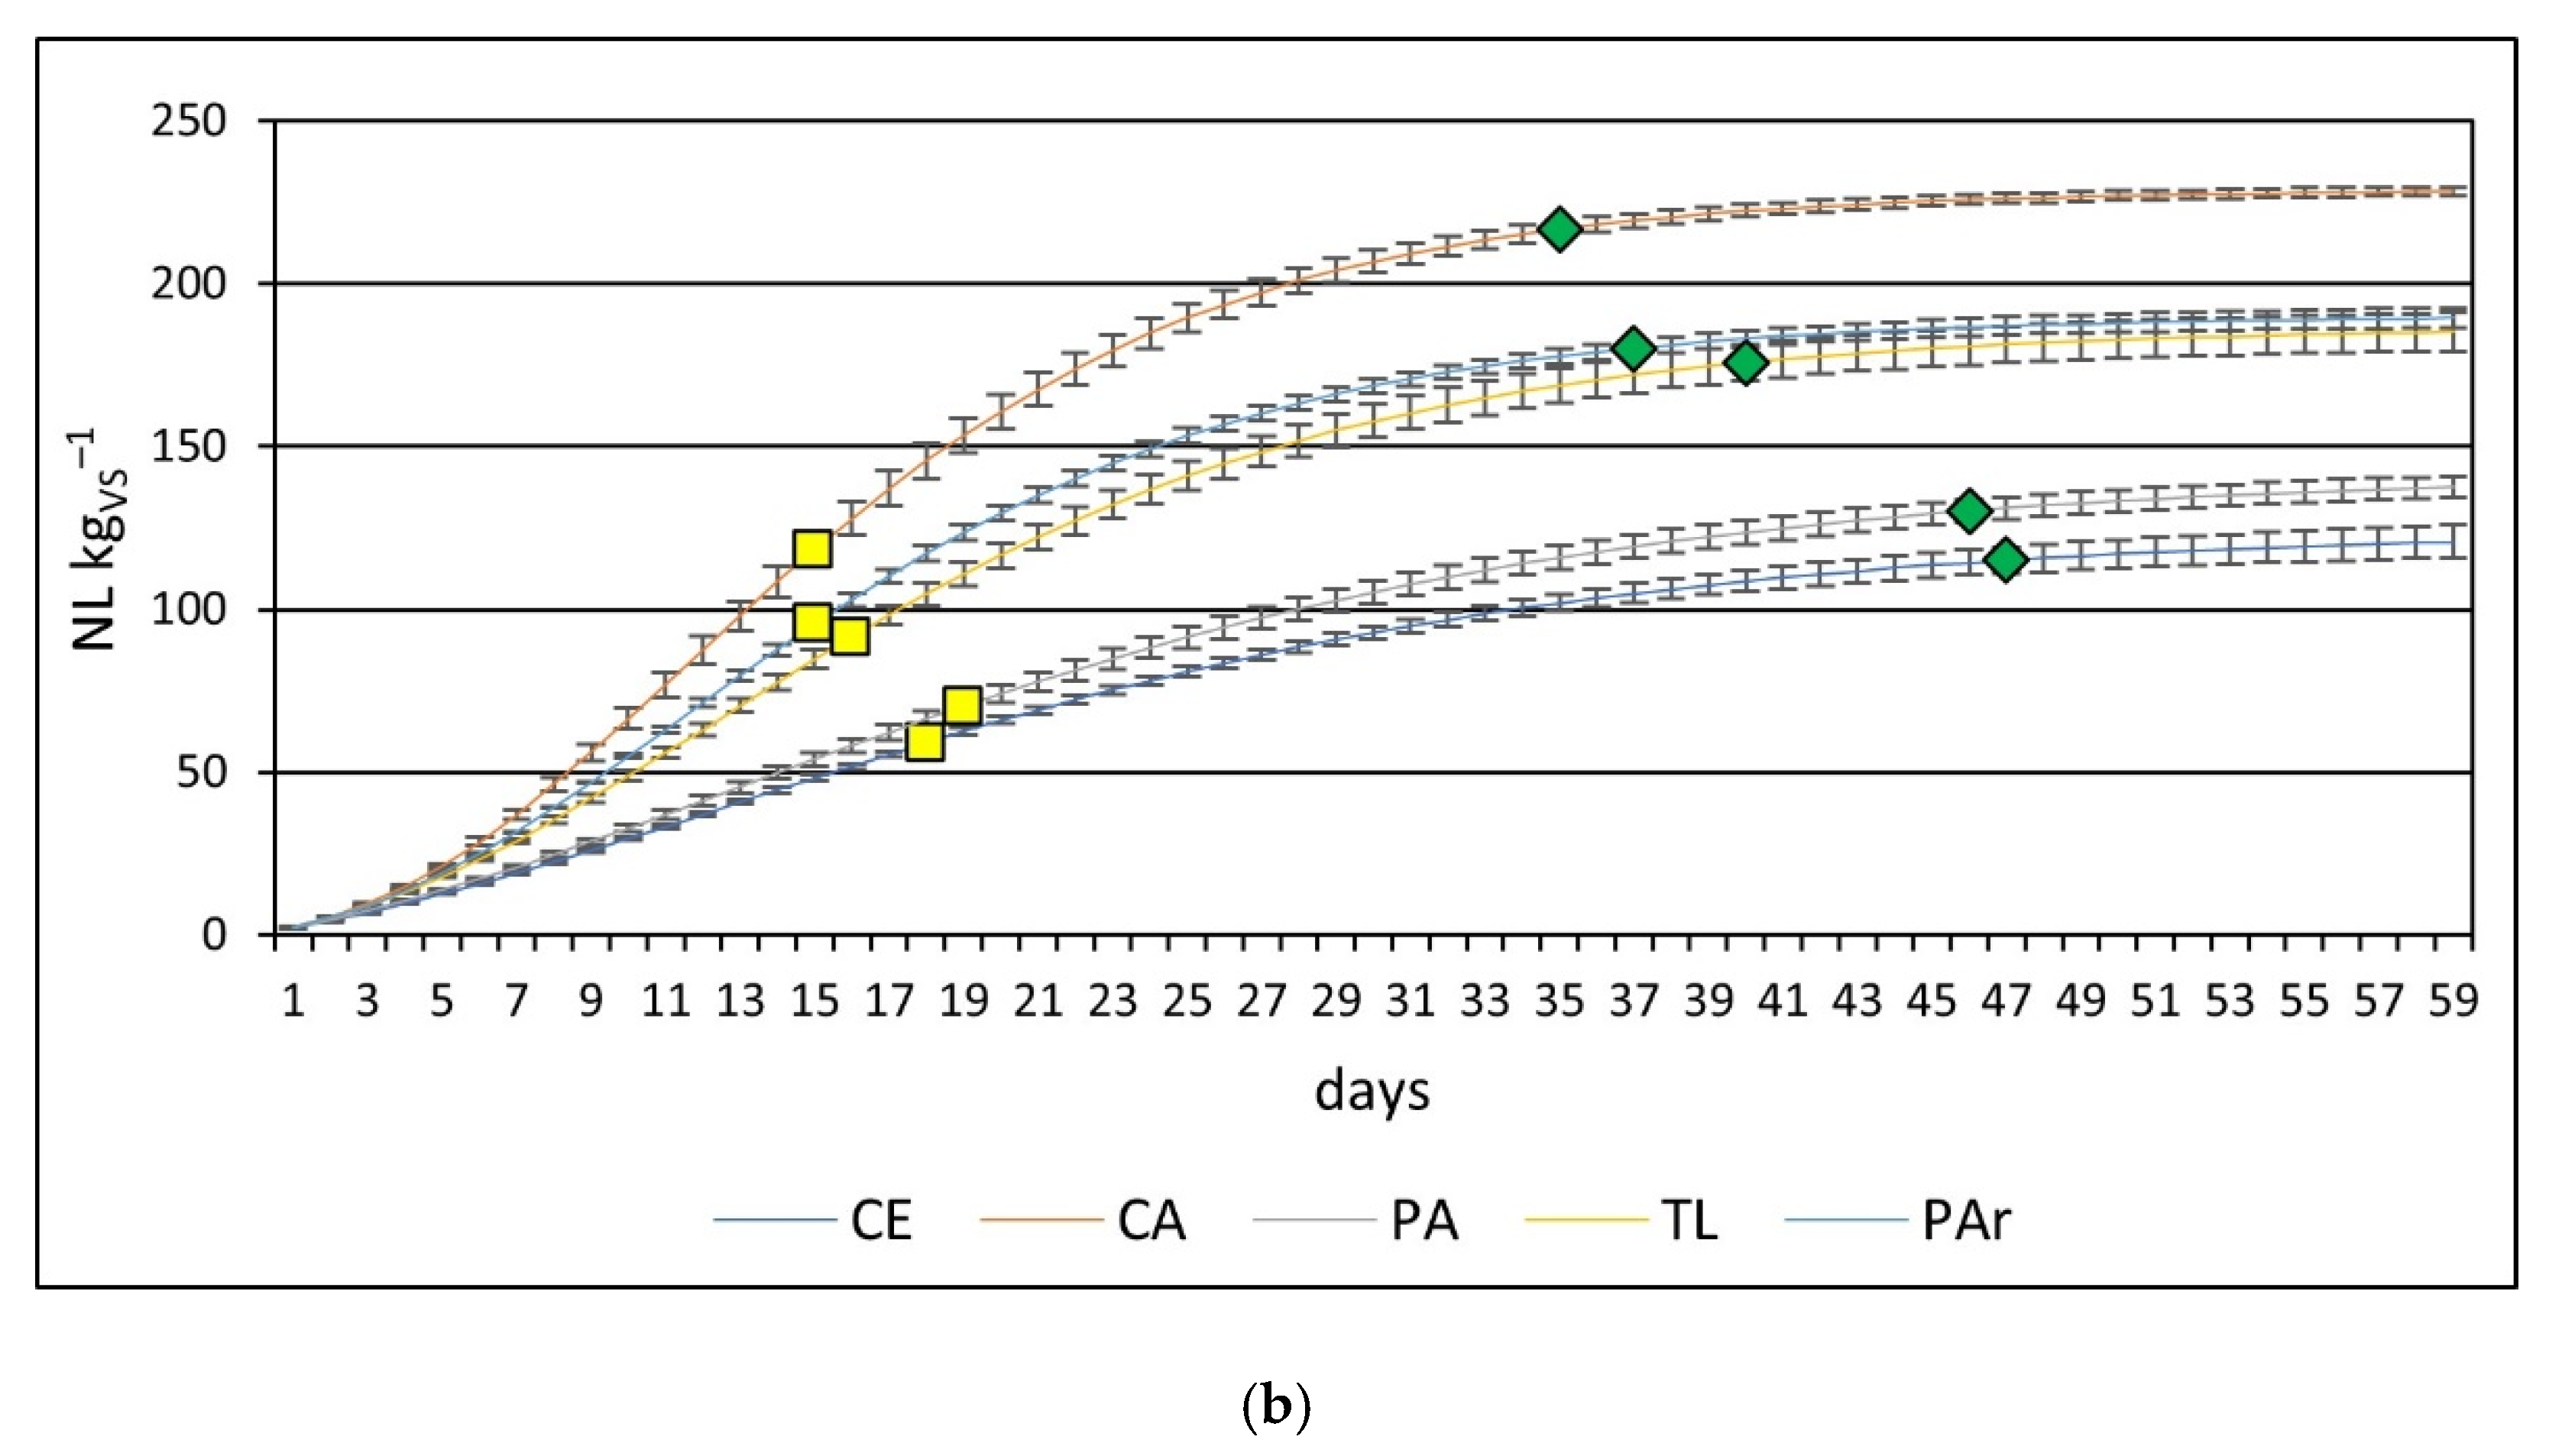
3.2. Methane Production

The potential methane production of the studied plants differed significantly (ANOVA, p < 0.05; Table 3). The SMY was lowest for PA (160 ± 28 NL kgVS−1) with W–F technology and for CE (121 ± 28 NL kgVS−1) with D–F technology. For both types of fermentation, CA produced the highest amount of methane.
In all cases, a significantly (p < 0.05) higher amount of methane was produced by the W–F process, with some differences among individual plant species (Figure 1). For CA, PA, TL, and PAr, methane yield from the D–F process reached ~80% of that from the W–F process. Methane produced by CE reached ~64% of that from the W–F process.
For all plants, the percentage of methane in the biogas (Figure 2) was higher for D–F, which, to some extent, mitigated the differences in SMY.
The differences in SMY resulted from plants’ susceptibility to anaerobic decomposition, regardless of the AD technology. These differences are reflected in the daily methane production (Figure 3). PAr and CA produced the highest amounts of methane in the first days of the BMP test, with a rapid increase on Days 3–5, followed by stable production during the next few days and finishing with a rapid decrease. The decomposition of PA and CE proceeded differently, with a slow increase in daily methane production in the first few days.
If we compare the daily methane produced by different types of fermentation, for D–F technology, a much smaller increase in methane was observed in the first days of the process. Still, the achieved maximum was maintained for a much longer time. In both fermentation technologies, two-stage decomposition of the substrates occurred, evidenced by the two peaks in the graphs in the first days of the experiment (Figure 3).
The different substrate decomposition rates impact the number of days needed to achieve 50% and 95% (T50 and T95) of the methane potential. The time when half of the methane potential was reached (T50) was the shortest for CA and PAr (Day 9 for W–F and Day 15 for D–F) and was the longest for PA (Day 15 for W–F and Day 19 for D–F). The differences among the individual substrates are more apparent when analysing T95. With W–F technology, CA and PAr reached 95% of the methane potential by Day 25, while PA and CE only reached it on Day 41. In D–F, T95 was reached between Day 35 for CA and Day 47 for CE (Figure 4).

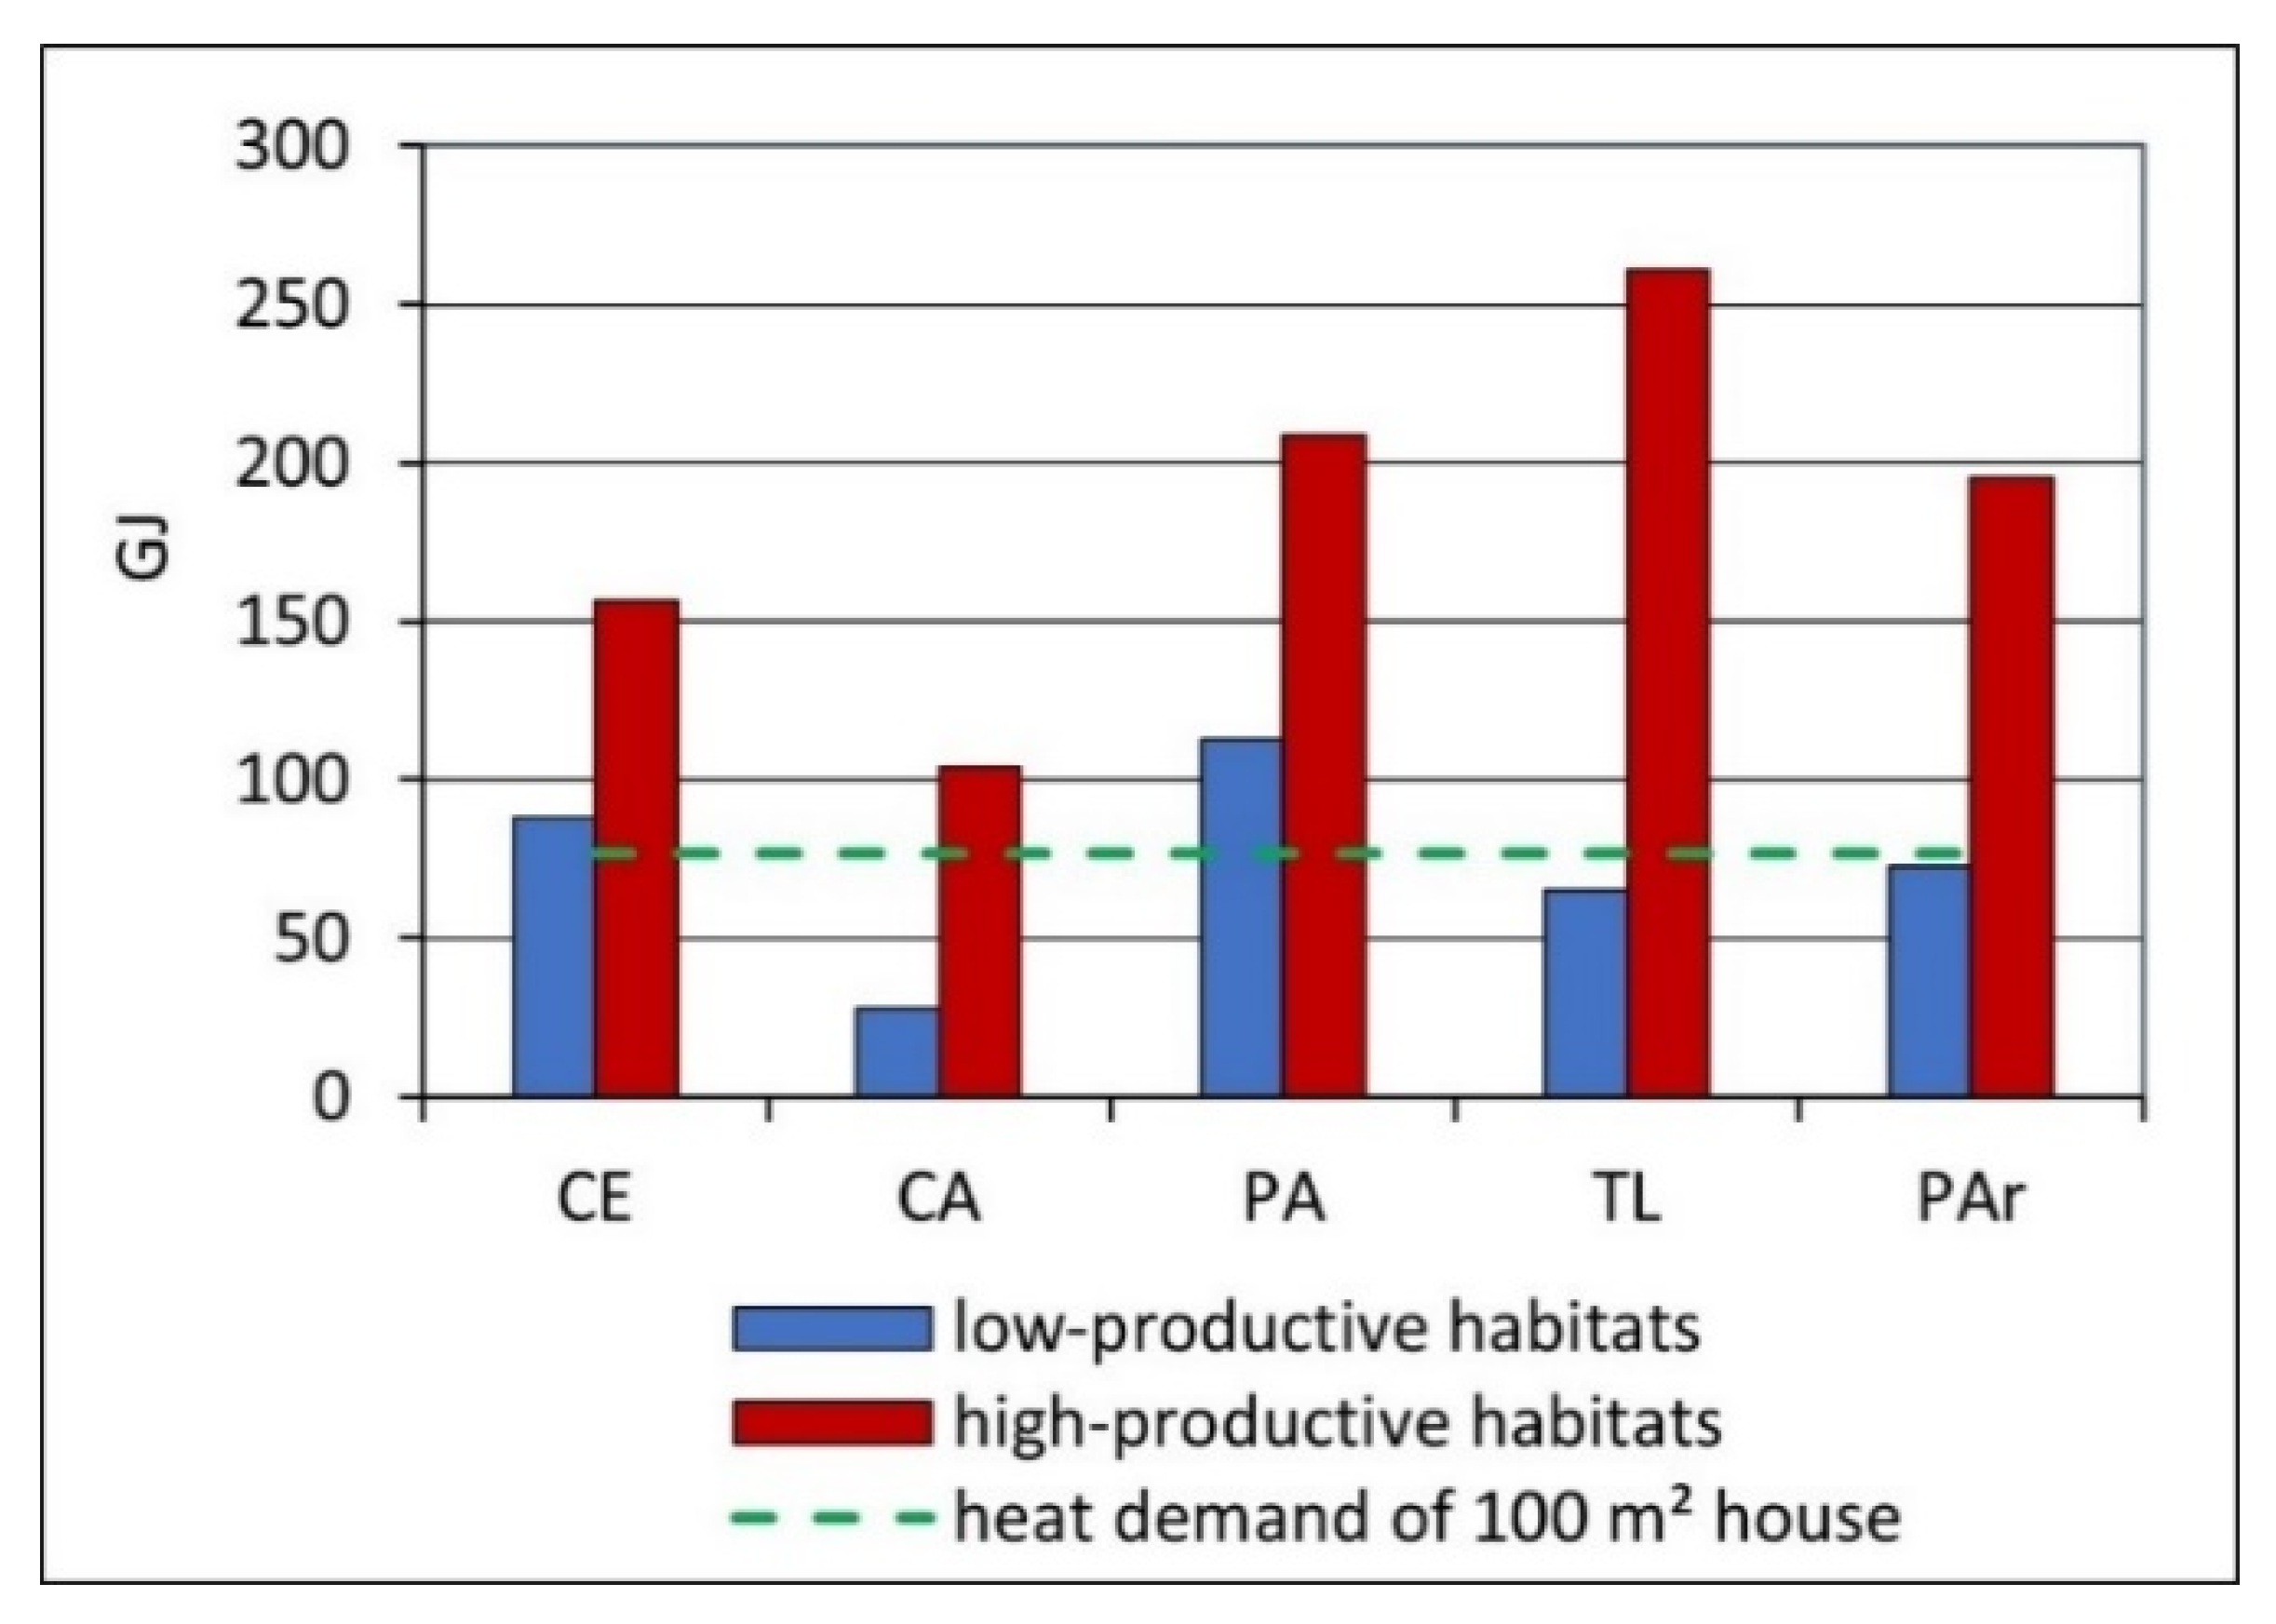
3.3. Energy Production from Wetland Biomass

The energy obtained from 1 ha of low-productivity wetland vegetation is much lower than that from a 1-ha maize field (Table 4). The differences in energy production are due to lower SMY and the assumed lower yields of wetland plants. The energy produced from the studied plants may constitute 11% (CA) to 27% (PA) of the energy from maize. These disproportions are smaller if we consider the dry mass of the raw material. In this situation, the energy from wetland plants accounts for 44% (PA) to 76% (CA) of the energy from maize.
More optimistic amounts of electricity and heat from wetland biomass can be produced if possible yields from high-productivity habitats are considered (Table 5). With the assumption of higher yields, TL performs the best in terms of electricity and heat production per hectare, similar to maize, and PAr produces 70% of the energy from maize. Other plants such as CA, CE, and PA can produce 44, 46, and 50% of the energy obtained from maize.

4. Discussion

Wetlands, especially peatlands, due to their carbon resources, play a vital role in addressing the climate crisis. Drained wetlands become a massive source of greenhouse gases. It was estimated that drained peatlands worldwide emit ~2 Gt of carbon dioxide annually, with Indonesia and the European Union being the two world largest GHG polluters [54,55]. The rewetting of peatlands was shown to be an essential measure to reduce climate change, and attenuate peak global warming and the biodiversity crisis [56].
Rewetting drained peatlands is the best solution to minimize their GHG emissions [56], which should be similar to those from intact peatlands [57]. After rewetting, these peatlands may be given to natural succession. Alternatively, an emerging idea for using rewetted peatlands is paludiculture, which recently has been acknowledged by the UN Food and Agriculture Organization [58] and the Intergovernmental Panel on Climate Change [59]. In contrast to conventional agriculture, paludiculture produces biomass while maintaining the peat body, facilitating peat accumulation and ecosystem services. Harvesting of spontaneous vegetation is particularly interesting, as it not only provides wetland biomass but can also be an essential tool for supporting the biodiversity of wetlands [60].
Among the many possible recovery methods for biomass, energy recovery (direct combustion, biogas production) is a viable option. Unfortunately, late-mown biomass has numerous unfavourable features that reduce its suitability for selected applications.

4.1. Chemical Composition of Wetland Plants

The variation in the chemical composition of wetland plants was high, and the chemical properties of wetland biomass varied according to habitat quality, harvest time, and the degree of communities’ naturalness. In all studied plants, the TKN content was similar only to the values given by Roj-Rojewski et al. [19], since plants were harvested in the same season of the year. In CE, the TKN content was in good agreement with data reported for sedges, while in the case of CA, our results were much higher. The TP content in CE was similar to that reported by Roj-Rojewski et al. [19] and that in CA was close to the value reported by Parzych et al. [61]. The TP content in PA found in the literature ranged from 0.04 to 2.2 g kg−1 (Table 6). Our results remained in that range and were comparable with the TP reported by Baran et al. [62] and Roj-Rojewski et al. [19]. The TP content in PAr in our study was much lower than that reported by Roj-Rojewski et al. [19] but was in good agreement with the research by Oleszek et al. [63]. The K content in CE and CA was similar to data by Ostrowska and Porębska [64], but was much lower than most of the results taken from the literature. The K in PA was in the range of values reported in the literature. For PAr, our results were much higher than those reported by Lopez-Gonzalez et al. [65] and Oleszek et al. [63] but lower than those observed by Florio [66]. The TOC content in all studied plants was similar to that reported in the literature (Table 6).
Lignin content in the studied plant materials was within the range of or higher than that reported in the literature (Table 7), especially in the case of TL. Cellulose content was generally lower than found in the literature (Table 7). Grasses and sedges cell walls contain cellulose fibres encased in glucuronoarabinoxylans (GAX), high levels of hydroxycinnamates, low levels of pectin and structural proteins, and significant quantities of mixed linkage glucans [75]. Inside the primary cell walls, the secondary cell walls are deposited and comprise at least 50% of the cell walls’ mass in leaves and stems. The secondary cell walls are mainly cellulose, GAX, and lignin (20%), essentially filling the pores between the polysaccharides [76].
The lignocellulose content differed between various species and communities [89], biotopes [90], and geographical locations [91]. The complexity and variability of fibre components in lignocellulosic biomass led to variation in the digestibility of biomass. High lignin content in the studied plants can be associated with the maturity of the plants harvested in early fall. Lignification, which increases with the maturity of plants, is a physiological process influenced by genetic and environmental factors, and reflects the extent of lignin deposition in the plant cell wall [92]. Hartung et al. [24] reported much higher lignin content in wetland plants harvested in October than in biomass obtained in June, while cellulose content was slightly higher or similar. Lignin biosynthesis can be triggered by many biotic (wounding, pathogen infection) and abiotic (drought, UV radiation, low temperatures, reduced nutrient availability, CO2, or ozone exposure) stressors [93].

4.2. Biogas Yield

The specific biogas yield (SBY) with W–F technology of the studied wetland plants was higher than the results of Hartung et al. [24], who reported a SBY in the range of 311–418 NL kgVS−1 for Typha latifolia, Phragmites australis, Phalaris arundinacea, and Carex acutiformis harvested in August and October.
The percentage of methane in the biogas produced by the W–F process from PA was lower than the values obtained by Dragoni et al. [94], who recorded a CH4 content of 71.4% and 66% for reed leaves and stalks, respectively. However, our results were close to the value of 55–60% given for the same species by Komulainen et al. [95] and Hartung et al. [24].
The SMY of PA in our study was similar to the methane yield reported by Dragoni et al. [94] and was approximately 15% lower than the values obtained by Lizasoain et al. [96]. At the same time, it was significantly lower than the results of Eller et al. [97]. In turn, the SMY of TL in this study is comparable with the results reported by Eller et al. [97]. Kandel et al. [18] reported the SMY of PAr to be equal to 315 NL kgVS−1 (leaves) and 283 NL kgVS−1 (stems), which was higher than the SMY obtained in our study. However, Massé et al. [25] reported SMY to range between 163 NL kgVS−1 and 201 NL kgVS−1, depending on the N fertilizer rate, which was significantly lower than our study.
The differences in SMY can be attributed to the lignocellulosic composition of the studied plants, since the substrate’s characteristics affect the biogas production rate and composition. The complex cell wall structure is the main obstacle in the digestion of lignocellulosic biomass. The methane produced by cellulose digestion is higher than that of hemicellulose; however, the latter is hydrolysed more quickly. On the other hand, lignin is tough to digest [98]. The high content of lignin in the studied material may have hindered the process of AD and resulted in lower methane production [92]. Therefore, for both technologies, the reduction in VS was much lower than that reported for AD of nonlignocellulosic substrates such as food waste [99,100] or sewage sludge [101].
Various contents of the fibre components in particular parts of plants lead to their different degrees of susceptibility to degradation [18,94]. Cell wall lignification occurs during the differentiation of cell wall types, which is essential for the proper functioning of plants and adaptation to the environment [93]. It affects the degradability of stems and leaves. As observed in our BMP experiment, in the first days of whole-plant fermentation, the process can be inhibited by the accumulation of volatile fatty acids resulting from the faster degradation of the readily decomposing parts of plants [63]. The subsequent decomposition of more resistant plant parts causes a further increase in the daily production of methane. Due to such unstable decay, the AD of wetland plants should be treated as a multi-stage process. The degradation of lignocellulosic compounds also affects the number of days needed to reach 50% and 95% (T50 and T95) of the methane potential. In our BMP experiment, degradation was relatively slow compared with results reported by Dragoni et al. [94], who observed a much faster degradation for PA, which reached 50% and 95% on Days 7 and 25–30, respectively.
The amount of methane produced from the biomass harvested from 1 ha of a wetland is of great practical importance. It depends on the biomass yield and SMY. In our research, the methane yield per 1 ha of peatland ranged between 456 and 1100 Nm3 for D–F and between 549 and 1280 Nm3 for W–F. The lowest values were found for CA in both cases, while the highest production characterised PA. Assuming paludiculture conditions, 1 ha can yield higher values, amounting to 1388–3424 Nm3 and 2034–4382 Nm3 for D–F and W–F, respectively. For comparison, W–F of maize harvested from 1 ha gives 4704 Nm3 of methane. Dragoni et al. [94] obtained a value of 3817 Nm3 ha−1 for PA grown for paludiculture and harvested in September, which was much higher than that in our study (2368 Nm3 ha−1 for W–F and the yields assumed for paludi-biomass). Kandel et al. [18] obtained ~3200 Nm3 ha−1 for reed canary grass harvested in September. In our study, the methane produced from PAr biomass harvested from 1 ha was 985 and 1236 Nm3 for D–F and W–F, respectively. The values of yields assumed for paludiculture were 2651 and 3327 Nm3 ha−1 for D–F and W–F, respectively. Slightly higher results (approx. 4000 Nm3 ha−1) were shown by Lehtomäki et al. [102].

4.3. Energy Production

Given the data provided by Statistics Poland [103] on the annual energy consumption per 1 m2 of the floor area of residence (27.89 kWh of electricity and 0.77 GJ of thermal energy obtained from coal), the amount of electricity produced by AD of wetland biomass harvested from 1 ha of natural habitats, apart from CA, is sufficient to supply a house with an area of 100 m2. Considering the higher yields that are obtainable under paludiculture conditions, the AD of all paludi-biomass would enable the production of electricity sufficient to supply two—or, in the case of TL, four—residences with an area of 100 m2. For comparison, the electricity generated during the AD of maize supplies almost five houses. The heat produced in CHP units in biogas plants is insufficient to cover the demand of even one house. However, feeding biogas into the natural gas grid to supply the gas boilers in the individual households might be a better option. More heat can be achieved by burning the biomass directly in the boiler. In the case of paludi-biomass, all the analysed species could possibly be used as a carbon substitute (Figure 5).

5. Conclusions

Biogas production should follow the rules of sustainability and profitability. Therefore, the feedstock used for the AD process is of significant importance. Energy crops are considered unsustainable, even more so when grown on drained organic soils. They may induce undesirable land-use changes such as deforestation, and wetland grassland conversion to cropland, etc., and may harm the soil, water, and air quality. Biomass harvested from wetlands as part of conservation measures or obtained from paludiculture can be a locally important source of sustainable biomass for biogas production.
The results showed the similar potential of both analysed AD technologies for the energetic use of biomass that could be obtained from wetlands. Even though biogas production was much more effective for wet fermentation, the higher methane content in the biogas generated by dry fermentation and the lower energy consumption of this technology suggest that the final amount of energy is similar for both technologies.
The amount of energy that can be produced by AD of wetland plants depends on their yield. Natural habitats are usually less productive. Regardless, if these habitats are mown, the utilisation of biomass as a substrate for biogas production is a workable alternative to, for example, disposal of biomass at the edge of the field or composting. The situation is different in the case of habitats created by the rewetting of previously drained areas. The yields here are significantly higher, which means that the energy obtained may be even close to that of maize. This makes the rewetting and implementation of paludiculture more attractive for farmers. At the same time, utilization of paludi-biomass as an AD substrate may reduce maize cultivation on fertile mineral soils and make these sites available for food production—in favour of paludiculture on rewetted peatland sites.

Author Contributions

Conceptualization, R.C., A.W.-C., P.B. and W.W.; methodology, R.C. and A.W.-C.; investigation, R.C. and A.W.-C.; formal analysis, R.C. and A.W.-C.; writing—original draft preparation, R.C., A.W.-C. and P.B.; writing—review and editing, P.B. and W.W.; visualization, R.C.; project administration, P.B. and W.W.; funding acquisition, W.W. All authors have read and agreed to the published version of the manuscript.

Funding

This research was funded by the Interreg Baltic Sea Region project DESIRE (Development of sustainable (adaptive) peatland management by restoration and paludiculture for nutrient retention and other ecosystem services in the Neman River catchment), index number R3071 and project number #R091, implemented in the framework of the Interreg Baltic Sea Region Program, co-funded by the European Regional Development Fund.

Institutional Review Board Statement

Not applicable.

Informed Consent Statement

Not applicable.

Data Availability Statement

Not applicable.

Conflicts of Interest

The authors declare no conflict of interest. The funders had no role in the design of the study; in the collection, analyses, or interpretation of data; in the writing of the manuscript; or in the decision to publish the results.

Abbreviations

ADanaerobic digestion
ADFacid detergent fibre
ADLacid detergent lignin
BMPbiomethane potential
CAmixture (~50/50) of Carex elata and Carex acutiformis
CECarex elata
CFcrude fibre
CHPcombined heat and power
D–Fdry fermentation
DMdry matter
GAXglucuronoarabinoxylans
Kpotassium (g kgTS−1)
Mtoemillion tonnes of oil equivalent
NDF neutral detergent fibre
NL normal litre, i.e., gas volume corrected to 0 °C and 1.013 bar
Nm3normal cubic metre
PAPhragmites australis
PArPhalaris arundinacea
SBY specific biogas yield (NL kgVS−1)
SMYspecific methane yield (NL kgVS−1)
T50the number of days required to reach 50% of the methane potential.
T95the number of days required to reach 95% of the methane potential.
TKNtotal Kjeldahl nitrogen (g kgTS−1)
TLTypha latifolia
TOCtotal organic carbon (g kgTS−1)
TPtotal phosphorus (g kgTS−1)
TS total solids (%)
VS volatile solids (% TS)
W–Fwet fermentation

References

  1. IPCC. Climate Change 2021: The Physical Science Basis. Contribution of Working Group14 I to the Sixth Assessment Report of the Intergovernmental Panel on Climate Change; Masson-Delmotte, V.P., Zhai, A., Pirani, S.L., Connors, C., Péan, S., Berger, N., Caud, Y., Chen, L., Goldfarb, M.I., Gomis, M., et al., Eds.; Cambridge University Press: Cambridge, UK, 2021; in press. [Google Scholar]
  2. Narnaware Sunil, L.; Panwar, N.L. Biomass gasification for climate change mitigation and policy framework in India: A review. Bioresour. Technol. Rep. 2021, in press. [Google Scholar] [CrossRef]
  3. International Energy Agency. Outlook for Biogas and Biomethane 2020. Available online: https://iea.blob.core.windows.net/assets/03aeb10c-c38c-4d10-bcec-de92e9ab815f/Outlook_for_biogas_and_biomethane.pdf (accessed on 2 June 2021).
  4. Lüker-Jans, N.; Simmering, D.; Otte, A. The impact of biogas plants on regional dynamics of permanent grassland and maize area—The example of Hesse, Germany (2005–2010). Agric. Ecosyst. Environ. 2017, 241, 24–38. [Google Scholar] [CrossRef]
  5. Banaszuk, P.; Wysocka-Czubaszek, A.; Czubaszek, R.; Roj-Rojewski, S. Implications of biomass use for energy production (in Polish). Wieś i Rol. 2015, 169, 139–152. [Google Scholar]
  6. Kampman, B.; Leguijt, C.; Scholten, T.; Tallat-Kelpsaite, J.; Bruckmann, R.; Maroulis, G.; Lesschen, J.P.; Meesters, K.; Sikirica, N.; Elbersen, B. Optimal Use of Biogas from Waste Streams: An Assessment of the Potential of Biogas from Digestion in the EU beyond 2020; European Commission: Delft, The Netherlands, 2017; pp. 1–158. [Google Scholar]
  7. Nafziger, E. Cultivation and Environmental Impact of Corn. Oxford Research Encyclopedia of Environmental Science. 2019. Available online: https://oxfordre.com/environmentalscience/view/10.1093/acrefore/9780199389414.001.0001/acrefore-9780199389414-e-220 (accessed on 2 June 2021).
  8. Dobers, G.M. Acceptance of biogas plants taking into account space and place. Energy Policy 2019, 135, 110987. [Google Scholar] [CrossRef]
  9. Szajdak, L.W.; Jezierski, A.; Wegner, K.; Meysner, T.; Szczepański, M. Influence of drainage on peat organic matter: Implications for development, stability, and transformation. Molecules 2020, 25, 2587. [Google Scholar] [CrossRef] [PubMed]
  10. Tanneberger, F.; Appulo, L.; Ewert, S.; Lakner, S.; Brolcháin, N.Ó.; Peters, J.; Wichtmann, W. The Power of nature-based solutions: How peatlands can help us to achieve key EU sustainability objectives. Adv. Sustain. Syst. 2020, 5, 2000146. [Google Scholar] [CrossRef]
  11. Beer, F.; Wichtmann, W.; Villegas, L.; Agus, F. Paludiculture. In Recarbonizing Global Soils: A Technical Manual of Best Management Practices; FAO: Rome, Italy, 2021; Volume 5, pp. 179–189. [Google Scholar] [CrossRef]
  12. Tanneberger, F.; Wichtmann, W. Land use options for rewetted peatlands. In Carbon Credits from Peatland Rewetting. Climate-Biodiversity-Land Use, 1st ed.; Tanneberger, F., Wichtmann, W., Eds.; Schweizerbart Science Publishers: Stuttgart, Germany, 2011; pp. 107–132. [Google Scholar]
  13. Bianchi, A.; Larmola, T.; Kekkonen, H.; Saarnio, S.; Lang, K. Review of greenhouse gas emissions from rewetted agricultural soils. Wetlands 2021, 41, 108. [Google Scholar] [CrossRef]
  14. Geurts, J.J.M.; Oehmke, C.; Lambertini, C.; Eller, F.; Sorrell, B.K.; Mandiola, S.R.; Grootjans, A.P.; Brix, H.; Wichtmann, W.; Lamers, L.P.M.; et al. Nutrient removal potential and biomass production by Phragmites australis and Typha latifolia on European rewetted peat and mineral soils. Sci. Total Environ. 2020, 747, 141102. [Google Scholar] [CrossRef]
  15. Schröder, C.; Dahms, T.; Paulitz, J.; Wichtmann, W.; Wichmann, S. Towards large-scale paludiculture: Addressing the challenges of biomass harvesting in wet and rewetted peatlands. Mires Peat 2015, 16, 1–18. [Google Scholar]
  16. Tanneberger, F.; Kubacka, J. (Eds.) The Aquatic Warbler Conservation Handbook, 1st ed.; The Brandenburg State Office for Environment: Potsdam, Germany, 2018; pp. 1–260. [Google Scholar]
  17. Khiari, B.; Jeguirim, M.; Limousy, L.; Benneci, S. Biomass derived chars for energy applications. Renew. Sustain. Energy Rev. 2019, 108, 253–273. [Google Scholar] [CrossRef]
  18. Kandel, T.P.; Sutaryo, S.; Møller, H.B.; Jørgensen, U.; Lærke, P.E. Chemical composition and methane yield of reed canary grass as influenced by harvesting time and harvest frequency. Bioresour. Technol. 2013, 130, 659–666. [Google Scholar] [CrossRef] [PubMed]
  19. Roj-Rojewski, S.; Wysocka-Czubaszek, A.; Czubaszek, R.; Kamocki, A.; Banaszuk, P. Anaerobic digestion of wetland biomass from conservation management for biogas production. Biomass Bioenerg. 2019, 122, 126–132. [Google Scholar] [CrossRef]
  20. Maucieri, C.; Camarotto, C.; Florio, G.; Albergo, R.; Ambric, A.; Trupo, M.; Borin, M. Bioethanol and biomethane potential production of thirteen pluri-annual herbaceous species. Ind. Crop. Prod. 2019, 129, 694–701. [Google Scholar] [CrossRef]
  21. Brix, H.; Sorrell, B.K.; Lorenzen, B. Are Phragmites-dominated wetlands a net source or net sink of greenhouse gases? Aquat. Bot. 2001, 69, 313–324. [Google Scholar] [CrossRef]
  22. Granéli, W. Common reed Phragmites australis (Cav.) Trin. Ex Steudel as energy source in Sweden. Int. J. Biomass Renew. 1984, 4, 183–206. [Google Scholar] [CrossRef]
  23. Kobbing, J.F.; Thevs, N.; Zerbe, S. The utilisation of reed (Phragmites australis): A review. Mires Peat 2013, 13, 1–14. [Google Scholar]
  24. Hartung, C.; Andrade, D.; Dandikas, V.; Eickenscheidt, T.; Drösler, M.; Zollfrank, C.; Heuwinkel, H. Suitability of paludiculture biomass as biogas substrate biogas yield and long-term effects on anaerobic digestion. Renew. Energy 2020, 159, 64–67. [Google Scholar] [CrossRef]
  25. Massé, D.; Gilbert, Y.; Savoie, P.; Bélanger, G.; Parent, G.; Babineau, D. Methane yield from switchgrass and reed canarygrass grown in Eastern Canada. Bioresour. Technol. 2011, 102, 10286–10292. [Google Scholar] [CrossRef] [PubMed]
  26. Hallam, A.; Anderson, I.C.; Buxton, D.R. Comparative economic analysis of perennial, annual, and intercrops for biomass production. Biomass Bioenerg. 2001, 21, 407–424. [Google Scholar] [CrossRef]
  27. Pociene, L.; Sarunaite, L.; Tivikiene, V.; Slepetys, J.; Kadziuliene, Z. The yield and composition of reed canary grass biomass as raw material for combustion. Biologija 2013, 59, 195–200. [Google Scholar] [CrossRef]
  28. Jasinskas, A.; Žaltauskas, A.; Kryževičienė, A. The investigation of growing and using of tall perennial grasses as energy crops. Biomass Bioenerg. 2008, 32, 981–987. [Google Scholar] [CrossRef]
  29. Stelmaszczyk, M.; Okruszko, T.; Meire, P. Nutrients availability and hydrological conditions of selected wetland ecosystems in the Biebrza river valley. Ann. Wars. Univ. Life Sci. SGGW Land Reclam. 2015, 47, 3–17. [Google Scholar] [CrossRef]
  30. Czubaszek, R.; Wysocka-Czubaszek, A.; Banaszuk, P. GHG emissions and efficiency of Energy generation through anaerobic fermentation of wetland biomass. Energies 2020, 13, 6497. [Google Scholar] [CrossRef]
  31. Fu, Y.; Luo, T.; Mei, Z.; Li, J.; Qiu, K.; Ge, Y. Dry anaerobic digestion technologies for agricultural straw and acceptability in China. Sustainability 2018, 10, 4588. [Google Scholar] [CrossRef] [Green Version]
  32. Abdelsalam, E.M.; Samer, M.; Amer, M.A.; Amer, B.M.A. Biogas production using dry fermentation technology through co-digestion of manure and agricultural wastes. Environ. Dev. Sustain. 2021, 23, 8746–8757. [Google Scholar] [CrossRef]
  33. Stolze, Y.; Zakrzewski, M.; Maus, I.; Eikmeyer, F.; Jaenicke, S.; Rottmann, N.; Siebner, C.; Pühler, A.; Schlüter, A. Comparative metagenomics of biogas-producing microbial communities from production-scale biogas plants operating under wet or dry fermentation conditions. Biotechnol. Biofuels 2015, 8, 14. [Google Scholar] [CrossRef] [PubMed] [Green Version]
  34. Jha, A.K.; Li, J.; Zhang, L.; Ban, Q.; Jin, Y. Comparison between wet and dry anaerobic digestions of cow dung under mesophilic and thermophilic conditions. Adv. Water Resour. Prot. 2013, 1, 28–38. [Google Scholar]
  35. Luning, L.; van Zundert, E.H.M.A.; Brinkmann, J.F. Comparison of dry and wet digestion for solid waste. Water Sci. Technol. 2013, 48, 15–20. [Google Scholar] [CrossRef]
  36. Vogel, T.; Ahlhaus, M.; Barz, M. Optimisation of biogas production from grass by dry-wet fermentation. In Proceedings of the 8th International Scientific Conference Engineering for Rural Development, Jelgava, Latvia, 28–29 May 2009; pp. 21–26. [Google Scholar]
  37. Angelonidi, E.; Smith, S.R. A comparison of wet and dry anaerobic digestion processes for the treatment of municipal solid waste and food waste. Water Environ. J. 2015, 29, 549–557. [Google Scholar] [CrossRef]
  38. APHA. Standard Methods for Examination of Water and Wastewater; APHA: Washington, DC, USA, 1998; ISBN 9780875532356. [Google Scholar]
  39. Li, P.; Li, W.; Sun, M.; Xu, X.; Zhang, B.; Sun, Y. Evaluation of biochemical methane potential and kinetics on the anaerobic digestion of vegetable crop residues. Energies 2019, 12, 26. [Google Scholar] [CrossRef] [Green Version]
  40. Ciria, M.P.; Solano, M.L.; Soriano, P. Role of macrophyte Typha latifolia in a constructed wetland for wastewater treatment and assessment of its potential as a biomass fuel. Biosyst. Eng. 2005, 92, 535–544. [Google Scholar] [CrossRef]
  41. Grzelak, M.; Waliszewska, B.; Sieradzka, A.; Speak-Dźwigała, A. Ecological meadow communities with participation of species from sedge (Carex) family. J. Res. Appl. Agric. Eng. 2011, 56, 122–126. [Google Scholar]
  42. Kask, Ü.; Kask, L.; Link, S. Combustion characteristics of reed and its suitability as a boiler fuel. Mires Peat 2013, 13, 1–10. [Google Scholar]
  43. Platace, R.; Adamovics, A.; GulbeI, I. Evaluation of factors influencing calorific value of reed canary grass spring and autumn yield. In Proceedings of the Conference Engineering for rural development, Jelgava, Latvia, 23–24 May 2013; pp. 521–525. [Google Scholar]
  44. Waliszewska, B.; Janyszek, M.; Grzelak, M.; Gaweł, E. Characteristic of thermochemical parameters of aboveground parts of selected sedges (Carex L. Cyperaceae). IOSR J. Agric. Vet. Sci. 2013, 5, 1–6. [Google Scholar] [CrossRef]
  45. Waliszewska, B.; Grzelak, M.; Gaweł, E.; Spek-Dźwigała, A.; Sieradzka, A.; Czekała, W. Chemical characteristics of selected grass species from polish meadows and their potential utilization for energy generation purposes. Energies 2021, 14, 1669. [Google Scholar] [CrossRef]
  46. Kakitis, A.; Ancans, D.; Nulle, I. Evaluation of combustion properties of biomass mixtures. In Proceedings of the Conference Engineering for Rural Development, Jelgava, Latvia, 29–30 May 2013; pp. 423–427. [Google Scholar]
  47. Murawski, M.; Grzelak, M.; Waliszewska, B.; Knioła, A.; Czekała, W. Energy value and yielding from extensively used meadows (in Polish). Fragm. Agron. 2015, 32, 71–78. [Google Scholar]
  48. Alberski, J.; Olszewska, M.; Bałuch-Małecka, A.; Kurzeja, M. Energy value of biomass from the extensively used Warkały-Trojan meadows (in Polish). Grass. Sci. Poland 2015, 18, 7–16. [Google Scholar]
  49. Roos, C.J. Biomass Drying and Dewatering for Clean Heat & Power, 1st ed.; U.U. Department of Enegy. CHP Technical Assistance Partnership: Olympia, WA, USA, 2009; p. 27.
  50. European Biomass Association. Statistical Report 2017; European Biomass Association: Brussels, Belgium, 2017. [Google Scholar]
  51. Niszczota, S.; Dziubiński, K.; Kupidura, A.; Miziołek, D.; Pacuszka, R.; Rafa, W.; Siestrzewitowska, A. Production of Agricultural and Horticultural Crops in 2019; Statistics Poland, Agriculture Department, Zakład Wydawnictw Statystycznych: Warsaw, Poland, 2020. Available online: https://stat.gov.pl/en/topics/agriculture-forestry/agricultural-and-horticultural-crops/production-of-agricultural-and-horticultural-crops-in-2019,2,4.html (accessed on 20 September 2021).
  52. Bauer, A.; Mayr, H.; Hopfner-Sixt, K.; Amon, T. Detailed monitoring of two biogas plants and mechanical solid–liquid separation of fermentation residues. J. Biotechnol. 2009, 142, 56–63. [Google Scholar] [CrossRef] [PubMed]
  53. Herrmann, A.; Rath, J. Biogas production from maize: Current state, challenges, and prospects. 1. Methane yield potential. Bioenerg. Res. 2012, 5, 1027–1042. [Google Scholar] [CrossRef]
  54. Joosten, H. The Global Peatland CO2 Picture. Peatland Status and Emissions in All Countries of the World; Wetlands International: Ede, The Netherlands, 2009; Available online: https://unfccc.int/sites/default/files/draftpeatlandco2report.pdf (accessed on 28 October 2021).
  55. Tanneberger, F.; Moen, A.; Barthelmes, A.; Lewis, E.; Miles, L.; Sirin, A.; Tegetmeyer, C.; Joosten, H. Mires in Europe—Regional Diversity, Condition and Protection. Diversity 2021, 13, 381. [Google Scholar] [CrossRef]
  56. Gunther, A.; Barthelmes, A.; Huth, V.; Joosten, H.; Jurasinski, G.; Koebsch, F.; Couwenberg, J. Prompt rewetting of drained peatlands reduces climate warming despite methane emissions. Nat. Commun. 2020, 11, 1644. [Google Scholar] [CrossRef] [PubMed] [Green Version]
  57. Tan, Z.D.; Lupascu, M.; Wijedasa, L.S. Paludiculture as a sustainable land use alternative for tropical peatlands: A review. Sci. Total Environ. 2021, 753, 142111. [Google Scholar] [CrossRef]
  58. Joosten, H.; Tapio-Bistrom, M.-L.; Tol, S. (Eds.) Peatlands—Guidance for Climate Change Mitigation through Conservation, Rehabilitation and Sustainable Use, 2nd ed.; Food and Agriculture Organization of the United Nations and Wetlands International: Rome, Italy; Ede, The Netherlands, 2012; p. 114. [Google Scholar]
  59. IPCC. Supplement to the 2006 IPCC Guidelines for National Greenhouse Gas Inventories: Wetlands; Hiraishi, T., Krug, T., Tanabe, K., Srivastava, N., Baasansuren, J., Fukuda, M., Troxler, T.G., Eds.; IPCC: Geneva, Switzerland, 2014; p. 354. [Google Scholar]
  60. Biancalani, R.; Avagyan, A. (Eds.) Towards climate-responsible peatlands management. In Mitigation of Climate Change in Agriculture Series 9; FAO: Rome, Italy, 2014. [Google Scholar]
  61. Parzych, A.E.; Sobisz, Z.; Jonczak, J. Comparing Carex species of mid-forest spring ecosystems in terms of ability to accumulate macro- and microelements. J. Ecol. Eng. 2017, 18, 125–136. [Google Scholar] [CrossRef] [Green Version]
  62. Baran, M.; Váradyová, Z.; Kráâmar, S.; Hedbávný, J. The common reed (Phragmites australis) as a source of roughage in ruminant nutrition. Acta Vet. Brno 2002, 71, 445–449. [Google Scholar] [CrossRef] [Green Version]
  63. Oleszek, M.; Król, A.; Tys, J.; Matyka, M.; Kulik, M. Comparison of biogas production from wild and cultivated varieties of reed canary grass. Bioresour. Technol. 2014, 156, 303–306. [Google Scholar] [CrossRef] [Green Version]
  64. Ostrowska, A.; Porębska, G. Chemical Composition of Plants, Its Interpretation and Use in Environmental Protection, 1st ed.; Instytut Ochrony Środowiska: Warszawa, Poland, 2002; p. 165. [Google Scholar]
  65. Lopez-Gonzalez, D.; Avalos-Ramirez, A.; Giroir-Fendler, A.; Godbout, S.; Fernandez-Lopez, M.; Sanchez-Silva, L.; Valverde, J.L. Combustion kinetic study of woody and herbaceous crops by thermal analysis coupled to mass spectrometry. Energy 2015, 90, 1626–1635. [Google Scholar] [CrossRef]
  66. Florio, G. Agronomic and Environmental Evaluation of Perennial Herbaceous Plants Fertilized with Slurry to Obtain Biomass for Bioenergy. Ph.D. Thesis, Università degli Studi di Padova, Padova, Italy, 31 January 2014. [Google Scholar]
  67. Borin, M.; Florio, G.; Barber, A.; Cirelli, G.L.; Albergo, R.; Palazzo, S. Preliminary evaluation of macrophyte wetland biomasses to obtain second generation ethanol. In Proceedings of the 19th European Biomass Conference and Exhibition, Berlin, Germany, 6–10 June 2011. [Google Scholar]
  68. Wöhler-Geske, A.; Moschner, C.R.; Gellerich, A.; Militz, H.; Greef, J.-M.; Hartung, E. Provenances and properties of thatching reed (Phragmites australis). Appl. Agric. For. Res. 2016, 66, 1–10. [Google Scholar] [CrossRef]
  69. Ohlsson, L.-O.; Karlsson, S.; Rupar-Gadd, K.; Albers, E.; Welander, U. Evaluation of Laminaria digitata and Phragmites australis for biogas production and nutrient recycling. Biomass Bioenerg. 2020, 140, 105670. [Google Scholar] [CrossRef]
  70. Van Tran, G.; Unpaprom, Y.; Ramaraj, R. Methane productivity evaluation of an invasive wetland plant, common reed. Biomass Convers. Biorefin. 2020, 10, 689–695. [Google Scholar] [CrossRef]
  71. Nkemka, V.N.; Gilroyed, B.; Yanke, J.; Gruninger, R.; Vedres, D.; McAllister, T.; Hao, X. Bioaugmentation with an anaerobic fungus in a two-stage process for biohydrogen and biogas production using corn silage and cattail. Bioresour. Technol. 2015, 185, 79–88. [Google Scholar] [CrossRef]
  72. Melts, I.; Normak, A.; Nurk, L.; Heinsoo, K. Chemical characteristics of biomass from nature conservation management for methane production. Bioresour. Technol. 2014, 167, 226–231. [Google Scholar] [CrossRef] [PubMed]
  73. Melts, I.; Ivask, M.; Geetha, M.; Takeuchi, K.; Heinsoo, K. Combining bioenergy and nature conservation: An example in wetlands. Renew. Sustain. Energy Rev. 2019, 111, 293–302. [Google Scholar] [CrossRef]
  74. Stypiński, P.; Chodkiewicz, A. The fodder value of plant communities grazed by Koniks in the Biebrza National Park (in Polish). Zesz. Nauk. 2011, 47, 222–230. [Google Scholar]
  75. Smith, B.G.; Harris, P.J. The polysaccharide composition of Poales cell walls: Poaceae cell walls are not unique. Biochem. Syst. Ecol. 1999, 27, 33–53. [Google Scholar] [CrossRef]
  76. Vogel, J. Unique aspects of the grass cell wall. Curr. Opin. Plant Biol. 2008, 11, 301–307. [Google Scholar] [CrossRef]
  77. Elhaak, M.A.; Mohsen, A.A.; Hamada, E.A.M.; El-Gebaly, F.E. Biofuel production from Phragmites australis (Cav.) and Typha domingensis (Pers.) Plants of Burullus Lake. Egypt. J. Exp. Biol. 2015, 11, 237–243. [Google Scholar]
  78. Cotana, F.; Cavalaglio, G.; Pisello, A.L.; Gelosia, M.; Ingles, D.; Pompili, E. Sustainable ethanol production from common reed (Phragmites australis) through simultaneuos saccharification and fermentation. Sustainability 2015, 7, 12149–12163. [Google Scholar] [CrossRef] [Green Version]
  79. Honoré, M.; Pimbert, S.; Lecompte, T. Characterisation of plant flours for biocomposite applications focussing on Phragmites australis properties. Biosyst. Eng. 2020, 197, 367–377. [Google Scholar] [CrossRef]
  80. Hu, Z.-H.; Yu, H.-Q. Anaerobic digestion of cattail by rumen cultures. Waste Manag. 2006, 26, 1222–1228. [Google Scholar] [CrossRef]
  81. Aysu, T.; Turhan, M.; Küçük, M.M. Liquefaction of Typha latifolia by supercritical fluid extraction. Bioresour. Technol. 2012, 107, 464–470. [Google Scholar] [CrossRef]
  82. Sopajarn, A.; Sangwichien, C. Optimization of enzymatic saccharification of alkali pretreated Typha angustifolia for glucose production. Int. J. Chem. Eng. Appl. 2015, 6, 232–236. [Google Scholar] [CrossRef] [Green Version]
  83. Mohapatra, S.; Mishra, C.; Behera, S.S.; Thatoi, H. Application of pretreatment, fermentation and molecular techniques for enhancing bioethanol production from grass biomass—A review. Renew. Sustain. Energy Rev. 2017, 78, 1007–1032. [Google Scholar] [CrossRef]
  84. Robbins, M.P.; Evans, G.; Valentine, J.; Donnison, I.S.; Allison, G.G. New opportunities for the exploitation of energy crops by thermochemical conversion in Northern Europe and the UK. Prog. Energy Combust. Sci. 2012, 38, 138–155. [Google Scholar] [CrossRef]
  85. Grzelak, M. Biomass fodder value of high-sedge rushes from ecological grasslands. J. Res. Appl. Agric. Eng. 2010, 55, 95–98. [Google Scholar]
  86. Reza, M.T.; Becker, W.; Sachsenheimer, K.; Mumme, J. Hydrothermal carbonization (HTC): Near infrared spectroscopy and partial least-squares regression for determination of selective components in HTC solid and liquid products derived from maize silage. Bioresour. Technol. 2014, 161, 91–101. [Google Scholar] [CrossRef] [PubMed]
  87. Walczak, M.; Swiontek Brzezinska, M. The quantity and quality of methanogenic microorganisms based on rRNA analysis and their relation to methane production. Afr. J. Microbiol. Res. 2013, 7, 3389–3395. [Google Scholar] [CrossRef] [Green Version]
  88. Ribas, T.M.B.; Neumann, M.; de Souza, A.M.; Dochwat, A.; de Almeida, E.R.; Horst, E.H. Effect of inoculants combining Lactobacillus buchneri strain LN40177 in different strata of the silo. Acta Sci.-Anim. Sci. 2019, 41, e44847. [Google Scholar] [CrossRef] [Green Version]
  89. Melts, I.; Heinsoo, K. Seasonal dynamics of bioenergy characteristics in grassland functional groups. Grass Forage Sci. 2015, 70, 571–581. [Google Scholar] [CrossRef]
  90. Herrmann, C.; Prochnow, A.; Heiermann, M.; Idler, C. Biomass from landscape management of grassland used for biogas production: Effects of harvest date and silage additives on feedstock quality and methane yield. Grass Forage Sci. 2014, 69, 549–566. [Google Scholar] [CrossRef]
  91. Mosier, N.; Wyman, C.; Dale, B.; Elander, R.; Lee, Y.Y.; Holtzapple, M.; Ladisch, M. Features of promising technologies for pretreatment of lignocellulosic biomass. Bioresour. Technol. 2005, 96, 673–686. [Google Scholar] [CrossRef]
  92. Triolo, J.M.; Pedersen, L.; Qu, H.; Sommer, S.G. Biochemical methane potential and anaerobic biodegradability of non-herbaceous and herbaceous phytomass in biogas production. Bioresour. Technol. 2012, 125, 226–232. [Google Scholar] [CrossRef]
  93. Barros, J.; Serk, H.; Granlund, G.; Pesquet, E. The cell biology of lignification in higher plants. Ann. Bot. 2015, 115, 1053–1074. [Google Scholar] [CrossRef] [Green Version]
  94. Dragoni, F.; Giannini, V.; Ragaglini, G.; Bonari, E.; Silvestri, N. Effect of harvest time and frequency on biomass quality and biomethane potential of common reed (Phragmites australis) under paludiculture conditions. Bioenerg. Res. 2017, 10, 1066–1078. [Google Scholar] [CrossRef]
  95. Komulainen, M.; Simi, P.; Hagelberg, E.; Ikonen, I.; Lyytynen, S. Reed energy: Possibilities of using the common reed for energy generation in Southern Finland. Rep. Turku Univ. Appl. Sci. 2008, 67, 5–75. [Google Scholar]
  96. Lizasoain, J.; Rincon, M.; Theuretzbacher, F.; Enguídanos, R.J.; Nielsen, P.J.; Potthast, A.; Zweckmair, T.; Gronauer, A.; Bauer, A. Biogas production from reed biomass: Effect of pretreatment using different steam explosion conditions. Biomass Bioenerg. 2016, 95, 84–91. [Google Scholar] [CrossRef]
  97. Eller, F.; Ehde, P.P.; Oehmke, C.; Ren, L.; Brix, H.; Sorrell, B.K.; Weisner, S.E.B. Biomethane Yield from different European Phragmites australis genotypes, compared with other herbaceous wetland species grown at different fertilization regimes. Resources 2020, 9, 57. [Google Scholar] [CrossRef]
  98. Li, W.; Khalid, H.; Zhu, Z.; Zhang, R.; Liu, G.; Chen, C.; Thorin, E. Methane production through anaerobic digestion: Participation and digestion characteristics of cellulose, hemicellulose and lignin. Appl. Energy 2018, 226, 1219–1228. [Google Scholar] [CrossRef]
  99. Zhen, G.; Lu, X.; Kobayashi, T.; Kumar, G.; Xu, K. Anaerobic co-digestion on improving methane production from mixed microalgae (Scenedesmus sp., Chlorella sp.) and food waste: Kinetic modeling and synergistic impact evaluation. Chem. Eng. J. 2016, 299, 332–341. [Google Scholar] [CrossRef]
  100. Blasius, J.P.; Contrera, R.C.; Maintinguer, S.I.; de Castro, M.C.A.A. Effects of temperature, proportion and organic loading rate on the performance of anaerobic digestion of food waste. Biotechnol. Rep. 2020, 27, e00503. [Google Scholar] [CrossRef] [PubMed]
  101. Ding, H.H.; Kotova, P.; Shaw, C.; Hong, Y.; Chang, S. Impacts of temperature and solids retention time, and possible mechanisms of biological hydrolysis pretreatment on anaerobic digestion. Water 2020, 12, 3166. [Google Scholar] [CrossRef]
  102. Lehtomäki, A.; Huttunen, S.; Lehtinen, T.M.; Rintala, J.A. Anaerobic digestion of grass silage in batch leach bed processes for methane production. Bioresour. Technol. 2008, 99, 3267–3278. [Google Scholar] [CrossRef] [PubMed]
  103. Walkowska, K. Energy Consumption in Households in 2018; Statistics Poland, Enterprises Department, Zakład Wydawnictw Statystycznych: Warsaw, Poland, 2019. Available online: https://stat.gov.pl/en/topics/environment-energy/energy/energy-consumption-in-households-in-2018,2,5.html (accessed on 7 October 2021).
Figure 1. Specific methane yield (SMY) produced by both types of fermentation: W–F—wet fermentation; D–F—dry fermentation. CE—Carex elata; CA—Carex acutiformis + Carex elata; PA—Phragmites australis; TL—Typha latifolia; PAr—Phalaris arundinacea. Standard errors are shown as vertical bars.
Energies 14 08373 g001
Figure 2. Percentage of methane in biogas produced by both types of fermentation: W–F—wet fermentation; D–F—dry fermentation. CE—Carex elata; CA—Carex acutiformis + Carex elata; PA—Phragmites australis; TL—Typha latifolia; PAr—Phalaris arundinacea. Standard errors are shown as vertical bars.
Energies 14 08373 g002
Figure 3. Daily methane production: (a)—wet fermentation; (b)—dry fermentation. CE—Carex elata; CA—Carex acutiformis + Carex elata; PA—Phragmites australis; TL—Typha latifolia; PAr—Phalaris arundinacea. Standard errors are shown as vertical bars.
Energies 14 08373 g003aEnergies 14 08373 g003b
Figure 4. Cumulative methane production: (a)—wet fermentation; (b)—dry fermentation. CE—Carex elata; CA—Carex acutiformis + Carex elata; PA—Phragmites australis; TL—Typha latifolia; PAr—Phalaris arundinacea. Standard errors are shown as vertical bars. The yellow squares and green diamonds indicate T50 and T95, respectively.
Energies 14 08373 g004aEnergies 14 08373 g004b
Figure 5. Heat supply from biomass combustion: Comparison of less productive and highly productive (paludiculture) habitats. CE—Carex elata; CA—Carex acutiformis + Carex elata; PA—Phragmites australis; TL—Typha latifolia; PAr—Phalaris arundinacea.
Energies 14 08373 g005
Table 1. Chemical composition of the inocula for the dry and wet fermentation experiment and wetland plant silage.
Inoculum
for Wet
Fermentation
Inoculum
for Dry
Fermentation
Carex elata
(CE)
Carex
acutiformis
+ Carex elata
(CA)
Phragmites
australis
(PA)
Typha
latifolia
(TL)
Phalaris
Arundinacea
(PAr)
Total solids (TS), %5.06 ± 0.04 A11.91 ± 0.15 B45.94 ± 0.12 a25.89 ± 0.36 b44.76 ± 0.90 a25.25 ± 0.33 b34.250 ± 48 c
Volatile solids (VS), % TS78.10 ± 0.07 A83.11 ± 0.31 B95.50 ± 0.25 a92.38 ± 0.22 b91.82 ± 0.19 c93.65 ± 0.16 d93.17 ± 0.08 d
pH7.99 ± 0.02n.a.5.32 ± 0.02 a5.56 ± 0.08 b5.72 ± 0.03 c5.07 ± 0.02 d4.76 ± 0.02 e
Total Kjeldahl nitrogen (TKN),
g kgTS−1
90.53 ± 3.18 A46.65 ± 0.13 B16.94 ± 0.31 a23.73 ± 0.52 b21.21 ± 0.97 c16.68 ± 0.18 a25.04 ± 1.49 b
Total phosphorus (TP), g kgTS−19.46 ± 0.19 A9.62 ± 0.92 A0.82 ± 0.05 a2.72 ± 0.08 b1.30 ± 0.10 c1.95 ± 0.06 d2.35 ± 0.04 e
Total potassium (K), g kgTS−154.73 ± 1.67 A25.85 ± 0.77 B5.32 ± 0.19 a16.04 ± 0.35 b4.22 ± 0.28 c8.91 ± 0.21 d11.02 ± 0.13 e
Total organic carbon (TOC),
g kgTS−1
409.81 ± 5.41 A442.96 ± 4.01 B469.54 ± 16.37 a465.16 ± 2.60 a452.50 ± 12.36 a454.97 ± 2.51 a459.06 ± 13.58 a
Uppercase letters—statistical differences at p < 0.05 between inocula; lowercase letters—statistical differences at p < 0.05 among plant materials; n.a.—not analysed.
Table 2. Lignocellulose characteristics of fresh wetland plant material.
Carex elata (CE)Carex
acutiformis
+ Carex
elata (CA)
Phragmites australis (PA)Typha
latifolia
(TL)
Phalaris arundinacea (PAr)
Crude fibre, % TS32.43 ± 1.46 a37.62 ± 0.89 b36.80 ± 3.71 ab44.06 ± 0.23 c36.39 ± 1.29 ab
Lignin, % TS20.79 ± 2.82 a16.03 ± 1.54 b21.90 ± 1.77 a36.40 ± 1.04 c22.19 ± 0.78 a
Hemicellulose, % TS25.16 ± 0.75 a27.89 ± 0.53 a27.77 ± 1.09 a19.22 ± 1.22 b37.55 ± 1.04 c
Cellulose, % TS26.76 ± 2.66 a29.37 ± 0.87 a25.32 ± 1.48 a25.69 ± 2.15 a16.90 ± 1.29 b
Lignification0.70.50.91.41.3
Lowercase letters—statistical differences at p < 0.05 among plant materials.
Table 3. Methane production (NL kgVS−1) of wetland plants, harvested in September 2019.
Plant SpeciesType of Fermentation
WetDry
Carex elata (CE)190 ± 5 aA121 ± 5 aB
Carex acutiformis + Carex elata (CA)275 ± 3 bA228 ± 1 bB
Phragmites australis (PA)160 ± 28 cA138 ± 3 cA
Typha latifolia (TL)237 ± 13 dA185 ± 6 dB
Phalaris arundinacea (PAr)238 ± 2 dA189 ± 3 dB
Maize silage [53]195–581
Lowercase letters—statistical differences at p < 0.05 among plant materials; uppercase letters—statistical differences at p < 0.05 between fermentation technologies.
Table 4. Energy generation from anaerobic digestion of wetland plants from natural low-productivity habitats calculated on the basis of the BMP results and measured yields.
Plant SpeciesElectricityHeat
kWh ha−1kWh tDM−1GJ ha−1GJ tDM−1
W–FD–FW–FD–FW–FD–FW–FD–F
Carex elata (CE)3569247252836511.189.381.651.39
Carex acutiformis + Carex elata (CA)159214397486754.995.462.342.56
Phragmites australis (PA)3708347142940211.6213.171.351.53
Typha latifolia (TL)315726826285349.8910.181.972.03
Phalaris arundinacea (PAr)3581310364155511.2211.772.012.11
Maize13,62297342.693.05
W–F—wet fermentation; D–F—dry fermentation.
Table 5. Energy from anaerobic digestion (AD) of paludi-biomass from highly productive paludiculture calculated on the basis of BMP results and assumed high yields [24].
Plant SpeciesElectricity Production
from AD
Heat Production
from AD
W–FD–FW–FD–F
kWh ha−1GJ ha−1
Carex elata (CE)6332438619.8416.64
Carex acutiformis + Carex elata (CA)5981540318.7420.50
Phragmites australis (PA)6870643121.5224.40
Typha latifolia (TL)12,56710,67939.3740.52
Phalaris arundinacea (PAr)9610832630.1031.60
Maize13,62242.69
W–F—wet fermentation; D–F—dry fermentation.
Table 6. Chemical composition of plant species according to published data.
Plant SpeciesTotal Kjeldahl Nitrogen (TKN)Total Phosphorus (TP)Total Potassium (K)Total Organic carbon (TOC)Reference
g kg−1
Carex elata15.31.03447[19]
10.4444.6[67]
Carex acutiformis
+ Carex elata
21.36431[66]
14.82.223.0[61]
Phragmites australis1.5710.90870.5[62]
6.270.6252.114392[65]
23.71.73402[19]
13.4443.4[67]
0.53–6.680.04–0.340.2–8.0473–526.3[68]
13.72.2[69]
11.4506.8[70]
Typha latifolia7449[71]
Phalaris arundinacea9.74/11.3444/452[27]
6.5311.3716.354437[65]
14.6 ± 1.22.52 ± 0.065.83 ± 0.14619.4 ± 12.5[63]
37.75.53403[19]
17.93422[66]
15.2421.6[67]
Sedges15.701.396.29 [72]
15.2421.6[67]
151.210.7448[73]
13–311–45–12[64]
10–14.81.9–2.218.3–25.1[61]
1.310.7[74]
Table 7. Lignocellulose characteristics of wetland plants according to the literature.
Plant SpeciesCelluloseHemicelluloseLigninReference
% TS
Carex elata33.334.611.1[67]
Carex acutiformis
+ Carex elata
37.417.220.3[44,47]
29.736.07.9[66]
Phragmites australis48.3 (summer)20.115.3[77]
41.7 (winter)19.421.0
39.327.223.6[47]
35.130.222.0[45]
26.233.37.3[67]
38.120.523.0[78]
38.8–57.520.9–40.28.4–17.2[68]
41.230.911.8[79]
32.029.018.6[70]
Typha latifolia32.622.15.4[24]
20.822.610.5[80]
37.332.821.7[81]
45.319.88.8[71]
38.537.612.8[82]
Phalaris arundinacea29.825.88.0[63]
32.619.824.6[47]
38–4520–2518–21[83]
38.731.715.4[45]
29.522.88.9[73]
28.733.85.7[67]
28.022.014.0[84]
27.627.52.9[24]
Sedges34.86–36.7518.3417.56–25.18[41,85]
30.1–46.29.8–28.511.9–28.1[44,47]
30.2232.395.06[72]
29.730.85.6[73]
Maize32.726.37.0[86]
18.3919.591.43[87]
24.0915.585.77[88]
Publisher’s Note: MDPI stays neutral with regard to jurisdictional claims in published maps and institutional affiliations.

