Article

Numerical Study on Coupled Operation of Stratified Air Distribution System and Natural Ventilation under Multi-Variable Factors in Large Space Buildings

College of Energy and Mechanical Engineering, Shanghai University of Electric Power, Shanghai 201306, China
*
Authors to whom correspondence should be addressed.
Energies 2021, 14(23), 8130; https://doi.org/10.3390/en14238130
Submission received: 3 November 2021 / Revised: 23 November 2021 / Accepted: 1 December 2021 / Published: 3 December 2021
(This article belongs to the Collection Feature Papers in Energy, Environment and Well-Being)

Abstract

:
Stratified air distribution systems are commonly used in large space buildings. The research on the airflow organization of stratified air conditioners is deficient in terms of the analysis of multivariable factors. Moreover, studies on the coupled operation of stratified air conditioners and natural ventilation are few. In this paper, taking a Shanghai Airport Terminal departure hall for the study, air distribution and thermal comfort of the cross-section at a height of 1.6 m are simulated and compared under different working conditions, and the effect of natural ventilation coupling operation is studied. The results show that the air distribution is the most uniform and the thermal comfort is the best (predicted mean vote is 0.428, predicted percentage of dissatisfaction is 15.2%) when the working conditions are 5.9% air supply speed, 11 °C cooling temperature difference and 0° air supply angle. With the coupled operation of natural ventilation, the thermal comfort can be improved from Grade II to Grade I.

1. Introduction

The large-space buildings of the airport operate non-stop throughout the year and have a long daily use time. The inner area has a demand for cooling throughout the year [1]. Many studies have pointed out that the energy use intensity of airport terminals is significantly higher than other common civil buildings [2], and among them, heating, ventilation and air conditioning (HVAC) systems always occupy the largest share (40–80%) [3], which is a big energy consumer at the airport, with obvious energy-saving potential. Adnan Menderes airport accounts for 80% of HVAC energy consumption [4] and 86% at Soekarno-Hatta Menderes airport [5]. Liu et al. investigated the air-conditioning systems of seven hub terminals in China and pointed out that in terms of electricity consumption alone, air-conditioning systems consume 30–60% [6]. In addition, the indoor space of the airport terminal building is tall [7], the function partition is complicated, and the glass curtain wall is used in a large area of the envelope structure [8]. Therefore, urgently alleviating the high energy consumption of the airport has become an important task in the construction and operation of the airport. In terms of HVAC systems, stratified air-conditioning systems [9,10], the use of natural ventilation [11], and the simulation of airflow organization in the terminal [12] are all effective measures to reduce energy consumption.
The research and application of stratified air conditioning technology are numerous. Wuhan New Railway Station Waiting Hall, Guangzhou New Railway Station Waiting Hall, Japan Kansai Airport [13], Tokyo International Convention Center, Rose Park Stadium in the United States, and Shanghai Hongqiao Airport New Terminal all adopt stratified air conditioning technology and use computational fluid dynamics (CFD) methods to analyze and evaluate the air distribution of stratified air conditioning. CFD is a major predictive tool for designing and evaluating indoor environments [14], and this method is commonly used in the study of air distribution and thermal comfort in large space buildings [15]. Studies have shown that vertical air stratification will occur in the indoor environment of a large space without mechanical interference [16]. The temperature of the walls and ceiling can reach 30~45 °C [17], and the sunlight on the floor brings about a high intensity heat flux (about 120~170 W/m2) [18]. In the face of a complex heat transfer environment, optimizing the heat transfer link is of great significance to the improvement of the indoor environment, which is also an important reason for the use of a layered air conditioning system in a large space. The setting of different air supply parameters, such as personnel density and fresh air volume of the unit personnel, will have an impact on the airflow organization and thermal comfort of the stratified air conditioner [19]. With reasonable design of the location of the air supply and return air vent, the air-conditioning system can achieve the best indoor thermal comfort with relatively low energy consumption [18]. Yong Wang et al. [20] research on the air conditioning system in a large space shows that the air supply speed, air supply angle, and air supply temperature are increased reasonably, and the air supply height is appropriately reduced, and the airflow organization effect is good. Comparing the main influencing factors, it is found that the influence of the air supply speed and cooling temperature difference is strong, while the influence of air supply height, air supply angle and air vent specifications is weak [21]. The air distribution diagram of a stratified air conditioner is shown in Figure 1.
When the stratified air conditioner is operated alone, part of the air is affected by thermal buoyancy and rises and stays in the non-air-conditioned area. When it is operated in conjunction with natural ventilation, part of the stagnant hot air is discharged outside through the induction of natural ventilation, effectively reducing the retention of hot air in the upper non-air-conditioned area [22]. It can be seen that the use of natural ventilation in the stratified air conditioning system improves the quality of the indoor thermal environment and reduces the heat consumed by the ventilation and cooling system [23]. Ma, J. S. et al. [24] conducted a study on the location of natural ventilation exhaust vents in an airport terminal and compared three research plans. The results showed that the high-position exhaust vents on the east and west walls have the best natural ventilation effect. Cheng et al. [25] study ventilation and comfort in a multisport facility in northeastern United States, and the result shows that rooftop vents improve ventilation performance when there are multiple access vents distributed on the wall of the building, and the uniformity of the opening distribution affects the ventilation efficiency. At present, most scholars concentrated on studying the airflow organization under the influence of different single factors of stratified air conditioning, ignoring the result of multiple factors and lack of specific analysis of the coupled operation of stratified air conditioning and natural ventilation. These overlooked issues will have an impact on the airflow organization and thermal comfort of the stratified air conditioner.
Consequently, this paper took the departure hall of an airport terminal in Shanghai as the research object to analyze the influence of multi-factors of stratified air conditioning and the coupled operation with natural ventilation on airflow organization. Firstly, the hotspot distribution of the departure hall was studied according to the partition function of the departure hall and passenger behavior characteristics. Then, an airflow organization numerical simulation model based on CFD technology was established. Air supply speed, air temperature difference and air supply angle were carried out to analyze the influence of multivariable factors of stratified air conditioning on the airflow organization under summer conditions. Furthermore, the design coupling scheme of stratified air-conditioning and natural ventilation was proposed to optimize airflow organization, and the PMV-PPD index was used to comprehensively analyze the evaluation of air distribution under different working conditions and determine the optimal air distribution plan.
The structure of the remaining study is as follows: the numerical simulation model is established in Section 2. Section 3 focuses on the results and discussion of the numerical simulation. Finally, conclusions are drawn in Section 4.

2. Model Description
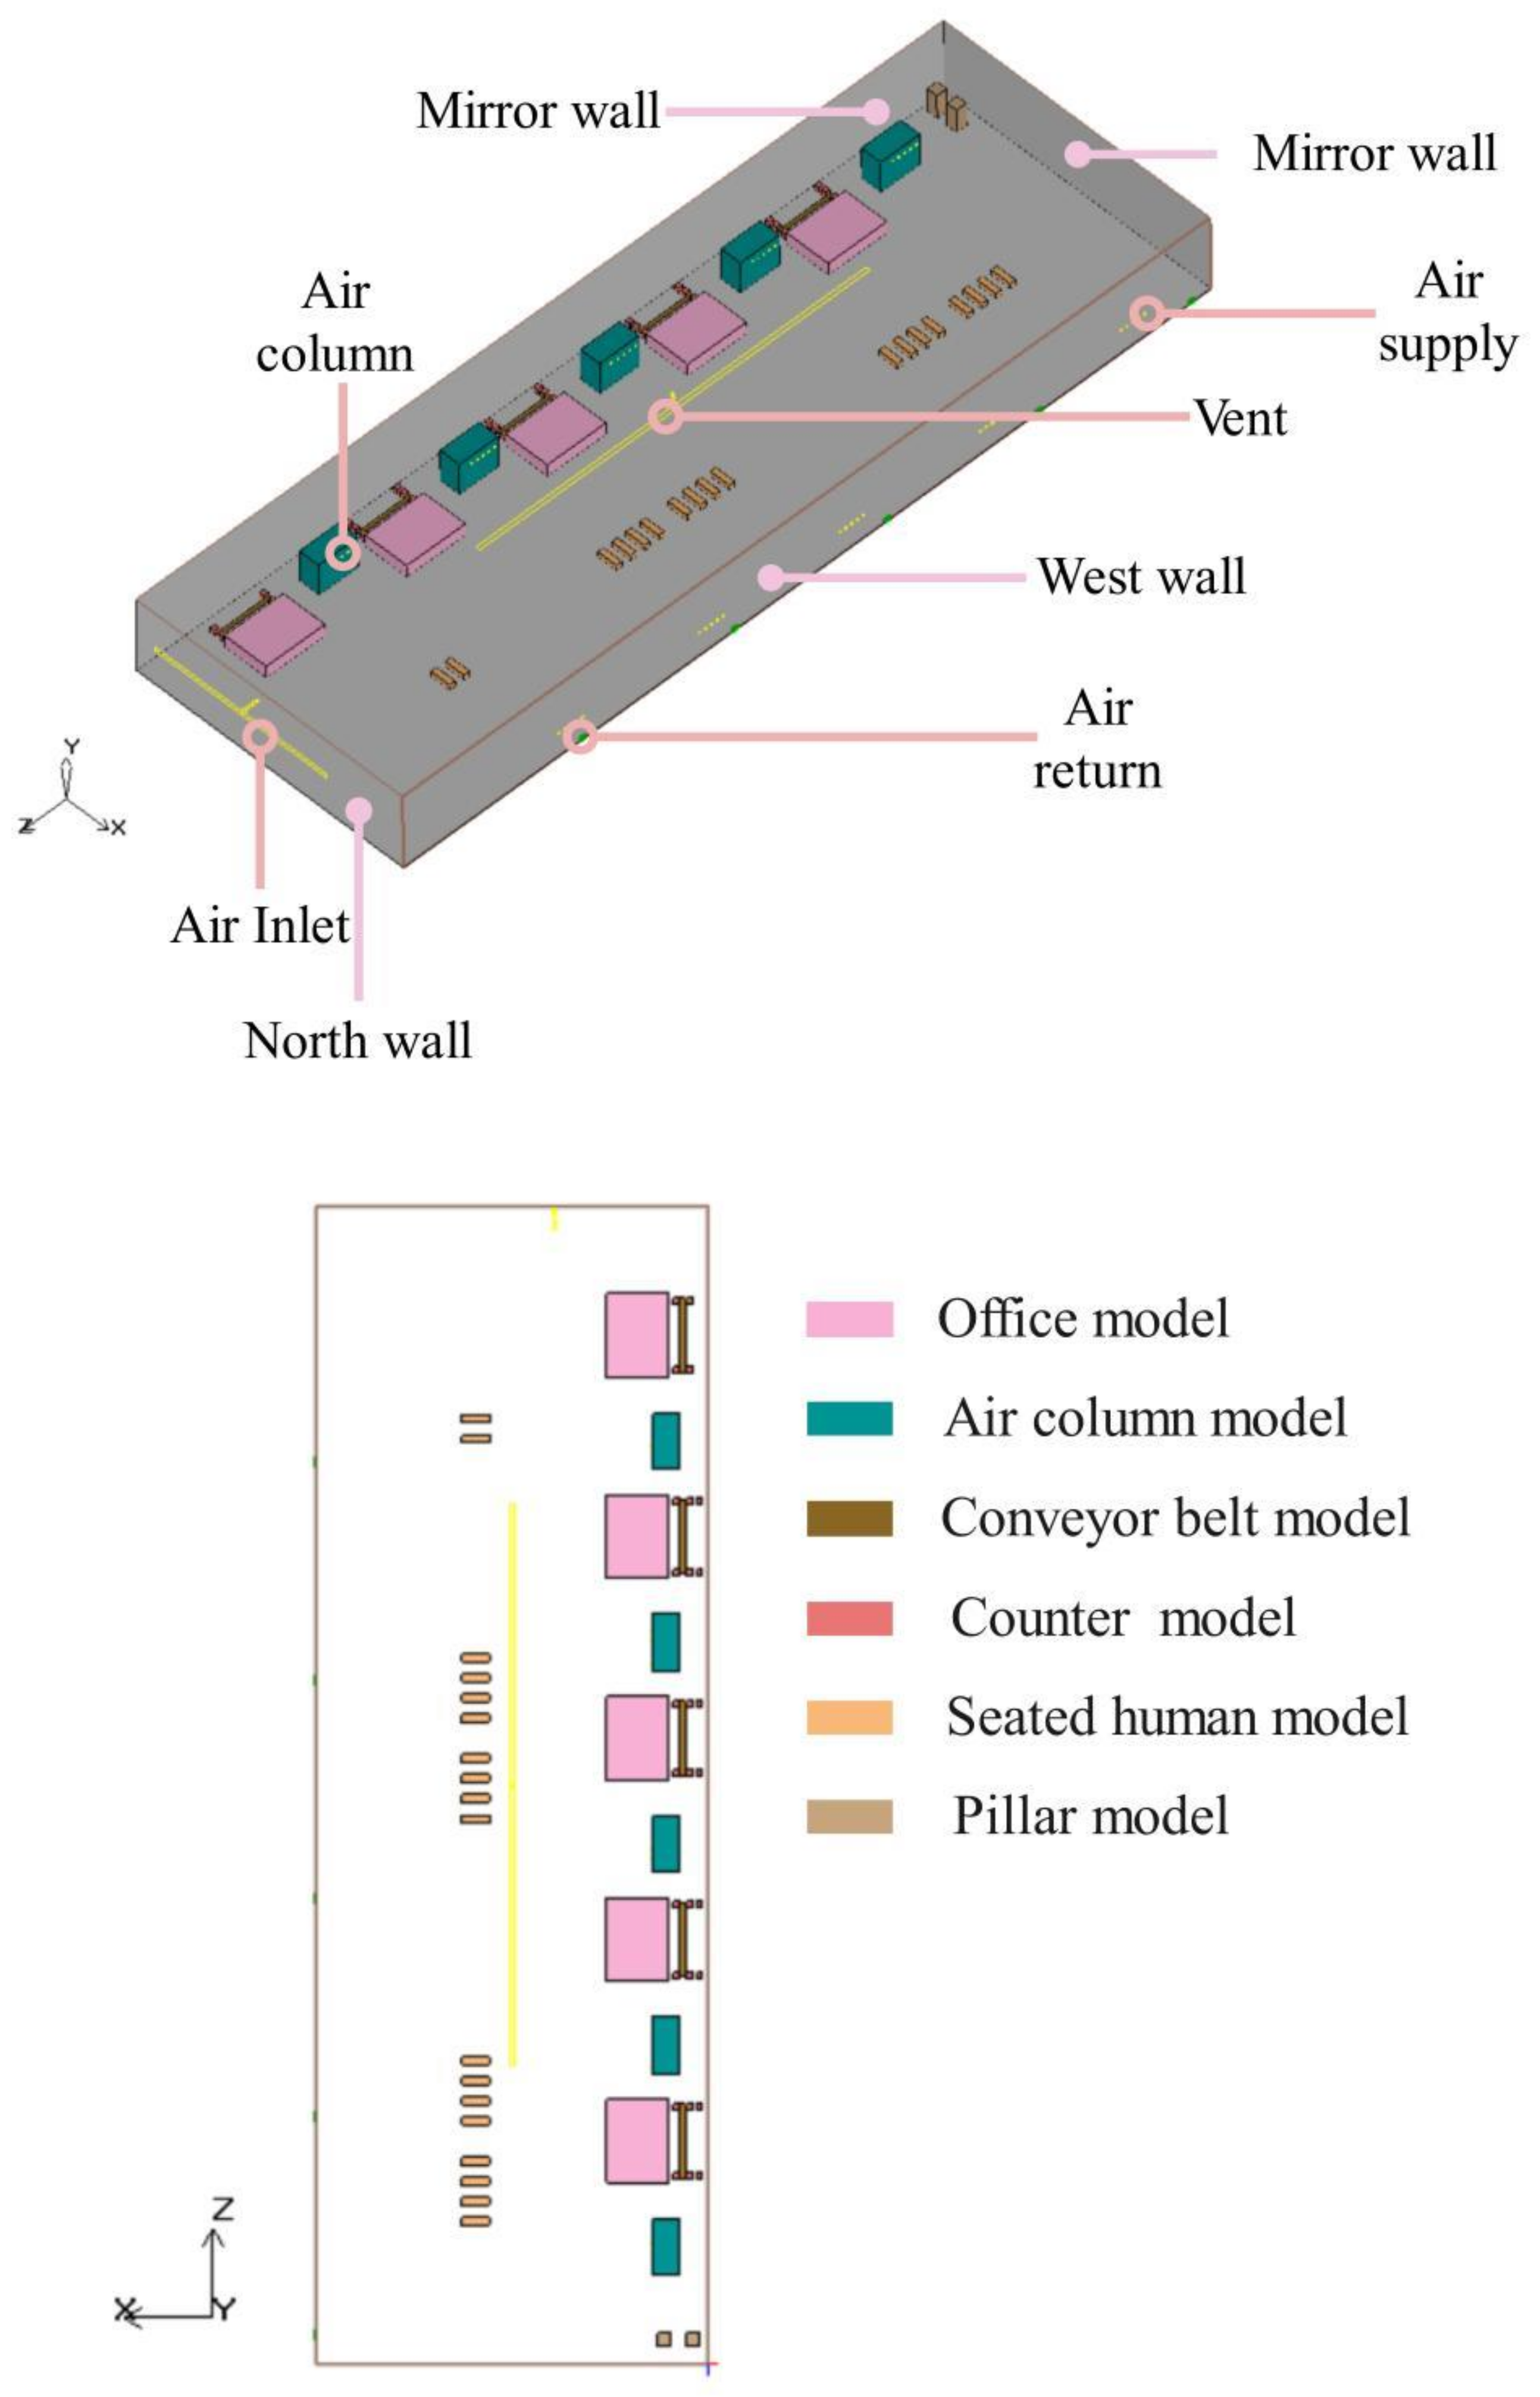
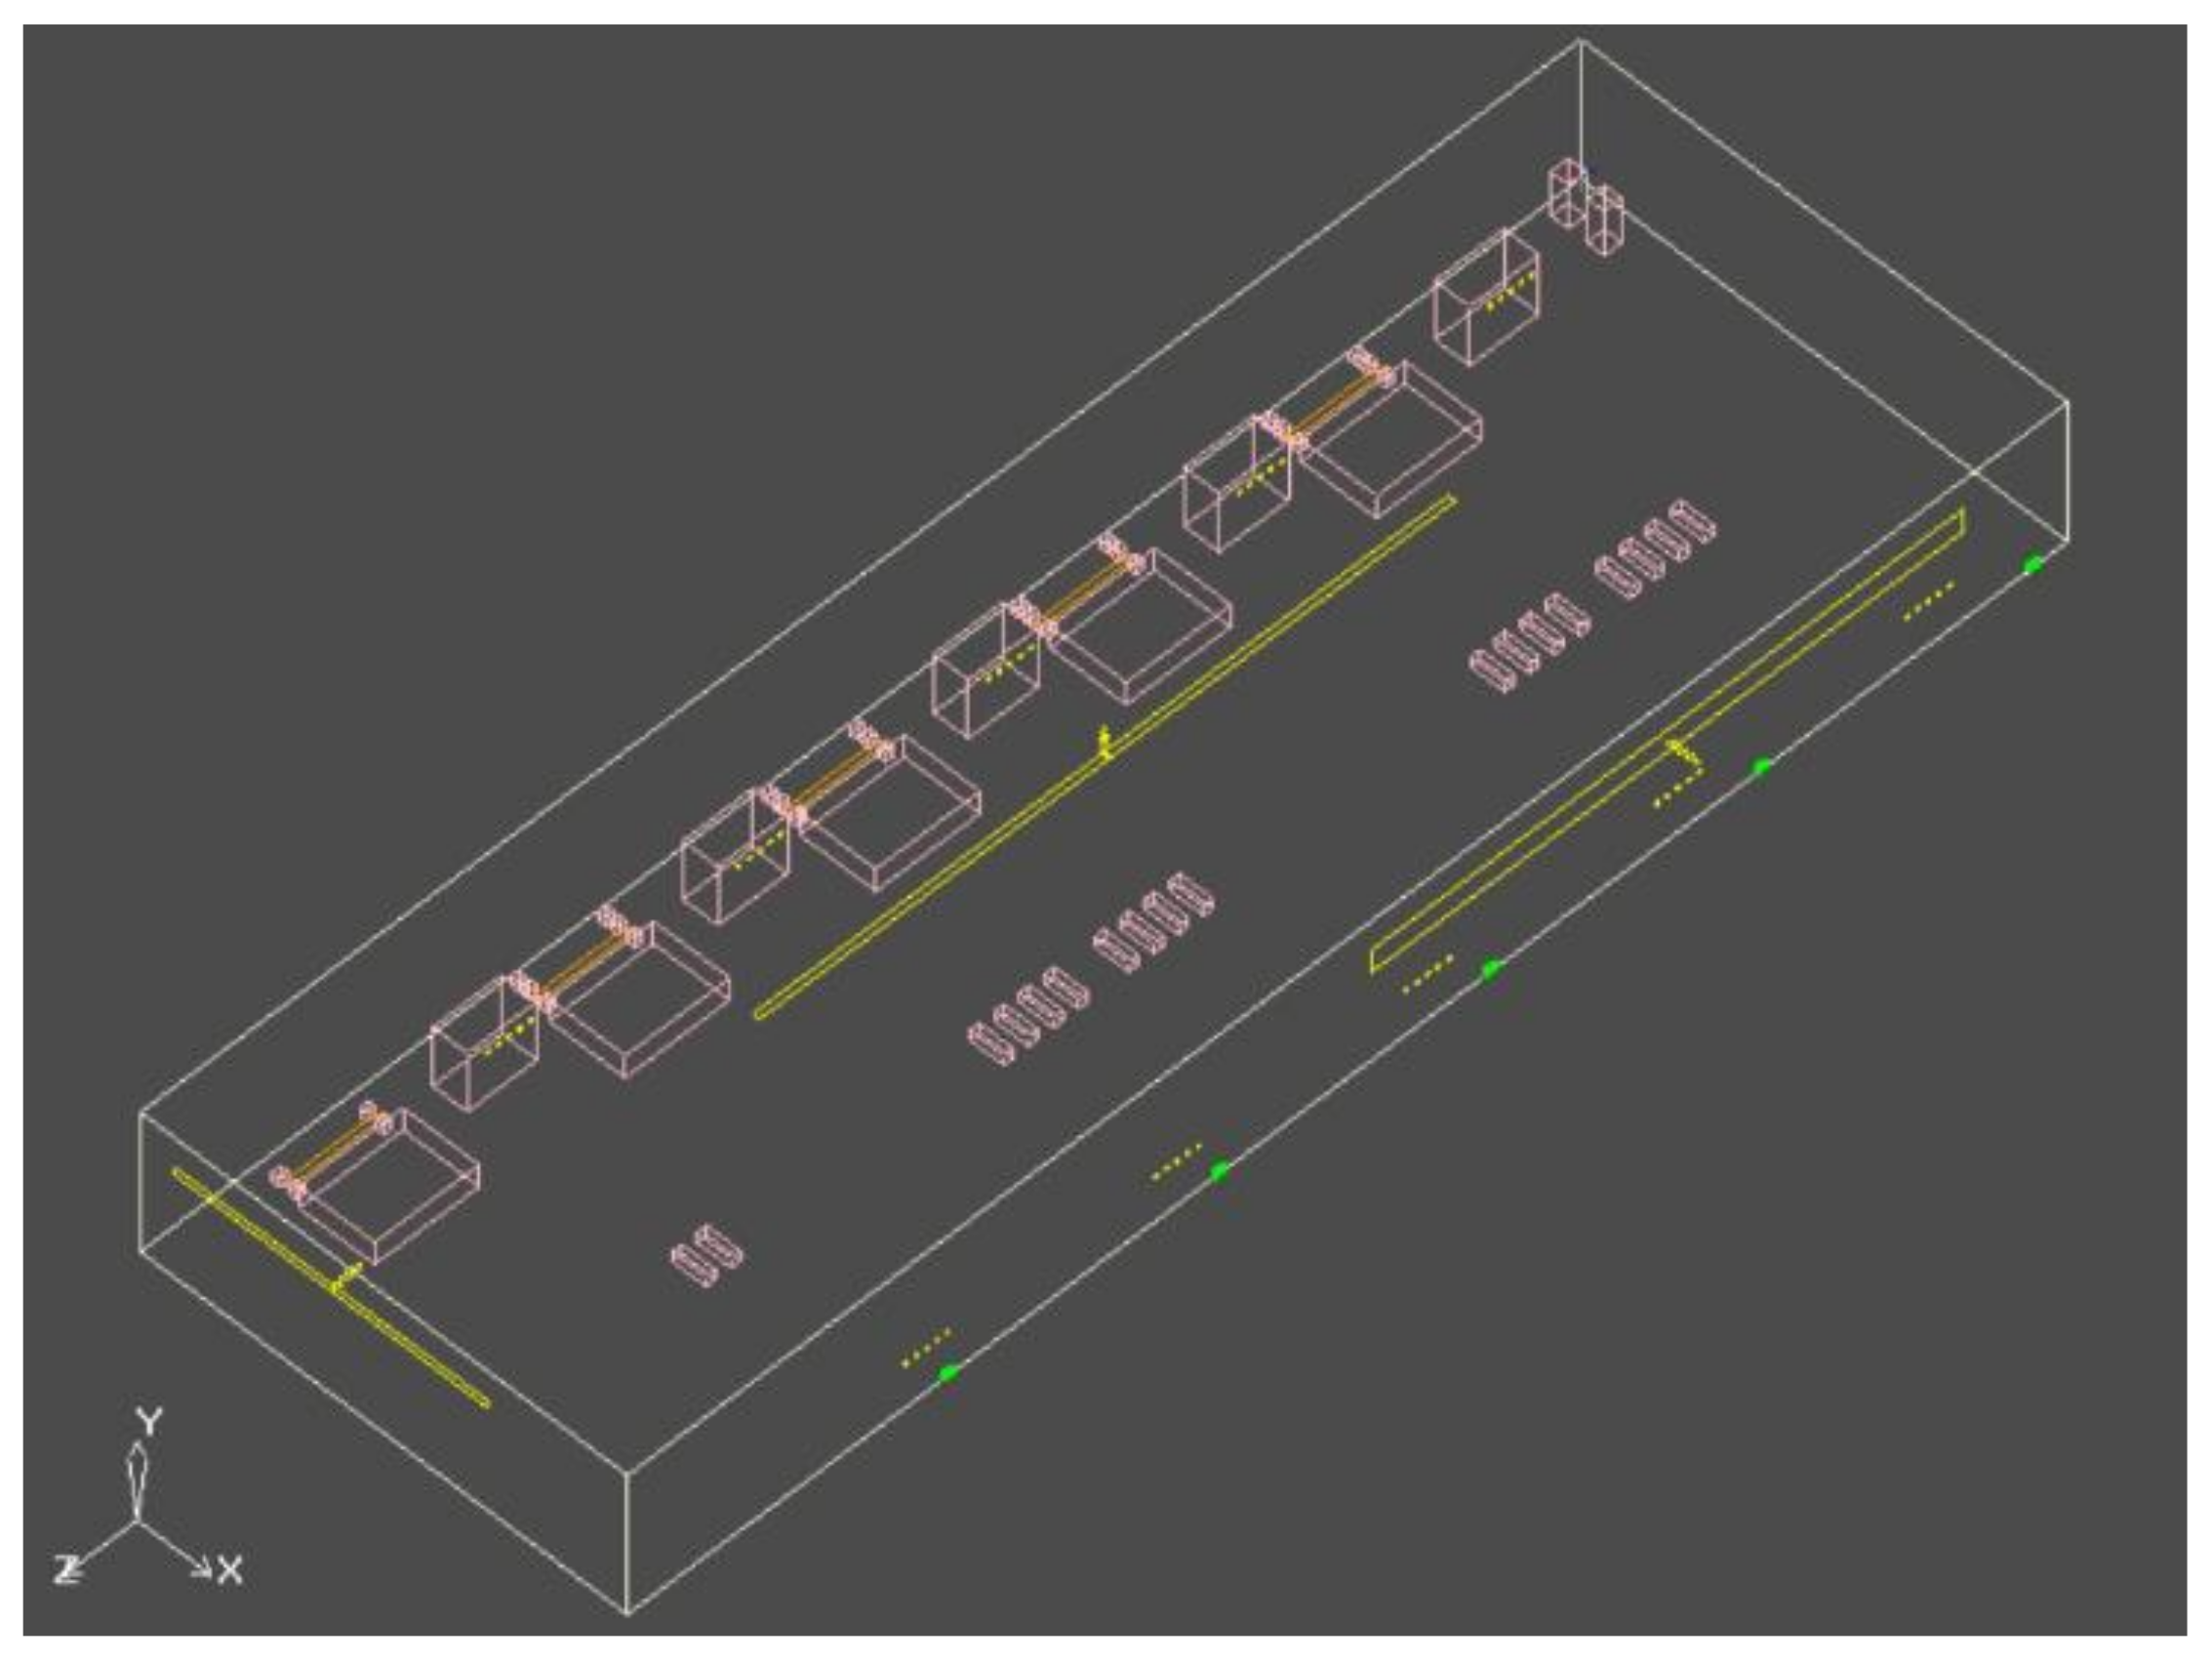
2.1. Physical Model

The schematic plan of the departure hall is depicted in Figure 2. The departure hall is of an airport terminal in Shanghai, 414 m long from east to west, 140 m long from north to south, and about 19 m high. There are 10 check-in islands with a length of 60 m, width of 15 m and interval of 36 m. Because the building is symmetrical, 1/4 of the northwest side of the main building is selected as the research object, with a total area of 14,490 m2.
In order to save calculation time and improve calculation accuracy, adaptive transformation and simplification of the departure hall are made as follows:
(1)
When modeling, it should be as close as possible to the shape of the real object, but the local parts with very complicated shapes are replaced by rectangles.
(2)
The ceiling of the hall is streamlined, and the height of the ceiling varies greatly. In order to facilitate the use of a Cartesian coordinate system to build the model, considering the principle of equal volume conversion, the streamlined ceiling is simplified to a flat roof.
(3)
According to the practical guidelines of Heating and Air Conditioning Design in China (Lu Y, 2008), a total of 948 people in the hall are calculated. There are 18 rows of seats in the hall, with 12 seats in each row, a total of 216 seats. The seats in the hall are back-to-back. Because of the small gap between the seats, they are combined. In the case of check-in, the remaining 732 people are standing. Assuming that there are a certain number of people standing in front of each check-in window, the size of each person is 0.5 × 0.2 × l.75 m, and the interval between every two persons is 0.3 m.
(4)
The equipment in the hall is also simplified by rectangular modules, and the load of the lighting equipment is evenly distributed on the ceiling of the hall.
After the above series of simplifications, the physical model of the departure hall is as Figure 3 shows:
In winter, the use of stratified air conditioners will increase the temperature gradient and further increase heat loss. At the same time, in the air-conditioned area, the vertical temperature has relatively poor uniformity [26]. Studies have shown that using radiant floor heating in winter and stratified air distribution systems in summer have obvious energy-saving effects. Therefore, this paper studies the air distribution of stratified air conditioning in tall and large spaces under summer conditions. The airport terminal is located in Shanghai. According to the local meteorological parameters, we consulted the relevant air conditioning design manual [27] and obtained the indoor and outdoor design parameters, as shown in Table 1.
The cooling and heating load of the air conditioning in the departure hall mainly comes from the heat gain of the enclosure structure, the heat dissipation of the personnel and the heat dissipation of the lighting. The total cooling load of the air-conditioning design of the whole room Q = 2405.34 KW, according to the empirical coefficient 0.7, the cooling load of the stratified air conditioner in summer is calculated to be 1683.738 KW, and the total air supply volume is 297,575 m3/h. Due to the large east–west span of the departure hall, five air supply columns are set up near the check-in island, supplied from both sides by nozzles, the air return is 0.3 m away from the ground, and the size of the return air vent is 4.5 × 1.2 m. The natural ventilation inlet is arranged on the north side, with an area of 45 × 1 m, the air vent is arranged on the west side with an area of 100 × 1 m. When a layered air-conditioning system is used in a large space building, its load energy saving rate is 9–19%, and the higher the floor height, the lower the air supply height, and the higher the energy-saving rate of the stratified air conditioner. According to the practical guidelines of Heating and Air Conditioning Design [27], the air supply height is installed at 6 m in this paper, and the calculation results of air distribution in the departure hall are shown in Table 2 below.

2.2. Numerical Calculation

Based on the finite volume method, assuming that the indoor air is a three-dimensional, incompressible, steady and turbulent ideal gas, the turbulence model selects the RNG-ε model, and the wall function method is often used when dealing with the mass-energy transfer in the near wall airflow. Research shows [28] the RNG-ε model is more accurate than the standard-ε model, which is suitable for the study of indoor turbulence problems in large space buildings. This is example 1 of an equation.
  ( ε ρ U j ) X j = ( μ + μ t σ ε ) 2 ε + C ε 1 ε k μ t S 2 C ε 2 * ρ ε 2 k
η = Sk / ε
where ρ is air density, ε is turbulent energy dissipation rate, U j is air velocity, μ is hydrodynamic viscosity, μ t is turbulent viscosity, k is turbulent kinetic energy, and S is the source term.
C ε 2 * = C ε 2 + C μ η 3 ( 1 η η 0 ) / ( 1 + β η 3 )
where η 0 = 4.38, β 0 = 0.012, C μ = 0.0845, C ε 1 = 1.42, C ε 2 = 1.68, σ k = σ ε = 0.7178.
Due to the large-area glass curtain wall used in the envelope structure of the airport terminal, the effect of radiation needs to be considered. The discrete coordinate (DO) radiation model is used to calculate the radiation propagation path and process and used to describe the coupling of convective heat transfer and long-wave radiation energy exchange between walls, roofs and the ground.
( I ( r , s ) s ) + α + α s I r , s = α n 2 σ T 4 π + σ S 4 π 0 4 π I r , s ϕ s ,   s d Ω
where r is a position vector, s is a direction vector, s is the scattering direction vector, α is the absorption coefficient, n is the refractive index, α s is the scattering coefficient, α is the Stafen–Boltzma constant, I is radiation intensity, depends on position r and direction s, T is the local temperature, ϕ is the phase function, and Ω is a solid angle.
In this paper, the PMV-PPD index is used to evaluate the comfort of airflow organization. PMV (predicted mean vote) index is the average heat sensation index, PPD (predicted percentage of dissatisfied) index is the average value of votes that are expected to be dissatisfied with the thermal environment for the groups expected to be in the thermal environment. As long as you understand the amount of activity of the human body, the amount of clothing, the indoor temperature, humidity, wind speed, and average radiation temperature of the person’s location, using the following formula to calculate, we can obtain the value of PMV.
PMV = [ 0.303 exp 0.36 M +   0.028 ] { M W 3.05 × 10 3 5733 6.99 M W P a 0.42 M W 58.15 1.7 ×   10 5 M 5867 P a 0.0014 M 34 t a 3.96 × 10 8 f cl [ t cl + 273 4 t s ¯ + 273 4 ]   f cl h c t cl t a
where M is the human energy metabolism rate, W is the power the human body makes, P a is the partial pressure of water vapor, t a is air temperature, f cl is the proportion of clothing area, t s ¯ is the average radiation temperature, t cl is the outer surface temperature of clothes, h c is the convective heat exchange coefficient. Among them, t cl , f cl , and h c are calculated by the following formula:
t cl = 35.7 0.028 M W I cl 3.96 × 10 8 f cl × t cl + 273 4 t s ¯ + 273 4 + f cl h c t cl t a
h c = 2.38 t cl t a 0.25 ,   2.38 t cl t a 0.25 > 12.1 ν 12.1 ν ,   2.38 t cl t a 0.25 > 12.1 ν
f cl = 1.00 + 1.290 I cl ,   I cl 0.078 1.05 + 0.645 I cl ,   I cl > 0.078
where ν is air velocity, and I cl is clothing thermal resistance.
PPD is the ratio between the percentage of people dissatisfied with the thermal environment and the predicted average vote. The equation is as follows:
PPD = 100 95 exp { 0.03353 PMV 4 + 0.2179 PMV 2 }
The IS07730 standard proposes that when PMV = 0, PPD = −5%, it means that the indoor thermal environment is in the best thermal comfort state, and 5% of people are still dissatisfied [29]. Since the recommended value is −0.5~0.5, a 10% dissatisfaction rate is allowed. The thermal sensation distribution of the PMV value is shown in the following Table 3.
Thermal comfort measured according to the PMV and PPD index [30], the classification method of the thermal comfort level is shown in Table 4.

2.3. Boundary Conditions

The west and north walls of the departure hall are exterior walls. A 1/4 of the building was selected as the research object, and the east and south walls of the model are mirrored walls. The heat transfer between the walls in the air-conditioning area is uniform, considering the steady-state heat transfer, and the second type of boundary condition is selected as the boundary condition. Among them, the outer wall and the outer surface of the hall roof are not only subjected to the heat effect of the outdoor air temperature but also the heat effect of the solar radiation, so the outdoor integrated temperature is used for calculation. Finding the thermal parameters of the local enclosure structure requires the constant heat flux density of the exterior wall, floor and ceiling of the air-conditioned area. The outer wall is 30.42 w/m2, the ground is 4.5 w/m2, the ceiling is 72.31 w/m2, and the inner wall is the normal wall temperature of 26.6 °C. Human body and heat dissipation equipment are fixed heat, the lighting load is evenly distributed on the ceiling of the hall, and the heat dissipation of personnel is evenly distributed on the ground.
Assuming that the inner surface of the terminal building is uniform in heat transfer, the temperature of the inner surface of each wall is determined by calculation. The outer surface of the enclosure structure is not only subjected to heat from outdoor air, but also to heat transferred by solar radiation. Therefore, the integrated temperature formula is used to calculate the temperature of the inner surface, and the expression is:
t z = t w + ρ I α w
where t z is comprehensive temperature of outdoor air, t w is outdoor air temperature, ρ is the absorption coefficient of the outer surface of the envelope structure to the solar radiation heat transfer, I is the irradiance of the sun on the outer surface of the enclosure structure, α w is the heat transfer coefficient of the outer surface of the envelope.
The calculation formula of air temperature in an indoor non-air-conditioned area is:
t 2 = 1 2 t 1 + t 2 d
t 2 d = t w + 2 ~ 3   ° C
where t 2 is calculated temperature of non-air-conditioned area, t 1 is calculated temperature of air-conditioned area, t 2 d is air temperature near the lower surface of the roof, and t w is outdoor calculated temperature.
The calculation formula of the inner surface temperature of each wall in the air-conditioned area and the non-air-conditioned area:
t b = t n + K Δ t zh α n
where is t n is calculated indoor air temperature, K is the heat transfer coefficient of the envelope structure, Δ t zh is the comprehensive temperature difference, α n is the heat transfer coefficient of the inner surface of the wall, and generally speaking, α n = 8.72 W/(m2·°C).
The boundary temperature values of each surface are shown in Table 5.
Passengers are either walking and sitting, the sensible heat dissipation can be 108 W/p, each module in the rest area is 1296 w, and the average area of personnel is 6 m2/p [31]. There are differences in height, weight, age, and gender from person to person, and different people may also have different heat sensations. For the calculation of PPD and PMV indexes, we consider gender differences in indoor personnel; the average metabolic value of a 70 kg man with a skin surface of 1.8 m2 and a 55 kg woman with a skin surface of 1.6 m2 was used as a reference, in a comfortable environment. The lighting load is 30 W/m2, the heat flux density of the baggage conveyor belt is 15 W/m2, the heat of the CT machine used for baggage inspection is 1500 W, and the computer’s fixed heat is 106 W. The total air supply volume in the air-conditioning area is 297,575 m3/h, the air supply opening adopts a spherical nozzle with a diameter of 0.5 m, the speed is 7.9 m/s, and the size of the return air opening is 4.5 × 1.2 m, which is set as the free flow boundary. The natural ventilation state is stable, and the air inlet adopts the speed inlet boundary condition. The air inlet area is 45 × 1 m arranged on the north side and 9 m high. The exhaust port adopts the boundary condition of the air vent, and the air vent area is 400 × 1 m. On the west side, it is 100 m × 1 m and 14 m high.

3. Results and Discussion

The main influencing factor of indoor airflow organization is the ratio of heat gain in air-conditioned areas and non-air-conditioned areas. Factors such as air supply speed, air supply height, air supply angle, and air supply temperature will all affect the heat gain ratio. Studies [20] have shown that the air supply speed and air temperature difference have a strong influence, while the air supply height, air supply angle and air vent specifications have a weak influence. The air supply speed and the cooling temperature difference were selected as the main influencing factors in this paper. The location and size of the openings for natural ventilation are mainly affected by the local prevailing wind direction and wind pressure distribution on the roof and side walls of the terminal building. The sizes of vents form various pressure fields and pressure differences between the interior and exterior of the vents under indoor conditions, resulting in diverse indoor air distribution. Therefore, reasonable layout of natural ventilation is conducive to indoor air distribution to achieve thermal comfort indicators. This research mainly selects a 1.6 m (Y = 1.6 m) for the height of the cross-section as the discussion object. The cross-section in the working area is the cross-section of the standing human face, and the airflow state of this cross-section has a great impact on passengers.

3.1. The Influence of Air Supply Speed, Air Temperature Difference, and Air Supply Angle

With regards to the gas flow influencing factors of large-space nozzle jets, most researchers analyzed the effect of individual factors. This paper studies the comprehensive effects of three factors: air supply speed, cooling temperature difference, and air supply angle, to obtain the optimal working conditions combination of the stratified air conditioners. Working Condition 1 is the reference working condition, and the parameters of different working conditions are shown in Table 6.
The temperature distribution and velocity distribution cloud diagrams of Y = 1.6 m sections under different working conditions are shown in Figure 4.
Figure 4a–d show that the temperature distribution of Working Condition 2 and Working Condition 3 is more uniform than the temperature distribution of Working Condition 1 and Working Condition 4, and the average temperature is higher. This is because the air supply angle is set to 15° upwards under Working Conditions 2 and 3, which makes the jet have a tendency to flow upwards. Therefore, the sinking of the cold air is reduced, and the cold air access to the air-conditioned area is small, resulting in higher temperatures. Comparing the average temperature of the four working conditions, the average temperature of Working Condition 4 is lower. This is because the cooling temperature difference is large and the cold air diffuses faster, resulting in lower temperatures in the air-conditioned area. The difference in temperature will affect the speed distribution. The average temperature of Working Condition 2 is consistent with the average temperature of Working Condition 3. Therefore, the thermal comfort effect is better as the cooling temperature difference increases and the air supply speed increases, but the thermal comfort is poor. The main influencing factors of air distribution are interrelated, and the optimal combination can be found under the premise of meeting the design specifications.
In the four working conditions, the temperature near the seat is higher. The main reason is that the human body on the seat dissipates heat, and the seat obstructs the flow of air, resulting in higher temperatures on the left and right sides of the seat. After the jet flows through the human body, the jet attenuates and the flow rate becomes slow. The heat exchange becomes worse, which results in high module temperatures in the waiting area. The temperature in the area close to the south wall is obviously higher, because there is little cold air supplied in this area, and it is necessary to arrange air vents to increase the air supply. In Figure 4e–h, Working Conditions 2 and 3 both have air supply speed regions that are significantly close to 1 m/s. This is because the velocity of cold air is high and upward when the air supply angle of these two working conditions is set to 15° upwards. Moreover, the airflow at the natural air inlet of the north wall is relatively violent, in which the surrounding air is entrained and expands rapidly during the flow process. Therefore, the air flow decays slowly, resulting in a high velocity at the interface of Y = 1.6 m. Table 7 summarizes the average value of calculated parameters in the working area (Y = 1.6m) at different working conditions.
Comparing the calculation parameter average value at the working area under four working conditions, the average temperature and average speed of working Condition 4 are within the thermal comfort standard range. The PMV value is 0.428, which meets the thermal comfort requirements. However, the PPD is 15.2%, which indicates that the dissatisfaction is greater than 10%. This may be caused by the higher temperature in the area near the south wall. Therefore, based on the parameters of temperature difference, air supply speed, and air supply angle of Working Condition 4, a coupled operation of a stratified air distribution system and natural ventilation is proposed to meet the thermal comfort requirements.

3.2. Coupling of Stratified Air Conditioning and Natural Ventilation

The ventilation design for the non-air-conditioned area needs to consider the removal of the upper part of the waste heat and reduce the upper air and the surface temperature of the roof, so as to reduce the amount of radiant heat transfer and convective heat transfer in non-air-conditioned areas. Generally, the air inlet should be located at an appropriate height in the non-air-conditioned area, and the temperature of the air inlet should be lower than the air temperature at the same height in the non-air-conditioned area. The lowest position of the air inlet should be 1/3 of the height of the non-air-conditioned area [32]. In this paper, the natural ventilation inlet is selected at 14 m.
The natural ventilation exhaust vents are arranged in two modes: the window opening on the roof or the window opening on the side wall. Reference [33] shows that the opening area required to set the exhaust vent with the roof skylight is smaller than that set the exhaust vent on the high side of the wall. In this way, the ventilation efficiency is higher, which is more conducive to natural ventilation. At the same time, the area of the exhaust vent is based on the external surface wind pressure distribution and the air supply setting of the indoor air conditioning. Different exhaust vent areas form varying pressure fields in the room and a distinct pressure between the inside and outside of the skylight opening, resulting in diverse indoor air distribution. Liu et al. [34] found that the size and location of exhaust vents on the roof can effectively eliminate the stagnation of hot air in the upper space formed by layered air conditioning, which can alleviate the temperature field of the lower air conditioning control area and achieve more energy-saving and comfortable effects. However, the effective area of the exhaust vent is not as large as possible, and it is necessary to find a suitable opening size through simulation. According to the practical guidelines of Heating and Air Conditioning Design and ASHRAE [35] (American Society of Heating, Refrigerating and Air-conditioning Engineers) standard 55-2004 design standards for natural ventilation, it is necessary to arrange different natural vents and find a suitable vent layout for the model. Taking working Condition 4 as the reference object, the parameters of different working conditions are shown in Table 8.
The layout of natural ventilation openings for Working Conditions 4, 5, 6, and 7 are shown in Figure 5, Figure 6, Figure 7 and Figure 8.
The temperature distribution and velocity distribution cloud diagrams of the Y = 1.6 m section under different working conditions are shown in Figure 9.
From the perspective of temperature distribution, the temperature of the area near the south wall in Figure 9a–d gradually tends to the average temperature, and there will be no large areas with excessively high temperatures. Compared with Working Condition 4, an air vent with a height of 14 m and an area of 85 m × 1 m on the side of the west wall was added in Working Condition 5. Comparing Figure 9a,b, due to the effect of the wind pressure on the surface of the exhaust vent, the area with excessively high temperature on the south side of Figure 9a is significantly reduced. In Working Condition 6, the area of the exhaust vent on the west wall was increased on the basis of Working Condition 5, increased to 85× 3 m. Therefore, there is no obvious over-temperature area on the south wall side in Figure 9c. However, the temperature on the north side is higher than the temperature on the south side, which is because the top exhaust vent is set as a long strip exhaust vent with a length of 100 m from north to south and a length of 1 m from east to west. It indicates that such an arrangement of vents can reduce the ventilation efficiency. Compared with Working Condition 5, the temperature of Working Condition 6 is evenly distributed. On the basis of the Working Condition 6, the long-strip air vent is changed to four north–south lengths of 3 m, the exhaust vent with a length of 45 m from east to west are evenly distributed on the ceiling of the hall in Working Condition 7, Figure 9d shows that the temperature distribution in the working area is more even compared with Figure 9c.
As for the speed distribution, compared with the four working conditions of Figure 9e–h, the speed in the waiting area in Figure 9e,f is relatively high, which does not meet the requirements of comfortable speed in the working area. The main reason is that the air flow at the natural air inlet of the north wall of Working Condition 4 and Working Condition 6 is relatively violent, and the surrounding air is entrained during the flow and the air flow expands rapidly, which means that the air flow decays slowly. As we can see in Figure 9f, the airflow is accelerated under the action of wind pressure and the speed decays faster. It demonstrates that the effective area of the natural exhaust vent on the west wall in Working Condition 5 is properly arranged. The velocity distribution of Figure 9h is more even than that of Figure 9f, because the roof exhaust vents are evenly distributed. Compared with the previous arrangement of only one elongated exhaust vent, this way of evenly distributing the exhaust vents is more suitable for this model. Table 9 summarizes the average value of calculated parameters in the working area under different working conditions.
Comparing the parameters of four working conditions, the average temperatures, average speeds, and PMV values are within the indicators of Thermal Comfort Grade II, while the dissatisfactions of working Conditions 4, 5 and 6 are all greater than 10%. Since the thermal comfort evaluation requires multiple indicators to reach the specified value, Working Condition 4, 5 and 6 cannot meet the thermal comfort requirements. Under comprehensive evaluation, the calculation result of Working Condition 7 is the best. The PMV value is 0.071, closed to 0, and the PPD value is 9.76%, less than 10%. The results show that Working Condition 7 meets the thermal comfort requirements, which is consistent with the comparison result of the temperature distribution map and the speed distribution map.

4. Conclusions

This paper studies the coupled operation of stratified air-conditioning and natural ventilation under the multivariable influencing factors in the departure hall of an airport terminal. First, the effect of indoor multivariable factors on stratified air-conditioning was simulated based on CFD, and the PMV-PPD index was used as the thermal comfort index to determine the natural ventilation vent layout scheme suitable for the model. Then, different designs of natural ventilation coupling operating with stratified air-conditioning were studied. The main conclusions are as follows:
(1)
The main influencing factors of the layered air conditioning design for large space buildings are the supply air temperature difference and the supply air speed. These two main influencing factors are mutual influence. The optimal selection of the supply air temperature difference and the supply air speed needs to be based on the design manual and the actual situation of the model. A coupled operation with natural ventilation will cause an upward angle of the cool air blowing into the air-conditioning area, resulting in a temperature rise, slow decay airflow, and wind speed exceeding the working area of comfort. Comparing the four working conditions, when the air supply speed is 5.9 m/s, the cooling temperature difference is 11 °C, the air supply angle is 0 °C, and the airflow organization effect at the interface of Y = 1.6 m is the optimal. In this working condition, the PMV value is 0.428. However, the dissatisfaction is 15.2%, which is still higher than the thermal comfort requirement of 10%. Therefore, there is a need to further study natural ventilation to improve thermal comfort.
(2)
Natural ventilation can effectively improve thermal comfort, and the layout of the air vent has a great influence. The area of natural vents is based on the external surface wind pressure distribution and the air supply of the indoor air conditioner, which means different vent areas form varying pressure fields in the room and between the inside and outside of the skylight opening, resulting in different indoor air distribution. After comparison of four different natural ventilation air outlet layout schemes, setting up a 45 × 1 m air outlet at a height of 14 m on the north wall side, an 85 × 3 m exhaust outlet on the side of the west wall, four exhaust outlets 3 m long from north to south and 45 m long from east to west on the roof of the hall had the best air organization effect. The PMV value is 0.071, and the dissatisfaction is 9.76%, which can be reduced by 35.8% compared with non-natural ventilation. The numerical simulation results show that a reasonable coupling scheme of stratified air conditioning and natural ventilation is beneficial to the distribution of indoor air distribution and can significantly improve the environmental thermal comfort.

Author Contributions

Conceptualization, Y.Y. and Q.L.; methodology, Z.D.; software, Z.D. and H.H.; validation, Z.D., Y.Y. and Q.L.; formal analysis, Z.D.; investigation, Z.D. and H.H.; resources, Y.Y. and Z.D.; data curation, Z.D.; writing—original draft preparation, Z.D.; writing—review and editing, Z.D. and L.Z.; visualization, Z.D. and H.H.; supervision, Y.Y. and Q.L.; project administration, Y.Y., Z.D. and L.Z.; funding acquisition, Y.Y. All authors have read and agreed to the published version of the manuscript.

Funding

This research was funded by the Science and Technology Commission of Shanghai Municipality, grant number (NO.19DZ1206700).

Institutional Review Board Statement

Not applicable.

Informed Consent Statement

Not applicable.

Data Availability Statement

Not applicable.

Acknowledgments

The research described in this paper was supported by the Science and Technology Commission of Shanghai Municipality (NO.19DZ1206700). Special thanks to all the kind airport staff who provided help.

Conflicts of Interest

The authors declare no conflict of interest.

References

  1. Kotopouleas, A.; Nikolopoulou, M. Evaluation of Comfort Conditions in Airport Terminal Buildings. Build. Environ. 2018, 130, 162–178. [Google Scholar] [CrossRef]
  2. Kim, S.-C.; Shin, H.-I.; Ahn, J. Energy Performance Analysis of Airport Terminal Buildings by Use of Architectural, Operational Information and Benchmark Metrics. J. Air Transp. Manag. 2020, 83, 101762. [Google Scholar] [CrossRef]
  3. Liu, X.; Lin, L.; Liu, X.; Zhang, T.; Rong, X.; Yang, L.; Xiong, D. Evaluation of Air Infiltration in a Hub Airport Terminal: On-Site Measurement and Numerical Simulation. Build. Environ. 2018, 143, 163–177. [Google Scholar] [CrossRef]
  4. Zeren, C.; Tuba, F. Energy Performance Analysis of Adnan Menderes International Airport (ADM). Master’s Thesis, The Graduate School of Engineering and Sciences of Izmir Institute of Technology, Ulla, Turkey, 2010. [Google Scholar]
  5. Yang, L.; Li, K.; Yang, G.; Zhang, X.C. The Design of Airport Flood Lighting Energy-Saving Control System. Appl. Mech. Mater. 2014, 492, 499–502. [Google Scholar] [CrossRef]
  6. Liu, X.; Liu, X.; Zhang, T.; Li, L. An Investigation of the Cooling Performance of Air-Conditioning Systems in Seven Chinese Hub Airport Terminals. Indoor Built Environ. 2019, 30, 229–244. [Google Scholar] [CrossRef]
  7. Pichatwatana, K.; Wang, F.; Roaf, S.; Anunnathapong, M. An Integrative Approach for Indoor Environment Quality Assessment of Large Glazed Air-Conditioned Airport Terminal in the Tropics. Energy Build. 2017, 148, 37–55. [Google Scholar] [CrossRef]
  8. Zhuang, B.; Shi, J.; Chen, Z. Numerical Study on Indoor Environment and Thermal Comfort in Train Station Waiting Hall with Two Different Air-Conditioning Modes. Build. Simul. 2021, 14, 337–349. [Google Scholar] [CrossRef]
  9. Huang, C.; Li, R.; Liu, Y.; Liu, J.; Wang, X. Study of Indoor Thermal Environment and Stratified Air-Conditioning Load with Low-Sidewall Air Supply for Large Space Based on Block-Gebhart Model. Build. Environ. 2019, 147, 495–505. [Google Scholar] [CrossRef]
  10. Cheng, Y.; Niu, J.; Du, Z.; Lei, Y. Investigation on the Thermal Comfort and Energy Efficiency of Stratified Air Distribution Systems. Energy Sustain. Dev. 2015, 28, 1–9. [Google Scholar] [CrossRef]
  11. Remion, G.; Moujalled, B.; El Mankibi, M. Review of Tracer Gas-Based Methods for the Characterization of Natural Ventilation Performance: Comparative Analysis of Their Accuracy. Build. Environ. 2019, 160, 106180. [Google Scholar] [CrossRef]
  12. Dai, M.H.; Zhou, Z.P.; Xue, X. Test and Energy Consumption Analysis of Air-Conditioning Systems in Terminal Building of Guilin Liangjiang International Airport. Appl. Mech. Mater. 2012, 170–173, 2652–2656. [Google Scholar] [CrossRef]
  13. Baxter, G.; Srisaeng, P.; Wild, G. Sustainable Airport Energy Management: The Case of KANSAI International Airport. Int. J. Traffic Transp. Eng. 2018, 8, 334–358. [Google Scholar]
  14. Li, A.; Ren, T.; Yang, C.; Xiong, J.; Tao, P. Numerical Simulation, PIV Measurements and Analysis of Air Movement Influenced by Nozzle Jets and Heat Sources in Underground Generator Hall. Build. Environ. 2018, 131, 16–31. [Google Scholar] [CrossRef]
  15. Javad, K.; Navid, G. Thermal Comfort Investigation of Stratified Indoor Environment in Displacement Ventilation: Climate-Adaptive Building with Smart Windows. Sustain. Cities Soc. 2019, 46, 101354. [Google Scholar] [CrossRef]
  16. Nishioka, T.; Ohtaka, K.; Hashimoto, N.; Onojima, H. Measurement and Evaluation of the Indoor Thermal Environment in a Large Domed Stadium. Energy Build. 2000, 32, 217–223. [Google Scholar] [CrossRef]
  17. Zhao, K.; Liu, X.-H.; Jiang, Y. On-Site Measured Performance of a Radiant Floor Cooling/Heating System in Xi’an Xianyang International Airport. Sol. Energy 2014, 108, 274–286. [Google Scholar] [CrossRef]
  18. Liu, X.; Zhang, T.; Liu, X. Outdoor air supply in winter for large-space airport terminals: Air infiltration vs. mechanical ventilation. Build. Environ. 2021, 190, 107545. [Google Scholar] [CrossRef]
  19. Cheng, Y.; Yang, B.; Lin, Z.; Yang, J.; Jia, J.; Du, Z. Cooling Load Calculation Methods in Spaces with Stratified Air: A Brief Review and Numerical Investigation. Energy Build. 2018, 165, 47–55. [Google Scholar] [CrossRef]
  20. Wang, Y.; Wong, K.K.L.; Du, H.; Qing, J.; Tu, J. Design Configuration for a Higher Efficiency Air Conditioning System in Large Space Building. Energy Build. 2014, 72, 167–176. [Google Scholar] [CrossRef]
  21. Wang, H.; Zhou, P.; Guo, C.; Tang, X.; Xue, Y.; Huang, C. On the Calculation of Heat Migration in Thermally Stratified Environment of Large Space Building with Sidewall Nozzle Air-Supply. Build. Environ. 2019, 147, 221–230. [Google Scholar] [CrossRef]
  22. Liu, X.; Liu, X.; Zhang, T. Influence of Air-Conditioning Systems on Buoyancy Driven Air Infiltration in Large Space Buildings: A Case Study of a Railway Station. Energy Build. 2020, 210, 109781. [Google Scholar] [CrossRef]
  23. Yu, T.; Heiselberg, P.; Lei, B.; Pomianowski, M.; Zhang, C. A Novel System Solution for Cooling and Ventilation in Office Buildings: A Review of Applied Technologies and a Case Study. Energy Build. 2015, 90, 142–155. [Google Scholar] [CrossRef]
  24. Ma, J.S.; Liu, X.T.; Zhuang, D.M.; Wang, S.G. CFD-Based Design of the Natural Ventilation System of the Traffic Center of T3 in Beijing International Airport. Adv. Mater. Res. 2011, 291–294, 3292–3295. [Google Scholar] [CrossRef]
  25. Cheng, Z.; Li, L.; Bahnfleth, W.P. Natural Ventilation Potential for Gymnasia—Case Study of Ventilation and Comfort in a Multisport Facility in Northeastern United States. Build. Environ. 2016, 108, 85–98. [Google Scholar] [CrossRef]
  26. Xu, Y.; Wang, X.; Shi, C.; Huai, X.; Wang, F. Vertical Temperature Profiles and Cooling Load in Large Spaces Ventilated by Stratified Air-Conditioning Systems: Scale-Model Experiment and Nodal Modeling. J. Therm. Sci. Eng. Appl. 2020, 12, 051008. [Google Scholar] [CrossRef]
  27. Lu, Y.Q. Heating, Ventilation, and Air Conditioning Design Manual, 7th ed.; China Construction Industry Press: Beijing, China, 2008. [Google Scholar]
  28. Rohdin, P.; Moshfegh, B. Numerical Predictions of Indoor Climate in Large Industrial Premises. A Comparison between Different k–ε Models Supported by Field Measurements. Build. Environ. 2007, 42, 3872–3882. [Google Scholar] [CrossRef]
  29. Sandberg, M. What Is Ventilation Efficiency? Build. Environ. 1981, 16, 123–135. [Google Scholar] [CrossRef]
  30. Esteves, D.; Silva, J.; Rodrigues, N.; Martins, L.; Teixeira, J.; Teixeira, S. Simulation of PMV and PPD Thermal Comfort Using EnergyPlus. In Computational Science and Its Applications—ICCSA 2019; Springer: Cham, Switzerland, 2019; pp. 52–65. [Google Scholar]
  31. Lin, L.; Liu, X.; Zhang, T.; Liu, X.; Rong, X. Cooling Load Characteristic and Uncertainty Analysis of a Hub Airport Terminal. Energy Build. 2021, 231, 110619. [Google Scholar] [CrossRef]
  32. Cai, N.; Zhang, D.; Huang, C. A Study on Stratified Air Conditioning Cooling Load Calculation Model for a Large Space Building. Int. J. Heat Technol. 2018, 36, 457–462. [Google Scholar] [CrossRef]
  33. Meng, Q.L.; Li, Q.; Zhao, L.H.; Li, L.; Chen, Z.L.; Chen, Y.; Wang, S.X. A Case Study of the Thermal Environment in the Airport Terminal Building under Natural Ventilation. J. Asian Arch. Build. Eng. 2009, 8, 221–227. [Google Scholar] [CrossRef]
  34. Liu, X.; Zhang, T.; Liu, X.; Li, L.; Lin, L.; Jiang, Y. Energy Saving Potential for Space Heating in Chinese Airport Terminals: The Impact of Air Infiltration. Energy 2021, 215, 119175. [Google Scholar] [CrossRef]
  35. The ASHRAE Standard 55-2004: Thermal Environmental Conditions for Human Occupancy. 2004. Available online: https://www.antpedia.com/standard/5158093.html (accessed on 24 January 2003).
Figure 1. Schematic diagram of airflow organization of stratified air conditioner.
Energies 14 08130 g001
Figure 2. Three-dimensional drawing of 1/2 of the departure hall.
Energies 14 08130 g002
Figure 3. Three-dimensional model of the northwest 1/4 of the main building of the departure hall.
Energies 14 08130 g003
Figure 4. Temperature field and velocity field at a height of 1.6 under different working conditions ((ad): temperature field (°C); (eh): velocity field (m/s)).
Energies 14 08130 g004aEnergies 14 08130 g004bEnergies 14 08130 g004c
Figure 5. Working Condition 4 layout of natural vents.
Energies 14 08130 g005
Figure 6. Working Condition 5 layout of natural vents.
Energies 14 08130 g006
Figure 7. Working Condition 6 layout of natural vents.
Energies 14 08130 g007
Figure 8. Working Condition 7 layout of natural vents.
Energies 14 08130 g008
Figure 9. Temperature field and velocity field at a height of 1.6 under different working conditions ((ad) temperature field; (eh) velocity field).
Energies 14 08130 g009aEnergies 14 08130 g009b
Table 1. Indoor and outdoor design parameters.
Outdoor Design Parameters
Atmospheric pressure (Pa)100,570
Air conditioner calculates the average daily
outdoor temperature (°C)
31.3
Air conditioner calculates outdoor dry bulb temperature (°C)34.6
Air conditioner calculates outdoor wet bulb temperature (°C)28.2
Average outdoor wind speed in summer (m/s)3.4
Dominant wind directionSouthwest wind
Interior design parameters
Temperature26
Relative humidity (%)°55–60
Average speed of working area (m/s)≤0.35
Fresh air volume (m3/h·P)40
Table 2. Calculation results of air distribution in the departure hall.
ParameterResultParameterResult
Stratified air distribution system
cooling load (KW)
1683.738Total air supply (m3/h)297,575
Installation height of nozzle (m)6Range (m)30.69
Nozzle diameter (m)0.5Number of nozzles91
Air supply speed (m/s)7.9Supply air temperature (℃)19
Table 3. PMV index.
Table 3. PMV index.
Hot SensationHotWarmSlightly WarmModerateSlightly CoolCoolCold
PMV index+3+2+10−1−2−3
Table 4. PMV-PPD classification.
Thermal Comfort LevelPMVPPD
Grade I−0.5~0.5≤10%
Grade II−1~0.5≤27%
0.5~1
Table 5. Boundary temperature value of each inner surface of the departure hall wall.
AreaAir-Conditioned AreaNon-Air-Conditioned Area
Inner surface nameWest curtain wallEast wallSouth wallNorth curtain wallRoofWest curtain wallEast wallSouth wallNorth curtain wall
Indoor air temperature (tn/°C)2626262630.1530.1530.1530.1530.15
Heat transfer coefficient of envelope structure(k)/(W/m2·°C)1.81.81.81.82.041.81.81.81.8
Outdoor comprehensive calculation
temperature(tz)/°C
42.9292942.965.642.9292942.9
Convection heat transfer coefficient of inner surface(an)/(w/m2·°C)8.78.78.78.78.78.78.78.78.7
The inner surface temperature of the enclosure structure(tw)29.426.626.629.438.432.729.929.932.7
Table 6. Different working conditions parameters.
Working ConditionCooling Temperature
Difference (°C)
Air Supply
Speed (m/s)
Air Supply
Angle (°)
Natural Ventilation
Air Inlet (m2)
Natural Ventilation
Air Vent (m2)
177.90North side 45 × 1 mCeiling 100 × 1 m
295.915North side 45 × 1 mCeiling 100 × 1 m
367.915North side 45 × 1 mCeiling 100 × 1 m
4115.90North side 45 × 1 mCeiling 100 × 1 m
Table 7. Summary of the average value of calculation parameters at the working area under different working conditions.
Working ConditionAverage Temperature (°C)Average Speed (m/s)PMVPPD (%)
126.40.3941.3223.6%
228.80.3971.7834.3%
328.80.3931.9633.6%
425.40.3040.42815.2%
Table 8. Different working condition parameters.
Working ConditionCooling Temperature
Difference (°C)
Air Supply
Speed (m/s)
Air Supply
Angle (°)
Natural Ventilation
Air Inlet (m2)
Natural Ventilation
Air Vent (m2)
4115.9045 × 1 m at north wall100 × 1 m at ceiling
5115.9045 × 1 m at north wall100 × 1 m at ceiling,
85 × 1 m at west wall
6115.9045 × 1 m at north wall100 × 1 m at ceiling,
85 × 3 m at west wall
7115.9045 × 1 m at north wallfour 45 × 3 m at ceiling,
85 × 3 m at west wall
Table 9. Summary of the average value of calculation parameters in the working area under different working conditions.
Working ConditionAverage Temperature (°C)Average Speed (m/s)PMVPPD (%)
425.40.3040.42815.2%
525.20.2990.38915.0%
625.10.3230.29512.9%
724.50.3230.0719.76%
Publisher’s Note: MDPI stays neutral with regard to jurisdictional claims in published maps and institutional affiliations.

