Article

Lifetime Estimation Based Health Index and Conditional Factor for Underground Cable System

by
Tanachai Somsak
1,
Thanapong Suwanasri
1,* and
Cattareeya Suwanasri
2
1
Electrical and Computer Engineering, The Sirindhorn International Thai-German Graduate School of Engineering (TGGS), King Mongkut’s University of Technology North Bangkok, Bangkok 10800, Thailand
2
Department of Electrical and Computer Engineering, Faculty of Engineering, King Mongkut’s University of Technology North Bangkok, Bangkok 10800, Thailand
*
Author to whom correspondence should be addressed.
Energies 2021, 14(23), 8113; https://doi.org/10.3390/en14238113
Submission received: 8 November 2021 / Revised: 24 November 2021 / Accepted: 30 November 2021 / Published: 3 December 2021

Abstract

:
In this paper, a lifetime estimation method for underground cable systems is proposed by combining a health index (HI) and conditional factor (CF). The underground cable system consists of underground cable, joint, termination, manhole, and duct bank. The HI is an indicator to indicate the actual condition of underground cable components and systems whereas the CF is used to indicate different operating stresses of the system under different operating conditions such as percentage loading, electrical stresses, laying structure, environment, etc. The actual technical data as well as historical operating and testing records are applied. The weighting and scoring method with the analytical hierarchy process are used to classify an importance of underground cable components, testing methods, and criteria used in the HI and CF calculation. The annual calculated HIs are plotted to investigate the lifetime trending curve by using a polynomial function. The degradation curve based on calculated CF is estimated by using the Weibull distribution function. Finally, the remaining life of the underground cable system is determined by matching the lifetime trending curve with the degradation curve. Ten practical underground cable systems supplying power in a high voltage power delivery system are evaluated with effective results. The lifetime of the underground cable system can be successfully estimated.

1. Introduction

Underground power cable systems have been widely used in many countries, not only in transmission and distribution systems but also in industrial areas. The number of cable installations keeps increasing to improve effectiveness, reliability, trustworthiness, cost, and risk of power systems as well as better aesthetic view of a community. Nevertheless, the increasing number of underground cable system failures has also been recognized. Both visible and invisible degradations of the cable system could be caused by installation defects, as well as electrical, thermal, and mechanical stresses as well as possible damages to installation sites and the operational environment [1,2]. Thus, to maintain the acceptable condition of a cable system, the utility needs to recognize the actual condition and the end of life of their own asset for proper management and effective planning of repair, renovation or replacement of the defective asset before damage [3]. Currently, many testing methods have been applied to assess the condition of underground cable systems and their components, such as partial discharge measurement to determine the type of defect [4] and localization technique [5,6], insulation resistance measurement and resistance of the earthing connection [7], ampacity and sheath voltage measurement [8], and thermography inspection [9], etc. Then, the quantitative health index, which regularly processes the inspection and testing results according to an organization’s inspection interval to represent the actual condition of underground cable system, has been proposed in previous research works [10]. However, the proposed health index is static and probably only updated annually after the annual routine inspection and testing are performed. Since this static health index is annually evaluated and recorded in the central database, its decreasing trend can be observed from the plotting of its historical value against usage time and the remaining lifetime can be estimated [11]. This numerical technique is interesting, but it requires accuracy improvement to become an effective tool to facilitate the lifetime estimation of an underground cable system. In addition, the lifetime estimation of the underground cable system is of prime concern for utilities, especially as a novel technique to prevent the aging analysis of polymeric material from the cut sample of considered underground cable [12], which is nearly impossible to obtain from the highly significant cable route.
Therefore, this paper aims to estimate the remaining lifetime of underground cable systems based on predictive health index and the conditional factor to incorporate the degradation behavior of each underground cable system. Firstly, the future health index is predicted by applying the curve fitting technique to the plot of historical static health index values with usage time [13]. Theoretically, its end of lifetime can be estimated when the predictive health index is crossing the acceptable value. Then, to improve lifetime estimation accuracy, the conventional static health index is modified to the dynamic health index by incorporating the actual degradation of each individual cable route due to differences in operating condition, cable route configuration, network reliability, and operational environment [14,15], which is known as the conditional factor. Then, this modified or dynamic health index is plotted against usage time to accurately determine the remaining lifetime of each cable system. With the obtained remaining lifetime of each underground cable system, the organization can properly set up an effective plan for replacement of the existing underground cable routes based on available budgets and human resources [16].
The working procedure of this paper starts from the conventional static health index (HI) calculation for condition assessment of the underground cable system and its components by applying the weighting and scoring method (WSM) and the analytic hierarchy process (AHP). The scoring technique is used to transform the raw inspection and testing result from each test method to a quantitative value known as score, while the weighting technique is used to assign the numerical value representing the importance of each test method as well as the significance of each component in an underground cable system known as weighting value. To obtain the consensus of weighting determination in the organization, the analytic hierarchy process as a multi-criterion decision-making technique involving pairwise comparison is applied to solve complex decisions, which is difficult to quantify. The AHP technique is applied to brainstorm the opinions of the experts from various departments working with underground cable systems in an organization to determine the weighting value as a percentage of significance for all condition evaluation criteria as well as the weighting of each major component for condition assessment [10,17]. Five major components of underground cable systems (underground cable, joint, termination, manhole, and duct bank) are classified. Various test methods and corresponding results of all components were used. Thereafter, the annual HIs were plotted versus the time to obtain a lifetime trending curve. By using the polynomial function for curve fitting, the predictive health index can be determined. In addition, actual technical and historical operating data were also considered as conditional factors representing the degradation behavior regarding practical usage by using the Weibull distribution method [18]. Lastly, the lifetime trending curve of the underground cable system was adjusted by multiplying the health index with the conditional factor to obtain the dynamic health index trending curve with respect to usage time. Finally, the lifetime of the underground cable system can be successfully determined. The calculation procedure of the aforementioned process is represented in Figure 1.
In Figure 2, an underground cable system in an industrial estate consists of underground cable, joint, termination, manhole, and duct bank, i.e., system B-B’. A failure of the underground cable system could cause a huge impact to customers due to power interruption in industrial processes. To avoid such unexpected power outages, percentage health index (%HI) determination is a factor used to indicate the condition of the underground cable system and its components for effective usage and maintenance planning.

2. Data Management System

Three significant data sets including technical information [3] and operating data as well as testing and visual inspection results were involved in lifetime estimation as described below.

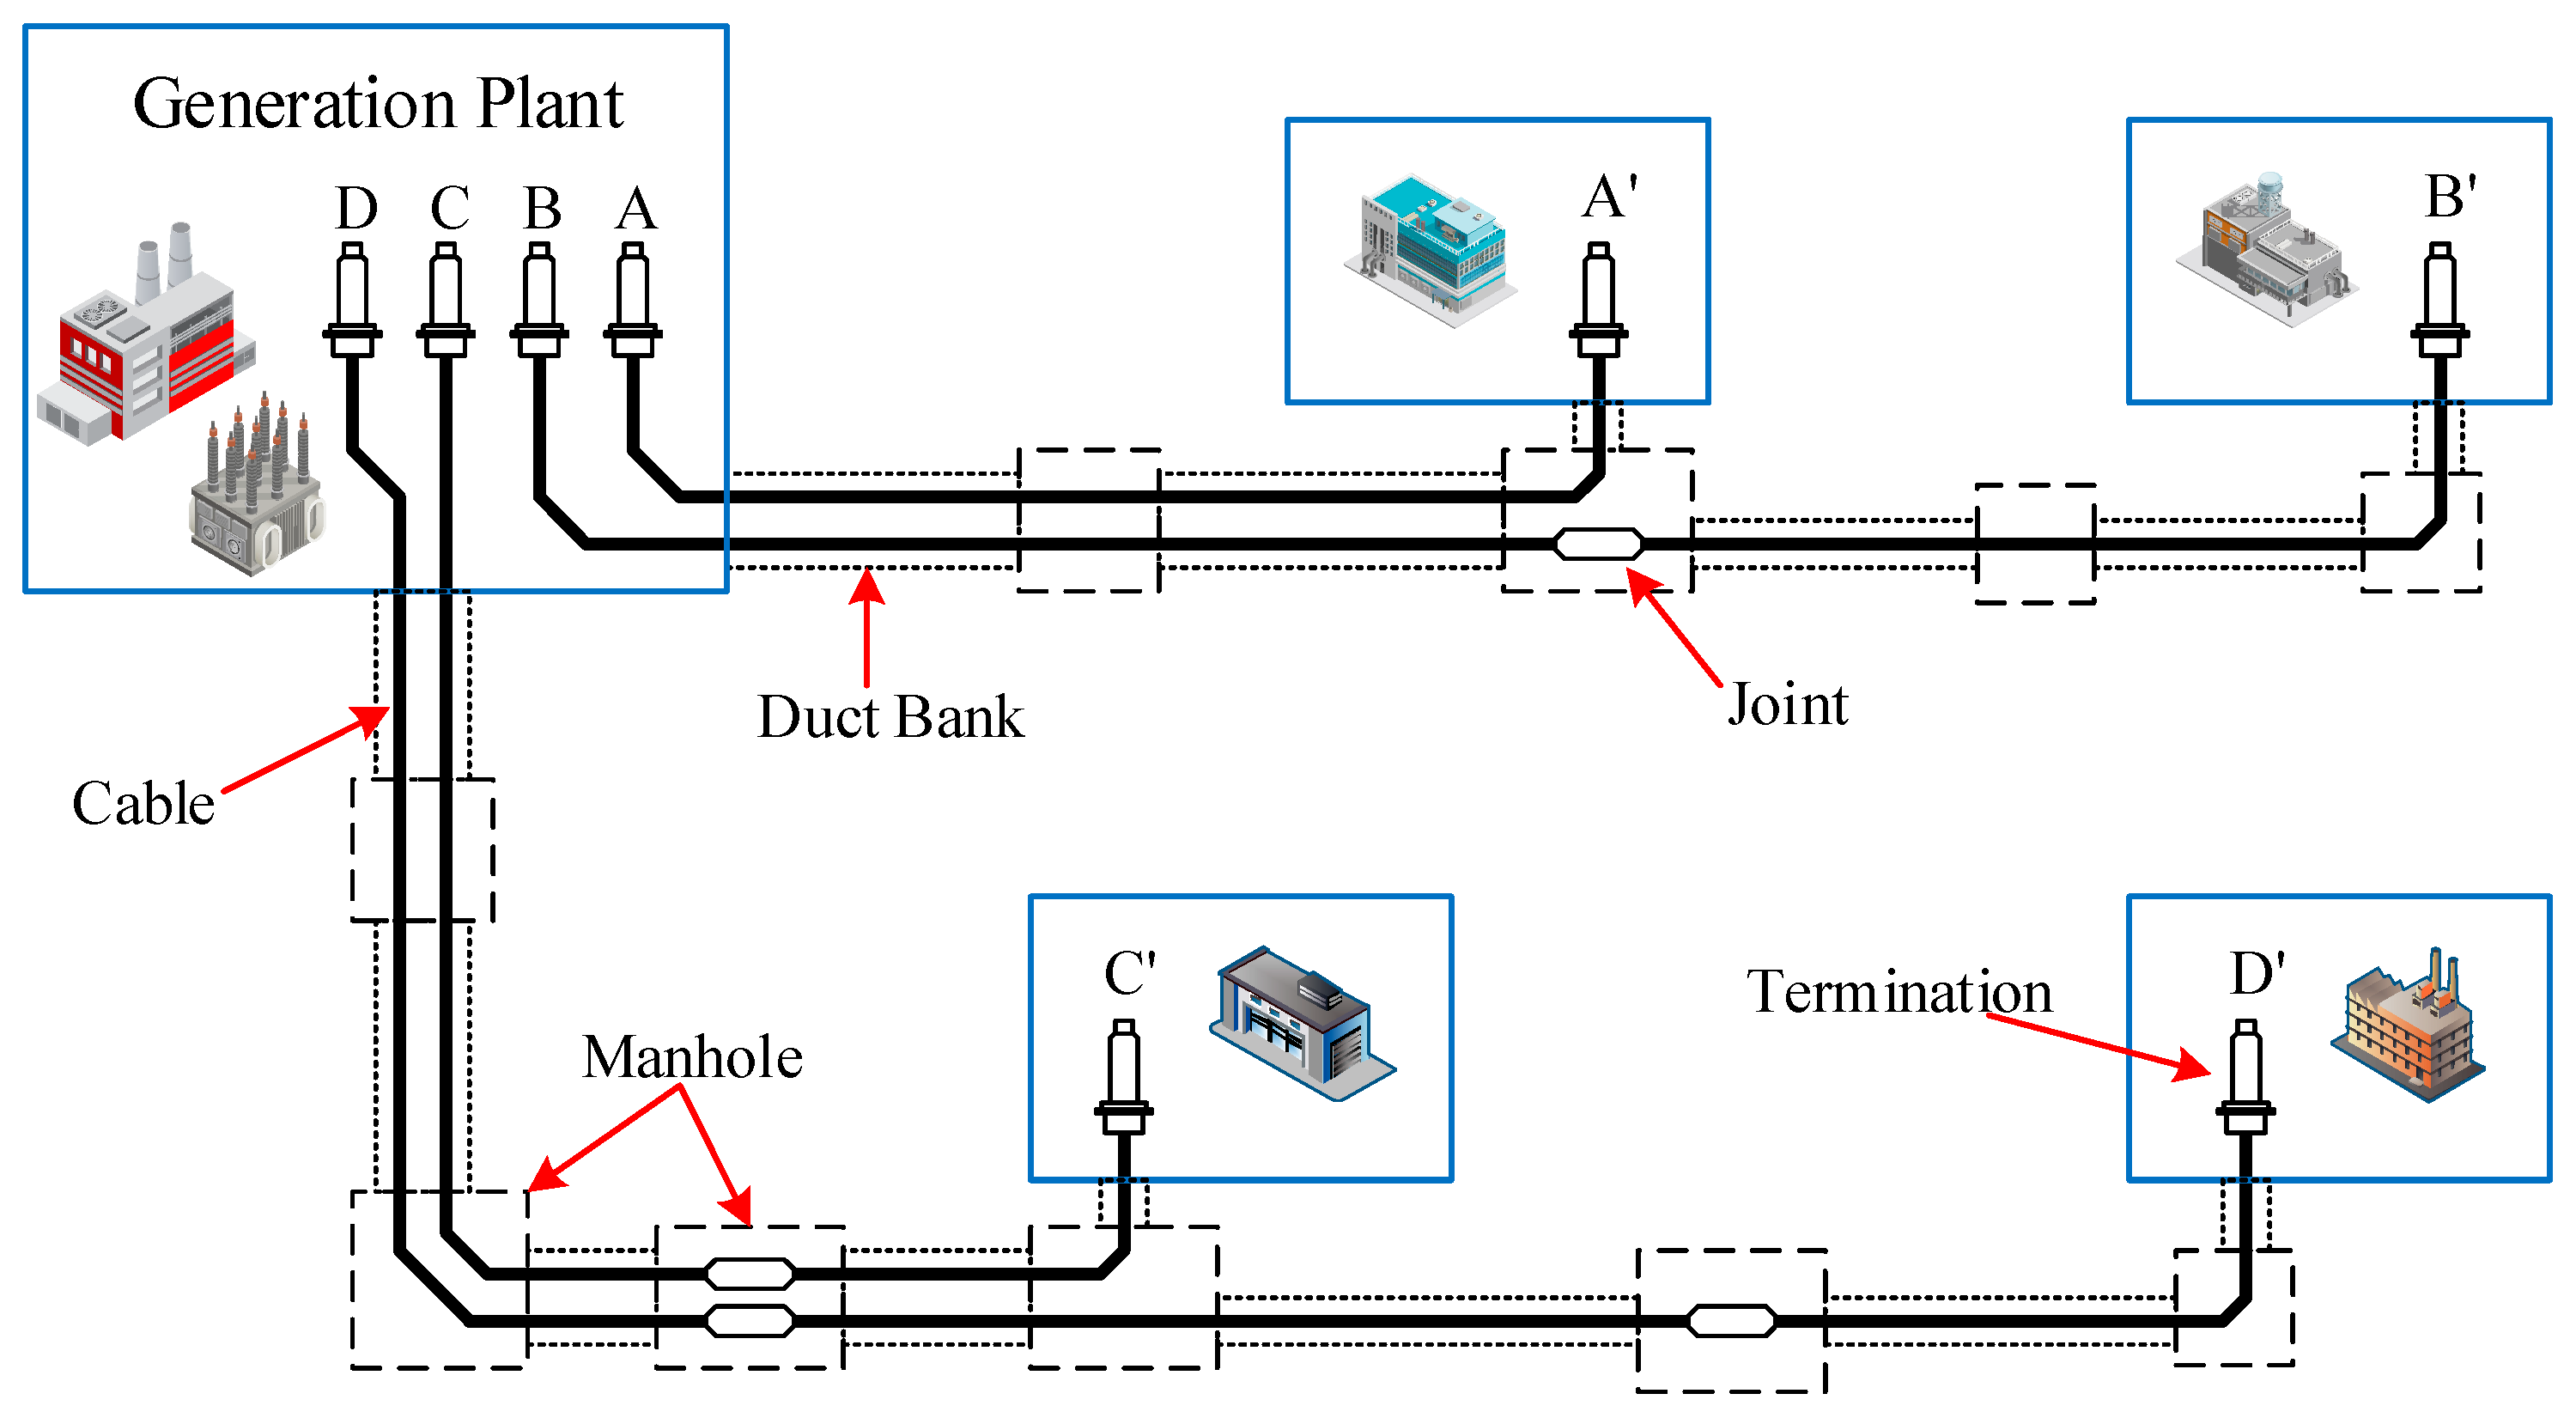
2.1. Technical Information

The technical information of all major components in a cable system is described as follows. At first, the technical data of the cable route are gathered including circuit name, system voltage and current ampacity, manufacturer, model type, installation date, number of terminators and manholes, and total length of the entire circuit. Then, the joint and termination’s technical data consist of device number and circuit name, model and bonding method, manufacturer, installation location, and installation date. Next, the manhole’s technical data consist of device number, designation route in manhole, location, manufacturer, and model type. Finally, the duct bank’s technical data consist of name, starting and ending manhole, as well as numbers of a total, used, damaged, and spared duct. Then, the database of this data has been developed using MySQL (Bitrock, Inc., San Francisco, CA, USA) for web-application software to systematically collect the data of the existing and new installation of cable systems for further processes.

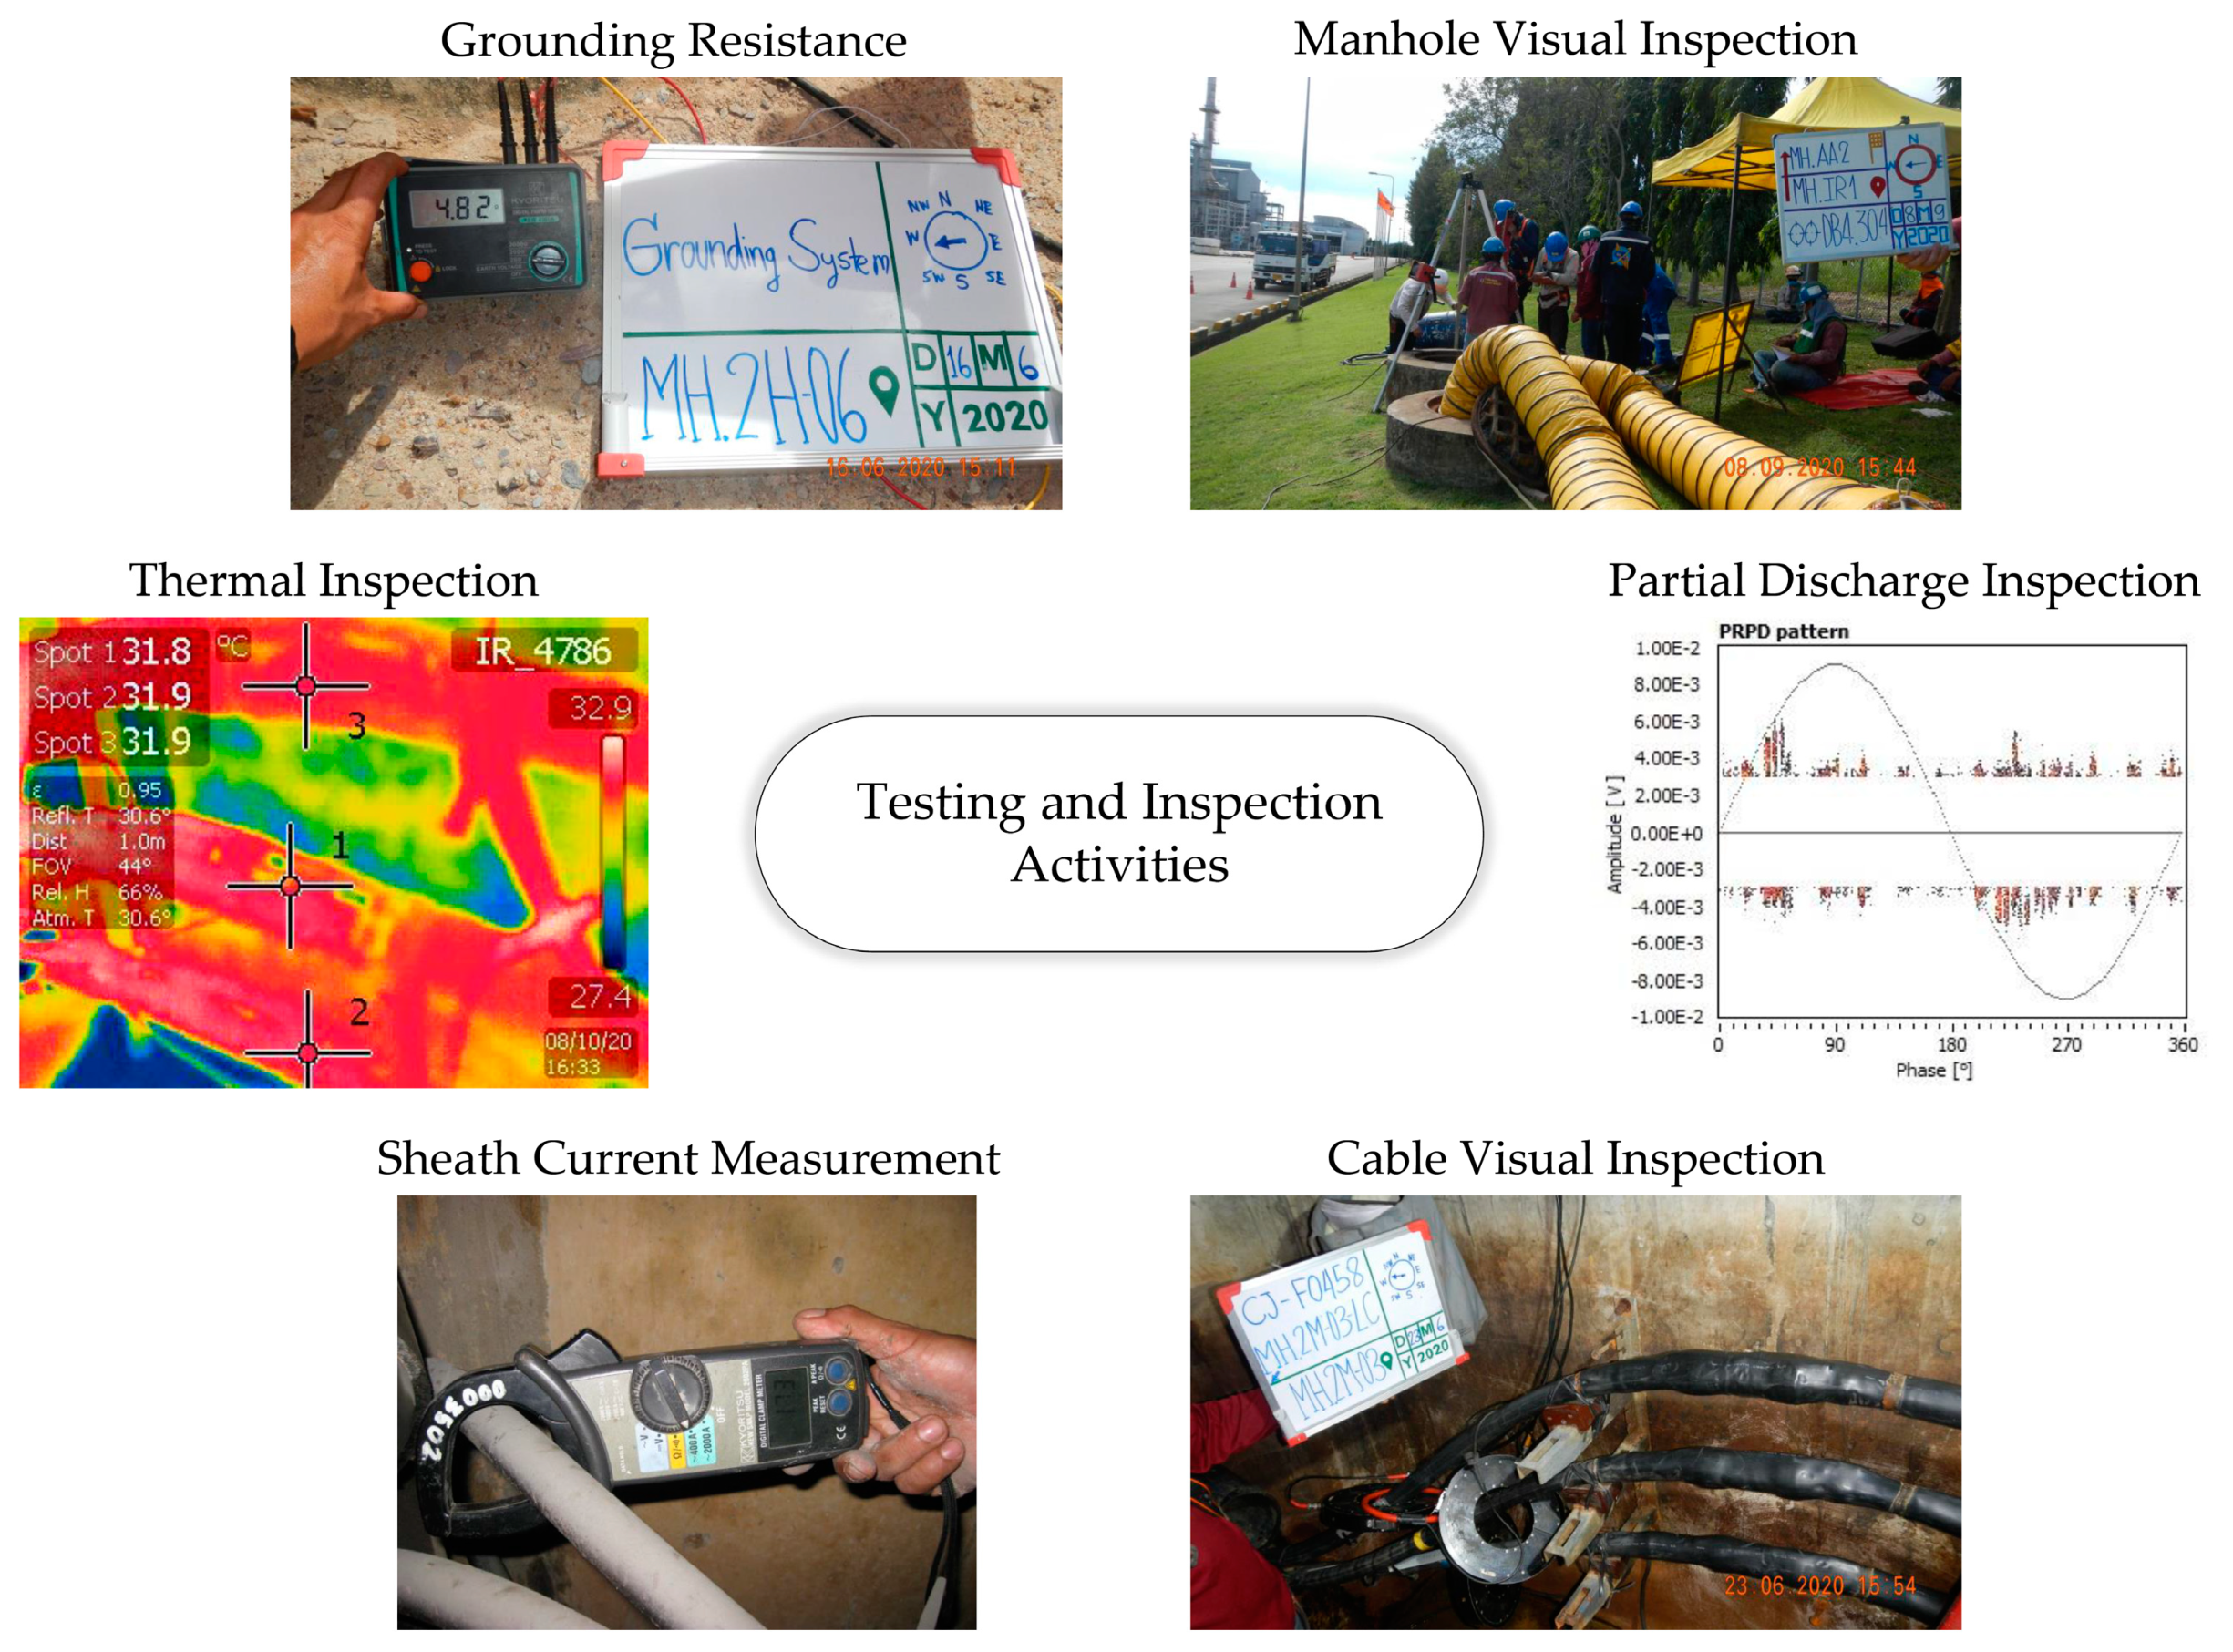
2.2. Testing and Inspection Results

Basically, the aims of maintenance of underground cable systems are to detect and recognize the possible defects at the actual operating condition and to prevent unscheduled outage [19,20]. It is performed while the system is under energization [21]. In this work, four effective tests and inspections that are regularly performed according to utility practice consist of visual inspection, sheath current measurement [8], infrared thermography inspection [9], and partial discharge measurement [21] as presented in Figure 3. Further information about each testing method regarding considered parameters extracted from the measurement, condition classification, and its criteria are expressed in Table 1 [22].

2.3. Operating Information

To cope with an accuracy in lifetime estimation, the actual environment and operating condition of individual underground cable systems are significantly important. These analyses consider the actual operating condition and usage risk of the system. Important criteria to evaluate the difference in degradation behavior due to various practical usage of a cable system include usage time, loading condition, failure frequency, reparation rate, network reliability, and operational environment as presented in Table 2. It can be implied that if a cable system has long service life, high loading condition, and failure frequency while it is operating in an extreme environment, such as water flooding, poor ventilation, bad coverage soil; its lifetime should be lower than life expectation [23].

3. Assessment Criteria with WMS Technique

After classification of underground cable system components, the associated testing and inspection methods of each component are identified as shown in Table 1. Similarly, the scores and weights of all testing criteria are identified by using the WSM technique. The score classification is based on international standards and practice of the utility performing cable system maintenance. The importance weight setting is assigned according to the importance and effectiveness of each inspection item to identify the severity of possible defects. This setting is based on a consensus of several experts in different departments in the focused organization involved with the underground cable system, such as the engineering, operation, and maintenance departments. The opinions of the experts are brainstormed together and with the aid of the AHP technique [10,17], the final weighting value can be assigned to each criterion. For the conditional factor evaluation, the criteria consisting of usage time, loading condition, failure frequency, reparation rate, network reliability, cable length and route configuration, as well as operational environment of the underground cable system are presented in Table 2. The scoring for operating criteria is also given in Table 2.

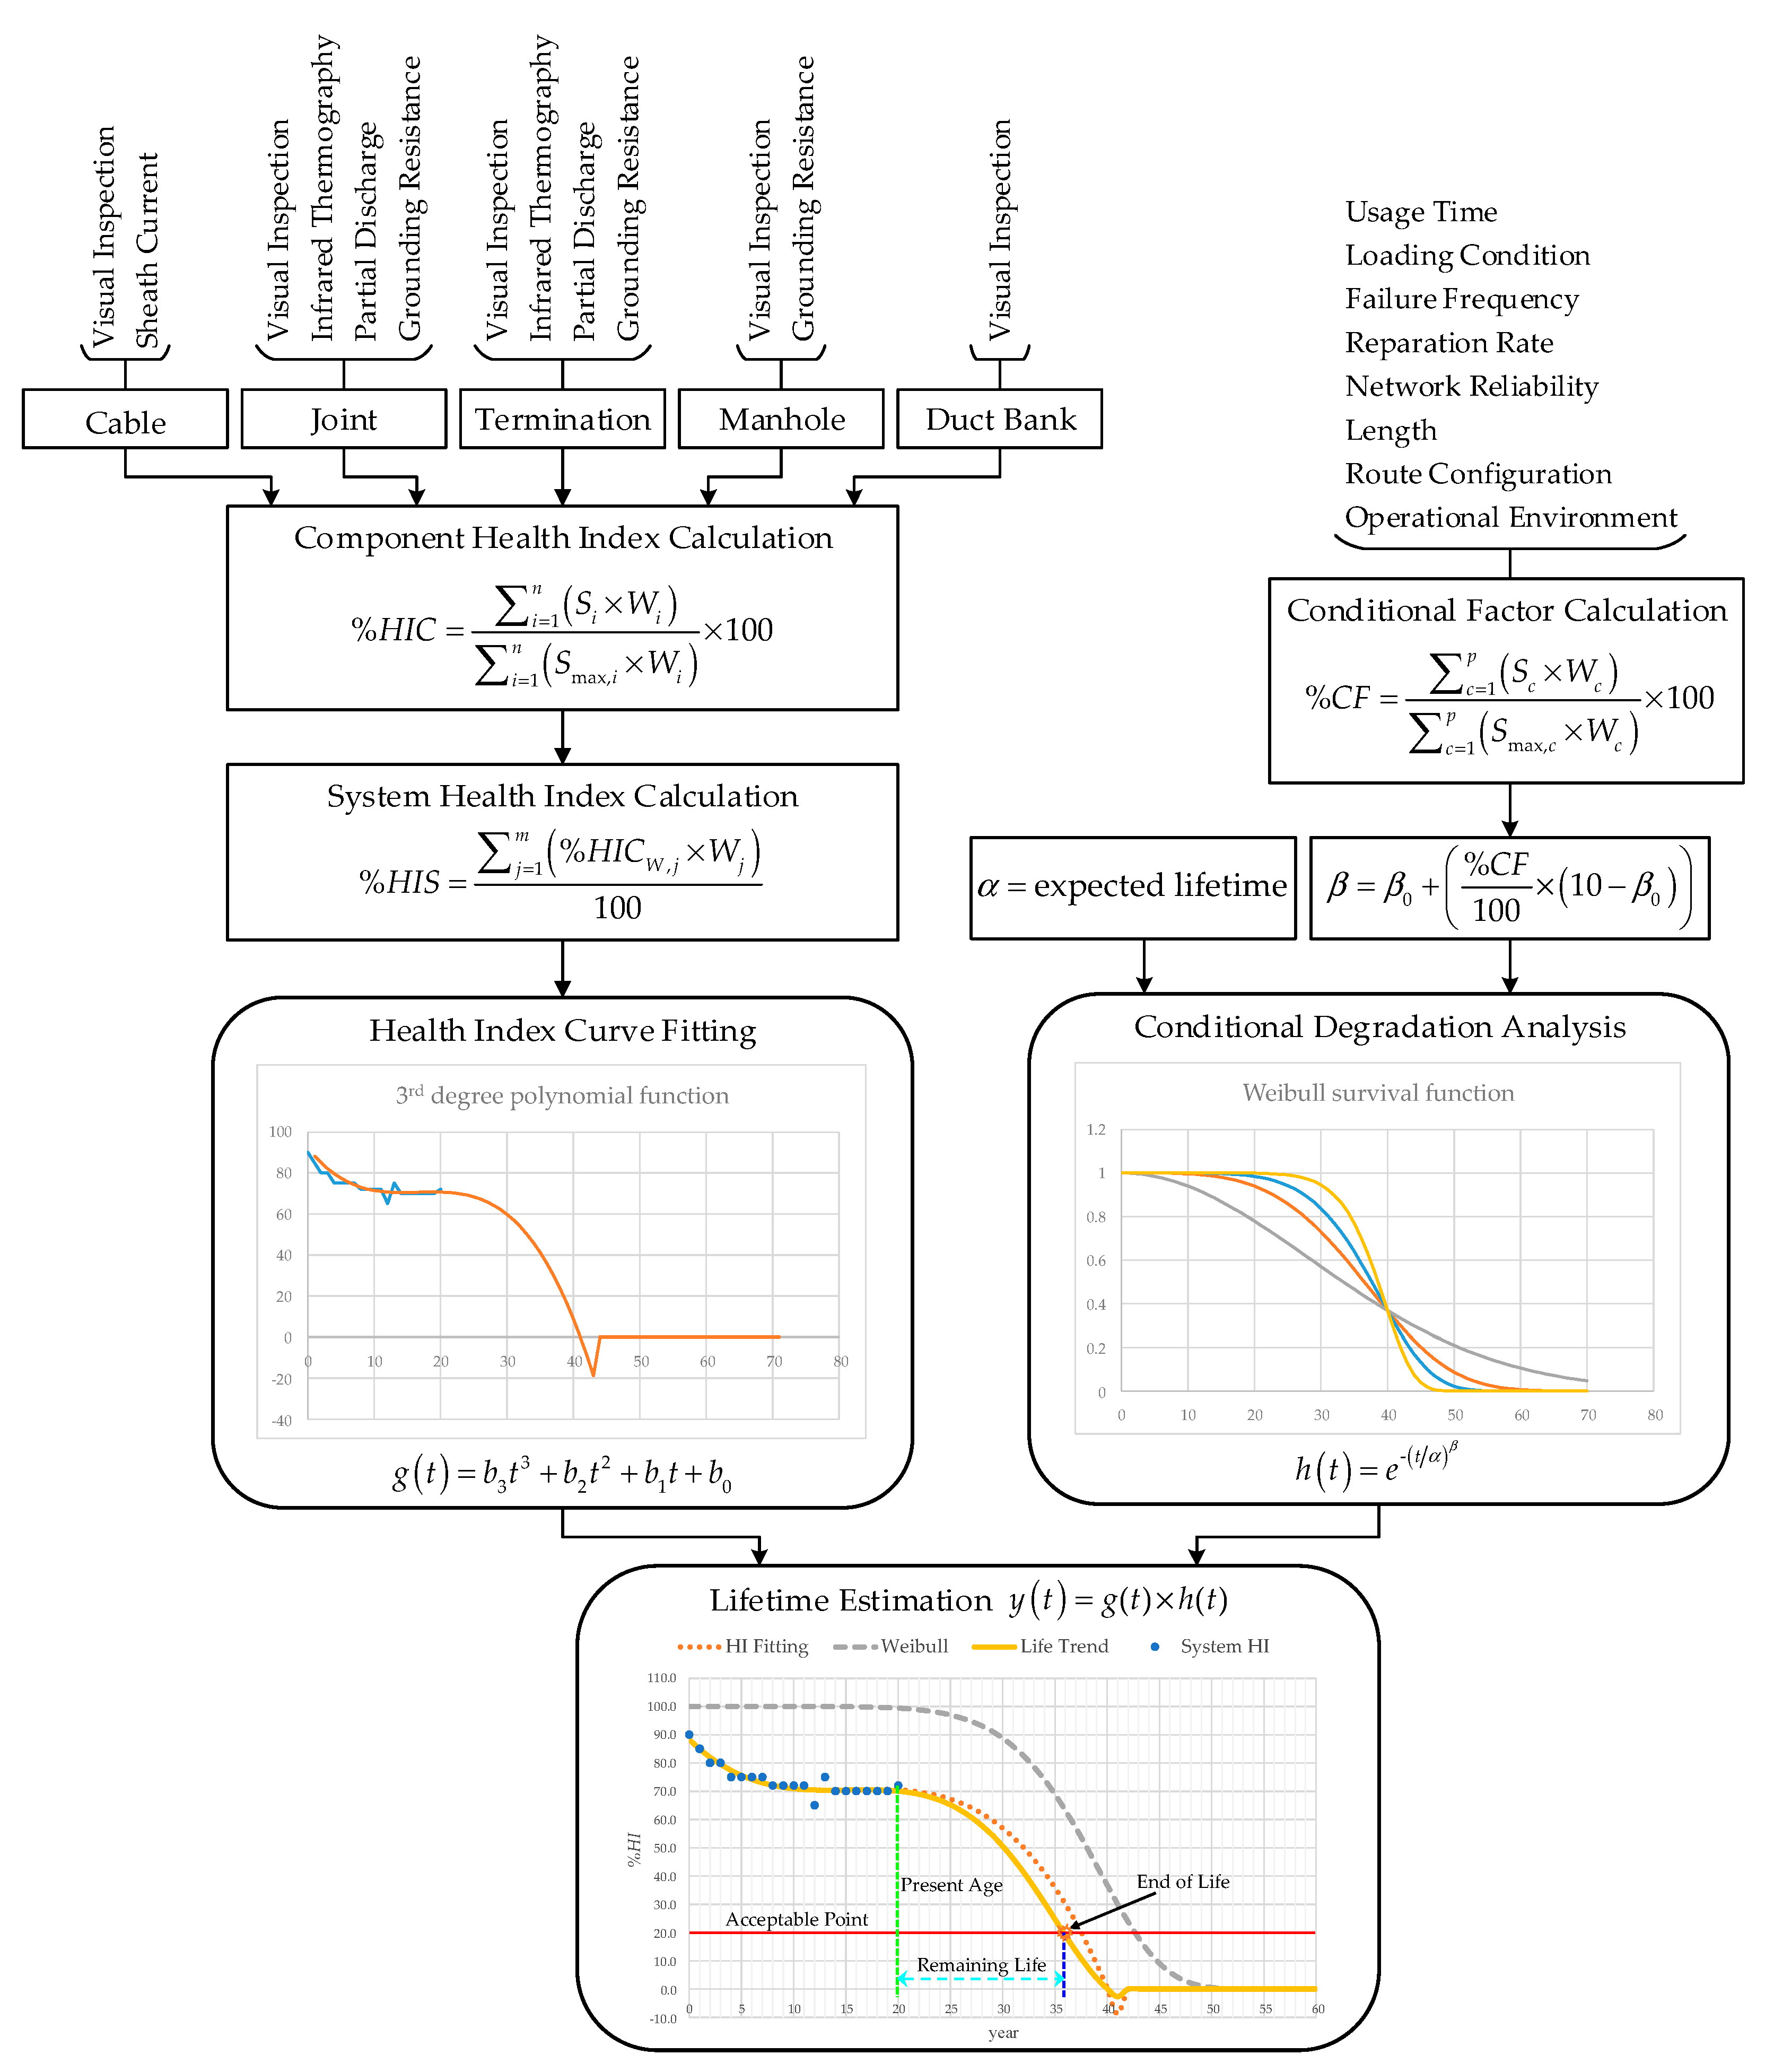
4. Health Index Calculation

The underground cable components are classified as five significant groups to facilitate efficient data collection and management, and simply HI calculation, which starts from an analysis of individual components in Section 4.1 and then computing the HI of the whole system in Section 4.2.

4.1. Component HI Calculation

Firstly, the percentage HI representing the condition of each major component (%HIC) is evaluated by analyzing their relevant routine and inspection test results with the criteria by using Equation (1):
% H I C = i = 1 n ( S i × W i ) i = 1 n ( S max , i × W i ) × 100
where Si is a score obtained from the test and inspection result ith, Smax,i is a maximum score of the test and inspection result ith, Wi is the weight representing the importance of the test and inspection results ith, i is the index of test and inspection results, and n is the total number of the test and inspection results.

4.2. System HI Calculation

After %HIC of all components are calculated, a percentage HI condition of the underground system (%HIS) is evaluated by using Equation (2). The worst percentage HI from every component (%HICW,j) in each group along the cable route is selected as a representative of each major group to calculate the overall system HI of a system (%HIS) identified from 0% to 100 % from poor to good condition:
% H I S = j = 1 m ( % H I C W , j × W j ) 100
where %HICW,j is the worst component HI in each group of major component jth, Wj is the important weight of each group of major component jth, j is the index of each group of major component, and m is the total number of the major component groups.

5. Conditional Factor Calculation

Conditional factor (CF) is proposed to improve the accuracy of lifetime estimation by considering the practical usage condition. This CF is used to adjust a slope of the degradation curve applied by the Weibull distribution function. The CF is based on practical and statistical operating records of the criteria in Table 1 and calculated by using Equation (3):
% C F = c = 1 p ( S c × W c ) c = 1 p ( S max , c × W c ) × 100
where Sc is a score of the operating criterion cth, Smax,c is a maximum score of the operating criterion cth, Wc is the important weight of the operating criterion cth, c is the index of operating criterion, and p is the total number of operating criteria.

6. Lifetime Estimation

The lifetime of the cable system is determined by multiplying a predictive %HIS curve with a conditional factor obtained from the Weibull distribution function as shown in Figure 1. The lifetime estimation procedure is described in this section.

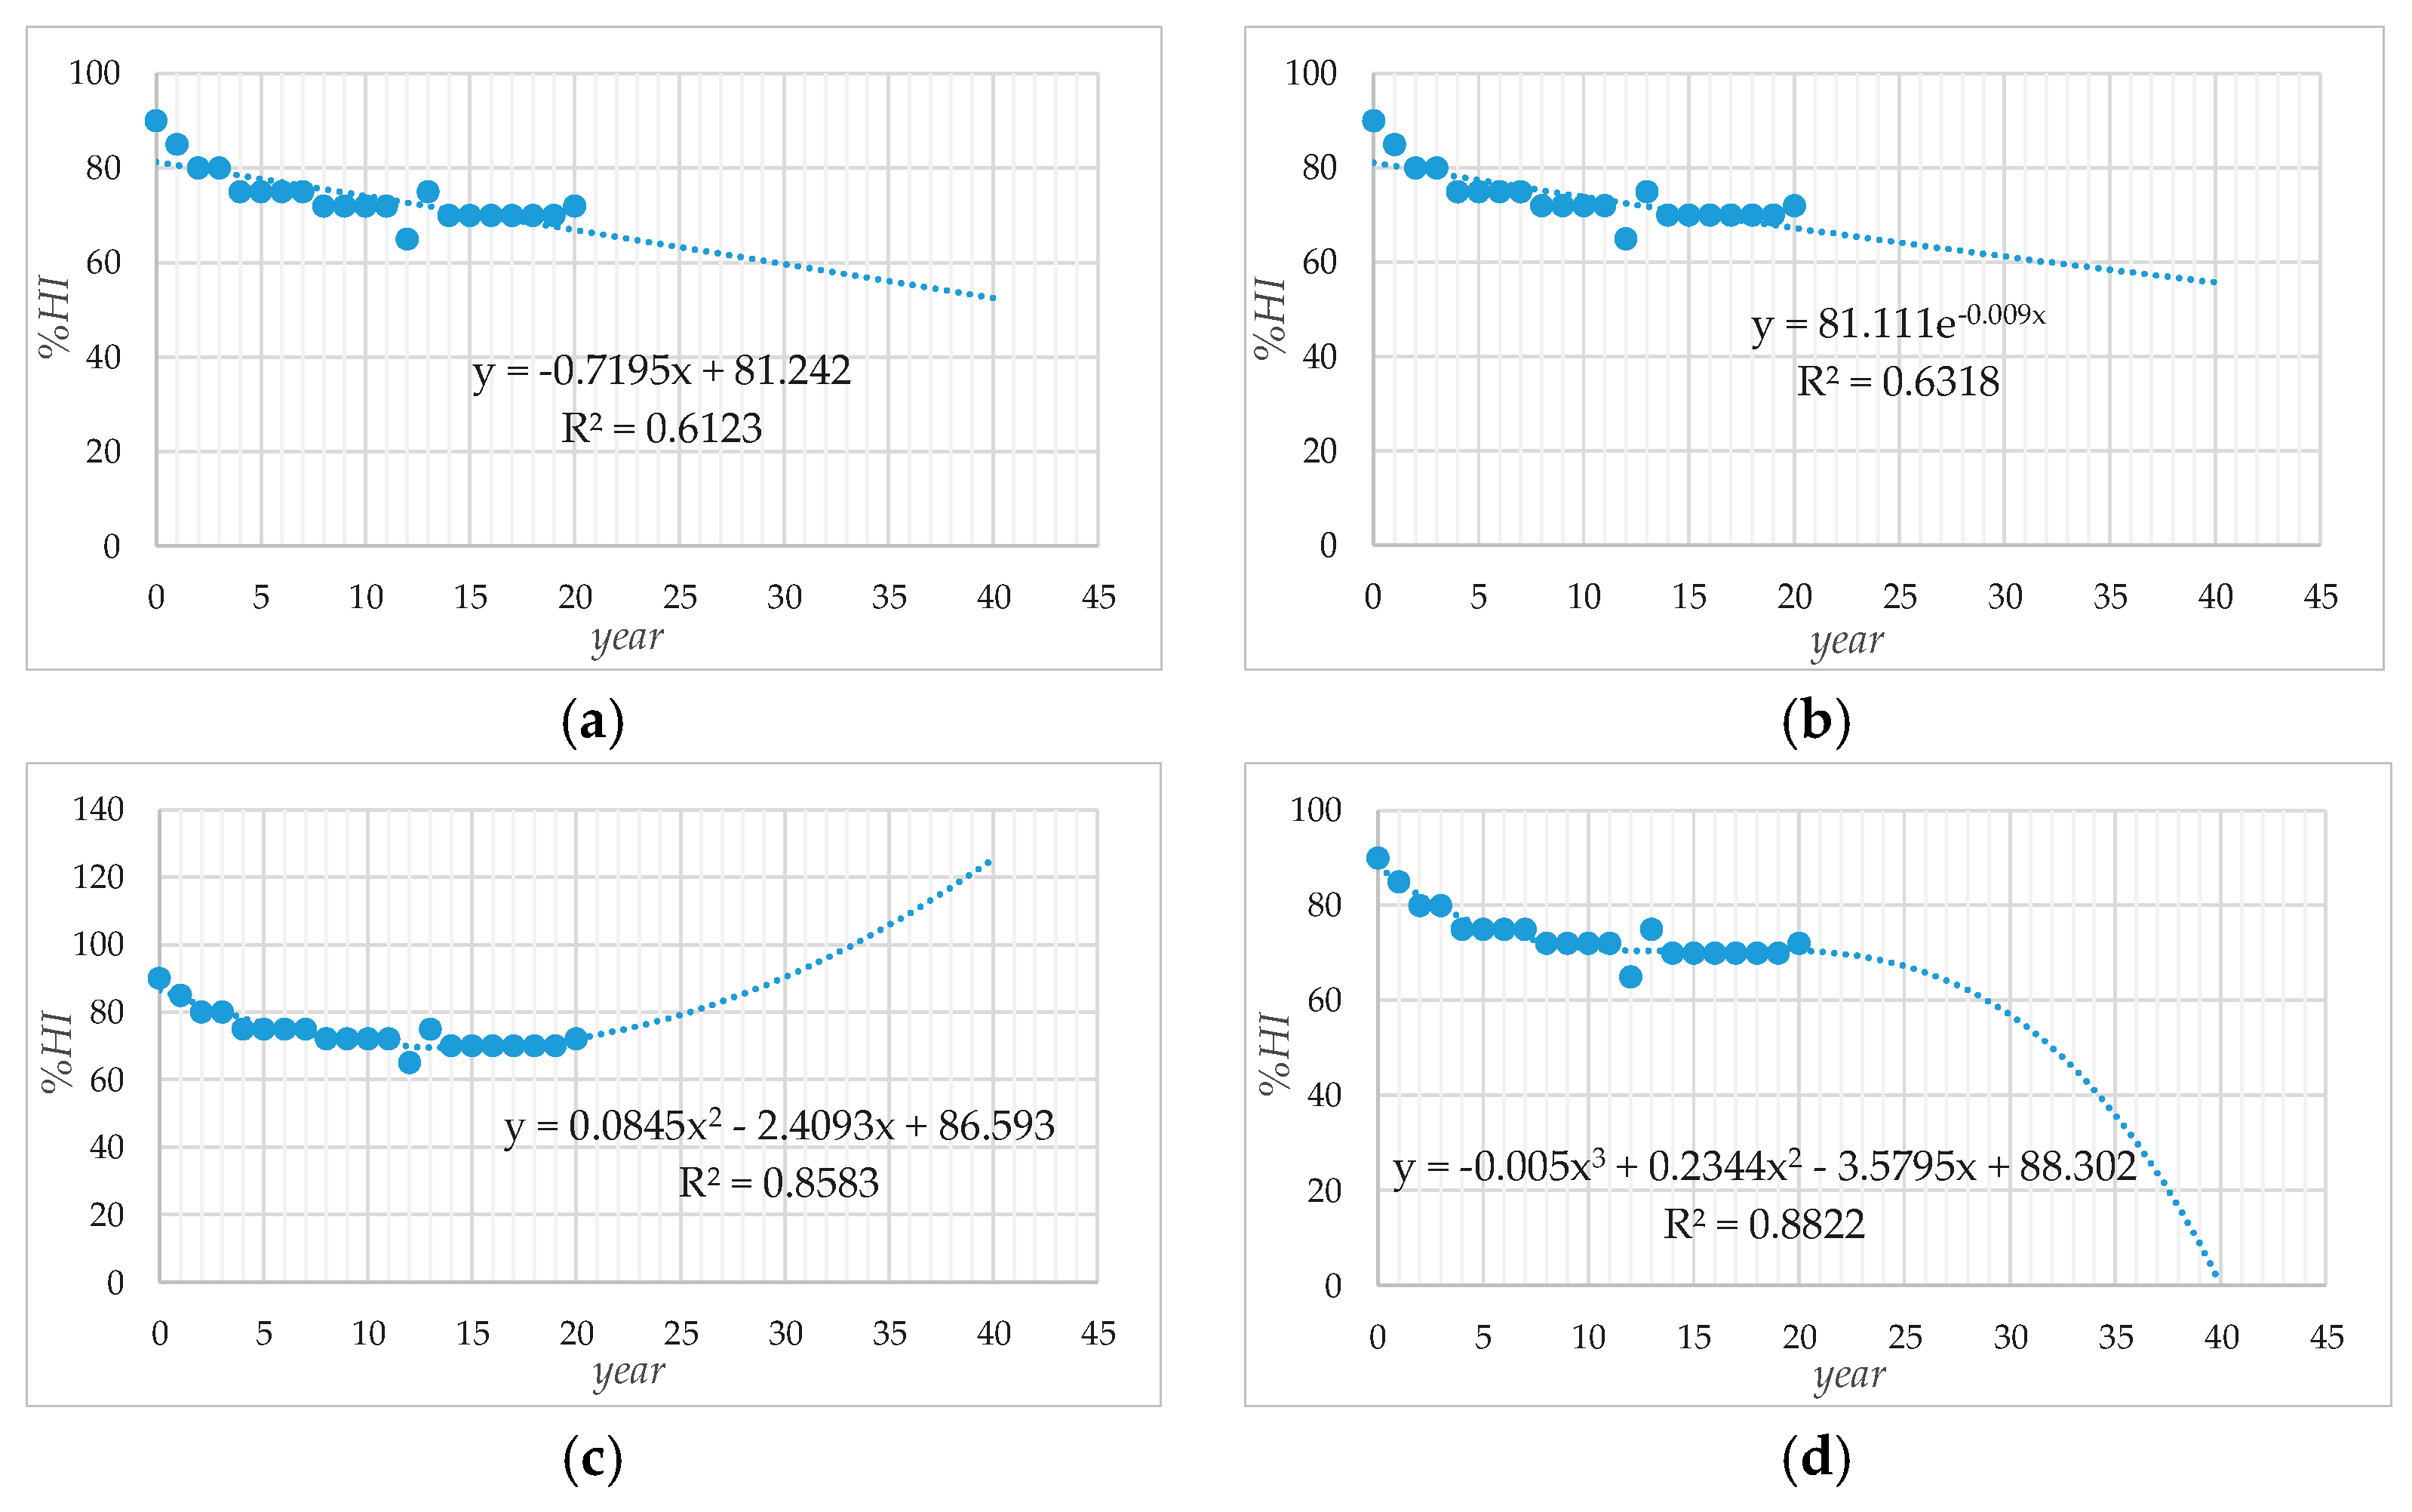
6.1. Predictive HI by Applying Curve Fitting

After %HIC and %HIS calculation, the statistical %HIS record is plotted to observe and predict the %HIS trend of the underground cable system, which may show a slight decrease in the HI due to gradual degradation behavior according to both normal and stress aging. Then, a %HIS trending equation can be determined by using a regression technique for curve fitting of the previous %HIS to forecast the possible future %HIS. Then, this health trending equation can be used not only to analyze the degradation behavior, but also to predict the future %HIS from the observed trend to set up the proper maintenance tasks and optimize a constrained budget for the underground cable system. In Figure 4, the most appropriated curve fitting function is the 3rd order polynomial function with the highest coefficient of determination (R2 = 0.8822) when compared with three other functions such as the linear, exponential, and 2nd order polynomial functions.
In [11], the third order polynomial distribution is also mentioned for lifespan prediction on different power equipment. Moreover, this selected function satisfies flexibility, monotonicity, smoothness, and continuity of health variation with time [24,25]. The polynomial function could be written as Equation (4):
g ( t ) = b 3 t 3 + b 2 t 2 + b 1 t + b 0
All the parameters in Equation (4) are obtained from the regression analysis based on historical %HIS. The larger number of data collection for curve fitting could improve the accuracy and trustworthiness of the result. Finally, the %HIS trending curve can be plotted, and the upcoming %HIS can be predicted.

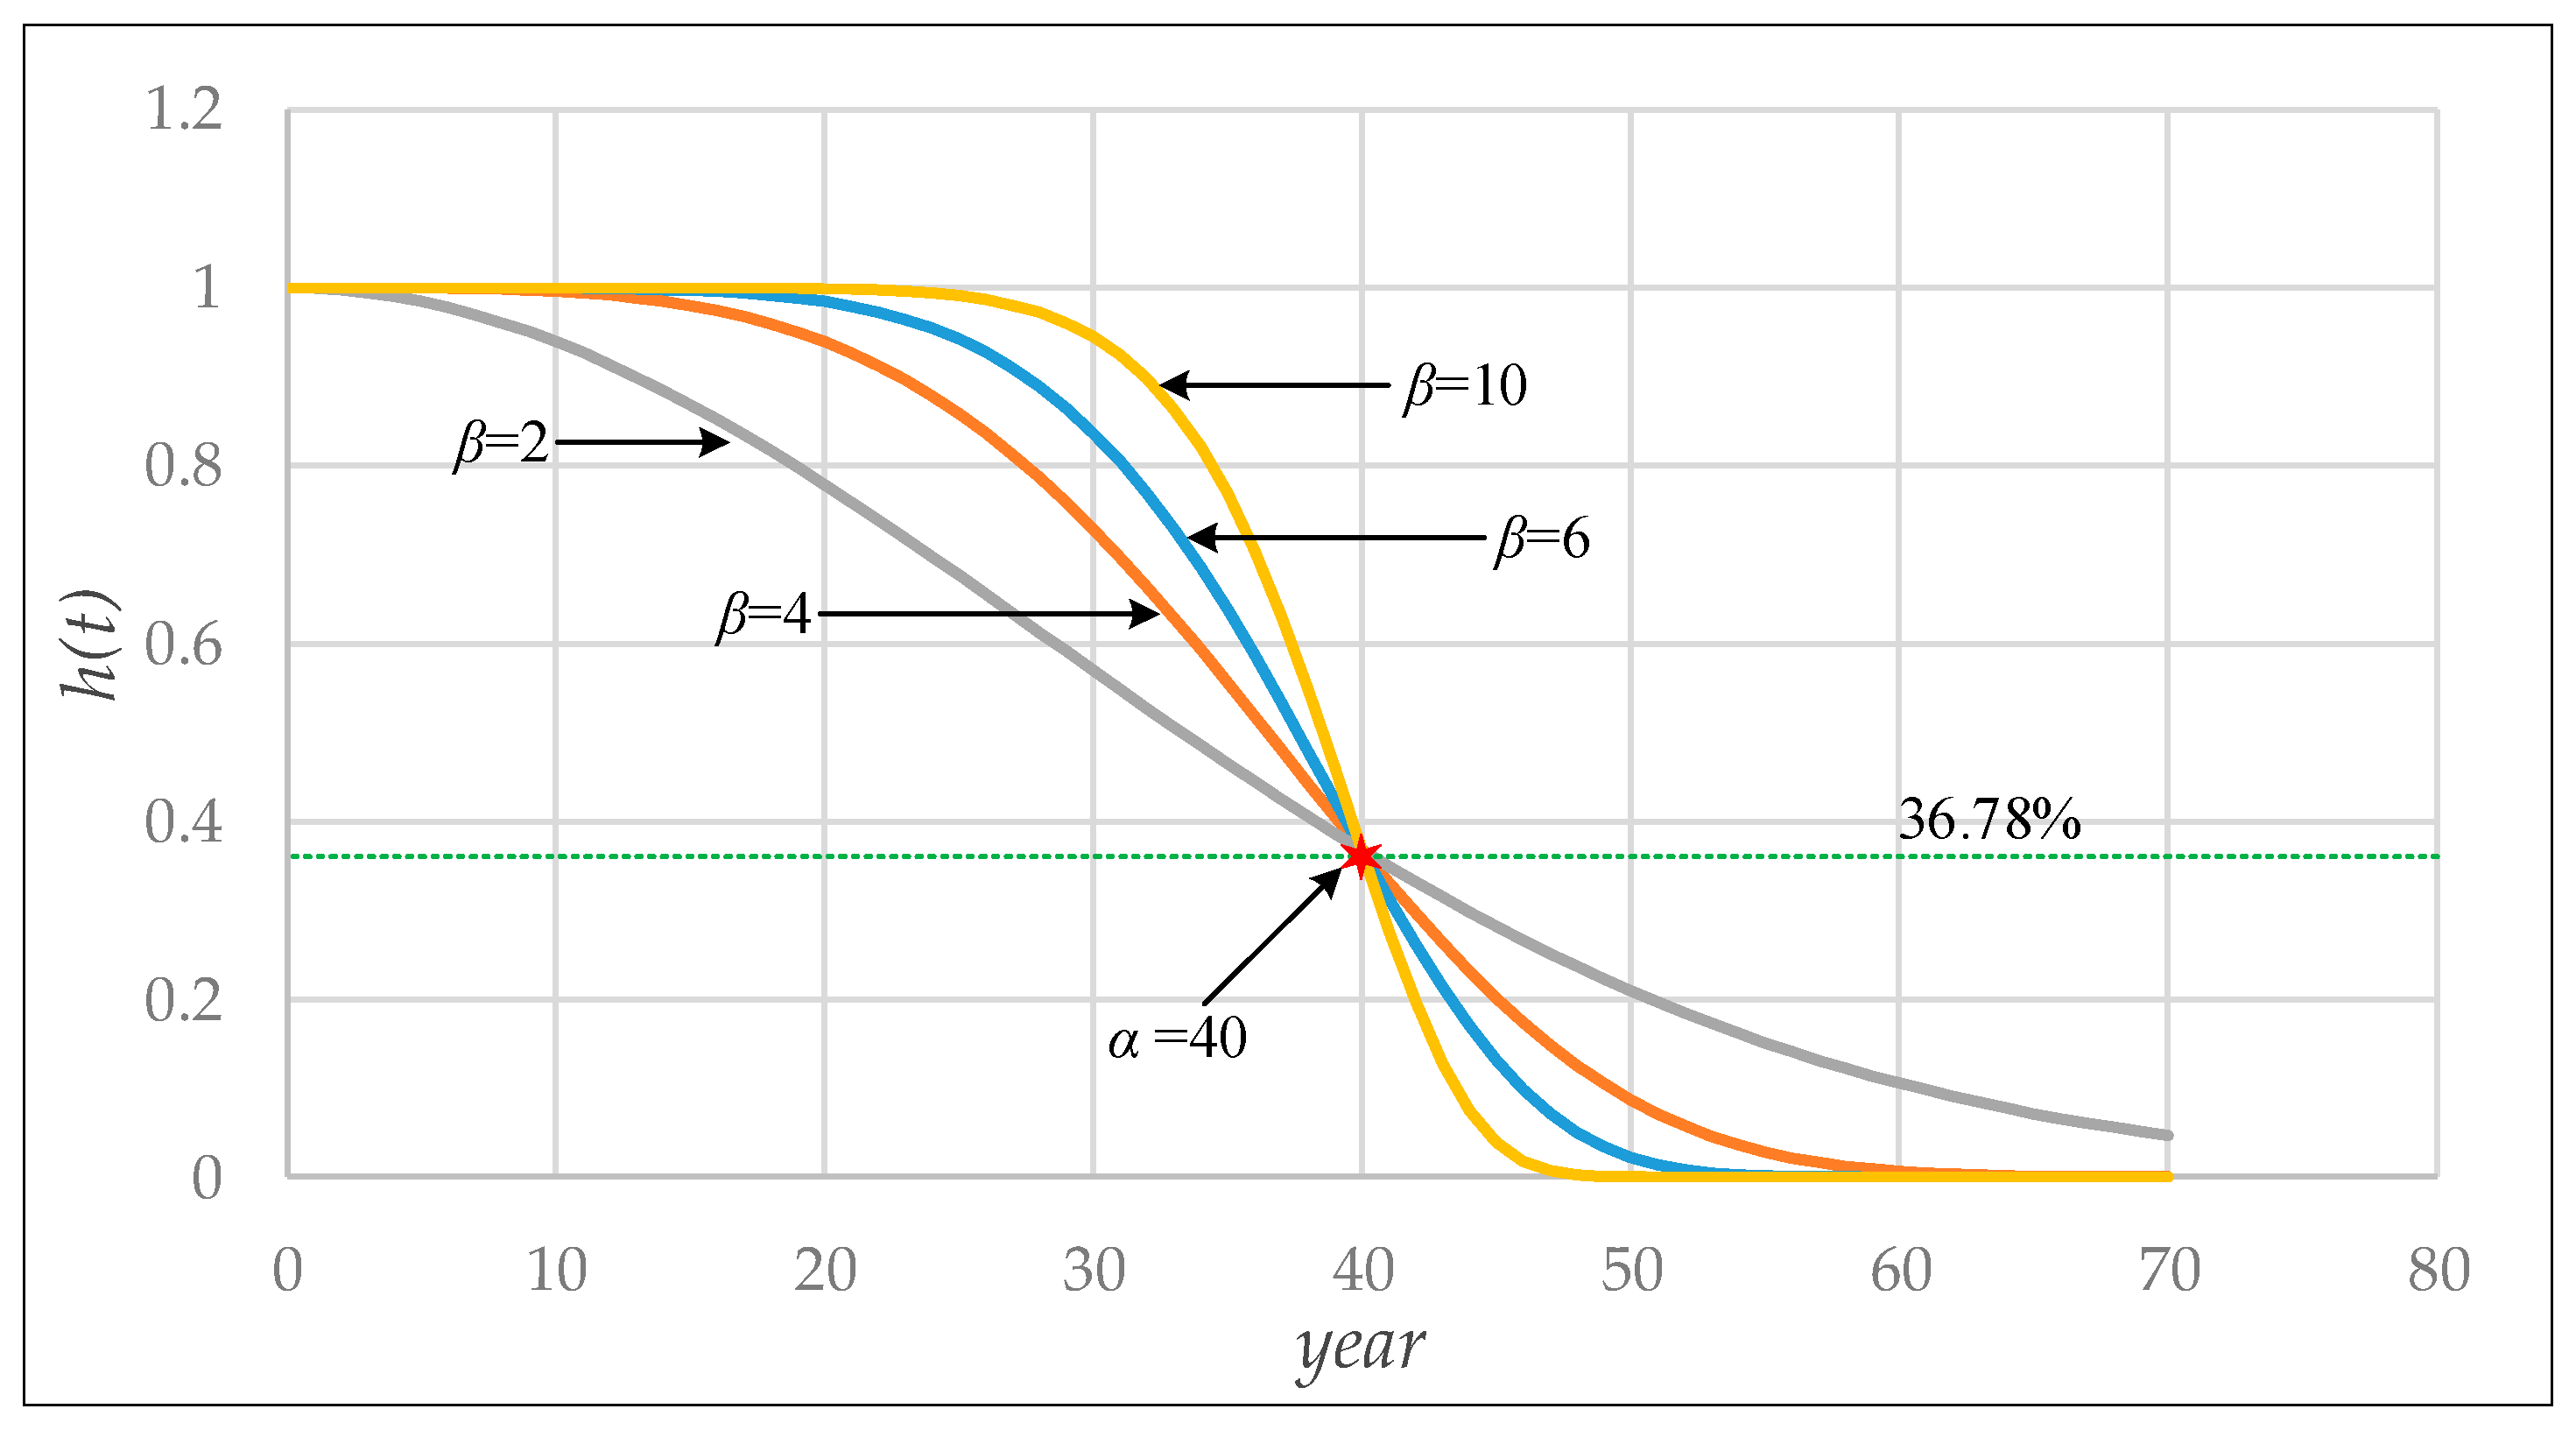
6.2. Degradation Behavior Accelerated by Operating Condition

According to differences in the degradation behavior of each cable system due to variation in operating condition, system configuration, and environmental impacts, it is well accepted to use the Weibull distribution function to analyze and illustrate the degradation curve of high voltage equipment and substation [26,27,28]. However, there are various types of Weibull distribution functions. In this work, a survival curve function as written in Equation (5) is selected because of its similarly to the inverse bathtub curve characteristic during the end-of-life period [29,30,31] and plotted in Figure 5.
h ( t ) = e - ( t / α ) β
This function requires two parameters [28]. Firstly, β is called the shape parameter. It is used to adjust the slope of the curve, which can refer to degradation behavior of the cable system. In this work, β is substituted by the CF of each cable system and β0. The β0 is the minimum value of shape parameter which illustrates an extreme degradation curve of the underground cable system. Therefore, the determination of β can be calculated by using Equation (6) to incorporate the practical usage condition of each cable system into account.
β = β 0 + ( % C F 100 × ( 10 β 0 ) )
Secondly, α is called the scale parameter. It represents the characteristic life that 36.78% of the population is expected to fail. Then, according to Figure 5, the scale parameter is 40 years, which implies the expected lifetime of the cable system [31].
In Figure 5, different shape parameters (β) result in different degradation patterns while Table 3 shows a correlation between β and CF.
It can be observed that CF as 100% yields the β as 10, for which the failure curve is the most appropriate. In contrast, the lowest β as 2 represents an abnormal shape of condition degradation because faster degradation occurred in an early stage due to the severe operating conditions. When the operating condition and environmental impacts are less severe, the degradation behavior is gradually decreased, and the lifetime is prolonged [18].

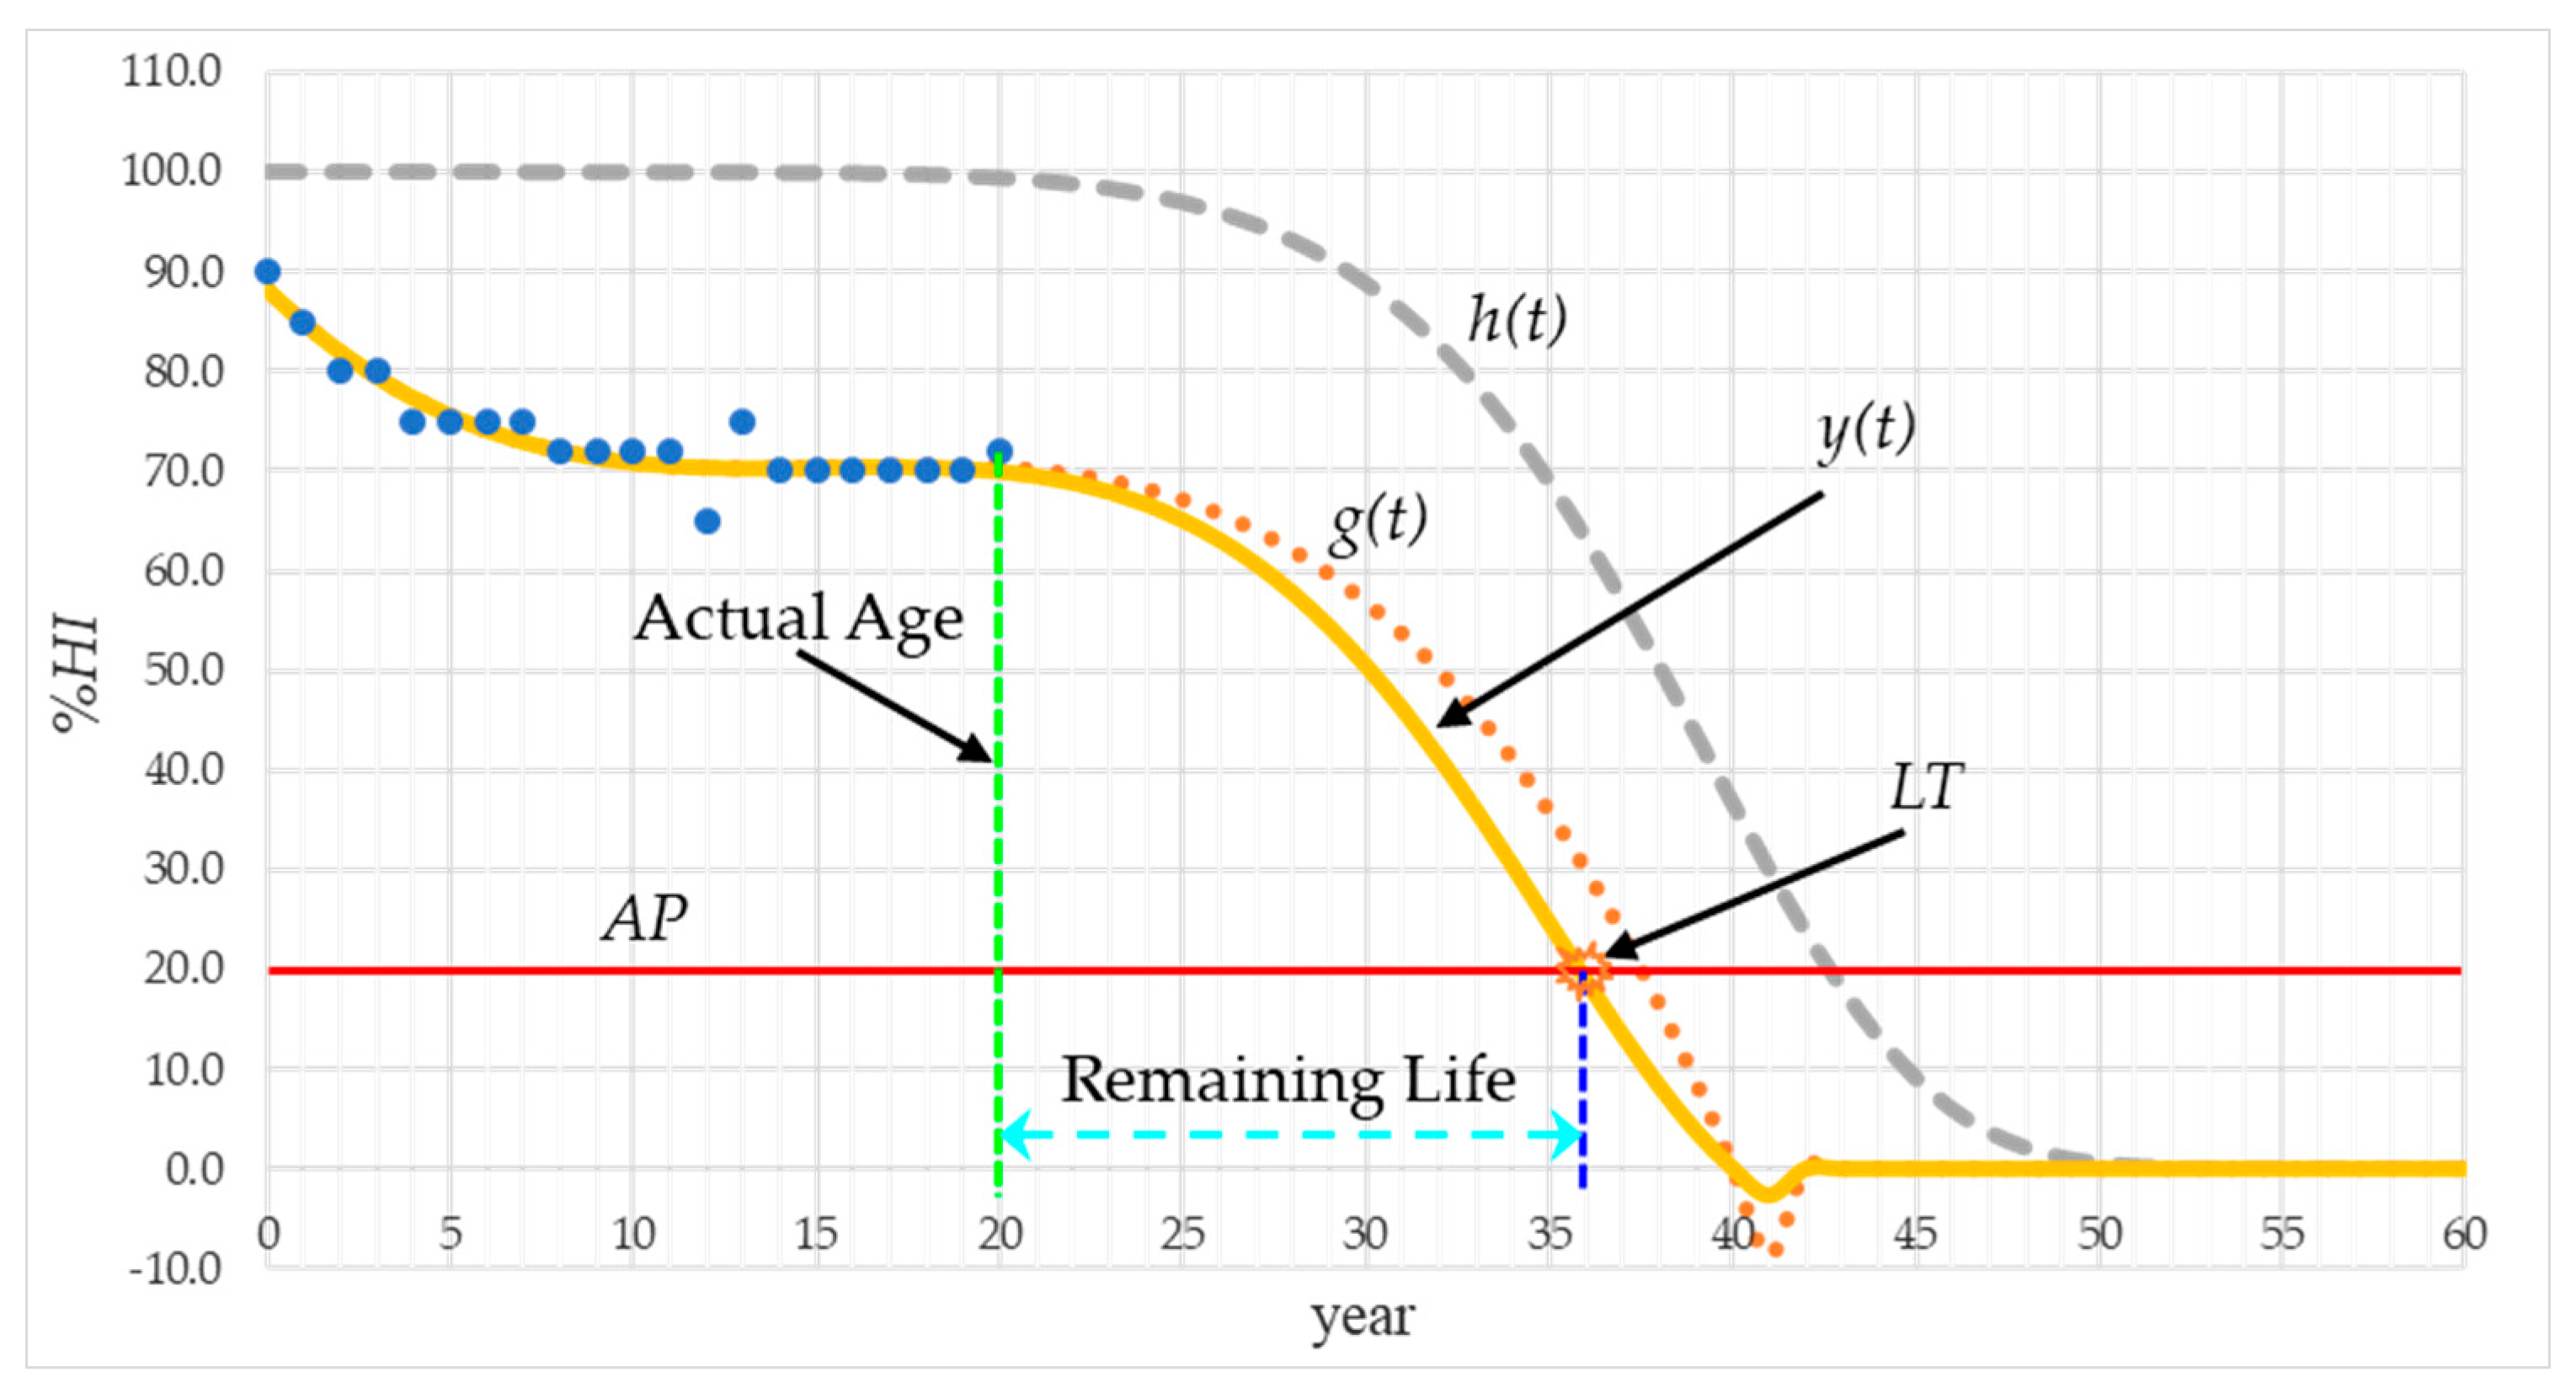
6.3. Lifetime Curve Forecasting

In this step, the predictive %HIS curve is multiplied by the degradation curve to obtain a final lifetime estimation function y(t), as given in Equation (7), reflected in the difference in operating condition, system configuration, and environmental impacts in the period t (year). Finally, the end of life (LT) is estimated by using Equation (8), where AP is the acceptable limit of %HIS level and te is a calculated year beyond the AP as shown in Figure 6. The value of y(te) must be a lesser value than AP because the Equation (8) is used to find the cutting point of their two lines, which is the LT.
y ( t ) = g ( t ) × h ( t )
L T = t e + ( A P y ( t e ) y ( t e + 1 ) y ( t e ) ) ; y ( t e ) > A P ,   limit   1

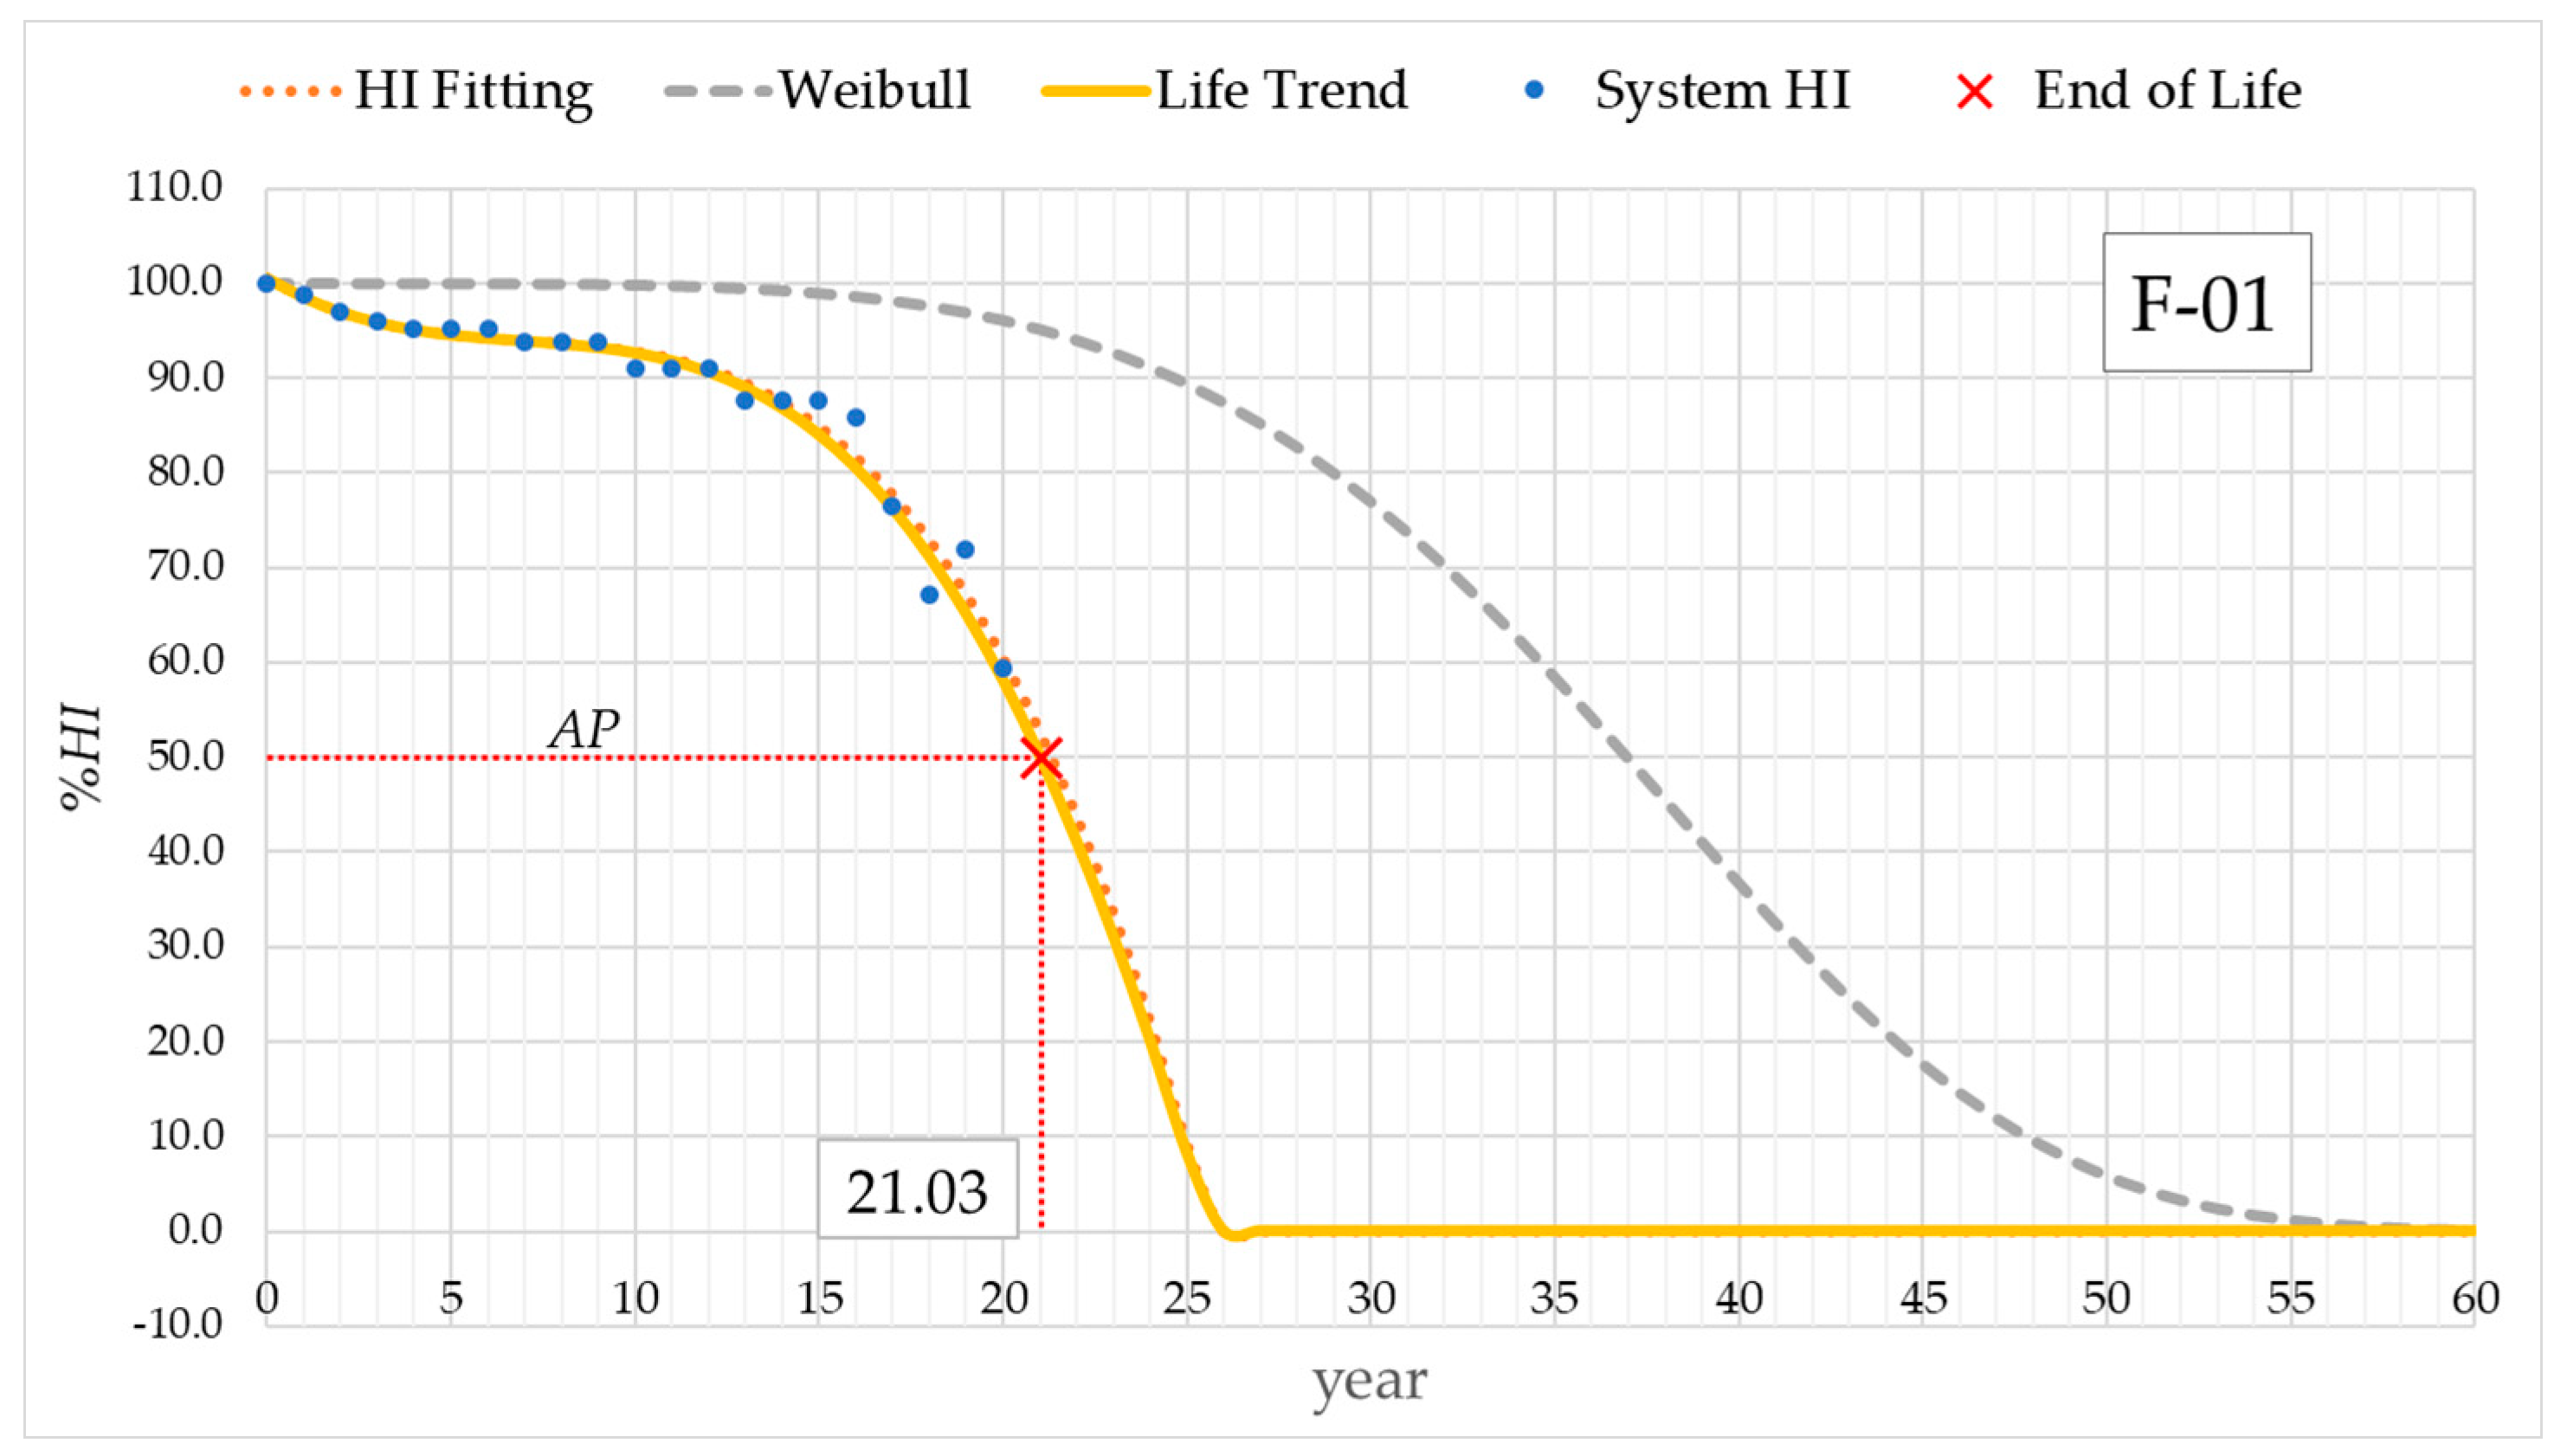
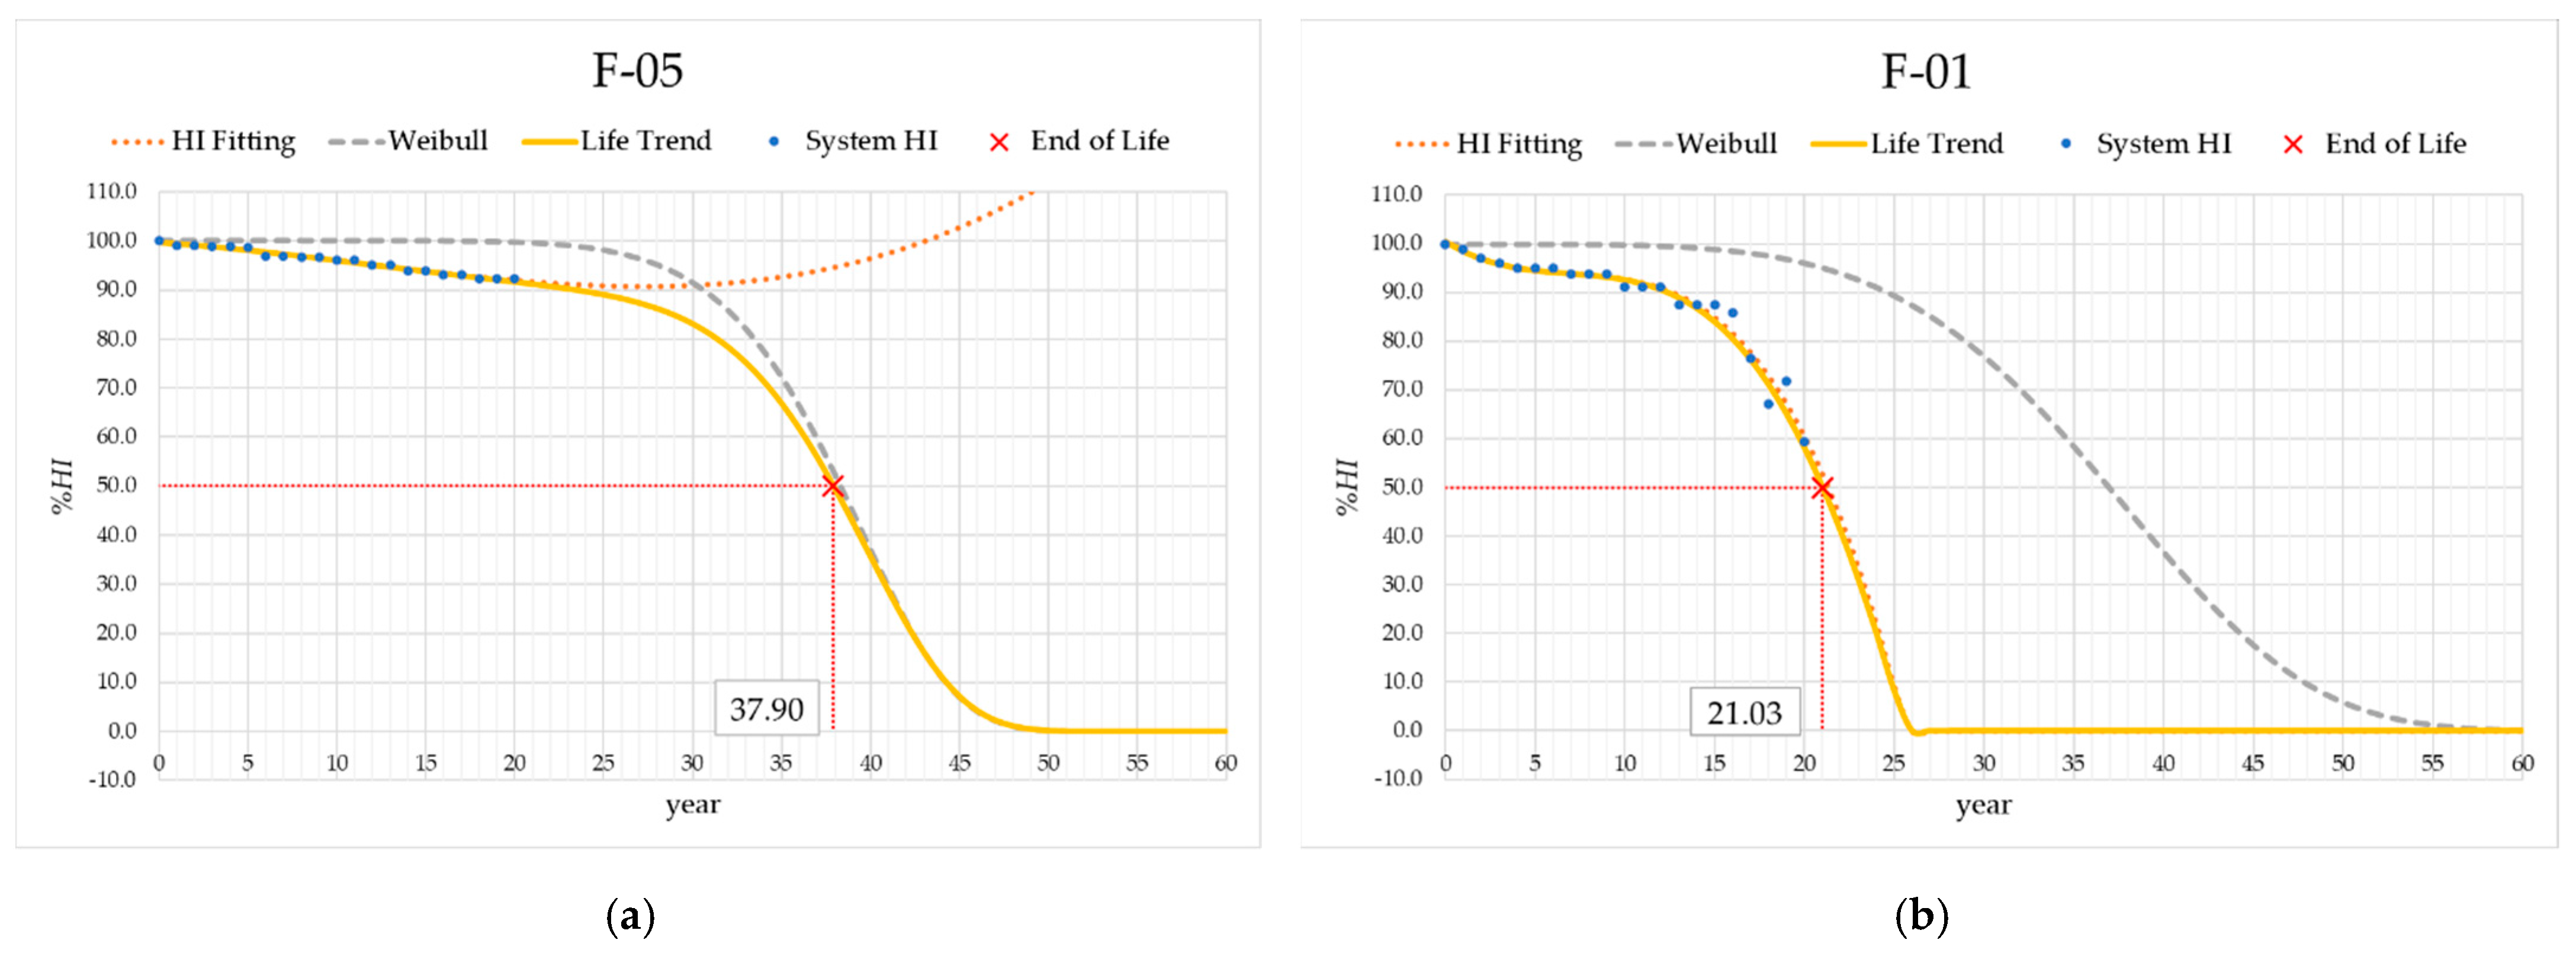
7. Results and Discussion

In this section, the results of %HIC calculation of five major components and the overall %HIS of the cable system as well as the %CF of 10 cable feeders are presented. The data of feeder F-01 provided in Table 4, Table 5 and Table 6 is used to demonstrate the calculation of %HIC, %HIS, %CF, and lifetime estimation as examples. The lifetime curve of F-01 is plotted in Figure 7 as a solid line, whereas the dashed line represents the ideal lifetime curve without operational and environmental stresses. In Figure 7, when the AP is defined at %HIS equal to 50%, the lifetime is estimated as 21 years.
The worst %HIC of each major component of F-01 to F-10 is summarized and presented in Table 7. Finally, the %HIS of 10 feeders evaluated from the past 20 years are shown in Table 8. The adjusted %HIS of the best and the worst cable systems are plotted in Figure 8, in which the lifetime can be observed. The results show that the maximum expected lifetime is 37.90 years of feeder F-05 as the best condition, whereas the minimum expected lifetime is 21.03 years of feeder F-01 as the worst condition.
Moreover, this section shows the differences of degradation behavior of each system. For example, the systems as F-06 and F-07 have the same level of %HIS at the 20th year, but their expected lifetimes are different. The lifetime of F-06 is shorter than F-07 because its stresses in operation are more severe than those of F-07 as can be seen in Table 8. Thus, for any other power plants, there will be several systems of the same model, which have been put in service in the same year. They have the same level of %HIS at the latest year, but at the end their expected lifetime is not equal due to the differences in terms of operating and environmental conditions. Another case is the comparison of F-03 and F-06, in which it can be seen that although the latest %HIS of F-03 is higher than F-06, the evaluated lifetime of F-03 is shorter because the %HIS of F-03 dropped suddenly at the 19th year due to the increase in some minor defects in its system.
The proposed lifetime estimation method was well agreed by the utility. The failure records as well as the testing and inspection results of the cable system in that utility are systematically collected and recorded in the central database to verify the outcome of the proposed method and to adjust some parameters in the method to improve the accuracy. Currently, the worst condition of a cable feed F-01 shows the highest failure rate with detectable internal partial discharge at a cable joint. This leads to the shortest remaining lifetime of this cable. Even though further comparison between predictive remaining lifetime and symptom of defects leading to end of lifetime takes time for data collection due to different remaining lifetimes of each cable system, it is a mandatory step in future work to verify the usefulness of the proposed method.
Eventually, a further benefit is that the results can be used to categorize the systems for future planning and determination of the proper maintenance actions as urgent, monitor, and normal inspection based on their remaining lifetimes being lower than 1 year, between 1 to 10 years, and more than 10 years, respectively [7]. Finally, the organization can properly manage their available budget according to the known maintenance requirement and lifetime estimation result by taking actions such as fully replacing the cable when the system is in very poor condition and has very short remaining lifetime, paying more attention and increasing the maintenance cycle when the system has moderate condition, or continuing to adhere to the normal maintenance strategy when the system is satisfied and has a long remaining lifetime [8].

8. Conclusions

This paper proposes a new lifetime estimation method for underground cable systems by combining the conventional health index approach with an indicator of cable system degradation known as conditional factor as representative of the difference in various usage conditions of the cable system. This method is aimed to estimate the remaining lifetime of an underground cable system by combining the difference in degradation behavior and operating conditions with the conventional health index. The weighting and scoring method, analytical hierarchy process, polynomial and Weibull distribution functions were key elements in the evaluation process. The actual technical and operating data with historical testing records were stored in the central database via developed web application software. The condition assessment of the underground cable system was firstly performed by applying the weighting and scoring technique and the analytic hierarchy process to evaluate the health index of a cable system and its parts consisting of five major components: power cable, joint, termination, manhole, and duct bank. The corresponding test results of those five major components of any underground cable system were used for the condition assessment. Then, the annually calculated health indices of cable system of each cable feeder were periodically plotted versus time. The trending curve of such a health index of a cable system was observed and predicted by the third polynomial distribution function. Simultaneously, the technical data and operating data were also considered as conditional factors representing the degradation behavior in terms of practical usage by using Weibull distribution. Finally, the lifetime of the cable system can be successfully determined by multiplying the obtained health index from fitting function with the conditional factor estimated by the Weibull distribution function.
The result of the health index of five major components and the health index of a cable system as well as the conditional factor of ten cable feeders are presented. The difference of degradation behavior and the impact of different operating and environmental conditions on the expected lifetime have been investigated and described. The obtained results can be further used to categorize the systems for future maintenance and replacement planning and determination of the proper maintenance actions as urgent, monitor, and normal inspection according to their remaining lifetime and health index result. Finally, the organization can properly manage their available budget according to the obtained health index and lifetime estimation result of those cable systems by taking actions such as full replacement, paying more attention and increasing the maintenance cycle, or continually performing routine inspections.

Author Contributions

Conceptualization, T.S. (Tanachai Somsak), C.S. and T.S. (Thanapong Suwanasri); methodology, T.S. (Tanachai Somsak) and T.S. (Thanapong Suwanasri); formal analysis, T.S. (Tanachai Somsak) and C.S.; investigation, T.S. (Tanachai Somsak) and T.S. (Thanapong Suwanasri); resources, C.S. and T.S. (Thanapong Suwanasri); data curation, T.S. (Tanachai Somsak); writing—original draft preparation, T.S. (Tanachai Somsak), C.S. and T.S. (Thanapong Suwanasri); writing—review and editing, C.S. and T.S. (Thanapong Suwanasri); supervision, C.S. and T.S. (Thanapong Suwanasri); project administration, C.S. All authors have read and agreed to the published version of the manuscript.

Funding

This research was funded by National Science, Research and Innovation Fund (NSRF), and King Mongkut’s University of Technology North Bangkok with Contract no. KMUTNB-FF-65-02.

Institutional Review Board Statement

Not applicable.

Informed Consent Statement

Not applicable.

Data Availability Statement

Not applicable.

Conflicts of Interest

The authors declare no conflict of interest.

References

  1. Klerx, M.H.P.; Morren, J.; Slootweg, H. Analyzing Parameters That Affect the Reliability of Low-Voltage Cable Grids and Their Applicability in Asset Management. IEEE Trans. Power Deliv. 2019, 34, 1432–1441. [Google Scholar] [CrossRef]
  2. Chimunda, S.; Nyamupangedengu, C. A Reliability Assessment Model for an Outdoor 88kV XLPE Cable Termination. Electr. Power Syst. Res. 2019, 177, 105979. [Google Scholar] [CrossRef]
  3. CIGRE. Maintenance for HV Cable and Accessories; WG B1.04; Technical Brochure No. 279; CIGRE: Paris, France, 2005. [Google Scholar]
  4. Zhang, X.; Pang, B.; Liu, Y.; Liu, S.; Xu, P.; Li, Y.; Liu, Y.; Qi, L.; Xie, Q. Review on Detection and Analysis of Partial Discharge along Power Cables. Energies 2021, 14, 7692. [Google Scholar] [CrossRef]
  5. Yii, C.C.; Rohani, M.N.K.H.; Isa, M.; Hassan, S.I.S. Multi-end PD Location Algorithm using Segmented Correlation and Trimmed Mean Data Filtering Techniques for MV Underground Cable. IEEE Trans. Dielectr. Electr. Insul. 2017, 24, 92–98. [Google Scholar] [CrossRef]
  6. Joseph, J.; Krishnan, S.T. Development of Severity and Location Indices Based Condition Monitoring Scheme for Underground Cables by Impedance Spectroscopy. IEEE Trans. Power Deliv. 2021, 36, 533–543. [Google Scholar] [CrossRef]
  7. IEEE. IEEE Std 81-2012—Guide for Measuring Earth Resistivity, Ground Impedance, and Earth Surface Potentials of a Grounding System; Institute of Electrical and Electronics Engineers: Piscataway, NJ, USA, 2012. [Google Scholar]
  8. Souza, D.S.C.; Caetano, C.E.F.; De Paula, H.; Lopes, I.J.S.; Boaventura, W.D.C.; Paulino, J.O.S.; Êvo, M.T.A. Experimental Investigation of Magnetic Field Shielding Techniques and Resulting Current Derating of Underground Power Cables. IEEE Trans. Ind. Appl. 2018, 54, 1146–1154. [Google Scholar] [CrossRef]
  9. Mu, L.; Xu, X.; Xia, Z.; Yang, B.; Guo, H.; Zhou, W.; Zhou, C. Autonomous Analysis of Infrared Images for Condition Diagnosis of HV Cable Accessories. Energies 2021, 14, 4316. [Google Scholar] [CrossRef]
  10. Somsak, T.; Suwanasri, C.; Suwanasri, T. Asset Management of Underground Cable System for Industrial Estate in Thailand. In Proceedings of the 2018 International Electrical Engineering Congress, Krabi, Thailand, 7–9 March 2018. [Google Scholar]
  11. Khelif, R.; Chebel-Morello, B.; Malinowski, S.; Laajili, E.; Fnaiech, F.; Zerhouni, N. Direct Remaining Useful Life Estimation Based on Support Vector Regression. IEEE Trans. Ind. Electron. 2017, 64, 2276–2285. [Google Scholar] [CrossRef]
  12. Zhang, Z.; Assala, P.D.S.; Wu, L. Residual Life Assessment of 110kV XLPE Cable. Electr. Power Syst. Res. 2018, 163, 572–580. [Google Scholar] [CrossRef]
  13. Shokrzadeh, S.; Jafari, J.M.; Bibeau, E. Wind Turbine Power Curve Modeling Using Advanced Parametric and Nonparametric Methods. IEEE Trans. Sustain. Energy 2014, 5, 1262–1269. [Google Scholar] [CrossRef]
  14. Liu, S.; Wang, Y.; Tian, F. Prognosis of Underground Cable via Online Data-Driven Method with Field Data. IEEE Trans. Ind. Electron. 2015, 62, 7786–7794. [Google Scholar] [CrossRef]
  15. Gouda, O.E.; El Dein, A.Z.; Amer, G.M. Effect of the Formation of the Dry Zone around Underground Power Cables on Their Ratings. IEEE Trans. Power Deliv. 2011, 26, 972–978. [Google Scholar] [CrossRef]
  16. CIGRE. Remaining Life Management of Existing AC Underground Lines; WG B1.09; Technical Brochure No. 358; CIGRE: Paris, France, 2008. [Google Scholar]
  17. Chitpong, J.; Suwanasri, C.; Suwanasri, T. Evaluation Criteria for Condition and Importance Assessment of High Voltage Transmission Line. In Proceedings of the 13th International Conference on Electrical Engineering/Electronics, Computer, Telecommunications and Information Technology, Chiang Mai, Thailand, 28 June–1 July 2016. [Google Scholar]
  18. Aslam, M.; Yen, C.; Chang, C.; Al-Marshadi, A.H.; Jun, C. A Multiple Dependent State Repetitive Sampling Plan Based on Performance Index for Lifetime Data with Type II Censoring. IEEE Access 2019, 7, 49377–49391. [Google Scholar] [CrossRef]
  19. Wu, R.; Chang, C. The Use of Partial Discharges as an Online Monitoring System for Underground Cable Joints. IEEE Trans. Power Deliv. 2011, 26, 1585–1591. [Google Scholar] [CrossRef]
  20. Liao, Y.; Liu, H.; Yuan, J.; Xu, Y.; Zhou, W.; Zhou, C. A Holistic Approach to Risk-Based Maintenance Scheduling for HV Cables. IEEE Access 2019, 7, 118975–118985. [Google Scholar] [CrossRef]
  21. Pompili, M.; Calcara, L.; D’Orazio, L.; Ricci, D.; Derviškadić, A.; He, H. Joints Defectiveness of MV Underground Cable and the Effects on the Distribution System. Electr. Power Syst. Res. 2021, 192, 107004. [Google Scholar] [CrossRef]
  22. IEEE. IEEE Std 400-2012—Guide for Field Testing and Evaluation of the Insulation of Shielded Power Cable Systems Rated 5 kV and Above; Institute of Electrical and Electronics Engineers: Piscataway, NJ, USA, 2012. [Google Scholar]
  23. Liu, S.; Kopsidas, K. Risk-Based Underground Cable Circuit Ratings for Flexible Wind Power Integration. IEEE Trans. Power Deliv. 2021, 36, 145–155. [Google Scholar] [CrossRef]
  24. Yang, Z.-X.; Yu, G.; Zhao, J.; Wong, P.K.; Wang, X.-B. Online Equivalent Degradation Indicator Calculation for Remaining Charging-Discharging Cycle Determination of Lithium-Ion Batteries. IEEE Trans. Veh. Technol. 2021, 70, 6613–6625. [Google Scholar] [CrossRef]
  25. Wang, Y.; Li, L.; Dang, C. Calibrating Classification Probabilities with Shape-Restricted Polynomial Regression. IEEE Trans. Pattern Anal. Mach. Intell. 2019, 41, 1813–1827. [Google Scholar] [CrossRef] [PubMed]
  26. Machado de Assis, E.; Lima, G.A.C.; Prestes, A.; Marinho, F.; Costa, L.A.N. q-Weibull Applied to Brazilian Hydropower Equipment. IEEE Trans. Reliab. 2019, 68, 122–132. [Google Scholar] [CrossRef]
  27. Boudreau, J.-F.; Poirier, S. End-of-Life Assessment of Electric Power Equipment Allowing for Non-Constant Hazard Rate—Application to Circuit Breakers. Int. J. Electr. Power Energy Syst. 2014, 62, 556–561. [Google Scholar] [CrossRef]
  28. Melchor-Hernández, C.L.; Rivas-Dávalos, F.; Maximov, S.; Coria, V.; Moreno-Goytia, E.L. An Analytical Method to Estimate the Weibull Parameters for Assessing the Mean Life of Power Equipment. Int. J. Electr. Power Energy Syst. 2015, 64, 1081–1087. [Google Scholar] [CrossRef]
  29. Mkandawire, B.O.; Ijumba, N.M.; Saha, A.K. Component Risk Trending Based on Systems Thinking Incorporating Markov and Weibull Inferences. IEEE Syst. J. 2015, 9, 1185–1196. [Google Scholar] [CrossRef]
  30. Lemonte, A.J. A New Exponential-Type Distribution with Constant, Decreasing, Increasing, Upside-Down Bathtub and Bathtub-Shaped Failure Rate Function. Comput. Stat. Data Anal. 2013, 62, 149–170. [Google Scholar] [CrossRef]
  31. Montanari, G.C.; Seri, P.; Ghosh, R.; Franchi, B.S.; Albertini, M. Testing Cable System Reliability after Commissioning and During Operation Life: In Medio Stat Virtus. High Volt. 2021, 6, 34–41. [Google Scholar] [CrossRef]
Figure 1. Lifetime estimation diagram of underground cable system.
Energies 14 08113 g001
Figure 2. Simplified underground cable system and diagram of five major components.
Energies 14 08113 g002
Figure 3. Visual inspection, testing, and measurement of underground cable system.
Energies 14 08113 g003
Figure 4. Regression analysis by various curve fitting functions to predict the trend of health index. (a) Linear function, (b) exponential function, (c) 2nd order polynomial function, and (d) 3rd order polynomial function.
Energies 14 08113 g004
Figure 5. Weibull survival curve with different shape parameters to represent the difference in degradation behavior of underground cable system.
Energies 14 08113 g005
Figure 6. Lifetime curve estimation after the combination of predictive health index and conditional factor.
Energies 14 08113 g006
Figure 7. Plot of predictive health index multiplied by conditional factor for lifetime estimation of cable feeder F-01.
Energies 14 08113 g007
Figure 8. Lifetime curve and determination of the expected lifetime of the best and the worst cable system. (a) The best estimated lifetime curve of F-05 and (b) the worst estimated lifetime curve of F-01.
Energies 14 08113 g008
Table 1. Testing and inspection methods with scoring and weighting for health index calculation.
Testing MethodOutput ValueWeightScore
4 (Good)2 (Moderate)0 (Bad)
Partial dischargePD pattern10No PD/coronaSurfaceInternal
Amplitude (internal PD), (pC)8<5050–300>300
Amplitude (surface PD), (nC)<0.50.5–2>2
Trending of amplitudeStableSlightSignificant
Infrared thermographyΔT phase-ambient (°C)10<1010–15>15
ΔT phase-phase (°C)<77–10>10
Sheath currentIncrement of sheath current (%)8<55–10>10
Grounding resistanceGrounding resistance (Ω)5<1010–2525
Visual inspectionCable jacket10NormalRepairedCracked
Cable supporting structure4NormalStainedBroken
Cable shield grounding8NormalLooseBroken
Splice condition10Normal-Bloated
Termination condition10NormalDirtyBloated
Manhole gate7NormalStainedLost
Manhole wall7NormalSmall crackBroken
Manhole floor7NormalSmall crackBroken
manhole cleaning3CleanDirtyFlooded
Manhole ground connection8NormalLooseBroken
Duct bank water ingress8No waterSome leakageHigh pressure
Duct bank general condition8NormalSmall crackBroken
Number of available ducts10ManyA fewUnavailable
Table 2. Criteria with scoring and weighting values for conditional factor assessment.
Considering ItemWeightScore
4 (Normal)2 (Moderate)0 (Risk)
Usage time (y)10<2020–30>30
Loading condition (%)10<6060–80>80
Failure frequency (times/year)801–3>3
Reparation rate (times/year)7<33–6>6
Network reliability6NetworkLoopRedial
Length (km)5<11–3>3
Route configuration5<1010–30>30
Operational environment3noRoad, buildingVibration
Table 3. Correlation between shape parameter and conditional factor.
β-Parameter108642
Conditional factor (%CF)1007550250
Table 4. Calculation of cable system health index of feeder F-01.
Component GroupThe Worst Component Health Index,
%HICW,j
Weight,
Wj
System Health Index,
%HIS
Cable46.883075.38
Joint40.7030
Termination100.0025
Manhole55.1310
Duct bank50.005
Table 5. Conditional factor calculation of feeder F-01.
Considering ItemScore,
Sc
Weight,
Wc
Conditional
Factor,
%CF
Shape
Parameter,
β
Usage time21033.54.68
Loading condition210
Failure frequency48
Reparation rate27
Network reliability06
Length25
Route configuration05
Operational environment23
Table 6. Calculated parameters for lifetime estimation of feeder F-01.
Year, tSystem
Health Index,
%HIS
HIS FittingFunction,
g(t)
Shape
Parameter,
β
Expected
Lifetime,
α
Weibull
Function,
h(t)
Lifetime
Function,
y(t)
296.9797.014.68400.9997.01
495.1195.110.9995.11
695.1194.230.9994.21
893.8393.690.9993.64
1091.0692.840.9992.70
1291.0691.010.9990.68
1487.5787.530.9986.88
1685.9181.750.9980.62
1867.1672.980.9871.25
2059.2860.580.9658.24
Table 7. Summary of testing and inspection results with their scoring and health index calculation of cable system and its components of 10 cable feeders.
ComponentTesting MethodConsidering ValueWeight,
Wi
Score, Si
F-01F-02F-03F-04F-05F-06F-07F-08F-09F-10
CableVisual inspectionCable jacket102244444444
Cable supporting structure42222222222
Cable shield grounding84444444444
Sheath currentincrement of sheath current100444444444
The worst component health index (%HICW) of cable46.8878.1393.7593.7593.7593.7593.7593.7593.7593.75
JointVisual inspectionSplice condition104444444444
Partial dischargePD pattern100444444444
PD amplitude and trending80444444444
Infrared thermographyΔT p-p or p-ambient102444444444
Grounding resistanceGrounding resistance52224422424
The worst component health index (%HICW) of joint40.794.1994.1910010094.1994.1910094.19100
TerminationVisual inspectionTermination condition104444422444
Partial dischargePD pattern104444444444
PD amplitude and trending84444444444
Infrared thermographyΔT p-p or p-ambient104244444444
Grounding resistanceGrounding resistance54444422442
The worst component health index (%HICW) of termination10088.3710010010082.5682.5610010094.19
ManholeVisual inspectionManhole gate74444444444
Manhole wall72222222222
Manhole floor72222422222
Manhole cleanness30000000002
Manhole ground connection82224444244
Grounding resistanceGrounding resistance72224422422
The worst component health index (%HICW) of manhole55.1355.1355.1374.3683.3365.3865.3864.1065.3869.23
Duct bankVisual inspectionDuct bank general condition84422222224
Duct bank water ingress80000000202
number of available ducts102200000000
The worst component health index (%HICW) of duct bank505015.3815.3815.3815.3815.3830.0715.3846.15
System health index (%HIS)59.2881.887.6691.3392.2384.3384.3391.0788.6990.90
Table 8. Summary of remaining life estimation results and related parameters of ten cable systems.
Recorded YearSystem Health Index, %HIS
F-01F-02F-03F-04F-05F-06F-07F-08F-09F-10
0100.00100.00100.00100.00100.00100.00100.00100.00100.00100.00
198.8599.2398.8599.0499.0499.2399.2398.8598.6598.85
296.9798.6598.8598.6599.0498.6599.0498.8598.6598.85
396.0198.6598.8598.6598.8598.6598.6598.1397.1698.85
495.1196.7896.9798.1398.8598.1397.1697.1697.1696.97
595.1196.0196.9797.1698.6598.1396.7896.9796.9796.97
695.1195.1196.9797.1696.9796.7896.7896.9796.7896.97
793.8393.8396.0196.7896.9796.7896.0196.0196.0196.01
893.8393.8396.0196.7896.7896.7895.0596.0196.0196.01
993.8393.1396.0196.0196.7896.0193.8996.0195.1196.01
1091.0691.3395.1196.0196.0196.0193.1395.1195.0595.11
1191.0691.0695.1196.0196.0195.0593.1395.1195.0595.11
1291.0691.0695.1195.0595.1195.0591.3395.0593.8995.11
1387.5787.5793.8395.0595.1192.2391.3393.8393.8993.83
1487.5787.5393.8395.0593.8991.3391.3393.8393.1393.83
1587.5787.5393.8393.8993.8988.4288.4293.1393.1393.83
1685.9186.591.0693.8993.1387.5386.593.1392.2393.83
1776.5385.9191.0693.8993.1387.5386.592.2392.2391.07
1867.1685.9191.0691.3392.2386.586.0791.3391.3391.07
1971.8477.1187.6691.3392.2386.0784.3391.0791.3390.90
2059.2881.887.6691.3392.2384.3384.3391.0788.6990.90
Expected lifetime, α (yrs.)40404040404040404040
Shape parameter, β4.676.156.526.528.376.527.417.416.897.41
Estimated lifetime (yrs.)21.0329.4229.8832.9637.9032.6234.1934.6332.3334.01
Coefficient (R2)0.96080.94680.9730.9740.9820.97430.9870.9870.97770.962
Acceptable point, AP(%)50505050505050505050
Remaining life (yrs.)1.039.429.8812.9617.9012.6214.1914.6312.3314.01
Publisher’s Note: MDPI stays neutral with regard to jurisdictional claims in published maps and institutional affiliations.

