1. Introduction
The relationship between the price of crude oil and the US dollar is an essential component of the modern economic system. This relationship has an impact on the profitability of many industrial sectors, such as the petroleum industry, transportation industry, chemical industry, financial sector, food industry, etc. In addition, it has an impact on the budget revenues, expenditures, and inflation in many countries. The study of this relationship is therefore an important aspect of broader research on the transfer of market shocks in the global economy.
The negative correlation of the oil price and the US dollar exchange rate persisting over the course of several years now has turned into one of economic regularities. Periods of increasing oil prices (proximately before the global economic crisis and prior to their previous collapse during a crisis) are accompanied by depreciation of the nominal effective exchange rate for the US dollar. In turn, as oil prices decrease (in periods of a considerable rise in oil production from non-conventional sources in the USA), the effective exchange of the US dollar is appreciated [
1,
2,
3,
4].
In theory, both oil prices should affect the exchange rate of the US dollar and the US dollar exchange rate should influence prices of crude oil [
5]. Conclusions from empirical studies suggest that the direction of causation between the two economic categories remains disputable in both the short- and long-term, and the above dependence is not always stable in time. This invigorates the discussion about causes of the changeable strength of the link between these assets.
Structural changes occurring in the crude oil market have given rise to hypotheses suggesting that the relationship between prices of this raw material and exchange rates of the US dollar may gradually become similar to that between prices of oil and exchange rates of the currencies of the countries whose revenues from exporting this resource are a considerable part of their current account balance [
6]. Assumptions have arisen that a lasting growth in the production of crude oil in the United States of America and this country becoming independent from import of petroleum products could lead to appreciation of the US dollar. In this article, we will refer to these research questions [
7,
8].
The purpose of this study has been to determine and evaluate the time-varying dependence between prices of crude oil and the exchange rate of the US dollar in the context of such a relationship for the Chinese, European, Japanese, Saudi, and Russian currencies.
This study offers a noteworthy contribution because it mainly concerns the period of structural changes in the American oil industry. It was a period of the shale revolution, characterized by low oil prices, a strong increase in the production and inventories of crude oil in the United States, with a declining share of the current account deficit in oil products trade in the GDP of the United States, or appreciation of the US dollar exchange rate with gradual normalization of the FED monetary policy. Additionally, the presented dependencies were compared to the situation of the largest exporters and importers of crude oil in the world. In this context, the conclusions drawn from the study constitute a valuable contribution to the literature on the subject.
In this paper, we will assess the strength of the transmission of supply shocks in the crude oil market towards the largest economies in the world. The similarities and differences in the correlation between crude oil and currencies make it possible to forecast the resilience of economies to changes in commodity prices. The present transformations of the economic structure of the world caused by climate protection measures will lead to significant changes in the markets of energy resources. The results of our research will help to assess the long-term impact of these changes on the global economy.
The remainder of this paper is organized as follows:
Section 2 introduces the literature review;
Section 3 describes the methodology and research data;
Section 4 reports the empirical results of this research;
Section 5 discusses the main conclusion and the implication of this study; and
Section 6 contains the summary of the results.
2. Literature Review
In theory, there should be a mutual relationship between the US dollar and the price of oil. On the one hand, the price of crude oil can explain fluctuations in exchange rates. To illustrate this effect, Amano and van Norden [
9] use the term of a trade channel. These authors argue that an increase in oil prices leads to appreciation of the real currency exchange rate in the economies in which the sector of domestic market goods is strongly dependent on this raw material. On the other hand, Golub [
10] and Krugman [
11] analyzed the wealth effect channel and its associated portfolio reallocation channel. These scholars claim that a country exporting (importing) crude oil may experience appreciation (depreciation) of its own currency exchange rate relative to the US dollar at an increase (decrease) in the prices of crude oil due to the generated excess (deficit) in the balance of current accounts. If revenues from selling oil are reinvested in financial products denominated in the US dollar, then the USD exchange rate should appreciate. Over a long time, the adjustment of the currency exchange rate will depend on expectations of market participants and trade balances of importers and exporters.
In turn, the currency exchange rate can affect prices of oil. Referring to the law of one price, Blomberg and Harris [
12] maintain that because of the international trade of crude oil in the US dollar and the inelastic demand for this homogenous commodity [
13], depreciation of the American dollar should lead to a decrease in oil prices expressed in currencies of other countries. Lower prices of this resource should stimulate the demand for oil outside the USA and therefore result in a resumed increase in its prices. Haughton [
14] claims that real oil prices depend on numerous bilateral currency exchange rates relative to the US dollar and consequently on the US dollar’s effective exchange rate. Its depreciation leads to a rise in the buying power of currencies of other countries, thereby initiating the demand adjustment and stimulating price increases (in this case, it affects the denomination channel). As the real effective exchange rate of the US dollar depreciates, so does the purchasing power of oil exporters (especially ones where state budgets are predominantly dependent on selling petroleum), which activates the adjustment channel. The supply of oil can be constrained, which may stimulate a resumed rise in crude oil prices internationally.
Results of empirical studies vary and depend on which economies have been analyzed, how samples have been selected and what research methods have been applied. However, researchers usually point to a strong dependence between oil prices and exchange rates of currencies over a long-term horizon; although, the question whether this is a positive or negative relationship is debatable [
15]. In the short-term perspective, using the information about exchange rates and oil prices can improve the accuracy of predictions thereof [
16].
The relationship between oil prices and a currency exchange rate can be both positive, where prices of the commodity determine the exchange rate (e.g., [
9,
17]), and negative, where the real effective exchange rate of the US dollar shapes the level of the real price of crude oil (e.g., [
18,
19,
20,
21,
22,
23]). Lizardo and Mollick [
2] state that a rise in the prices of oil in real terms leads to a statistically significant depreciation of the US dollars relative to the currencies of oil net exporting countries (Canada, Mexico, and Russia) and appreciation relative to other significant importers (e.g., Japan). Fratzscher, Schneider, and Van Robays [
24] suggest a mutual dependence but the response of crude oil prices to changes in exchange rates of currencies is incomparably stronger. In turn, Brahmasrene, Huang, and Sissoko [
25] maintain that in a short time span, the exchange rate has a negative effect on the dynamics of oil prices, while in a long-term perspective oil prices shape the exchange rate.
Conclusions drawn in regard of individual economies and exchange rates of their currencies also vary. Prices of petroleum are perceived as a significant source of fluctuations in the USD and exchange rates of the currencies of the other G7 states (e.g., [
2,
17]), some small, open developing economies [
26,
27], the OPEC states strongly dependent on crude oil [
28], and developing economies in Africa and Asia [
29]. Somewhat in contrast to the above results is the outcome of a study by Chen et al. [
30], who claim that petroleum shocks explain just about 10–20% of the long-term variation of exchange rates of the currencies of 16 OECD states (although after the financial crisis, shocks specific for the oil market explain fluctuations in exchange rates to a far greater degree). Habib, Bützer, and Stracca [
31] also investigated responses of exchange rates to demand and supply shocks specific for the crude oil market on a sample of 44 developing and developed countries. These authors did not find evidence to support the claim that exchange rates of the currencies of oil exporters would systematically appreciate relative to exchange rates of currencies of oil importers after an increase in real prices of this commodity. However, oil exporting economies experience appreciation of their currencies’ exchange rates as a consequence of a demand shock in the oil market, which they counteract through the accumulation of currency reserves.
Noteworthy, the relationship between oil prices and the USD exchange rate is not stable in time [
20,
32]. In this context, it is worth noting that Bénassy-Quére, Mignon, and Penot [
33] already indicated that the generally positive long-term dependence between oil prices and the US dollar exchange rate in 1974–2002 should have become negative when China entered the international market (becoming an important petroleum importer and one of the major trade partners of other economies). In a later study, Coudert and Mignon [
34] demonstrated that real prices of crude oil and the real exchange rate of the US dollar were connected by a long-term dependence, but having limited the sample to data of 2005, they discovered that this relationship changed the sign in accordance with results of previous empirical analyses.
Some scholars also suggest that an increase in the strength of the impact between the prices of the two analyzed assets appeared directly prior to and after the outbreak of the global financial crisis [
35]. The relationship between oil prices and exchange rates of currencies in years preceding the global financial crisis was weak or statistically insignificant [
36], but strengthened gradually [
19]. A bulk of the empirical literature suggests that after the outbreak of the financial crisis in 2008 and during the period of financial turmoil, exchange rates of currencies and oil prices became strongly interrelated and, contemporaneously, their extreme changes became much more likely to happen [
3,
19,
26,
29,
36,
37,
38].
3. Methodology
3.1. Research Model
The DCC-GARCH model was proposed by Engle [
39], while Bollerslev [
40] introduced the model of constant conditional correlation coefficients CCC-GARCH. The DCC and CCC models are used to describe the dynamics of the development of phenomena, characterized by multidimensional time series, where the CCC model is used when a constant correlation matrix over time is obtained, and the DCC model is taken into account for a variable correlation matrix. Multidimensional stochastic processes (for instance, oil prices and exchange rates) are a random description of the dynamics of a phenomenon in which we deal with various types of interdependencies between individual variables.
In order to determine correlations between oil prices and the exchange rates, we employed a multivariate DCC GARCH model. In essence, instead of directly modelling a full matrix of conditional variances and covariances, the DDC GARCH approach consists of modelling conditional variances of variables and a conditional correlation between them.
In the first step of the DCC model estimation, specifications of univariate GARCH models were selected for all variables. The following GARCH model classes were adopted: SGARCH and EGARCH. Moreover, the normal distribution and Student’s t-distribution of errors were adopted. The parameters of one-dimensional GARCH models were estimated: μ (intercept in the conditional mean model), ω (intercept in the conditional variance model), α (ARCH effect), β (persistence of the variance), γ (leverage effect), and λ (shape parameter of the errors distribution).
The second step was to assess parameters of the correlation structure of DCC conditionally relative to the univariate GARCH process parameters estimated at the first step. The following parameters were estimated: A (ARCH effect in the DCC model), B (persistence of the correlation matrix in the DCC model), Γ (leverage effect), and Δ (shape parameter of the multivariate Student’s-t errors). In order to make the estimation results resistant to the effect of the selection of specifications, six different specifications of the DCC(1,1) model were estimated in total. DCC models, both not accounting and accounting for asymmetric results, as well as three multivariate distributions of standardized residuals
(normal, Student’s-t, and Laplace) were included in this study. The pseudo maximum likelihood method used for the estimation returns reliable and asymptotic normal estimators [
41] and is just as reliable as the full maximum likelihood method [
42]. Results of empirical studies also implicate that a change in the distribution of errors does not affect the accuracy of estimation of parameters [
43,
44].
In the last step, again following the BIC criterion, the optimal DCC GARCH model was chosen. It was then used to distinguish the dynamic conditional correlation between variables WTIF and NBUSBIS, NBXMBIS, NBSABIS, NBRUBIS, NBCNBIS, and NBJPBIS.
In a general form, the DCC model can be presented as follows:
where
is the vector of logarithmic increases in prices of
n assets,
is the vector of conditional expected value
, and
is the vector of the mean-corrected logarithmic rates of increases—such that,
,
.
stands for the matrix of the conditional variance-covariance of vector
, while
is obtained by Cholesky factorization
.
Matrix is decomposed to a time-varying diagonal matrix of conditional standard deviations of processes (modelled with univariate GARCH models) and a symmetrical matrix of conditional correlation of n × n dimension of standardized random elements ; such that, . Individual elements of matrix are: , where , . In turn, denotes a vector of independent errors with the same distribution, such that .
Because of the condition of positive definiteness of matrix , matrix must also be a positive definite one (matrix is by definition positive definite). Moreover, the modelling of a correlation requires that all elements of matrix satisfy the inequation . In order to account for these assumption in a DCC(1,1) model, matrix is decomposed as follows: , where and . Elements of matrix are estimated from the formula: . Parameters and are scalars whereas matrix is a diagonal matrix of square roots of diagonal elements of matrix , which scales its elements in order to normalize the correlation to the expected range . Matrices and must also be definite positive in order to ensure positive definiteness of matrices and . Furthermore, to obtain a positive definite matrix the following restrictions must be imposed on parameters and : and standard conditions on univariate GRACH models so as to ensure positive conditional variances.
The correlation structure of the DCC(1,1) model presented above can be expanded to the form DCC(M, N):
In DCC models, it is also possible to account for a nonsymmetrical response of the correlation matrix to negative and positive performance of a random element. Cappiello, Engle and Sheppard [
45] introduced a class of asymmetrical generalized DCC models, where the dynamics of process
is described as follows:
where
A,
B, and
G can be matrices of parameters of n × n dimension,
εt− = [(
εt < 0) ʘ
εt] is the indicator function, and
i
are unconditional matrices of covariances
and
.
3.2. Source of Data
In this study, it was assumed that:
,
,
,
,
,
, which denote logarithmic increases of forward oil prices WTI (WTIF) and nominal effective exchange rates of US dollar (NBUSBIS), euro (NBXMBIS), Saudi riyal (NBSABIS), ruble (NBRUBIS), renminbi/yuan (NBCNBIS), and Japanese yen (NBJPBIS).
Table 1 summarizes the information about the variables.
Table 2 shows results of our preliminary exploration of the data. Daily data from 3 January 2002 to 1 July 2021 (L
DCC = 4899) were submitted to analysis. All variables show properties of high-frequency financial time series [
46]. They are characterized by high variability, asymmetry of distribution, leptokurtosis, and a strong effect of variance clustering.
The analyzed variables are stationary and the unconditional correlation between them is negative and statistically significant. Results of the preliminary analysis of the data therefore inclined us to proceed with combined modelling of increases in oil prices and nominal effective exchange rates by employing a multivariate DCC GRACH model.
4. Research Results
Estimations of univariate parameters of SGARCH models with the Student’s t-distribution of errors for the adopted variables are identical between the DCC models submitted to analysis, which stems from the applied two-step method of the estimation of models from this class. Regarding both equations, the estimation of the parameter of conditional mean μ is statistically insignificant. The other evaluations of univariate parameters of variance equations (except ) are statistically different from zero at the significance level of α = 0.01. Estimations of parameters β indicate that the conditional variance of both variables is characterized by high inertia. Furthermore, the evaluations of parameters α and γ justify the conclusion that there is a leverage effect in play, where volatility increases (decreases) in periods when oil prices decrease (increase). The estimation of parameter λ indicates slightly stronger leptokurtosis of standardized residuals in equations referring to currencies versus WTIF.
The parameters of the correlation structure of the DCC(1,1) model with the multivariate Student’s t-distribution of errors indicate that the effect of previous shocks on the correlation matrix is small and statistically significant. In turn, the effect of inertia and of the parameter of the multivariate Student’s t-distribution shape is considerable and always significant at significance level α = 0.01.
The results of the test on the ARCH effect suggest that the application of the GARCH model considerably reduces the effect of variance clustering for WTIF variable and other variables.
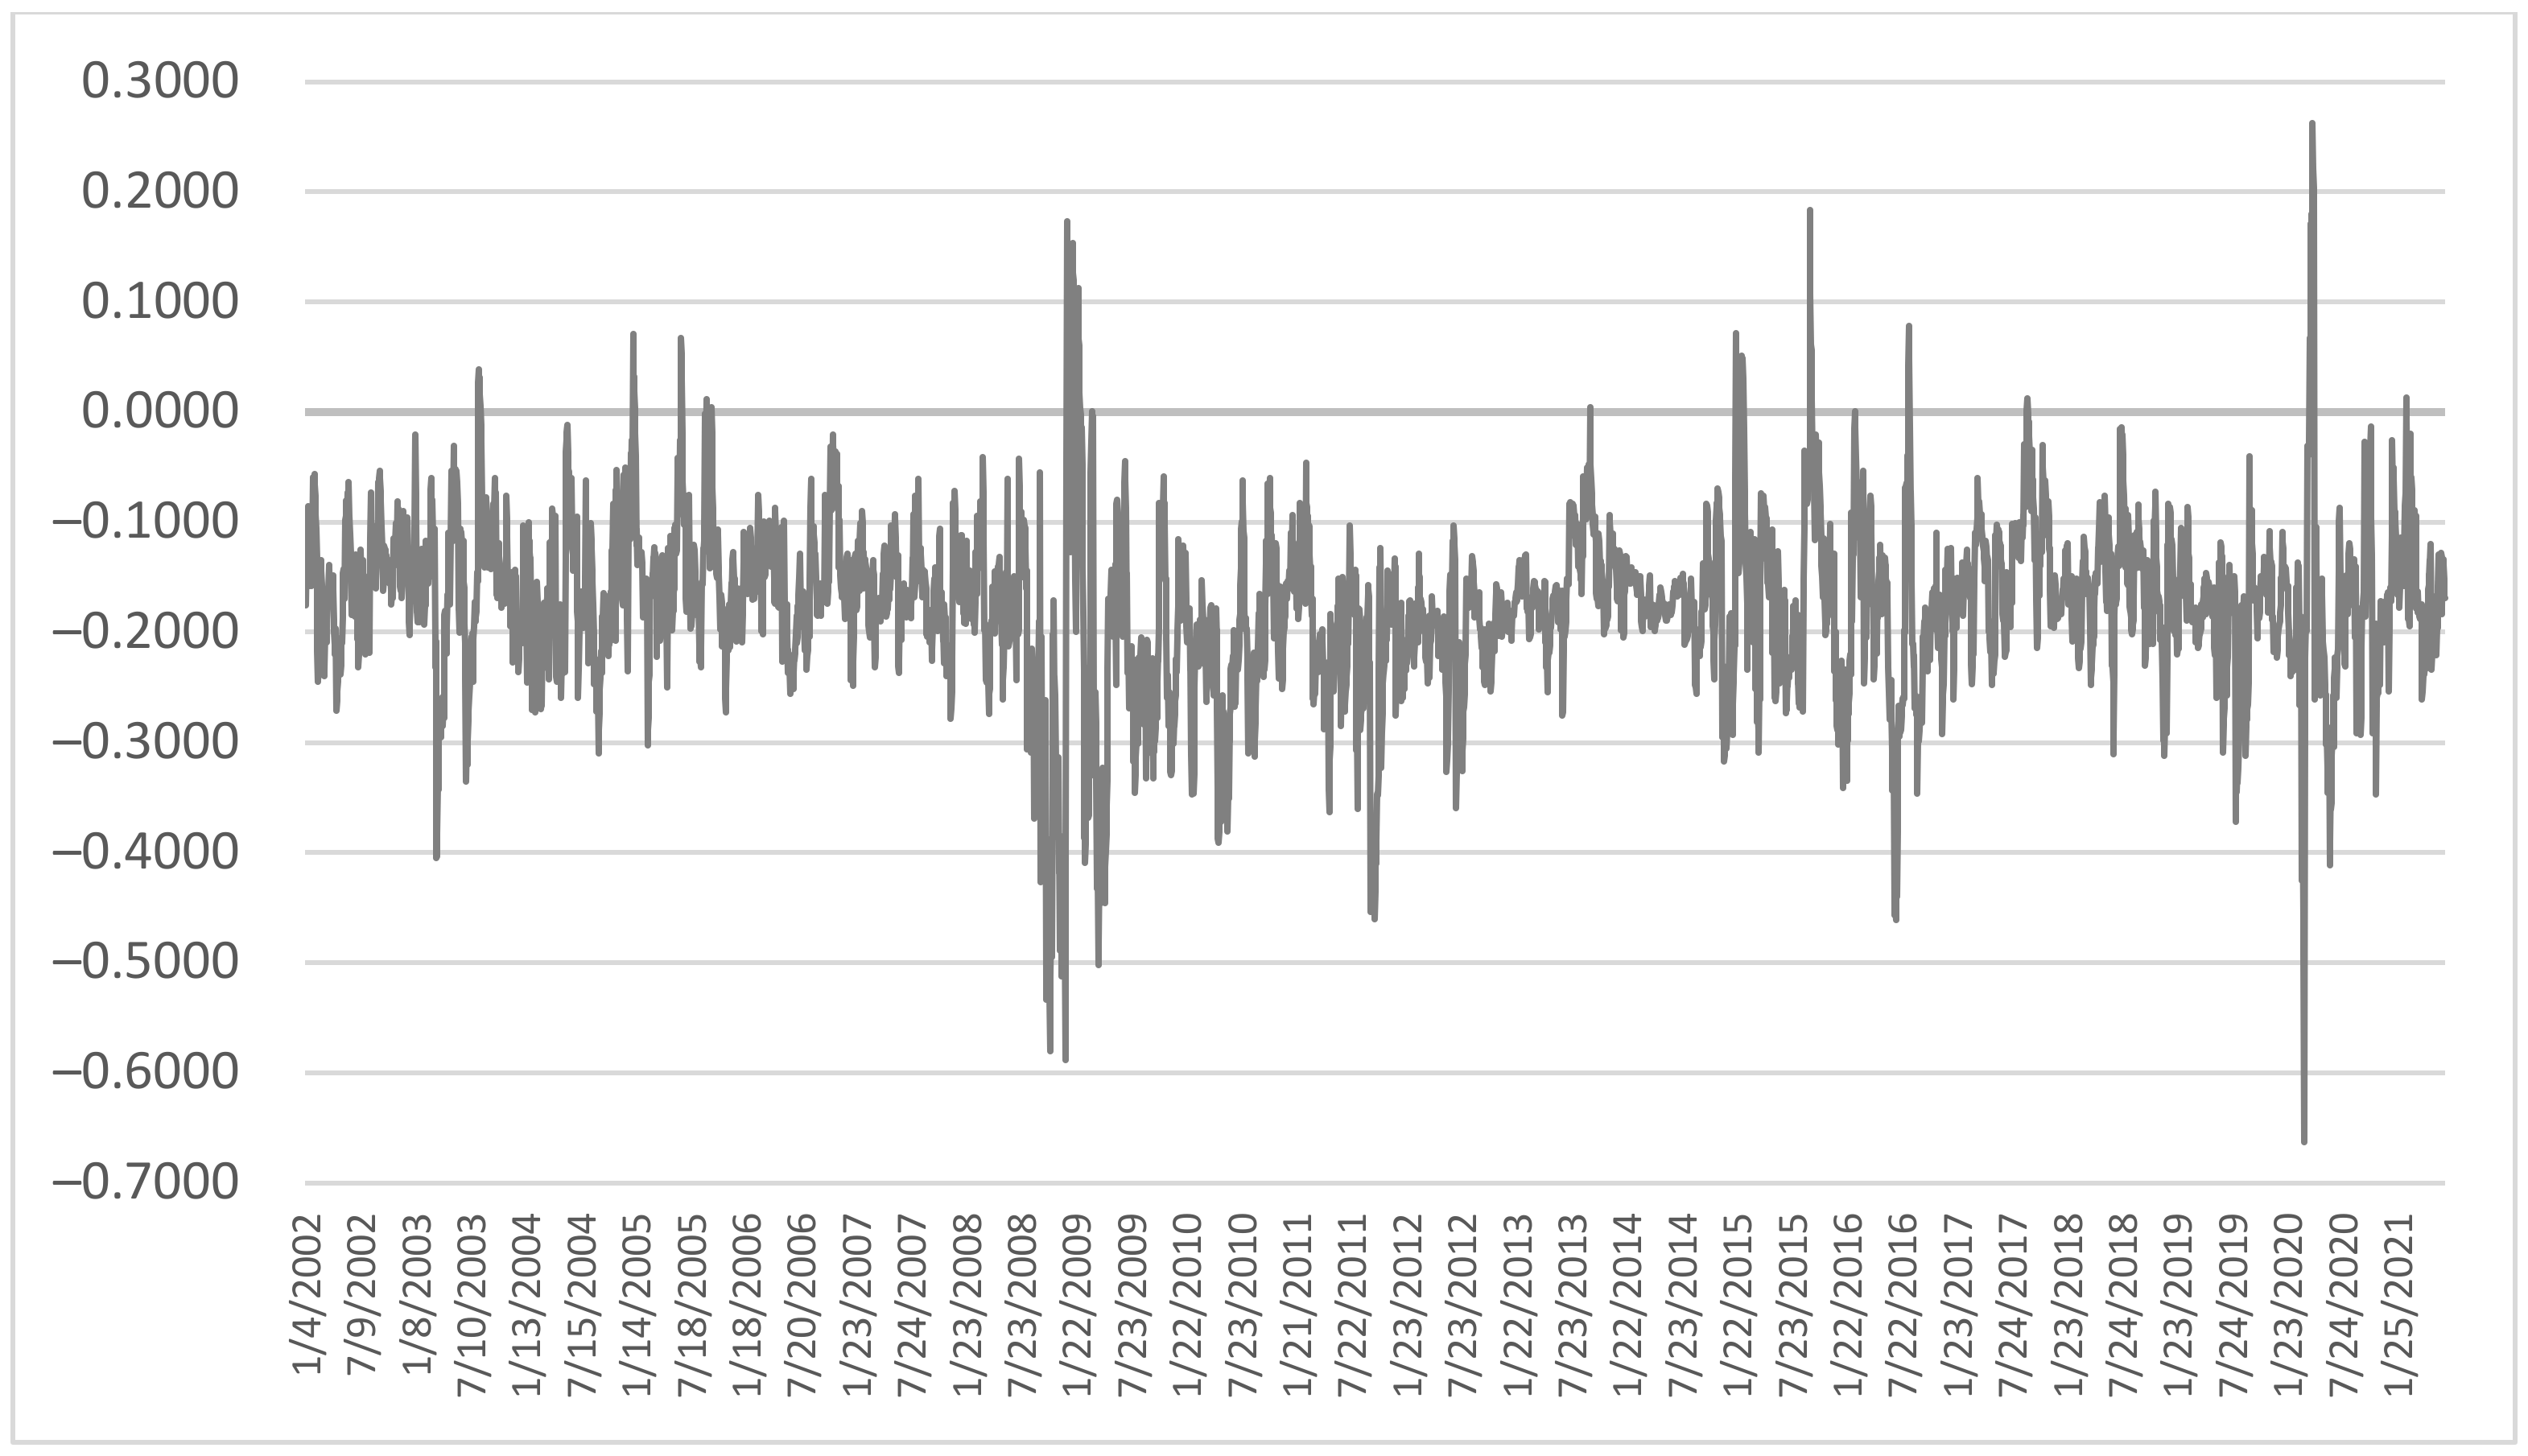
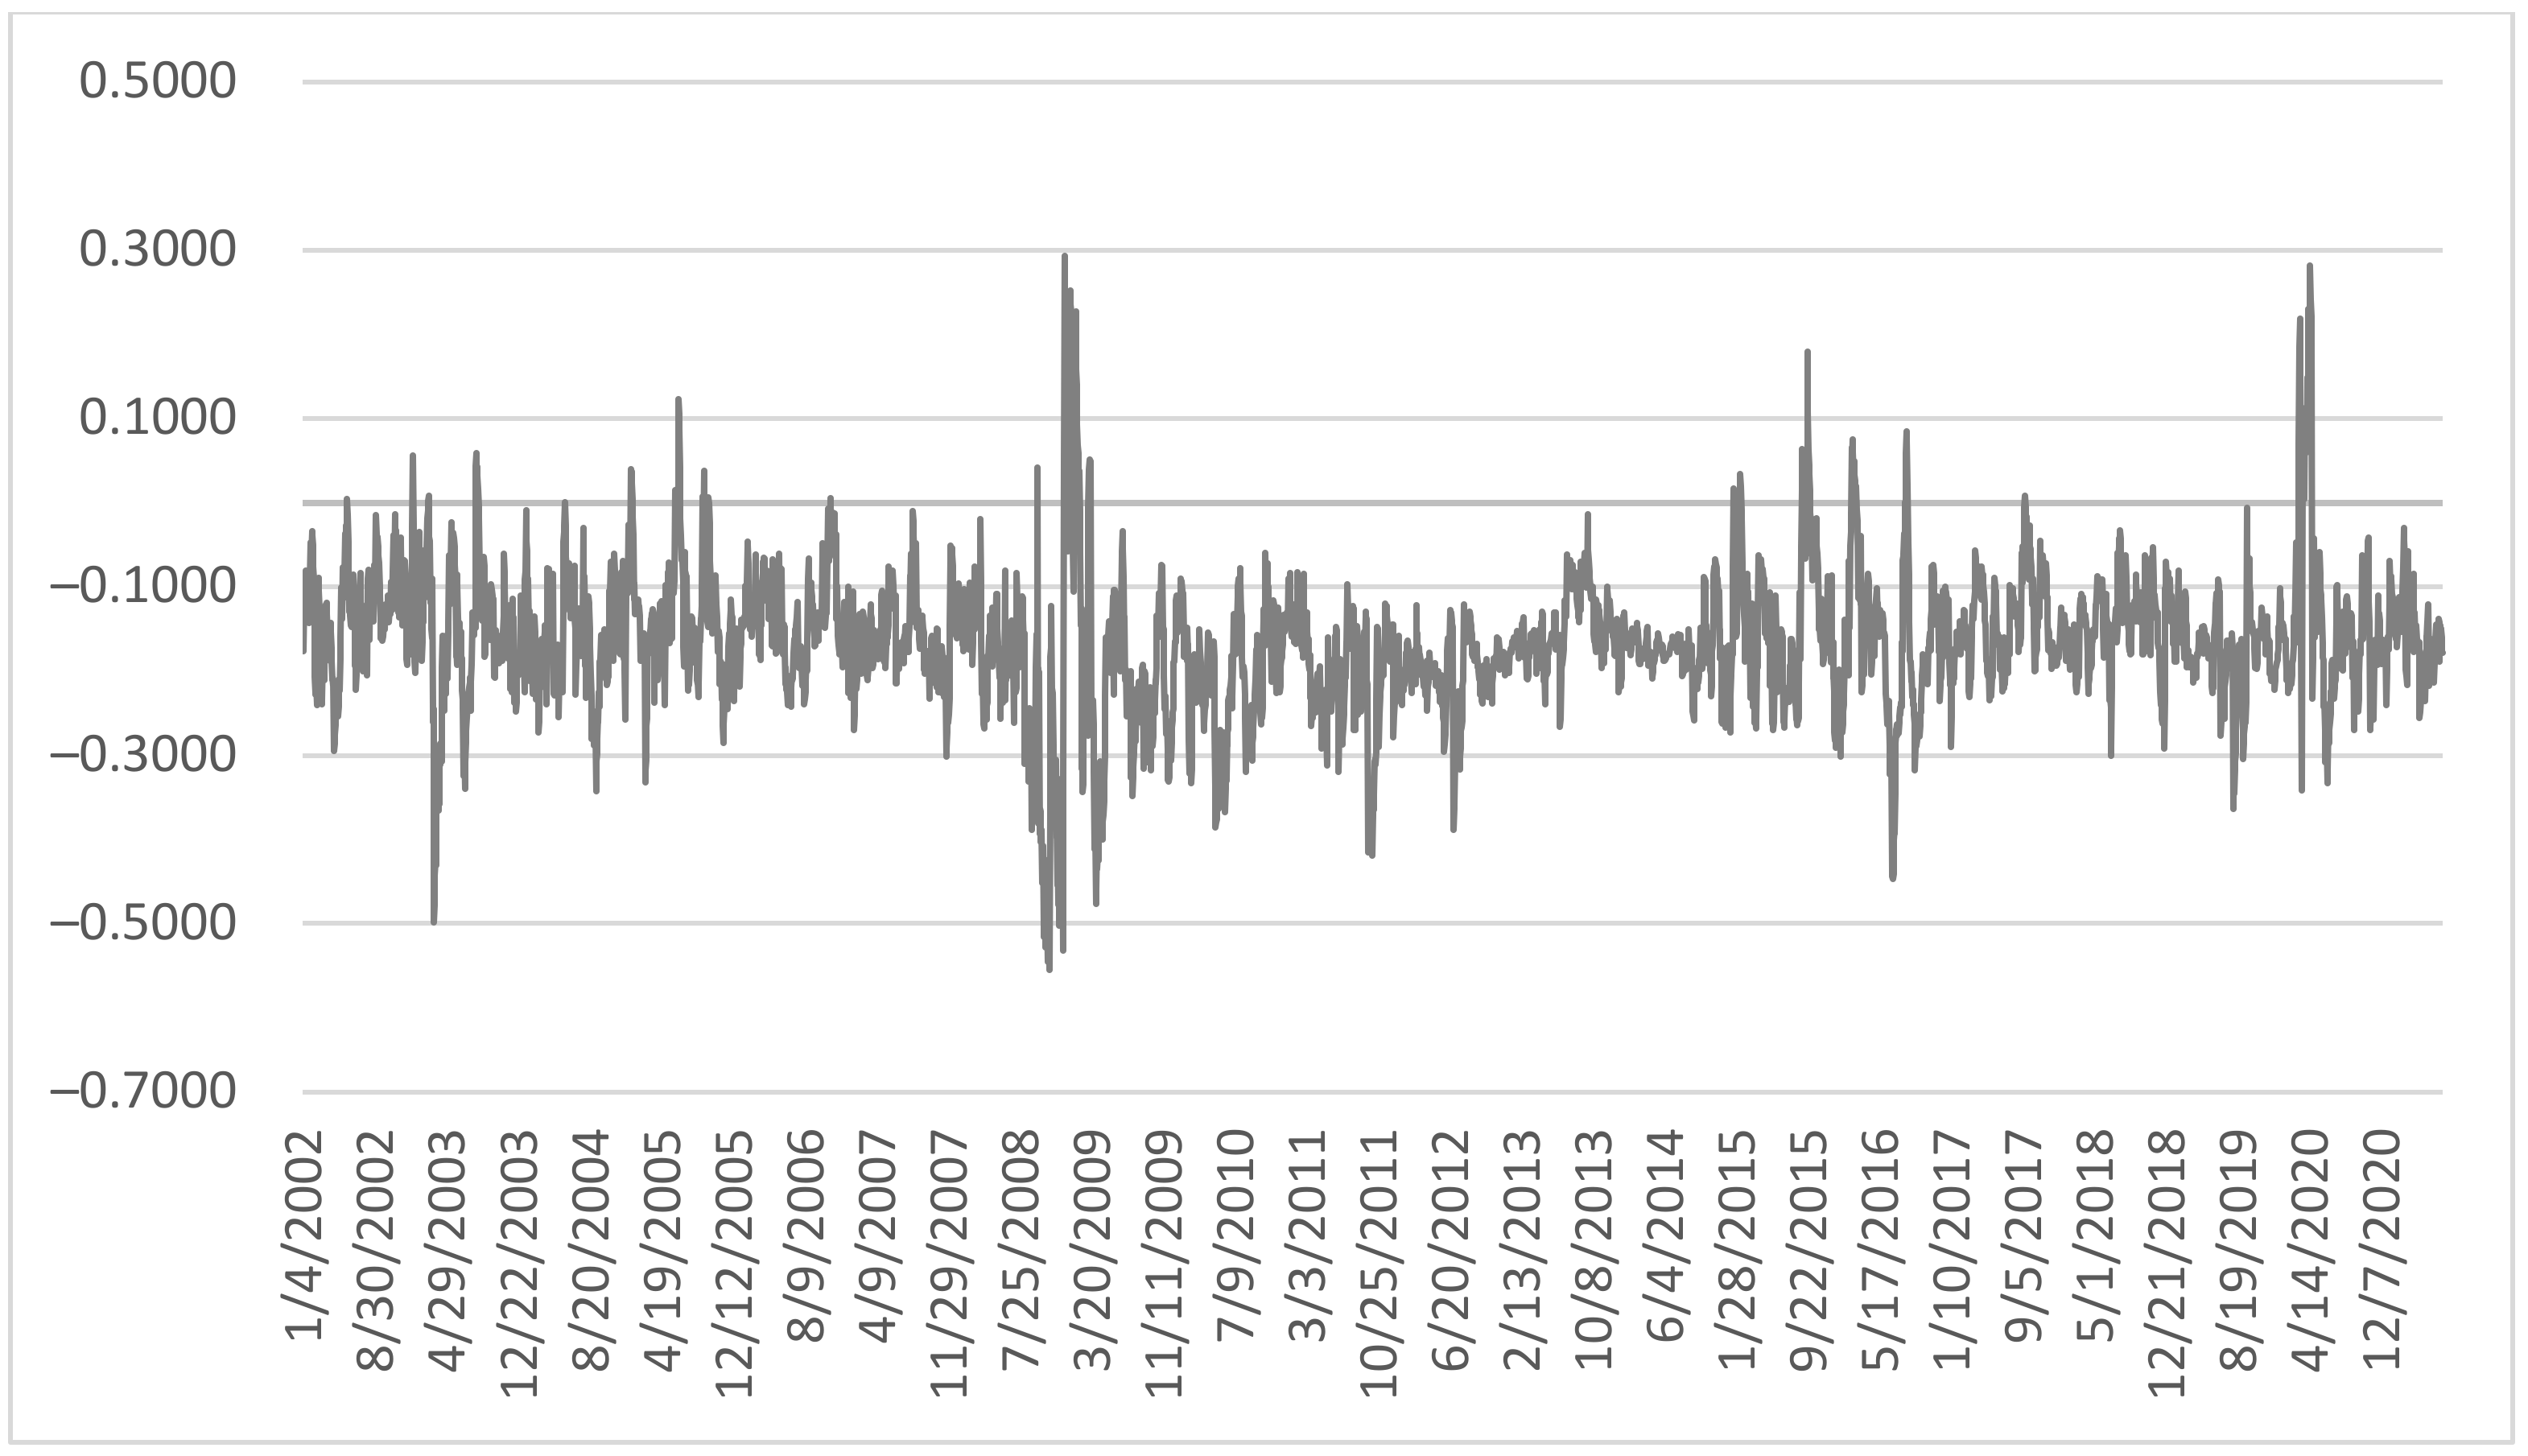
4.1. Conditional Correlation between WTIF and US Dollar
The dynamic conditional correlation fluctuates around the level of the estimate of the constant conditional correlation (−0.1815). This indicates a considerable time-varying strength of the connection between oil prices and the effective exchange rate of the US dollar.
In particular, a negative correlation between the US dollar exchange rate and crude oil prices grew stronger until mid-2010, after which it began to weaken in an irregular fashion (
Figure 1). The increased correlation before the 2008 financial crisis and immediately afterwards has been pointed to by [
3,
19,
36,
47]. During a period of a considerable decrease in the raw material prices, the considerable decline in oil prices after 2013 was due to a positive supply shock caused by the shale revolution [
48] and subdued aggregated demand, including the demand for crude oil [
49,
50,
51]. The dynamic conditional correlation of the US dollar and oil prices would usually remain above the estimate of the constant conditional correlation constant (−0.1815), although showing a decreasing tendency. However, it began to weaken since the third quarter of 2016, and it even became statistically insignificant in November 2017. In early 2018, it fell down again, becoming close to its long-term average, which was accompanied by an exceptionally strong increase in global aversion to risk. Noteworthy are also rapid increases and decreases in the strength of the correlation during the crises in 2008 and 2020.
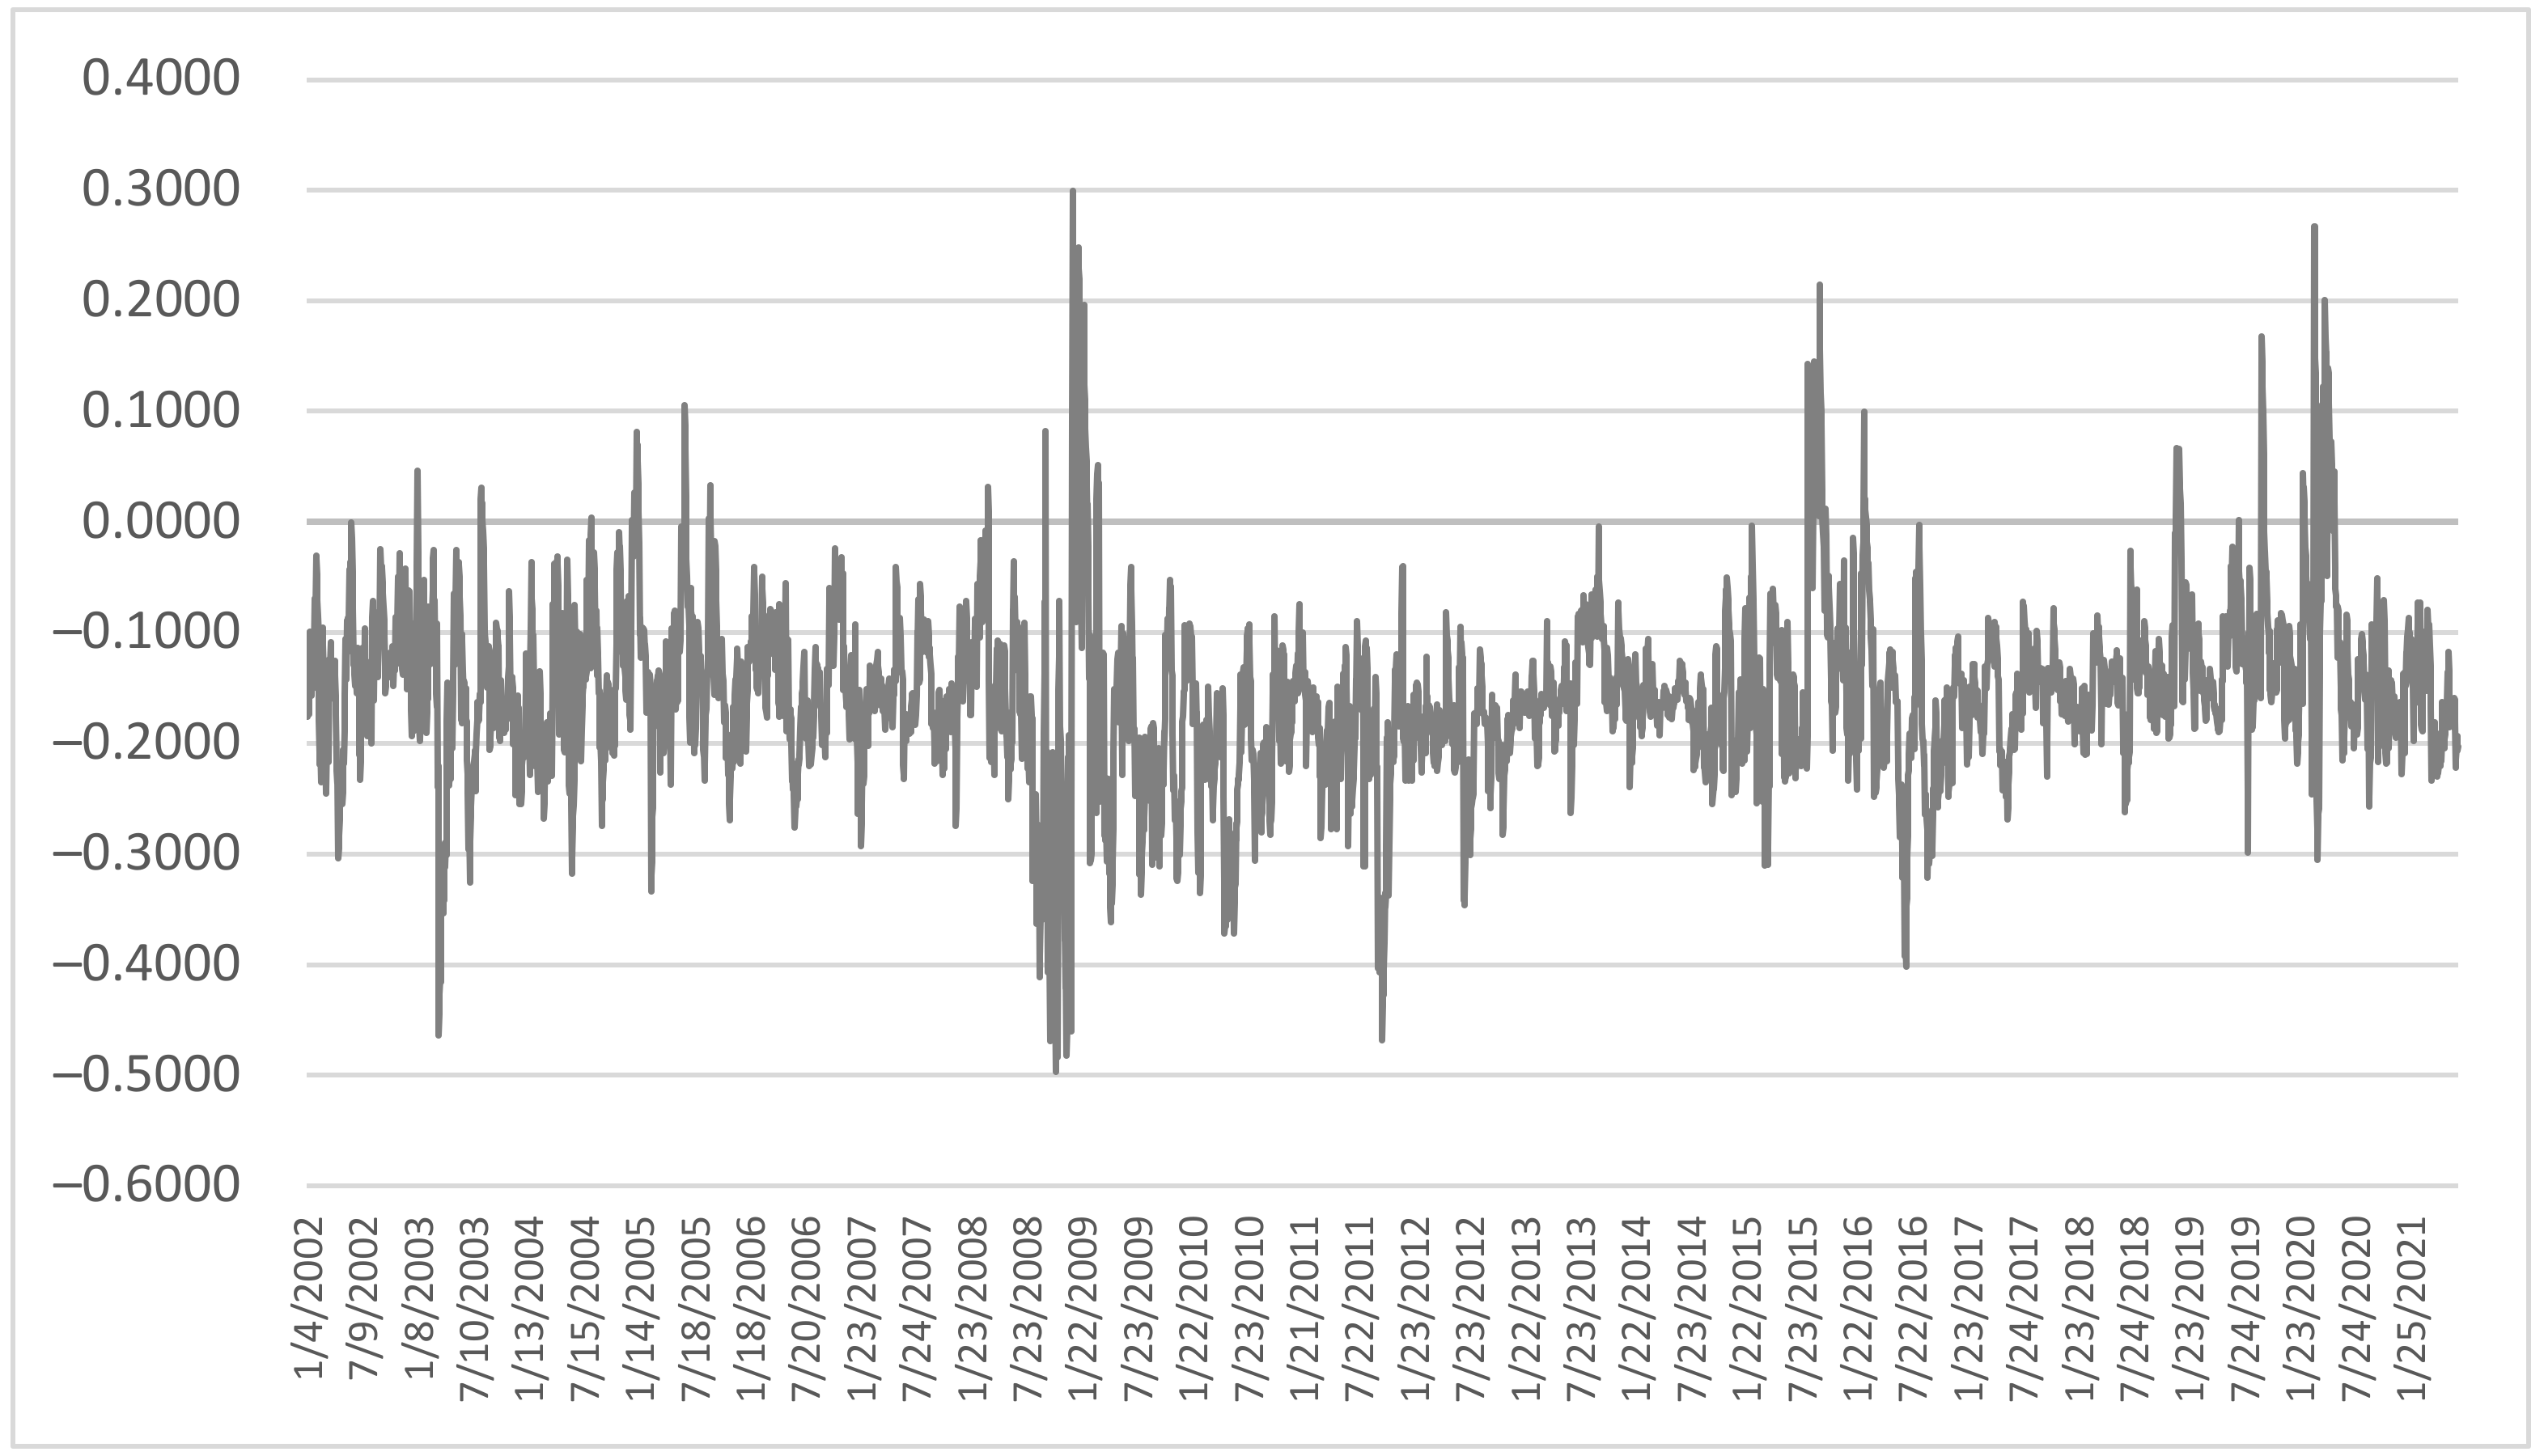
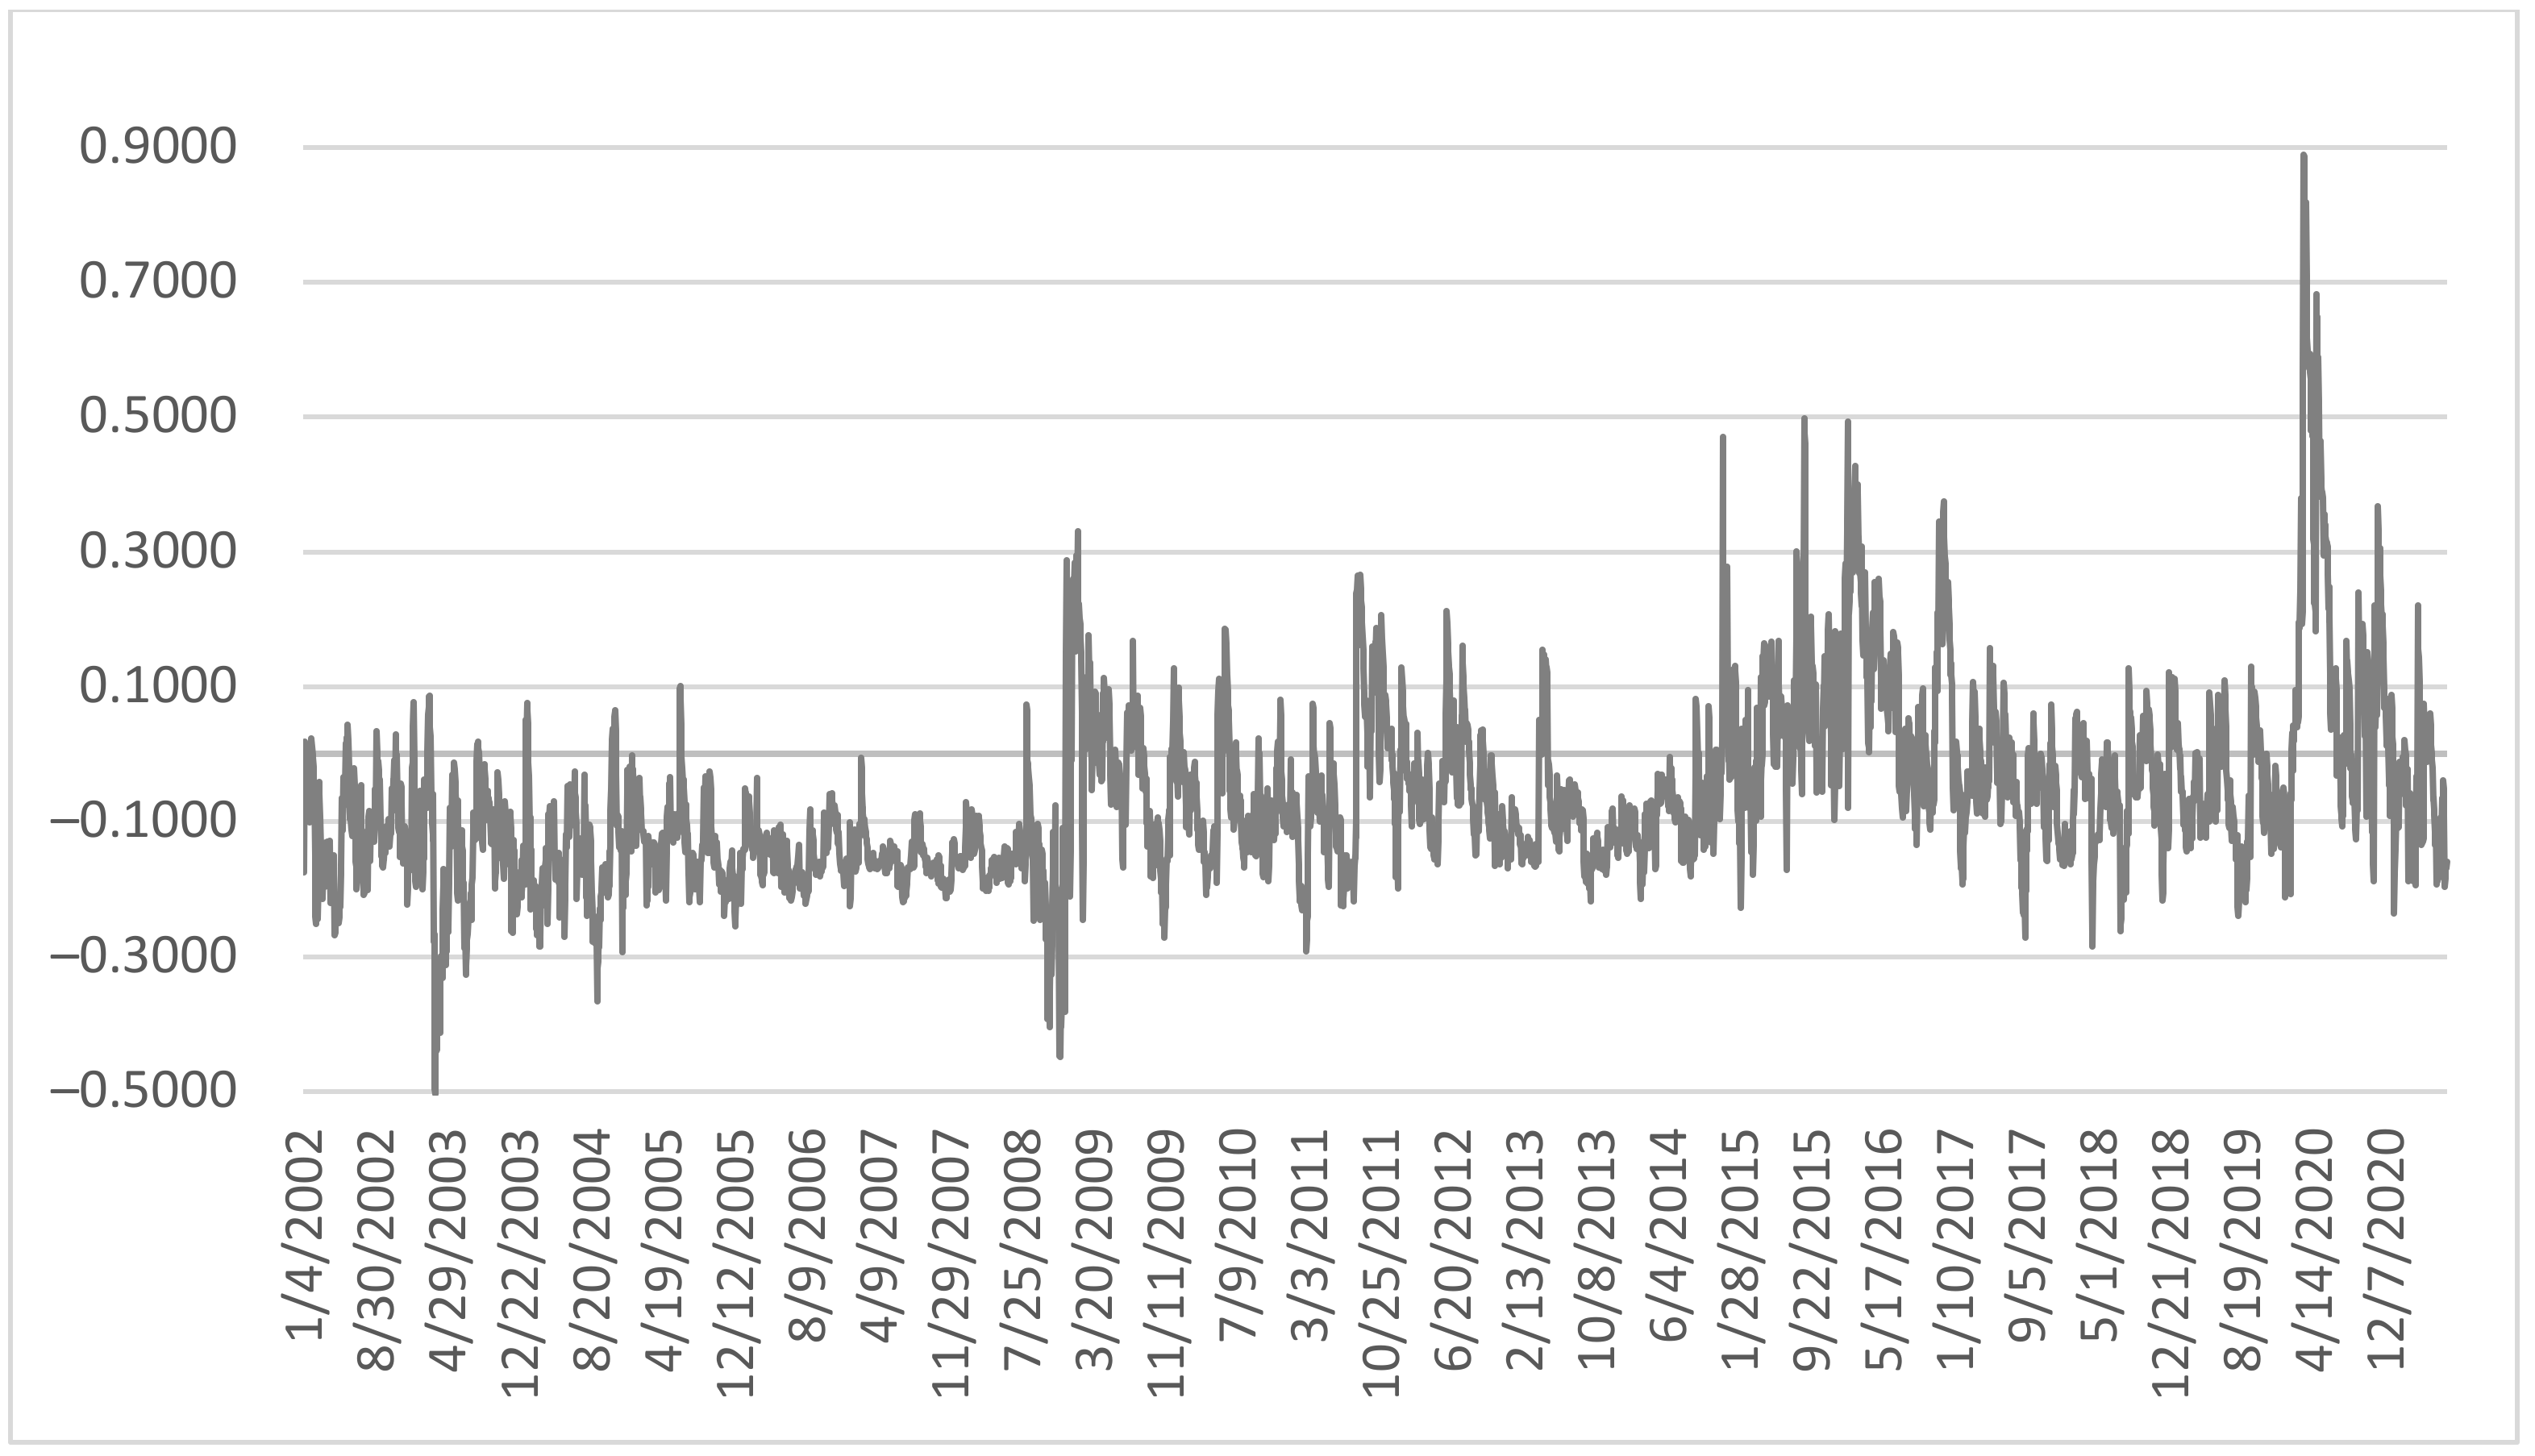
4.2. Conditional Correlation between WTIF and CNY
Concerning the CNY, the dynamic conditional correlation fluctuates in the proximity of the estimated constant conditional correlation (−0.0974). The negative correlation between the CNY exchange rate and oil prices grew stronger until 2010, after which it began to weaken irregularly (
Figure 2).
In 2016, it was possible to observe the strengthening of the correlation and then the negative correlation was slightly weakening since the end of that year until 2019. The CNY as the currency of China, a considerable oil importer, is characterized by a longer period of this correlation fluctuating during crisis periods, both in 2008 and in 2020, compared to the US dollar. Another characteristic is a more frequent tendency, over a greater range, for the CNY correlation to assume incidental positive values in response to crisis shocks.
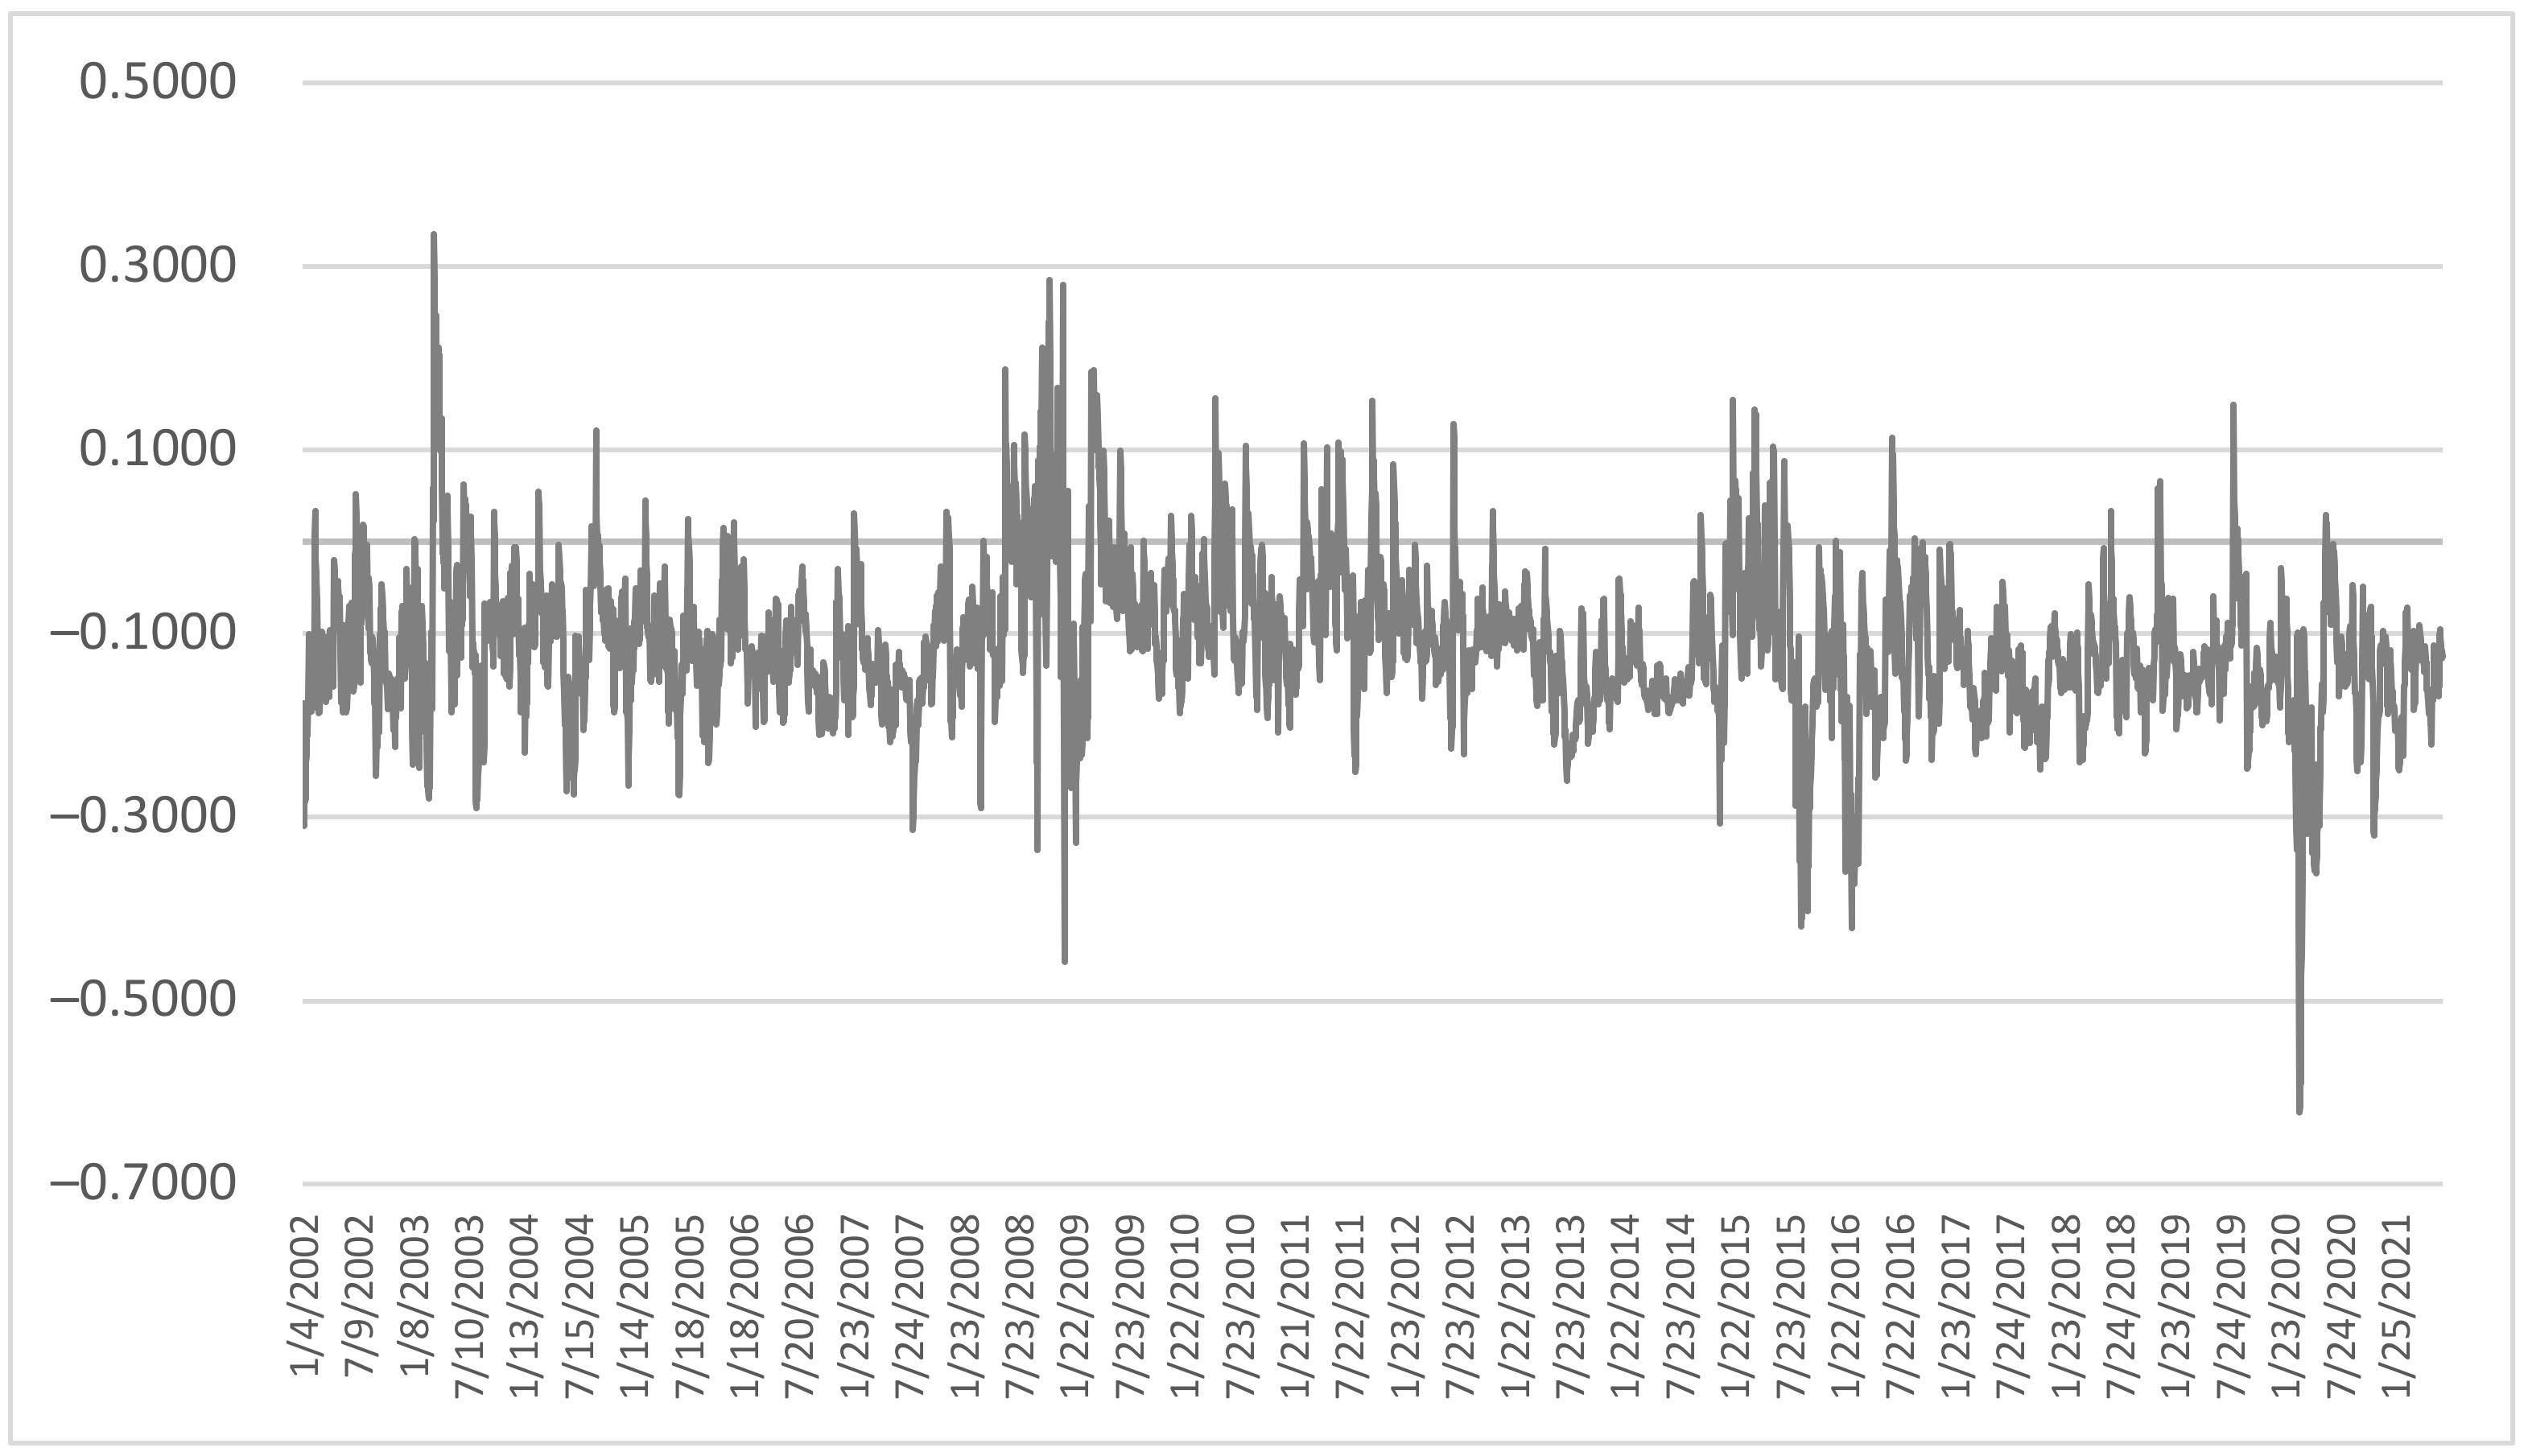
4.3. Conditional Correlation between WTIF and EUR
As for the EUR, the dynamic conditional correlation fluctuates below the level of the estimated constant conditional correlation (−0.0216). The negative correlation between the EUR exchange rate and oil prices grew stronger until 2007, after which it began to weaken irregularly (
Figure 3).
During the 2008 crisis, it initially weakened, but in a longer time, after about half a year, a slight positive correlation appeared. This was a relatively longer lasting event (6 months) compared to the USD and CNY. Rapid fluctuations of the correlation have occurred since mid-2009, but they were close to the constant conditional correlation value. From 2010 to 2014, the negative correlation gradually became stronger, but it was still relatively weak compared to the USD and CNY.
In 2016, the correlation could be seen to gain strength, but the negative correlation slightly weakened since 2019. In the context of the EUR correlation, the Euro area as a net importer of crude oil is characterized by a longer time needed to extinguish fluctuations of the correlation in periods of supply shocks in crude oil markets, in which it resembles the CNY (in 2020,
Figure 3). This is different from the characteristics of the correlation pertaining to the USD.
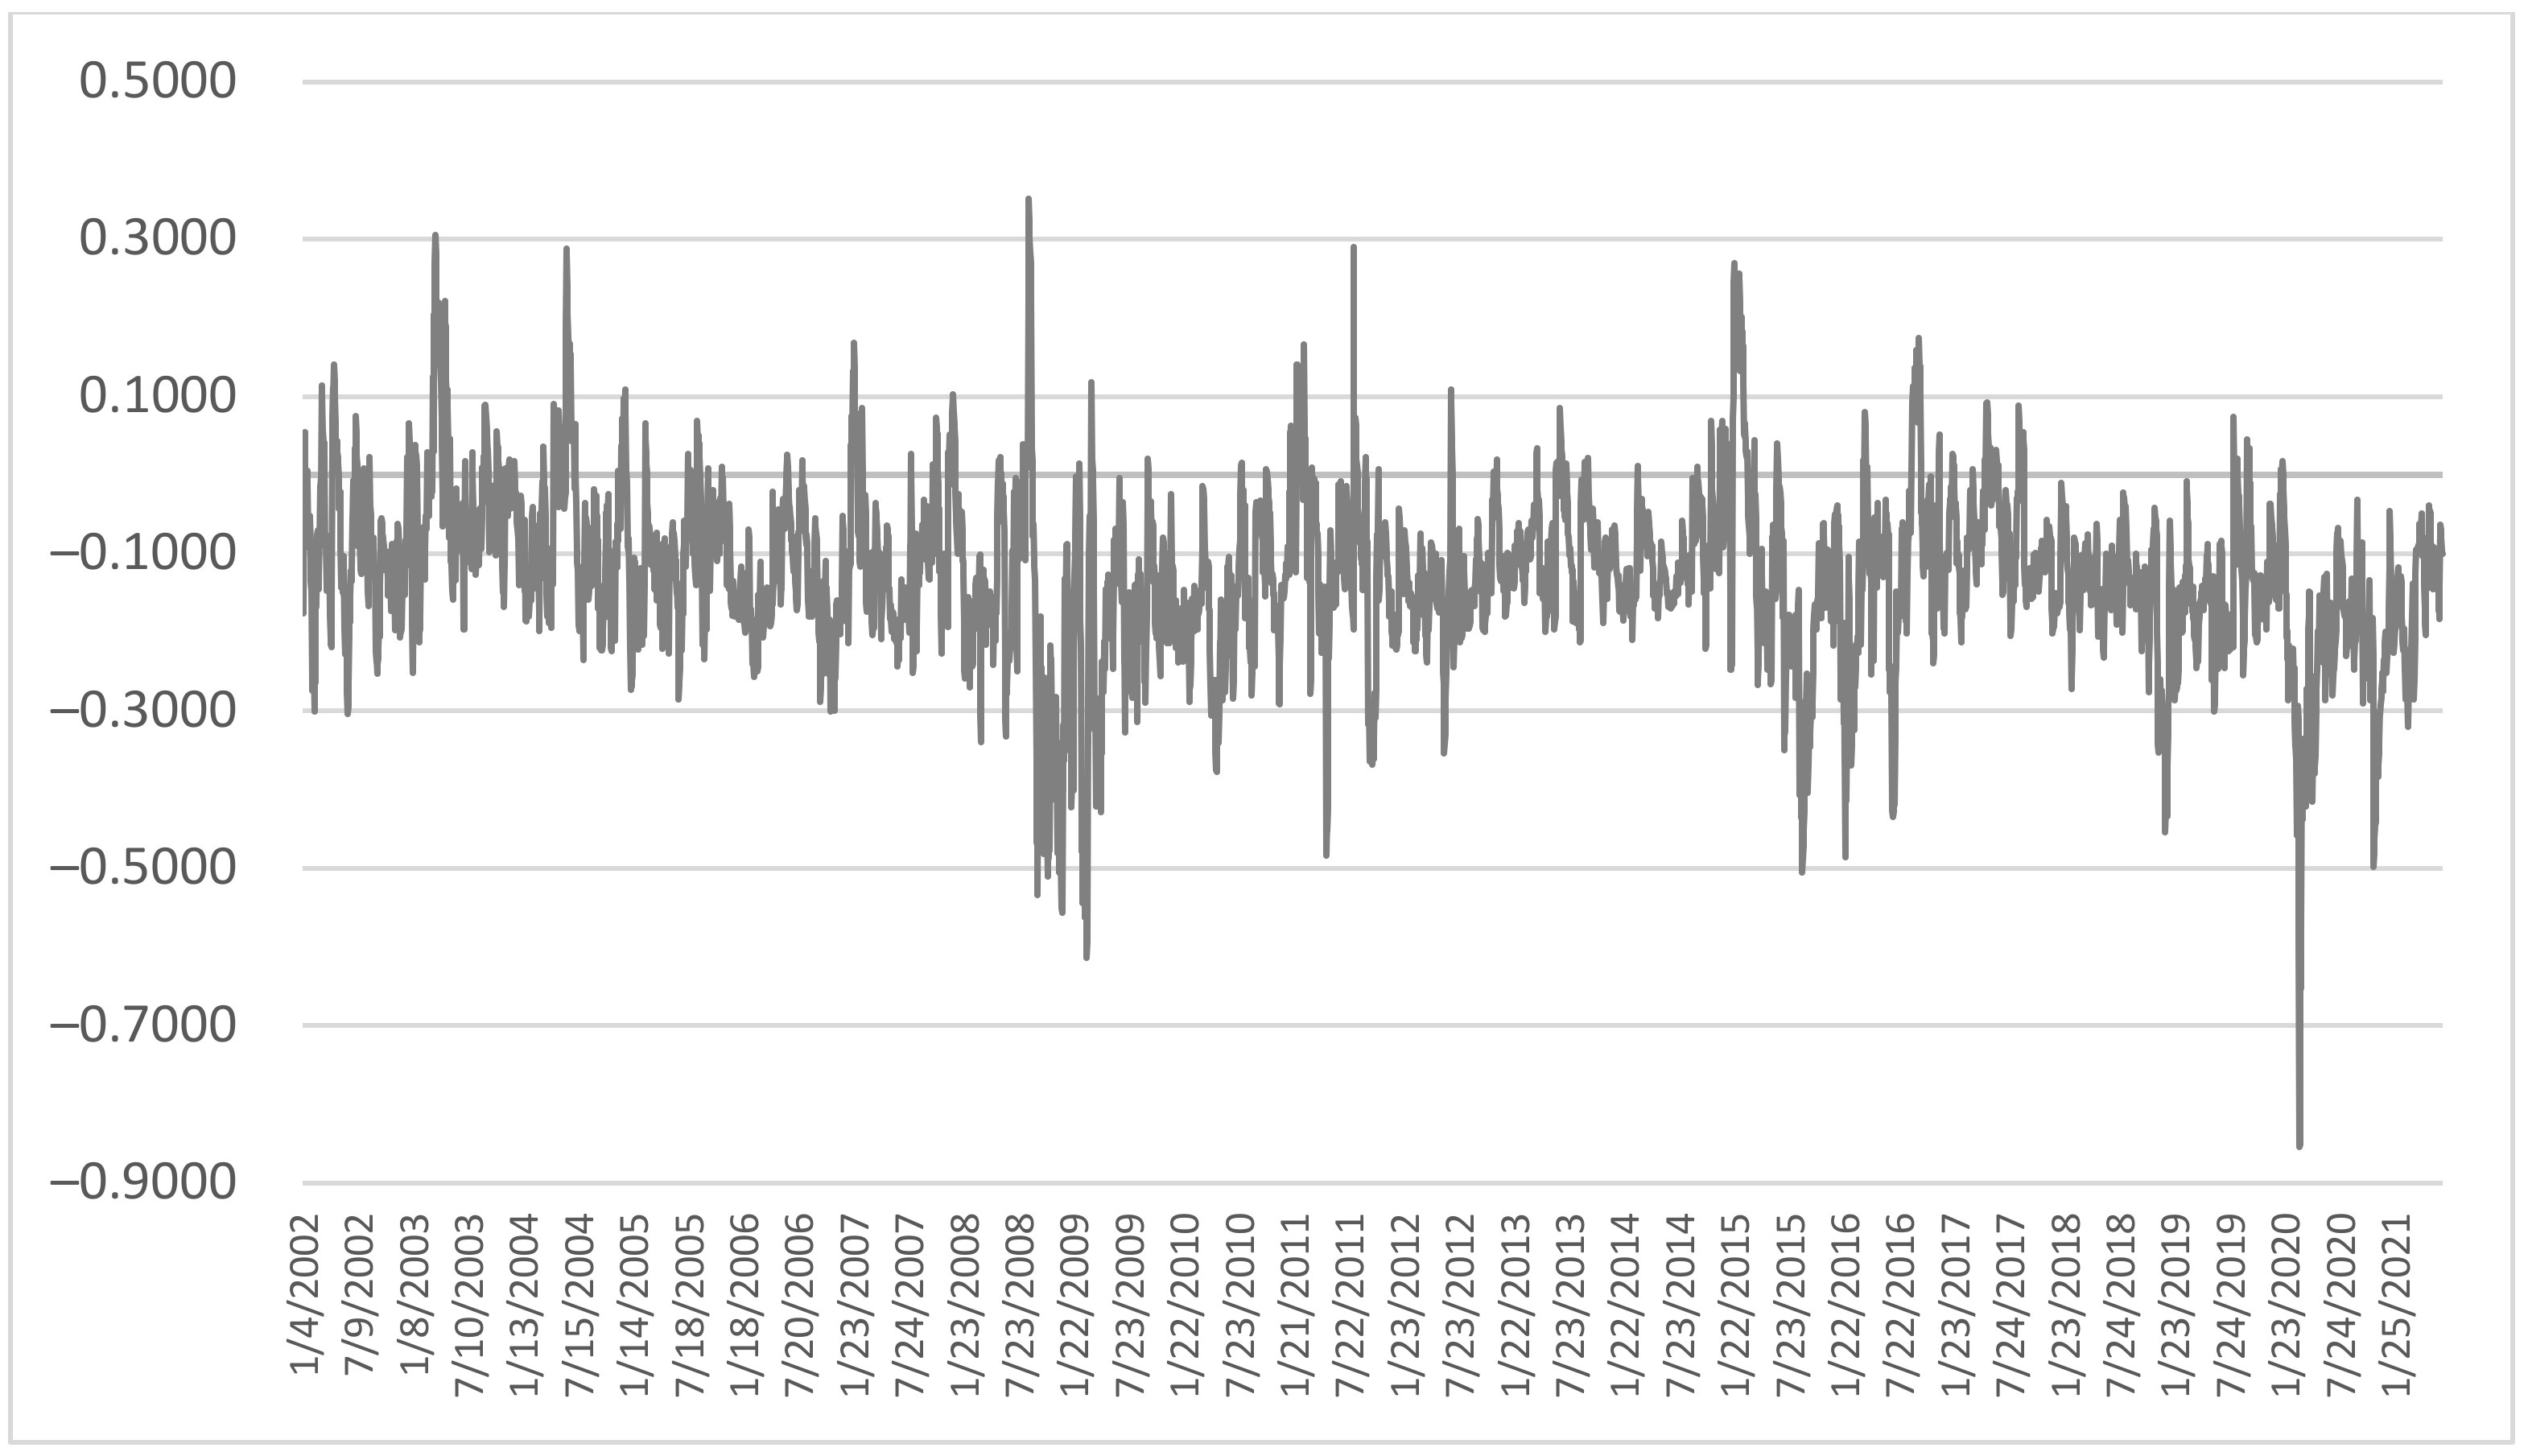
4.4. Conditional Correlation between WTIF and JPY
Regarding the JPY, the dynamic conditional correlation fluctuates around the level of the estimation of the constant conditional correlation (−0.1394). The negative correlation between the JPN exchange rate and oil prices grew stronger until 2007, after which it began to weaken irregularly (
Figure 4).
During the 2008 crisis, the correlation first weakened and then the negative correlation strengthened. This lasted relatively longer than in the case of the previously analyzed currency correlations. From 2010 to 2014, the negative correlation gradually weakened but it was still relatively weak compared to the USD and CNY, while being close to the EUR.
In 2016, some intensification of the correlation was observable, and the negative correlation was further strengthened from the end of this year until 2019. Being a net oil importer, in terms of the JPY correlation, similarly to the CNY and EUR, Japan was characterized by a longer period of extinguishing the correlation fluctuations during supply shocks in the oil market (in 2020, see
Figure 2 and
Figure 3). This diverges from characteristics of the correlations relative to the USD. What is characteristic for the JPY is the intensification of the negative correlation in response to shocks in the oil market.
Figure 5 and
Figure 6 present the situation with regard to currencies of countries exporting crude oil (Saudi Arabia and Russia).
4.5. Conditional Correlation between WTIF and SAR
With respect to the SAR, the dynamic conditional correlation fluctuates around the level of the estimated constant conditional correlation (−0.1330). The negative correlation between the SAR exchange rate and oil prices did not undergo long-lasting strengthening or weakening until 2007 (
Figure 5).
During the 2008 crisis, first the correlation grew stronger but later the negative correlation grew much weaker. This was a phenomenon that lasted relatively longer than in the case of the previously analyzed currency correlations. From 2010 to 2014, the amplitude of fluctuations of the correlation was gradually smaller. However, the correlation was consistently negative and close to that determined for the USD and CNY.
In 2016, it was possible to observe certain intensification of the correlation, and the negative correlation weakened since the end of that year. Being a net oil exporter, Saudi Arabia also has strong economic bonds with the USA. Crude oil trade is based on the US dollar, which is why the SAR is characterized by a negative correlation with oil prices, same as the USD. To a large extent, this is associated with the reverse stream of Saudi investments funded from the US dollar revenues earned from selling crude oil, which is the reason why they do not in all entirety induce the strengthening of the SAR.
4.6. Conditional Correlation between WTIF and RUB
Concerning the RUB, the dynamic conditional correlation fluctuates below the level of the estimated constant conditional correlation (0.1669). The negative correlation between the RUB exchange rate and oil prices did not undergo long-lasting strengthening or weakening until 2007 (
Figure 6).
During the 2008–2009 crisis, first, the correlation strengthened, and over a longer time it was strongly weakened. This was a phenomenon lasting relatively longer than in the case of the previously analyzed correlations of the currency exchange rates, and the RUB correlation assumed the form of a weak positive correlation. From 2010 to 2014, the correlation oscillated around small negative values. However, starting from 2015, the correlation grew stronger on the positive side, which was linked to the American shale revolution.
In the subsequent years (2016–2019), the RUB correlation was very weak on the negative side only to achieve a considerable positive level when the price war started.
Being a net oil exporter, Russia is also heavily dependent economically on oil exports. Considering all kinds of obstacles separating the Russian economy from the world commodities and financial markets (sanctions), these have an impact on the periodically positive correlation of the RUB with crude oil, especially during shocks in the oil market. Another cause is the dominance of the USD in oil trade settlements.
5. Discussion
The most probable causes of changes in the dynamic conditional correlation between the forward oil price WTI and nominal effective exchange rate of the USD can be identified through a discussion of the current results in the light of previous research findings. Some conclusions can be drawn.
Firstly, an increase (decrease) in interest rates causes statistically significant strengthening (weakening) of a negative correlation. According to [
34], the tightening (easing) of monetary policy by the FED can be accompanied by appreciation (depreciation) of the US dollar and simultaneous slowdown (acceleration) of the demand for crude oil implicating a decrease (increase) in oil prices.
Secondly, an increase in the global aversion to risk depressed the level of the correlation (leads to an increase in the negative strength of the correlation of both markets) in a statistically significant way over a time horizon of four months, with the strongest effect occurring in the second month. A significant channel here could be the perception of the US dollar as a safe investment in periods of higher volatility in financial markets. An increase (decrease) in uncertainty leads to a higher (lower) of the demand for the US dollar, which induces the appreciation (depreciation) pressure. Meanwhile, high (low) macroeconomic uncertainty can constrain (stimulate) the demand for petroleum products, thereby leading to a decrease (increase) in their prices.
The negative effect on the level of correlation between the analyzed assets is also exerted by an increase in the volatility of the effective currency exchange rate (a rise in the importance of the prudential motive) and the capital inflows to emerging countries, with a shock change in the volatility of the USD effective exchange rate having a statistically significantly stronger and longer impact. These effects can also be linked to the propensity of financial market players to take investment risks [
52,
53]. As the aversion to risk rises, the response of the currency exchange rate is more spread over time, while the response to the capital flow to emerging markets takes less time [
54]. This is consistent with conclusions from other studies, indicating that sentiment and uncertainty have a significant effect on oil prices and their fluctuations, and the strength of impact these two factors produce is greater after the outbreak of a global financial crisis [
55,
56,
57,
58]. It is worth noting that, from the perspective of the estimated model, an increase in the engagement of non-commercial investors in the oil market leads to an instant decrease in the correlation (in accordance with the assumptions made inter alia by Coudert and Mignon [
34]) but this effect becomes statistically insignificant after a month’s time. In this context, it should be concluded that the financialization of the oil market, which manifests itself in the increased inflow of investment capital from non-commercial investors (e.g., [
59,
60,
61,
62]), strengthens the connection between oil prices and the US dollar only for a short period of time. This situation also affects oil importing countries, such as China [
63], Japan, or the Euro area, which is confirmed by the research results. It should be underlined that economically strong areas, with considerable links to financial markets, remain in the sphere of a negative correlation during shocks in the oil market; although, the weakening of this correlation varies. This somehow resembles the situation concerning the US dollar. The Russian economy presents a different case as it is separated to varying degrees from global financial markets by sanctions, which—considering the country’s strong dependence on exports of commodities, including crude oil—additionally contributes to the positive correlation of the RUB relative to commodity quotations.
Based on the research, it can be noticed that an increase in crude oil inventories, including the ones in the United States, weakens the negative level of the correlations over the long-term trend in the following three months, which testifies to the fact that an excessively low level of oil inventories strengthens the correlation between oil price and the price of the US dollar, whereas its excessively high-level leads to a weaker correlation between the prices of these two assets. In a period of thriving economy, a high demand for the commodity results in a concurrent increase in oil prices and demand for the US dollar (translating into the weakening of the negative correlation). In turn, during the time of global economic slowdown, there is a rise in oil inventories alongside a decrease in oil prices and a greater willingness to invest in safe financial instruments denominated in the US dollar, thereby leading to the strengthening of the negative correlation between the two assets.
The research results also show that, in accordance with the cited theoretical literature, a smaller contribution of the trade deficit related to petroleum products in the USA’s GDP weakens the negative correlation. As the trade balance improves, the negative correlation between oil prices and the USD exchange rate weakens, and this effect is persistent and statistically significant over a twelve-month horizon.
6. Conclusions
The research objective has been to determine and evaluate the time-varying relationship between oil prices and the exchange rate of the US dollar in the context of such a relationship for the Chinese, European, Japanese, Saudi, and Russian currencies. To this end, a two-step procedure composed of the estimation of a dynamic conditional correlation model (DCC GARCH) was employed.
The results of the performed analyses confirm that the correlation between oil prices and the USD exchange rates is highly varied over time. In particular, the negative correlation between the two economic variables strengthened until the second half of 2010, after which it began to weaken in an irregular mode. During the period of a considerable decrease in oil prices due to the positive supply shock caused by the shale revolution and subdued aggregated demand, the correlation between the US dollar and prices of crude oil was above its long-term average, and in November 2017, it periodically became statistically insignificant. In early 2018, the analyzed measure of the correlation declined again, approximating its long-term average.
Looking through the lens of the structural model, it needs to be concluded that significant reasons for the weakening of the relationship between the US dollar and oil prices in the second half of 2017 were the diminishing share of a deficit in current petroleum product trade turnovers in the GDP of the United States of America, high level of oil inventories in the USA, and a low level of aversion to risk. This is a signal that reduction in the deficit in petroleum product trade, and in an extreme case evolution of the US economy to the role of a net oil exporter, can lead to the appreciation pressure on the US dollar, in line with implications derived from theoretical models. However, a rise in the global aversion to risk in February 2018, as well as the diminishing oil inventories, contributed to the strengthening of the negative correlation between oil prices and the US dollar exchange rate.
Correlations of the currencies of oil importing and exporting countries (China, Euro area, and Japan) and oil producers, such as Saudi Arabia, reflect the situation of the US dollar. This is due to the role of the USD in crude oil trade settlements, which remains important. It is accompanied by the process of considerable financialization of the crude oil market and consequent importance of the investment financial risk. In addition, the economic potential of a given country and export dominance are able to weaken the negative correlation of a given currency to crude oil quotations.
Is it therefore possible for the dependence between oil prices and US dollar exchange rates to remain permanently positive? In the perspective of the estimated model, a strong increase in oil production from unconventional deposits in the USA as well as a sustained improvement in the current balance in petroleum product trade can create appreciation pressure on the US dollar. As a result, the American currency should become similar to currencies of oil exporting countries during periods of rising oil prices. However, it needs to be mentioned that both oil prices and the US dollar exchange rates are affected by events, the inclusion of which in the estimated model is impossible, and which can only be approximated via certain instruments (an example is political risk). The results of the research presented in this paper indicate that the US dollar is perceived as a safe asset by financial market players. It should therefore be expected that oil prices and the US dollar exchange rate will probably continue to be negatively related, but the strength of this correlation will be gradually weakening over time.
The research results presented in this paper also contribute to the shaping of future economic policy. This is important from the perspective of climate challenges and energy transition. A fall in crude oil demand caused by changes in the economy structure of developed countries may lead to a downward trend in oil prices in the long term. As a consequence, it will cause a crisis in the petroleum industry, which will lead to the depreciation of the currencies of the exporting countries. Exporters with a poorly diversified economy will be in the most difficult situation. On the other hand, oil-importing countries will be less dependent on oil; hence, their currencies may appreciate. It will depend on their energy self-sufficiency and the appropriate transformation of the industry. Countries that remain oil importers will be exposed to a stronger depreciation of the currency in the long run. It will be caused by the growing economic exclusion caused by the outdated structure of the economy. Economic policy objectives should focus on coordinating the transformation of the economy with the process of reducing the importance of crude oil as an energy resource.
Our research was an attempt to assess the relationship between the most important raw material so far, which is crude oil, and the exchange rates of economically important countries. In our opinion, the assumed goal was achieved to a significant extent. However, there were also some limitations. We did not extend our methodological approach to other types of correlation, including cross-correlation. Moreover, the problem of the causality requires further development.
The results of our research suggest the lack of a stable relationships between prices of crude oil and currency exchange rates. It is also impossible to observe a long-term, unequivocal tendency of the currencies of oil exporting countries being positively correlated with oil prices. Russia was the closest to this situation. In Saudi Arabia, a positive correlation emerged during moments of a crisis. The US dollar has a unique status by being settlement currency. However, considering the process of the USA transforming from an oil importer to oil exporter, this is not reflected in a change in the dollar to oil correlation from a negative to a positive one. This finding attests to some deeper reasons shaping the above correlation, which are of a structural nature.
Consequently, future studies on the sustainability of a correlation between crude oil and currencies should encompass the identification of causes as well as their type and power of impact on how the said relationship is shaped. This particularly applies to issues connected with monetary policy, aversion to risk in financial markets, capital transfers to emerging markets, or crude oil stocks, as mentioned in the discussion. In our opinion, future investigations should focus on the following three areas:
The influence of inflation and public debt cost (yields on government bonds) on the level of correlations between currencies and oil;
The impact of investment capital transfers from developed to emerging markets and of the associated risk on the level of correlations between currencies and oil;
The effect of structural parameters of economies of oil exporting and importing countries on the above correlation, including: the net demand for this raw material, level of strategic stocks, or the scale of industry diversification.
The above directions in research should allow us to determine the dynamic hierarchy of causes shaping the relationship between oil and currencies. This will contribute to better management of crisis situations in the oil and currency markets.


