
R&D Spending in the Energy Sector and Achieving the Goal of Climate Neutrality


Abstract
:1. Introduction
- Less and more efficient use of fossil resources as an energy source [18];
- The emergence of new, competitive energy sources [19];
- The development of energy storage technologies as an essential element in combating energy poverty, facilitating both clean energy production and access to electricity in less developed regions [22].
- Was the R&D spending environmentally performant?
- How did the environmental performance change over time?
- Are there significant differences between countries regarding the environmental performance of R&D spending?
- How do the studied EU countries differ in terms of environmental performance?
2. Documents and Literature Review
2.1. Document Review
- Building interconnected energy systems and better-integrated networks that support renewable energy sources;
- Promoting innovative technologies and modern infrastructure;
- Increasing energy efficiency and promoting eco-design;
- Decarbonization in the gas sector and promoting smart integration of all sectors;
- Empowering consumers and helping EU countries combat energy poverty;
- Promoting EU energy standards and technologies on the world stage;
- Using the full potential of Europe’s offshore wind energy.
- The Ambient Air Quality (AAQ) Directive 2008/50/EC [47]—it defines the air quality standards in the form of limits/target values for exposure to air pollutants. It provides the member states with air quality monitoring and assessment, helping to maintain good air quality and improving it where it is not, and ensuring that air quality information is made public;
- The National Emission Ceilings (NEC) Directive 2016/2284/EU [48]—it defines the national obligations of the member states and the EU to reduce emissions of five significant air pollutants to reduce the health and environmental impact attributable to cross-border pollution;
- Directive 2010/75/EU on Industrial Emissions (IED) [49]—it aims to achieve a high level of protection of human health and the environment as a whole by reducing harmful industrial emissions throughout the EU, in particular, by better application of the best available techniques (BAT).
- Directive 2015/2193/EU on the limitation of emissions of certain pollutants into the air from Medium Combustion Plants (MCP Directive)—it lays down rules for the control of emissions of sulfur dioxide (SO2), nitrogen oxides (NOx), and dust into the air from medium energy combustion plants, thus reducing emissions to the air and the potential risks to human health and the environment that result from such emissions. It also defines the principles of monitoring carbon monoxide (CO2) emissions [50].
2.2. Literature Review
- The relationship between implementing the SDGs and progress in the field of RES development [87];
- Evaluating research and development projects in terms of increasing energy efficiency in Taiwan using the DEA method [88];
- Evaluating the effectiveness of investments in wind energy, photovoltaics, and fuel cells in Korea using the DEA method [89];
- Evaluating the effectiveness of R&D activities of 38 new energy companies in China [90];
- Assessing energy efficiency and CO2 emissions in 29 Chinese provinces using the DEA method [91];
- Assessing the effectiveness of CO2 reduction as a result of replacing fossil fuels with renewable energy and developing energy storage technologies in 12 European countries [92];
- The relationship between energy efficiency, energy structure, urbanization, R&D, and energy consumption in 30 provinces of China using the DEA method [93];
- Estimating the environmental performance of energy innovations in the least developed and developing regions using the DEA method [94];
- Different potential for the development of green energy in the countries of Central and Eastern Europe, including the amount of expenditure allocated to the development of the ICT sector, which supports the integration of energy systems based on RES, with other ones [95].
3. Materials and Methods
- Group I—(—very high SMI level
- Group II—(—high SMI level
- Group III—(—average SMI level
- Group IV—(—low SMI level
- is the arithmetic mean of a synthetic measures index
- is the standard deviation of a synthetic measure index .
4. Results
5. Conclusions
- -
- Energy efficiency R&D expenditures should be increased, especially in AT, BE, FI, IE, IT, PL, ES, SK, NL, as their performance in this respect was unsatisfactory;
- -
- Renewable energy R&D spending should be increased in all EU countries. At the same time, the financial efforts of FI, EE, and SE, that have achieved the climate/energy targets of the Europe 2020 Strategy, do not have to be as high as in countries that have not achieved them;
- -
- Expenditures on hydro and fuel cell technologies R&D should be increased by all countries (except DK, FR), if they have appropriate conditions for this.
Author Contributions
Funding
Institutional Review Board Statement
Informed Consent Statement
Data Availability Statement
Conflicts of Interest
Appendix A. Descriptive Statistics

| Min. | Max. | Mean | Std. Deviation | |
|---|---|---|---|---|
| 2011 | ||||
| Energy efficiency R&D (million USD and PPP) | 0.00 | 343.83 | 115.79 | 96.43 |
| Fossil fuels R&D (million USD and PPP) | 0.00 | 162.39 | 36.41 | 54.22 |
| Renewable energy R&D (million USD and PPP) | 10.66 | 378.37 | 104.62 | 100.28 |
| Nuclear energy R&D (million USD and PPP) | 0.00 | 897.71 | 101.76 | 222.44 |
| Hydrogen and fuel cells. R&D (million USD and PPP) | 0.00 | 73.42 | 16.02 | 20.95 |
| Other power and storage R&D (million USD and PPP) | 0.00 | 155.29 | 36.34 | 39.64 |
| CO2—2013 (tons) | 21,848.04 | 941,570.30 | 245,307.80 | 254,170.10 |
| 2012 | ||||
| Energy efficiency R&D (million USD and PPP) | 1.22 | 292.84 | 109.23 | 83.64 |
| Fossil fuels R&D (million USD and PPP) | 0.10 | 153.46 | 31.00 | 45.49 |
| Renewable energy R&D (million USD and PPP) | 0.36 | 365.82 | 91.94 | 94.84 |
| Nuclear energy R&D (million USD and PPP) | 0.40 | 1010.11 | 114.14 | 245.49 |
| Hydrogen and fuel cells. R&D (million USD and PPP) | 0.00 | 51.26 | 12.00 | 14.81 |
| Other power and storage R&D (million USD and PPP) | 0.00 | 160.57 | 32.34 | 36.22 |
| CO2—2014 (tons) | 210,56.80 | 902,388.70 | 234,659.20 | 242,053.80 |
| 2013 | ||||
| Energy efficiency R&D (million USD and PPP) | 0.09 | 273.99 | 88.61 | 82.29 |
| Fossils fuels R&D (million USD and PPP) | 0.00 | 168.36 | 35.99 | 54.94 |
| Renewable energy R&D (million USD and PPP) | 1.47 | 384.09 | 95.34 | 99.50 |
| Nuclear energy R&D (million USD and PPP) | 0.33 | 1003.45 | 114.18 | 245.08 |
| Hydrogen and fuel cells. R&D (million USD and PPP) | 0.00 | 52.50 | 12.14 | 16.28 |
| Other power and storage R&D (million USD and PPP) | 0.00 | 130.46 | 34.79 | 34.98 |
| CO2—2015 (tons) | 18,109.74 | 906,320.10 | 236,495.20 | 242,562.70 |
| 2014 | ||||
| Energy efficiency R&D (million USD and PPP) | 3.23 | 283.78 | 85.35 | 77.78 |
| Fossil fuels R&D (million USD and PPP) | 0.00 | 149.50 | 34.54 | 52.54 |
| Renewable energy R&D (million USD and PPP) | 1.96 | 370.89 | 89.11 | 94.79 |
| Nuclear energy R&D (million USD and PPP) | 0.00 | 917.16 | 101.62 | 225.07 |
| Hydrogen and fuel cells. R&D (million USD and PPP) | 0.00 | 53.80 | 11.70 | 15.13 |
| Other power and storage R&D (million USD and PPP) | 0.05 | 253.12 | 45.00 | 59.70 |
| CO2—2016 (tons) | 19,640.42 | 909,052.50 | 235,300.00 | 240,841.00 |
| 2015 | ||||
| Energy efficiency R&D (million USD and PPP) | 1.15 | 286.37 | 79.69 | 83.14 |
| Fossil fuels R&D (million USD and PPP) | 0.00 | 134.95 | 30.14 | 42.23 |
| Renewable energy R&D (million USD and PPP) | 2.44 | 380.68 | 88.82 | 99.23 |
| Nuclear energy R&D (million USD and PPP) | 0.00 | 886.66 | 107.26 | 219.77 |
| Hydrogen and fuel cells. R&D (million USD and PPP) | 0.00 | 44.00 | 9.91 | 13.24 |
| Other power and storage R&D (million USD and PPP) | 0.90 | 154.62 | 43.16 | 41.55 |
| CO2—2017 (tons) | 209,23.49 | 894,296.30 | 235,391.90 | 238,567.20 |
| 2016 | ||||
| Energy efficiency R&D (million USD and PPP) | 1.95 | 261.05 | 78.96 | 74.88 |
| Fossil fuels R&D (million USD and PPP) | 0.00 | 131.94 | 24.57 | 37.18 |
| Renewable energy R&D (million USD and PPP) | 6.47 | 348.40 | 83.78 | 91.71 |
| Nuclear energy R&D (million USD and PPP) | 0.00 | 809.45 | 101.21 | 201.51 |
| Hydrogen and fuel cells. R&D (million USD and PPP) | 0.00 | 41.46 | 7.76 | 11.27 |
| Other power and storage R&D (million USD and PPP) | 1.95 | 156.12 | 37.42 | 39.42 |
| CO2—2018 (tons) | 19,974.14 | 858,368.70 | 230,101.40 | 230,492.20 |
| 2017 | ||||
| Energy efficiency R&D (million USD and PPP) | 2.22 | 314.82 | 94.81 | 90.86 |
| Fossil fuels R&D (million USD and PPP) | 0.00 | 133.30 | 22.82 | 36.27 |
| Renewable energy R&D (million USD and PPP) | 0.70 | 414.37 | 78.21 | 101.25 |
| Nuclear energy R&D (million USD and PPP) | 0.00 | 871.37 | 107.09 | 217.06 |
| Hydrogen and fuel cells R&D (million USD and PPP) | 0.00 | 41.92 | 8.45 | 11.87 |
| Other power and storage R&D (million USD and PPP) | 0.23 | 191.06 | 38.85 | 49.25 |
| CO2—2019 (tons) | 146,99.12 | 809,798.50 | 220,928.30 | 219,724.60 |
Appendix B
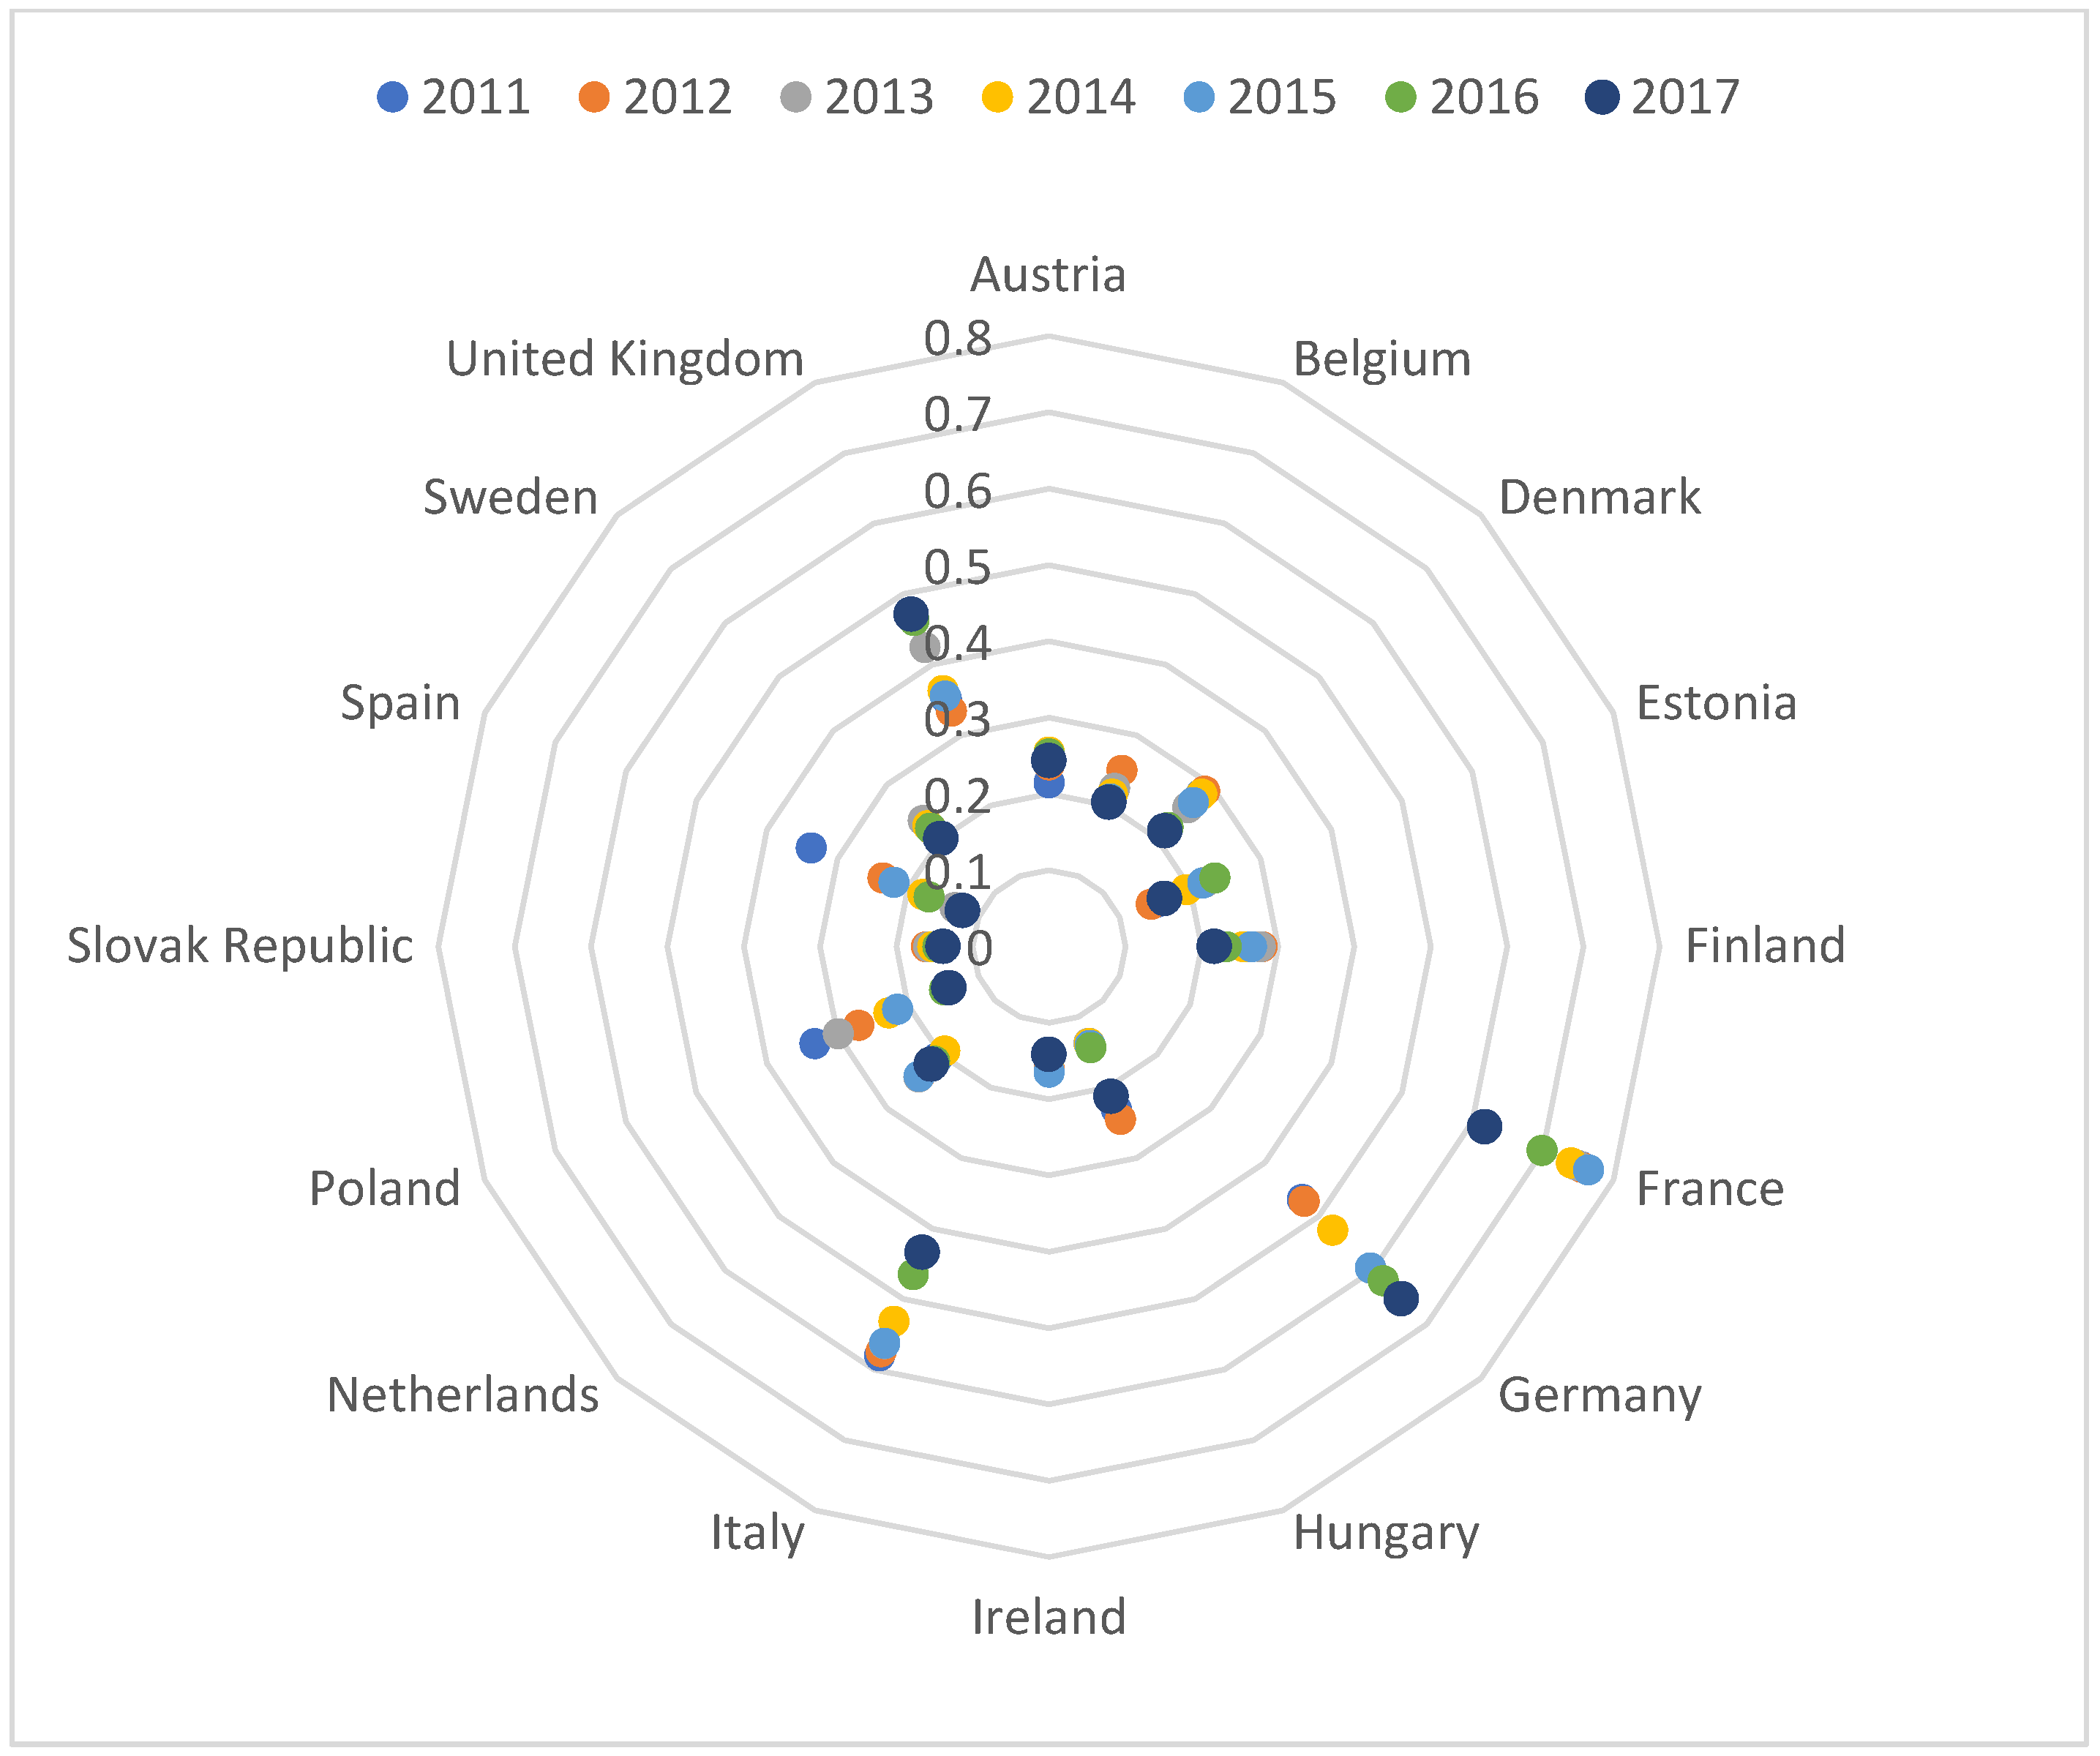
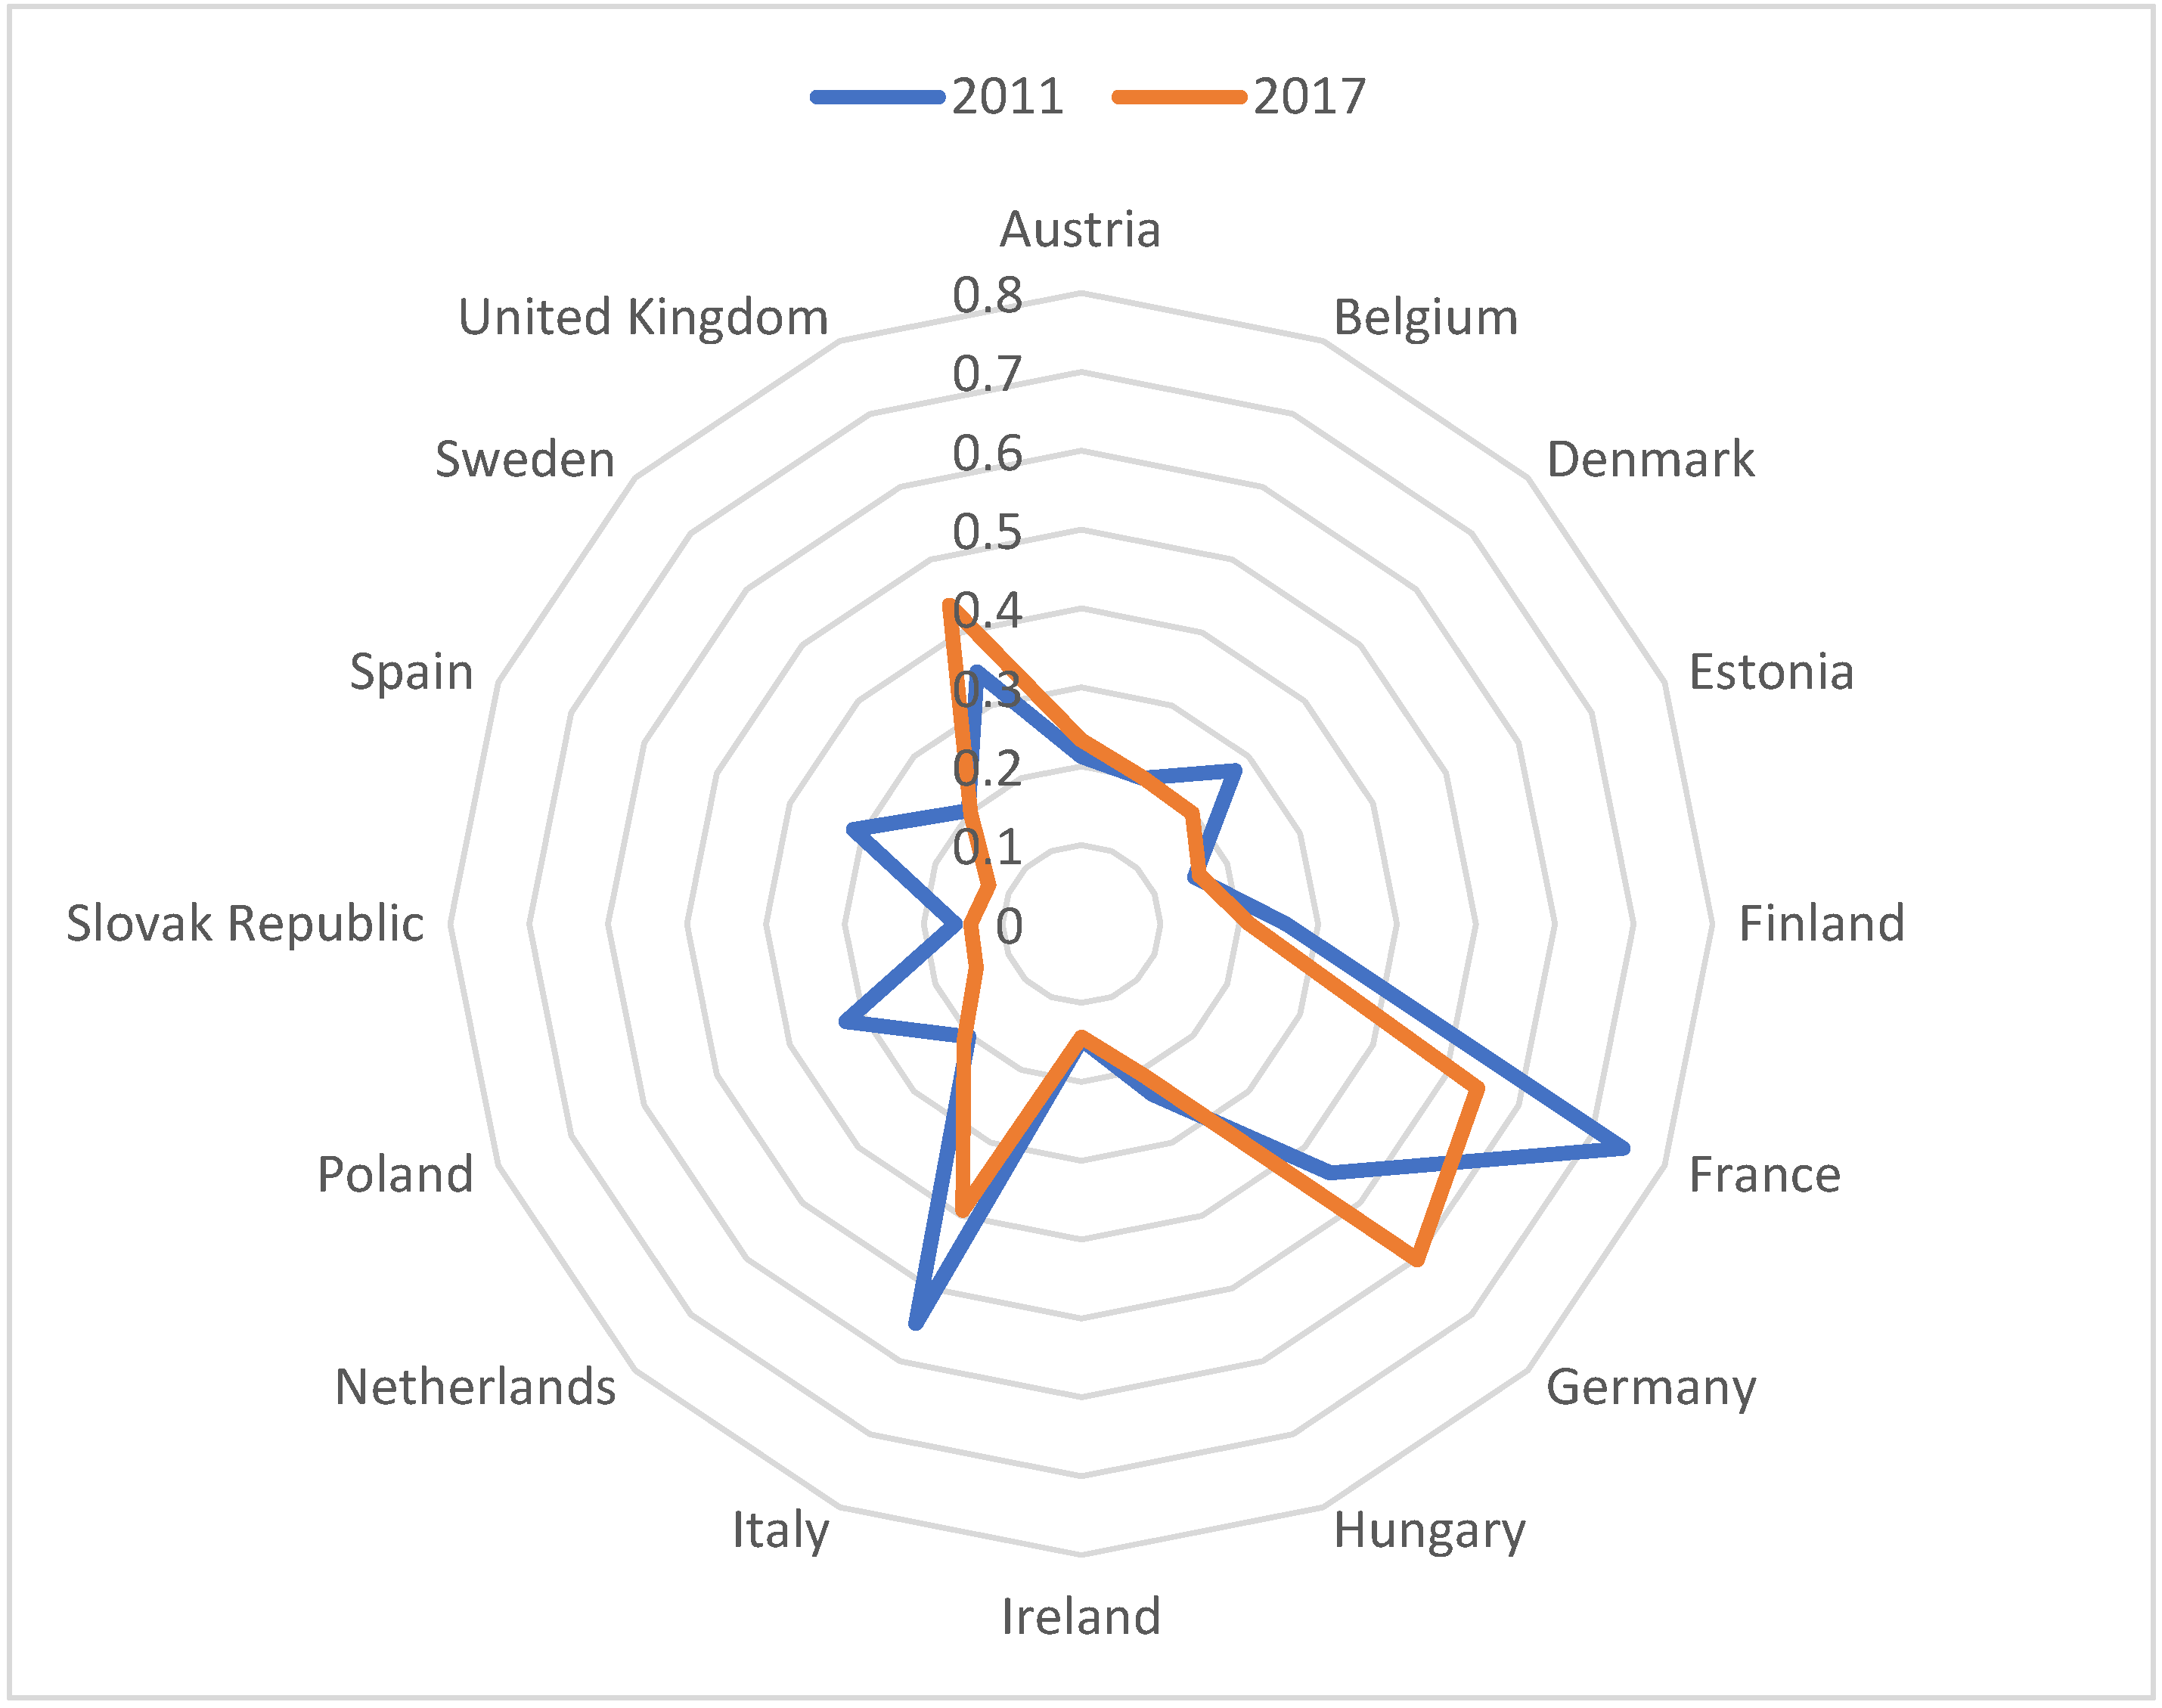
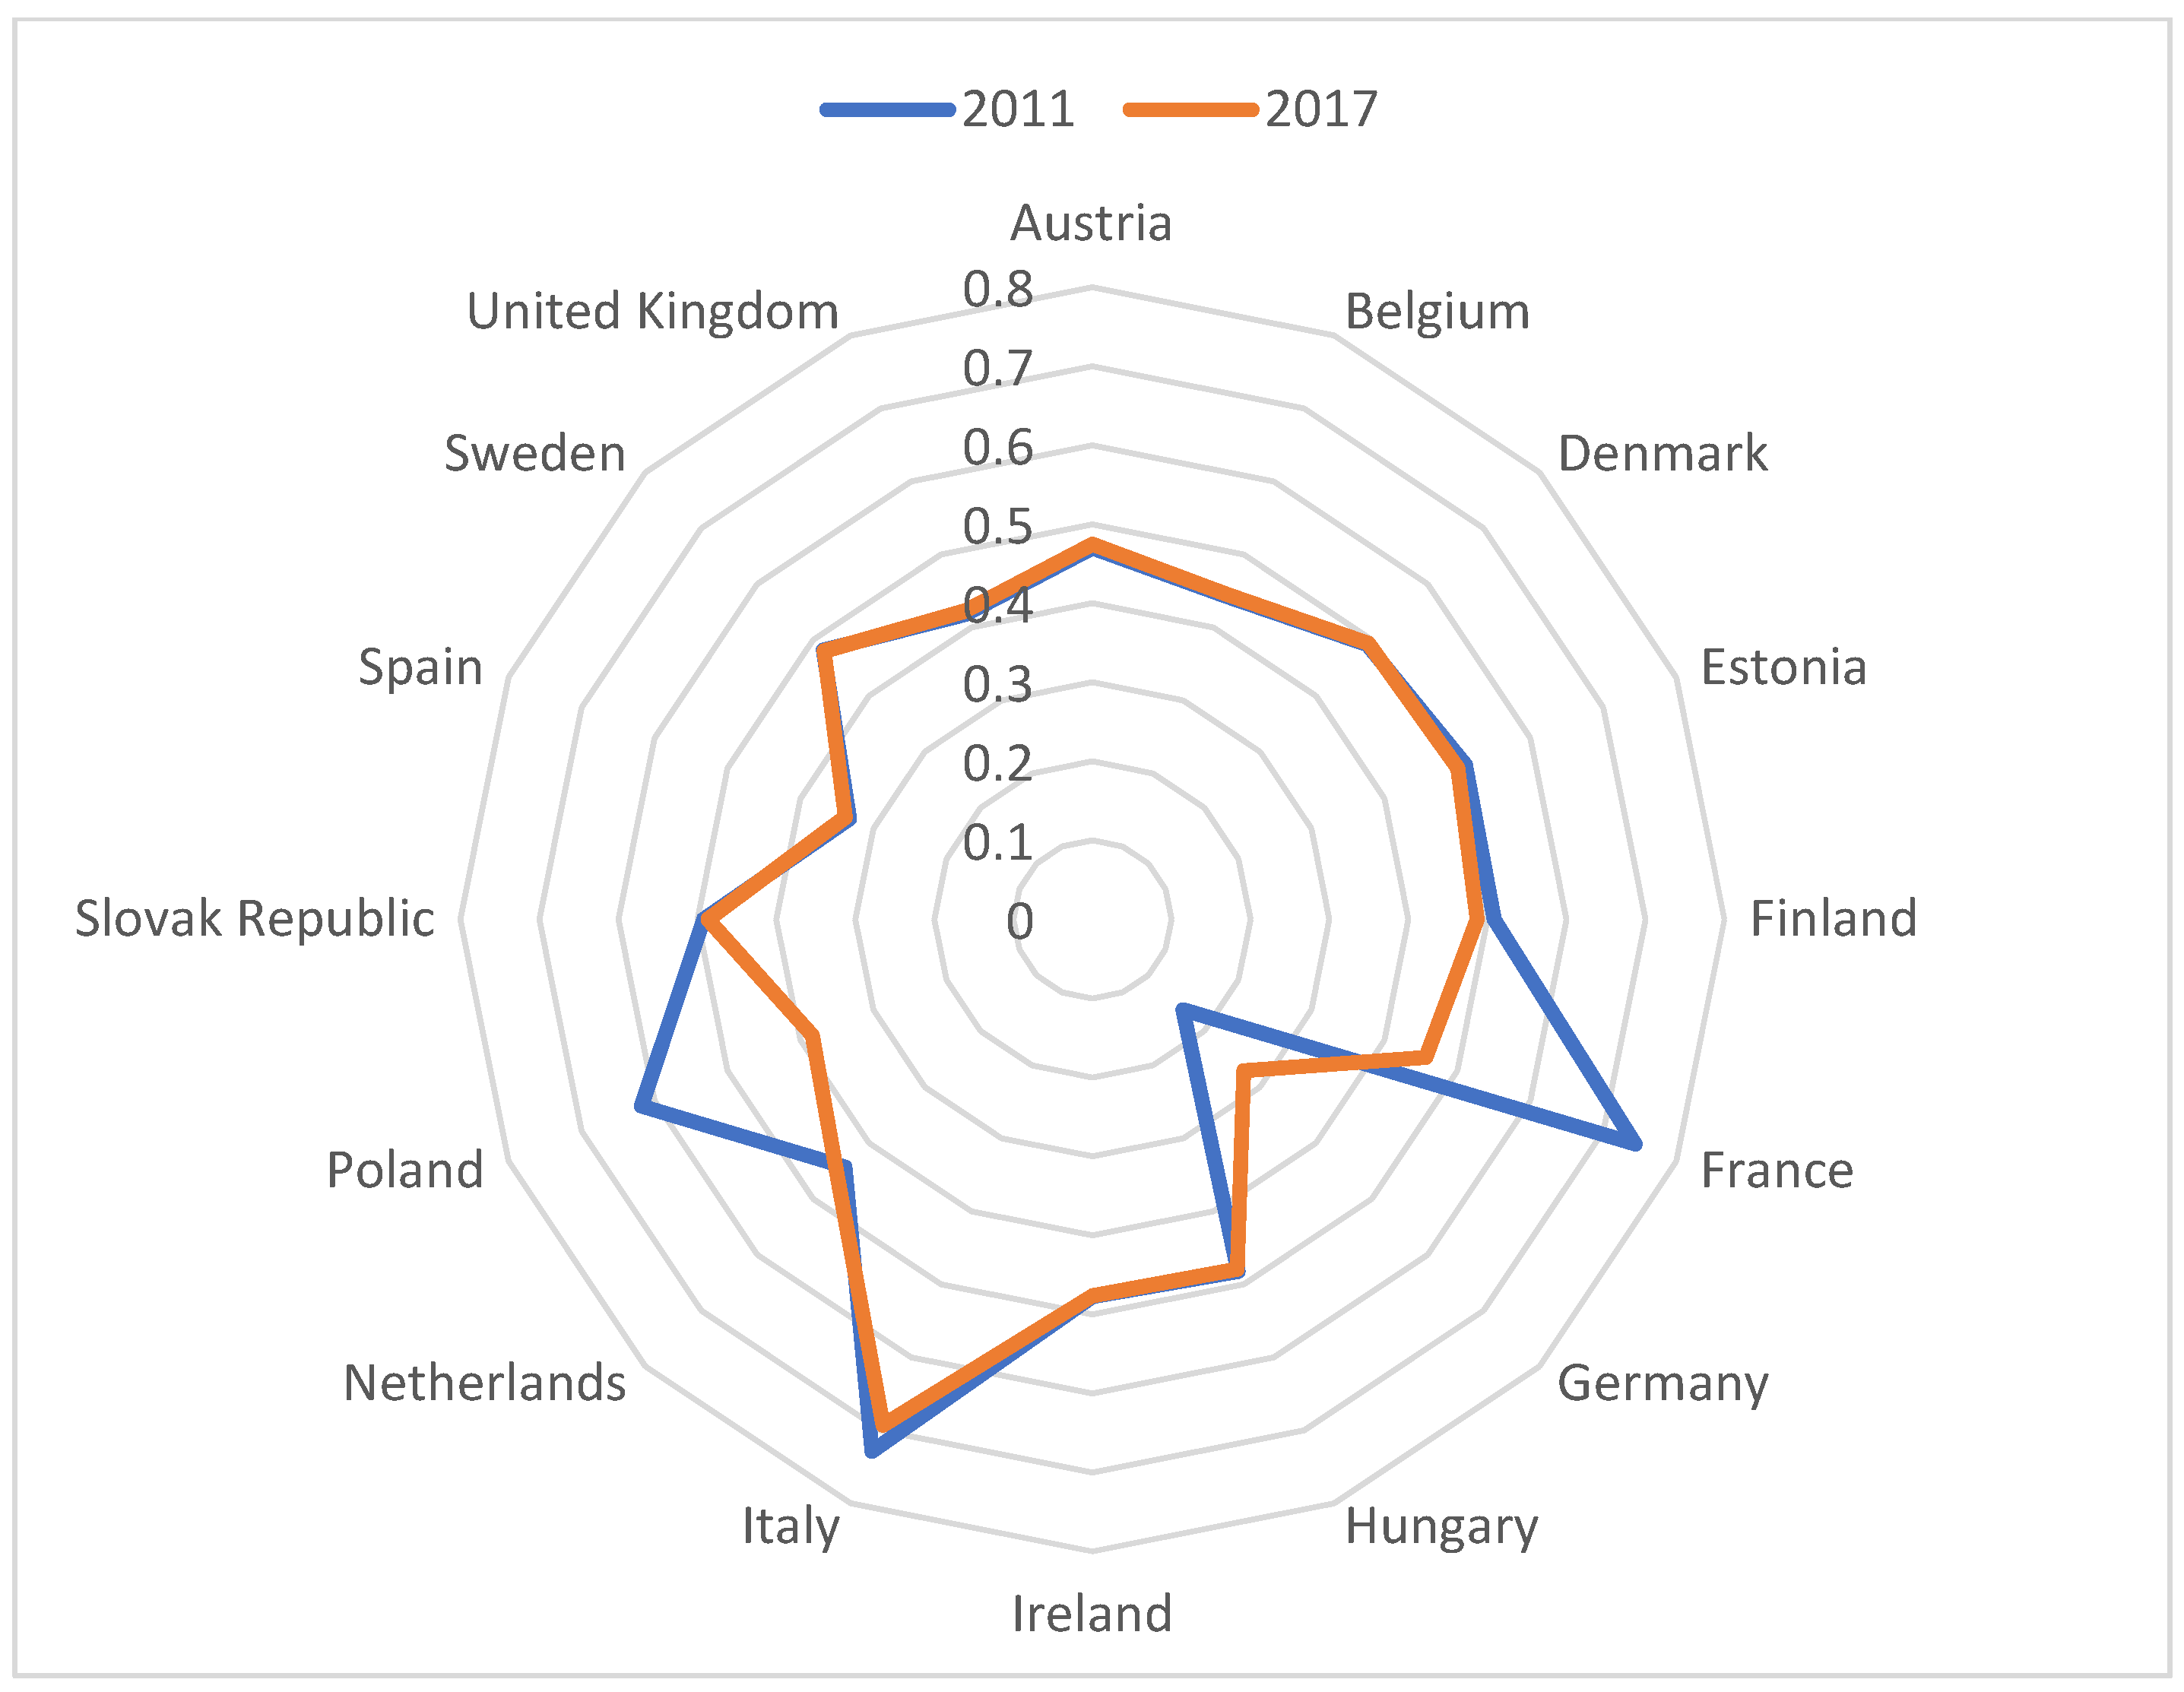
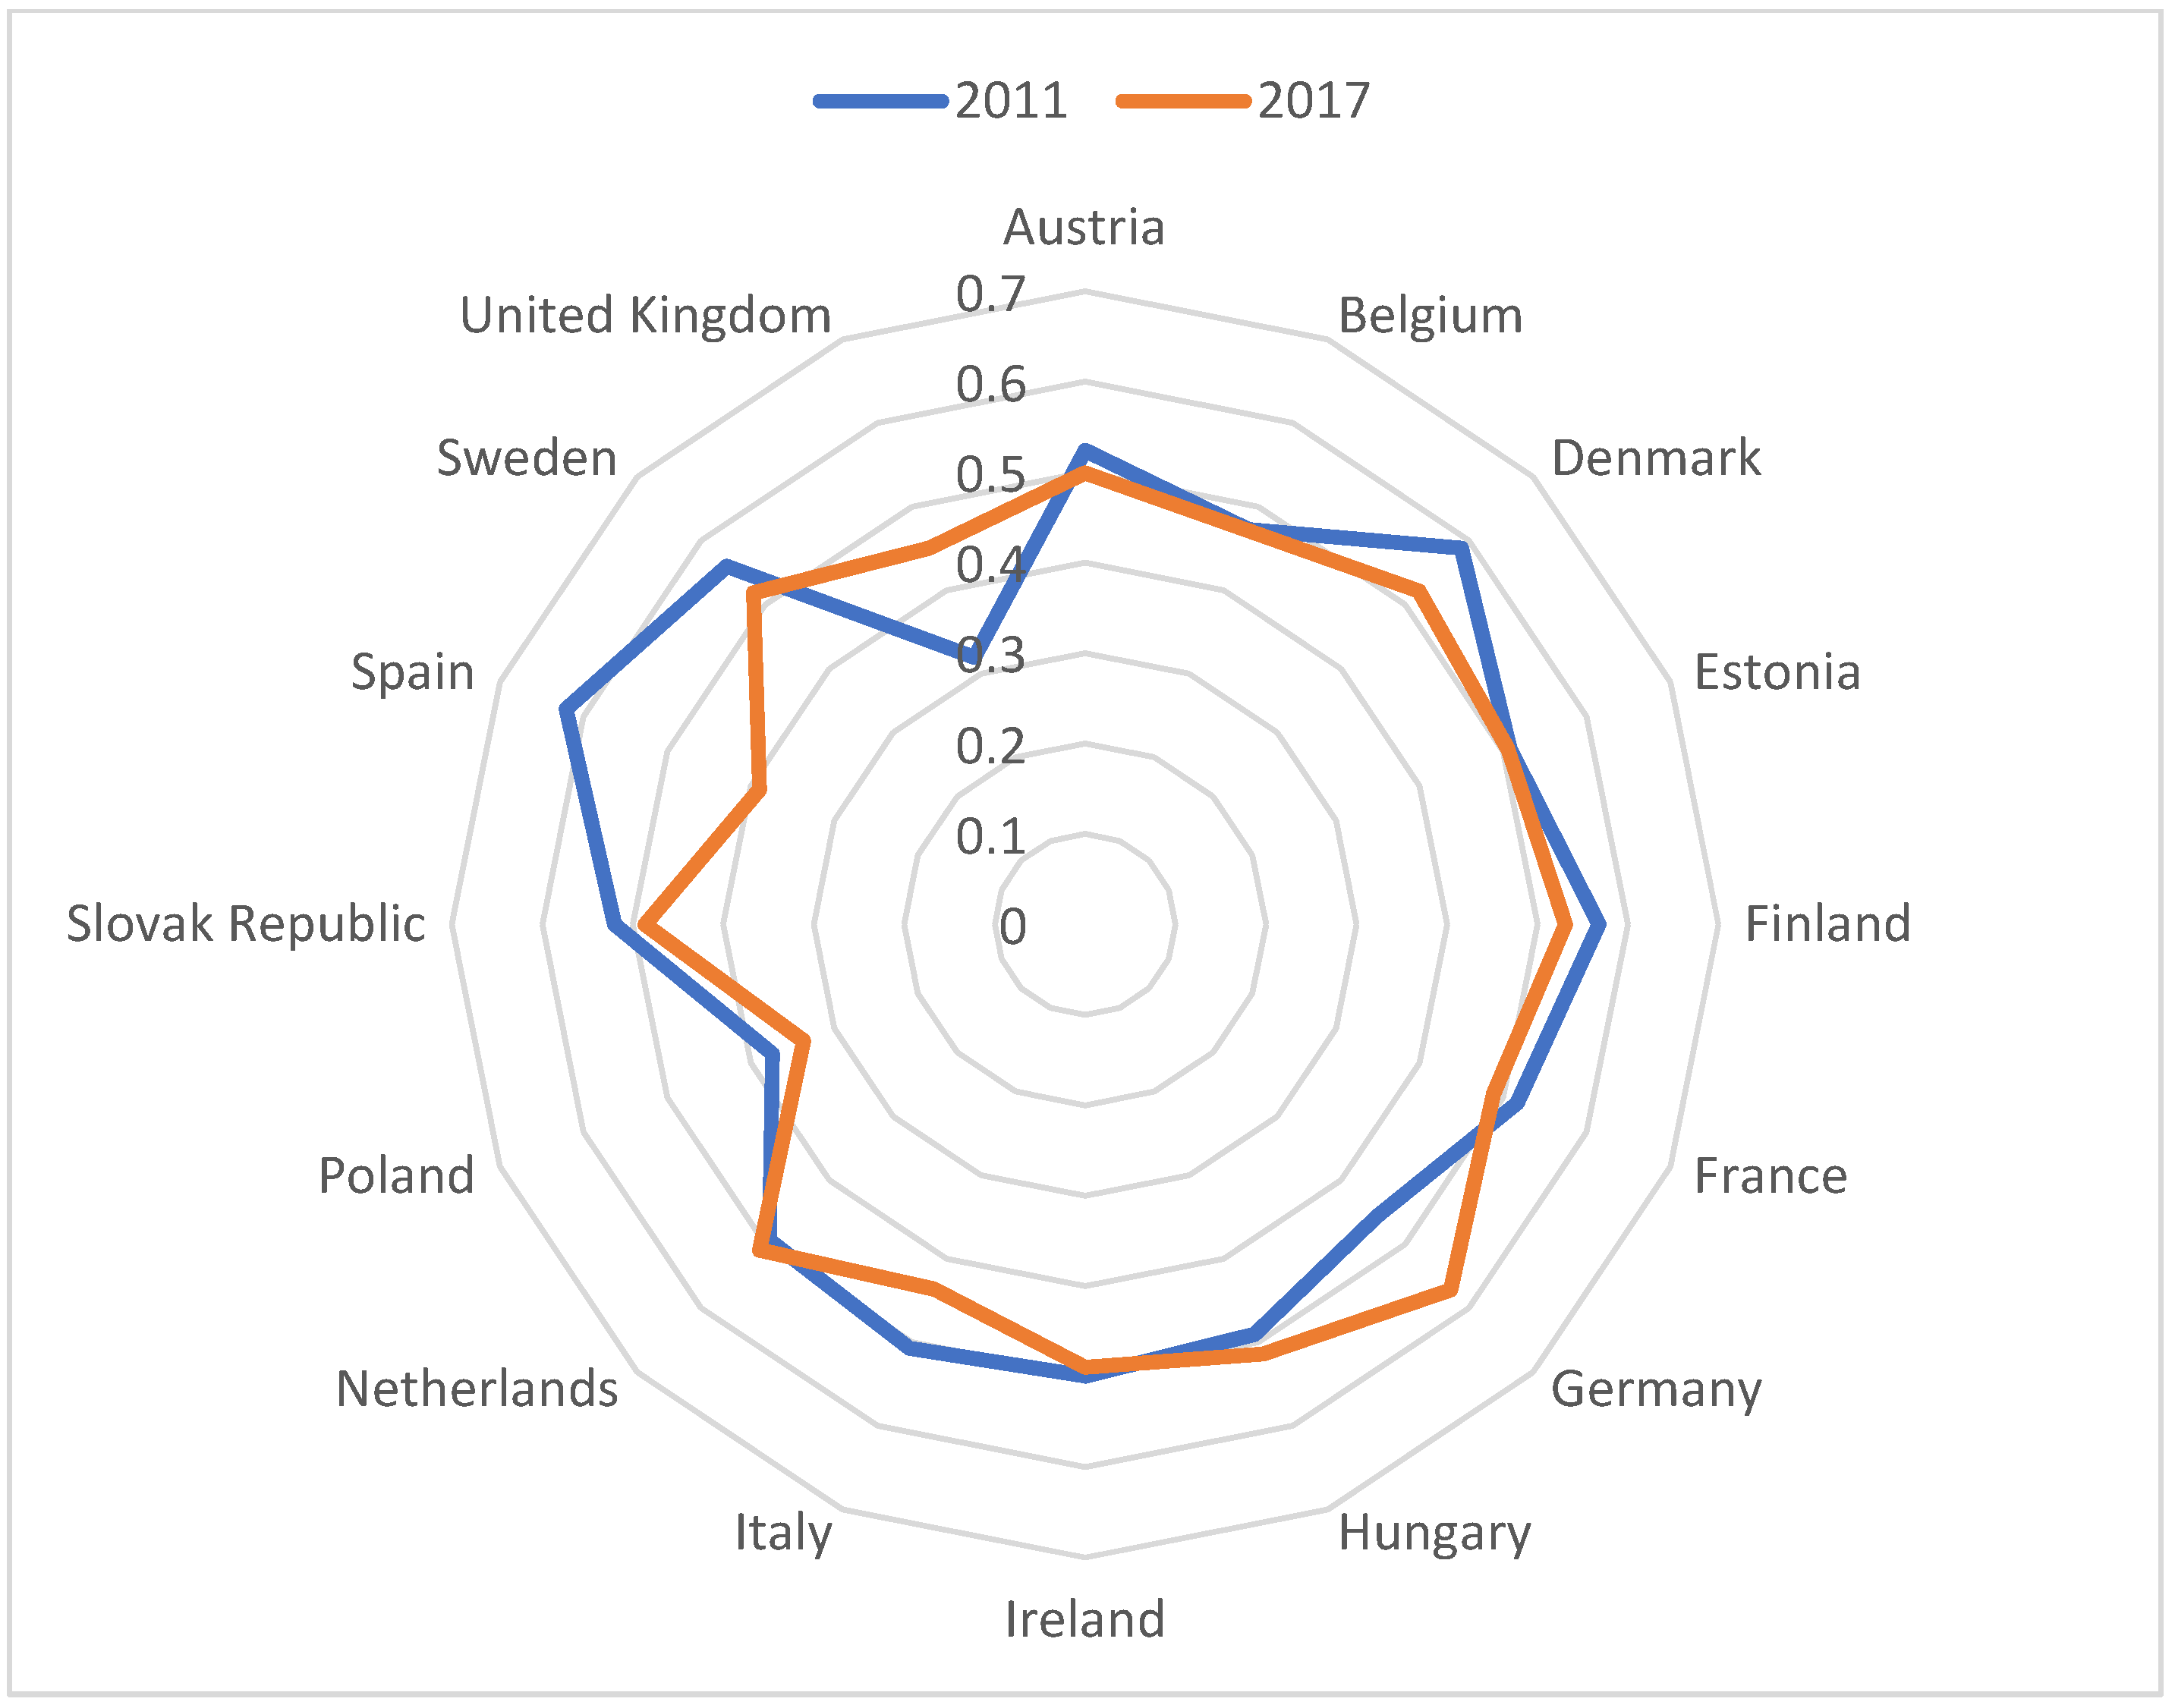
| 2011 | 2012 | 2013 | 2014 | 2015 | 2016 | 2017 | ||||||||||||||
|---|---|---|---|---|---|---|---|---|---|---|---|---|---|---|---|---|---|---|---|---|
| Detail | SMI | No. | SMI | No. | SMI | No. | SMI | No. | SMI | No. | SMI | No. | SMI | No. | ||||||
| Austria | 0.215 | 10 |  | 0.238 | 11 | | 0.249 | 8 | | 0.255 | 6 |  | 0.243 | 7 | | 0.252 | 5 | → | 0.244 | 5 |
| Belgium | 0.202 | 13 | | 0.25 | 8 | | 0.224 | 11 | | 0.216 | 10 | | 0.209 | 12 | | 0.208 | 11 | | 0.205 | 10 |
| Denmark | 0.282 | 7 | | 0.288 | 5 | | 0.257 | 7 | | 0.283 | 5 | → | 0.267 | 5 | | 0.221 | 8 | → | 0.214 | 8 |
| Estonia | 0.153 | 15 | | 0.145 | 16 | | 0.221 | 12 | | 0.194 | 11 | | 0.218 | 10 | | 0.235 | 6 | | 0.164 | 12 |
| Finland | 0.265 | 8 | | 0.279 | 6 | → | 0.277 | 6 | | 0.255 | 7 | | 0.265 | 6 | | 0.232 | 7 | → | 0.216 | 7 |
| France | 0.755 | 1 | → | 0.755 | 1 | → | 0.749 | 1 | → | 0.741 | 1 | → | 0.765 | 1 | → | 0.699 | 1 | | 0.618 | 2 |
| Germany | 0.469 | 3 | → | 0.472 | 3 | | 0.596 | 2 | | 0.526 | 3 | | 0.595 | 2 | → | 0.619 | 2 | | 0.653 | 1 |
| Hungary | 0.231 | 9 | → | 0.245 | 9 | | 0.137 | 15 | | 0.138 | 16 | | 0.140 | 15 | → | 0.143 | 15 | | 0.213 | 9 |
| Ireland | 0.145 | 16 | | 0.16 | 15 | | 0.148 | 14 | | 0.147 | 15 | | 0.165 | 14 | | 0.142 | 16 | | 0.142 | 14 |
| Italy | 0.58 | 2 | → | 0.575 | 2 | | 0.563 | 3 | | 0.531 | 2 | | 0.562 | 3 | → | 0.465 | 3 | | 0.434 | 4 |
| The Netherlands | 0.207 | 11 | | 0.241 | 10 | | 0.242 | 9 | | 0.193 | 12 | | 0.240 | 8 | | 0.212 | 10 | | 0.218 | 6 |
| Poland | 0.332 | 6 | | 0.27 | 7 | | 0.299 | 5 | | 0.227 | 8 | | 0.215 | 11 | | 0.149 | 13 | → | 0.142 | 13 |
| Slovak Republic | 0.16 | 14 | → | 0.16 | 14 | | 0.158 | 13 | | 0.152 | 14 | | 0.139 | 16 | | 0.146 | 14 | | 0.139 | 15 |
| Spain | 0.337 | 5 | | 0.235 | 12 | | 0.133 | 16 | | 0.179 | 13 | | 0.220 | 9 | | 0.17 | 12 | | 0.123 | 16 |
| Sweden | 0.205 | 12 | | 0.218 | 13 | | 0.233 | 10 | | 0.225 | 9 | | 0.205 | 13 | | 0.22 | 9 | | 0.200 | 11 |
| UK | 0.352 | 4 | → | 0.334 | 4 | → | 0.424 | 4 | → | 0.363 | 4 | → | 0.355 | 4 | → | 0.463 | 4 | | 0.471 | 3 |
References
- Keong, C.Y. Energy demand, economic growth, and energy efficiency—The Bakun dam-induced sustainable energy policy revisited. Energy Policy 2005, 33, 679–689. [Google Scholar] [CrossRef]
- Rühl, C.; Appleby, P.; Fennema, J. Economic development and the demand for energy: A historical perspective on the next 20 years. Energy Policy 2012, 50, 109–116. [Google Scholar] [CrossRef]
- Chen, W.; Geng, W. Fossil energy saving and CO2 emissions reduction performance, and dynamic change in performance considering renewable energy input. Energy 2017, 120, 283–292. [Google Scholar] [CrossRef]
- Koçak, E.; Kızılkaya, O. Towards sustainable development in China: Do political rights and civil liberties matter for environmental quality? Environ. Sci. Pollut. Res. 2020, 27, 35488–35500. [Google Scholar] [CrossRef]
- Munasinghe, M. The sustainomics trans-disciplinary meta-framework for making development more sustainable: Applications to energy issues. Int. J. Sustain. Dev. 2002, 5, 125. [Google Scholar] [CrossRef]
- Saygin, D.; Rigter, J.; Caldecott, B.; Wagner, N.; Gielen, D. Power sector asset stranding effects of climate policies. Energy Sources Part B Econ. Plan. Policy 2019, 14, 99–124. [Google Scholar] [CrossRef]
- Bulut, U.; Inglesi-Lotz, R. Which type of energy drove industrial growth in the US from 2000 to 2018? Energy Rep. 2019, 5, 425–430. [Google Scholar] [CrossRef]
- UNFCCC. Kyoto Protocol to the United Nations Framework Convention on Climate Change; United Nations: New York, NY, USA, 1998. [Google Scholar] [CrossRef] [Green Version]
- UNEP. Montreal Protocol on Substances that Deplete the Ozone Layer; 1522 UNTS 3, 26 ILM 1550; United Nations: New York, NY, USA, 1987. [Google Scholar]
- Lin, B.; Raza, M.Y. Analysis of energy related CO2 emissions in Pakistan. J. Clean. Prod. 2019, 219, 981–993. [Google Scholar] [CrossRef]
- Bilgili, F.; Kuşkaya, S.; Toğuç, N. A revisited renewable consumption-growth nexus: A continuous wavelet approach through disaggregated data. Renew Sust. Energ. Rev. 2019, 107, 1–19. [Google Scholar] [CrossRef]
- Fan, J.; Hong, H.; Jin, H. Life cycle global warming impact of CO2 capture by in-situ gasification chemical looping combustion using ilmenite oxygen carriers. J. Clean. Prod. 2019, 234, 568–578. [Google Scholar] [CrossRef]
- Khattak, S.I.; Ahmad, M.; Khan, Z.U.; Khan, A. Exploring the impact of innovation, renewable energy consumption, and income on CO2 emissions: New evidence from the BRICS economies. Environ. Sci. Pollut. Res. 2020, 27, 13866–13881. [Google Scholar] [CrossRef]
- Wang, Z.; Zhu, Y. Do energy technology innovations contribute to CO2 emissions abatement? A spatial perspective. Sci. Total Environ. 2020, 726, 138574. [Google Scholar] [CrossRef]
- Wang, R.; Mirza, N.; Abbas, Q.; Xiong, D. The nexus of carbon emissions, financial development, renewable energy consumption, and technological innovation: What should be the priorities in light of COP 21 Agreements? J. Environ. Manag. 2020, 271, 111027. [Google Scholar] [CrossRef]
- Heshmati, A.; Abolhosseini, S.; Altmann, J. The Development of Renewable Energy Sources and Its Significance for the Environment, 1st ed.; Springer: Singapore, 2015. [Google Scholar] [CrossRef]
- Fernández, F.Y.; López, F.M.A.; Blanco, O.B. Innovation for sustainability: The impact of R&D spending on CO2 emissions. J. Clean. Prod. 2018, 172, 3459–3467. [Google Scholar] [CrossRef]
- Wurlod, J.D.; Noailly, J. The impact of green innovation on energy intensity: An empirical analysis for 14 industrial sectors in OECD countries. Energy Econ. 2018, 71, 47–61. [Google Scholar] [CrossRef] [Green Version]
- Ulucak, R.; Yücel, A.G.; Koçak, E. The process of sustainability: From past to present. In Environmental Kuznets Curve (EKC); Ozcan, B., Ozturk, İ., Eds.; Elsevier: Amsterdam, The Netherlands, 2019; pp. 37–53. [Google Scholar]
- Kim, Y.; Kim, W.; Kim, M. An international comparative analysis of public acceptance of nuclear energy. Energy Policy 2014, 66, 475–483. [Google Scholar] [CrossRef]
- Brook, B.W.; Alonso, A.; Misak, J.; Blees, T.; van Erp, J.B. Why nuclear energy is sustainable and has to be part of the energy mix. Sustain. Mater. Technol. 2014, 1, 8–16. [Google Scholar] [CrossRef] [Green Version]
- Koçak, E.; Ulucak, Z.Ş. The effect of energy R&D expenditures on CO2 emission reduction: Estimation of the STIRPAT model for OECD countries. Environ. Sci. Pollut. Res. 2019, 26, 14328–14338. [Google Scholar] [CrossRef]
- Nordhaus, W.D. The Climate Casino; Yale University Press: London, UK, 2013. [Google Scholar]
- United Nations FCCC. Adoption of the Paris Agreement, Framework Convention on Climate Change; Int. FCCC/CP/2015/L.9; United Nations: Paris, France, 2015. [Google Scholar]
- Kryk, B.; Guzowska, M. Implementation of Climate/Energy Targets of the Europe 2020 Strategy by the EU Member States. Energies 2021, 14, 2711. [Google Scholar] [CrossRef]
- Koçak, E.; Kinaci, H.; Shehza, K. Environmental efficiency of disaggregated energy R&D expenditures in OECD: A bootstrap DEA approach. Environ. Sci. Pollut. Res. 2021, 28, 19381–19390. [Google Scholar] [CrossRef]
- UNEP. A Case for Climate Neutrality. Case Studies on Moving towards a Low Carbon Economy. United Nations Environment Programme. 2009. Available online: https://wedocs.unep.org/bitstream/handle (accessed on 15 September 2021).
- UNEP. Moving Towards a Climate Neutral UN. The UN System’s Footprint and Efforts to Reduce It. 2009. Available online: https://www.icao.int/environmental-protection/Documents/CNUN_report_09.pdf (accessed on 15 September 2021).
- European Parliament. Resolution European Parliament Resolution of 14 March 2019 on Climate Change—A European Strategic Long-Term Vision for a Prosperous, Modern, Competitive and Climate Neutral Economy in Accordance with the Paris Agreement; (2019/2582(RSP)); European Parliament: Strasbourg, France, 2019.
- Wang, Y.; Chi-hui, G.; Zhuangc, S.; Chena, X.; Jiaa, L.; Chend, Z.; Xiac, Z.; Wue, Z. Major contribution to carbon neutrality by China’s geosciences and geological Technologies. China Geol. 2021, 2, 329–352. [Google Scholar] [CrossRef]
- European Commission. Communication from the Commission: EUROPE 2020. A strategy for smart, sustainable and inclusive growth. In Proceedings of the COM (2010), Brussels, Belgium, 3 March 2010. [Google Scholar]
- European Commission. Communication from the Commission to the European Pariament, the Council, the European Economic and Social Commiteeand the Commitee of the Regions: Energy 2020. A strategy for competitive, sustainable and secure Energy. In Proceedings of the COM (2010) 639 Final, Brussels, Belgium, 10 November 2010. [Google Scholar]
- European Commission. Clean Energy for All Europeans; Publications Office of the European Union: Luxembourg, 2019. [Google Scholar]
- Wróbel, P. Small Steps to Big Changes. The Impact of the Clean Energy for All Europeans Package on Energy. In Proceedings of the Energy Forum, Warsaw, Poland, 17–20 September 2019; pp. 5–26. (In Polish). [Google Scholar]
- Sobolewski, M. Clean Energy for All Europeans—A New Initiative in the Field of EU Energy Policy. Studia BAS 2017, 3, 115–135. (In Polish) [Google Scholar]
- Long-Term Low Greenhouse Gas Emission Development Strategy of the European Union and Its Member States; Submission to the UNFCCC on Behalf of the European Union and Its Member States, (OR. en) 6612/20; Council of the European Union: Brussels, Belgium, 2020.
- European Commission. A Clean Planet for All A European Strategic Long-Term Vision for a Prosperous, Modern, Competitive and Climate Neutral Economy. In Proceedings of the COM (2018) 773 Final, Brussels, Belgium, 28 November 2018. [Google Scholar]
- European Commission. Report on the State of the Energy Union Pursuant to Regulation (EU) 2018/1999 on Governance of the Energy Union and Climate Action, Final Report. COM (2020) 950 Final; Publisher European Commission: Brussels, Belgium, 2020. [Google Scholar]
- European Parliament. Resolution European Parliament of 15 January 2020 on the European Green Deal; (2019/2956 (RSP); European Parliament: Strasbourg, France, 2020.
- Petri, F. Revisiting EU Climate and Energy Diplomacy: A Starting Point for Green Deal Diplomacy? Eur. Policy Brief 2020, 65, 1–9. [Google Scholar]
- IEA. Energy Policy Review; European Commission: Paris, France, 2020. [Google Scholar]
- Eurostat. CO2 Emissions from Energy Use Clearly Decreased in the EU in 2020. Products Eurostat News. 7 May 2021. Available online: https://ec.europa.eu/eurostat/web/products-eurostat-news/-/ddn-20210507-1 (accessed on 10 November 2021).
- European Commission. Communication from the commission to the European parliament, the council, the European economic and social committee and the committee of the regions EU-wide assessment of national energy and climate plans: Driving green transition and supporting economic recovery through integrated energy and climate planning. In Proceedings of the COM(2020) 564 Final, Brussels, Belgium, 17 September 2020. [Google Scholar]
- European Parliament News. What Is Carbon Neutrality and How Can It Be Achieved by 2050? 2020. Available online: https://www.europarl.europa.eu/news (accessed on 15 September 2021).
- European Commission. Kick-Starting the Journey towards a Climate-Neutral Europe by 2050. EU Climate Action Progress Report 2020. COM(2020) 777 Final; European Commission: Brussels, Belgium, 2020. [Google Scholar]
- European Council. Fit for 55: The EU’s Plan for a Green Transition. Available online: https://www.consilium.europa.eu/en/policies/eu-plan-for-a-green-transition/ (accessed on 15 September 2021).
- European Commission. Directive 2008/50/EC of the European parliament and of the council of 21 May 2008 on ambient air quality and cleaner air for Europe. Off. J. Eur. Union 2008, 152, 1–44. [Google Scholar]
- European Commission. Directive 2016/2284 of the European Parliament and of the council of 14 December 2016 on the reduction of national emissions of certain atmospheric pollutants, amending Directive 2003/35/EC and repealing Directive 2001/81/EC. Off. J. Eur. Union 2016, 344, 1–31. [Google Scholar]
- European Commission. Directive 2010/75/EU of the European parliament and of the council of 24 November 2010 on industrial emissions (integrated pollution prevention and control. Off. J. Eur. Union 2010, 334, 17–119. [Google Scholar]
- European Commission. Directives 2015/2193 of the European parliament and of the council of 25 November 2015 on the limitation of emissions of certain pollutants into the air from medium combustion plants. Off. J. Eur. Union 2015, 313, 1–19. [Google Scholar]
- European Commission. Regulation of the European parliament and of the council establishing the Connecting Europe Facility and repealing regulations (EU) no 1316/2013 (EU) no 283/2014. In Proceedings of the COM(2018) 438 Final, 2018/0228(COD), Brussels, Belgium, 6 June 2018. [Google Scholar]
- European Commission. Regulation of the European parliament and of the council amending regulation (EU) No 1303/2013 as regards exceptional additional resources and implementing arrangements under the Investment for growth and jobs goal to provide assistance for fostering crisis repair in the context of the COVID-19 pandemic and preparing a green, digital and resilient recovery of the economy (REACT-EU). In Proceedings of the COM(2020) 451 Final, 2020/0101(COD), Brussels, Belgium, 28 May 2020. [Google Scholar]
- European Commission. Regulation (EU) 2021/523 of the European Parliament and of the Council of 24 March 2021 establishing the Invest EU Programme and amending Regulation (EU) 2015/1017. Off. J. Eur. Union 2021, 107, 30–89. [Google Scholar]
- European Commission. Regulation of the European parliament and of the council establishing a facility for reconstruction and resilience. In Proceedings of the COM(2020) 408 Final, 2020/0104(COD), Brussels, Belgium, 28 May 2020. [Google Scholar]
- European Commission. Directive of the European parliament and of the council amending Directive 2003/87/EC to enhance cost-effective emission reductions and low-carbon investments. In Proceedings of the COM(2015) 337 Final, 2015/148(COD), Brussels, Belgium, 15 July 2015. [Google Scholar]
- European Commission. Regulations of the European parliament and of the council establishing the Horizon Europe Framework Program for Research and Innovation, and the rules for participation and dissemination applicable therein. In Proceedings of the COM(2018) 435 Final, 2018/0224(COD), Brussels, Belgium, 7 June 2018. [Google Scholar]
- European Commission. Regulation of the European parliament and of the council establishing a Program for the Environment and Climate Action (LIFE) and repealing the regulation (EU) no1293/2013. In Proceedings of the COM(2018) 385 Final, 2018/0209(COD), Brussels, Belgium, 1 June 2018. [Google Scholar]
- European Commission. European Commission. Commission implementing regulation (EU) on the Union renewable energy financing mechanism. In Proceedings of the C/2020/6123 Final, Brussels, Belgium, 15 September 2020. [Google Scholar]
- European Commission. In Proceedings of the Regulation (EU) 2021/1056 of the European Parliament and of the Council of 24 June 2021 establishing the Just Transition Fund. Off. J. Eur. Union 2021, 231, 1–20. [Google Scholar]
- Çolak, M.S.; Ege, A. An Assessment of EU 2020 Strategy: Too Far to Reach? Soc. Indic. Res. 2013, 110, 659–680. [Google Scholar] [CrossRef]
- Balcerzak, A.P. Europe 2020 Strategy and Structural Diversity between Old and New Member States. Application of Zero-Unitarizatin Method for Dynamic Analysis in the Years 2004–2013. Econ. Sociol. 2015, 8, 190. [Google Scholar] [CrossRef]
- Fura, B.; Wojnar, J.; Kasprzyk, B. Ranking and Classification of EU Countries Regarding their Levels of Implementation of the Europe 2020 Strategy. J. Clean. Prod. 2017, 165, 968–979. [Google Scholar] [CrossRef]
- Bonsinetto, F.; Falco, E. Analysing Italian Regional Patterns in Green Economy and Climate Change. Can Italy Leverage on Europe 2020 Strategy to Face Sustainable Growth Challenges? J. Urban Reg. Anal. 2013, 5, 123. [Google Scholar] [CrossRef]
- Baneliene, R. Evaluation of the Efficiency of Economic Policy under the Europe-2020 Strategy in Small European Union Countries. Ekonomika 2013, 92, 7–19. [Google Scholar] [CrossRef] [Green Version]
- Bere, R.C.; Bucerzan, I. Cluster Analysis on Cohesion Policy towards Europe 2020 Strategy for Smart, Sustainable and Inclusive Growth. Rom. Stat. Rev. 2015, 63, 95–111. [Google Scholar]
- Hobza, A.; Mourre, G. Quantifying the Potential Macroeconomic Effects of the Europe 2020 Strategy: Stylised Scenarios. Directorate General Economic and Financial Affairs (DG ECFIN); European Commission: Brussels, Belgium, 2010. [Google Scholar]
- Kedaitiene, A.; Kedaitis, V. Macroeconomic Effects of the Europe 2020 Strategy. Soc. Tyrim. 2012, 4, 5–19. [Google Scholar]
- Naldi, L.; Nilsson, P.; Westlund, H.; Wixe, S. What Is Smart Rural Development? J. Rural. Stud. 2015, 40, 90–101. [Google Scholar] [CrossRef]
- Pasimeni, F.; Pasimeni, P. An Institutional Analysis of the Europe 2020 Strategy. Soc. Indic. Res. 2016, 127, 1021–1038. [Google Scholar] [CrossRef]
- Geysens, J. Capacity Mechanisms after the Commission’s Winter Package. Eur. Energy Environ. Law. Rev. 2017, 26, 111–122. [Google Scholar]
- Becker, W.; Norlén, H.; Dijkstra, L.; Athanasoglou, S. Wrapping up the Europe 2020 Strategy: A Multidimensional Indicator Analysis. Environ. Sustain. Indic. 2020, 8, 100075. [Google Scholar] [CrossRef]
- Duran, J.; Golušin, M.; Munitlak, I.O.; Jovanovi´c, L.; Andrejevi´c, A. Renewable Energy and Socio-Economic Development in the European Union. Probl. Ekorozw. 2013, 8, 105–114. [Google Scholar]
- Klessmann, C.; Held, A.; Rathmann, M.; Ragwitz, M. Status and Perspectives of Renewable Energy Policy and Deployment in the European Union—What Is Needed to Reach the 2020 Targets? Energy Policy 2011, 39, 7637–7657. [Google Scholar] [CrossRef]
- Liobikiene, G.; Butkus, M. The European Union Possibilities to Achieve Targets of Europe 2020 and Paris Agreement Climate Policy. Renew. Energy 2017, 106, 298–309. [Google Scholar] [CrossRef]
- Nagy, K.; Körmendi, K. Use of Renewable Energy Sources in Light of the “New Energy Strategy for Europe 2011–2020”. Appl. Energy 2012, 96, 393–399. [Google Scholar] [CrossRef]
- Szulecki, K. European Energy Governance and Decarbonization Policy: Learning from the 2020 Strategy. Clim. Policy 2016, 16, 543–547. [Google Scholar] [CrossRef]
- Paprotny, D. Measuring Central and Eastern Europe’s Socio-Economic Development Using Time Lags. Soc. Indic. Res. 2016, 127, 939–957. [Google Scholar] [CrossRef] [Green Version]
- Szymańska, A.; Zalewska, E. Towards the Goals of the Europe 2020 Strategy: Convergence or Divergence of the European Union Countries? Comp. Econ. Res. 2018, 21, 67–82. [Google Scholar] [CrossRef] [Green Version]
- Stanicková, M. Can the Implementation of the Europe 2020 Strategy Goals Be Efficient? The Challenge for Achieving Social Equality in the European Union. Equilib. Q. J. Econ. Econ. Policy 2017, 12, 383–398. [Google Scholar] [CrossRef] [Green Version]
- Yotova, L.; Stefanova, K. Efficiency of Tertiary Education Expenditure in CEE Countries: Data Envelopment Analysis. Econ. Altern. J. 2017, 25, 352–364. [Google Scholar]
- Zangheri, P.; Economidou, M.; Labanca, N. Progress in the Implementation of the EU Energy Efficiency Directive through the Lens of the National Annual Reports. Energies 2019, 12, 1107. [Google Scholar] [CrossRef] [Green Version]
- Sobczyk, W.; Sobczyk, E.J. Varying the Energy Mix in the EU-28 and in Poland as a Step towards Sustainable Development. Energies 2021, 14, 1502. [Google Scholar] [CrossRef]
- Brozyna, J.; Strielkowski, W.; Formina, A.; Nikitina, N. Renewable Energy and EU 2020 Target for Energy Efficiency in the Czech Republic and Slovakia. Energies 2020, 13, 965. [Google Scholar] [CrossRef] [Green Version]
- Vitéz, B.; Lavrijssen, S. The Energy Transition: Democracy, Justice and Good Regulation of the Heat Market. Energies 2020, 13, 1088. [Google Scholar] [CrossRef] [Green Version]
- Thema, J.; Suerkemper, F.; Couder, J.; Mzavanadze, N.; Chatterjee, S.; Teubler, J.; Thomas, S.; Ürge-Vorsatz, D.; Bo Hansen, M.; Bouzarovski, S.; et al. The Multiple Benefits of the 2030 EU Energy Efficiency Potential. Energies 2019, 12, 2798. [Google Scholar] [CrossRef] [Green Version]
- European Commission. EU SDG Indicator set 2021 Result of the Review in Preparation of the 2021 Edition of the EU SDG Monitoring Report Final Version of 15/01/2021, Eurostat; European Commission: Brussels, Belgium, 2021. [Google Scholar]
- Włodarczyk, B.; Firoiu, D.; George, H.; Ionescu, G.H.; Ghiocel, F.; Szturo, M.; Markowski, L. Assessing the Sustainable Development and Renewable Energy Sources Relationship in EU Countries. Energies 2021, 14, 2323. [Google Scholar] [CrossRef]
- Yuan, B.; Huang, J.-N. Applying data envelopment analysis to evaluate the efficiency of R&D projects—A case study of R&D in energy technology. In Technology Commercialization; Springer: Boston, MA, USA, 2002; pp. 111–134. [Google Scholar] [CrossRef]
- Kyung-Taek, K.; Deok Joo, L.; Sung-Joon, P.; Yanshuai, Z.; Azamat, S. Measuring the efficiency of the investment for renewable energy in Korea using data envelopment analysis. Renew. Sustain. Energy Rev. 2015, 47, 694–702. [Google Scholar] [CrossRef]
- Wang, Q.; Hang, Y.; Sun, L.; Zhao, Z. Two-stage innovation efficiency of new energy enterprises in China: A non-radial DEA approach. Technol. Forecast Soc. Chang. 2016, 112, 254–261. [Google Scholar] [CrossRef]
- Du, H.; Matisoff, D.C.; Wang, Y.; Liu, X. Understanding drivers of energy efficiency changes in China. Appl. Energy 2016, 184, 1196–1206. [Google Scholar] [CrossRef]
- Kwon, D.S.; Cho, J.H.; Sohn, S.Y. Comparison of technology efficiency for CO2 emissions reduction among European countries based on DEA with decomposed factors. J. Clean Prod. 2017, 151, 109–120. [Google Scholar] [CrossRef]
- Zhao, H.; Guo, S.; Zhao, H. Provincial energy efficiency of China quantified by three-stage data envelopment analysis. Energy 2019, 166, 96–107. [Google Scholar] [CrossRef]
- Answer, M.K.; Iqbal, W.; Ahmad, U.S.; Fatima, A.; Chaudhry, I.S. Environmental efficiency and the role of energy innovation in emissions reduction. Environ. Sci. Pollut. Res. 2020, 27, 29451–29463. [Google Scholar] [CrossRef] [PubMed]
- Pakulska, T. Green Energy in Central and Eastern European (CEE) Countries: New Challenges on the Path to Sustainable Development. Energies 2021, 14, 884. [Google Scholar] [CrossRef]
- Polish Statistical Office. Działalność Badawcza i Rozwojowa [B+R]. Available online: https://stat.gov.pl/cps/rde/xbcr/wroc/ASSETS_Dzialalnosc_badawcza_i_rozwojowa.pdf (accessed on 22 September 2021).
- Ziętek-Kwaśniewska, K. Nakłady na Działalność Badawczo-Rozwojową w Polsce na tle Państw Unii Europejskiej. Studia 2020, 1, 9–25. [Google Scholar] [CrossRef]
- KPMG. Działalność Badawczo-Rozwojowa Przedsiębiorstw w Polsce. Perspektywa 2020. 2020. Available online: https://assets.kpmg/content/dam/kpmg/pdf/2016/03/Dzialalnosc-BR-przedsiebiorstw-w-Polsce.pdf (accessed on 22 September 2021). (In Polish).
- Which Companies Spend the Most in Research and Development (R&D)? 21 June 2021. Available online: https://www.nasdaq.com/articles (accessed on 22 September 2021).
- Jaruzelski, B.; Chwalik, R.; Goehle, B. What the top innovators get right. With careful attention to six key areas, companies can make the most of their R&D investment and outpace the competition. Strategy+ Business 2018, 93. Available online: https://www.strategy-business.com/feature/What-the-Top-Innovators-Get-Right (accessed on 22 September 2021).
- Stępniak-Kucharska, A. Rola państwa we wspieraniu działalności badawczo-rozwojowej polskich przedsiębiorstw. Uniwersytet Ekonomiczny w Katowicach. Studia Ekon. 2015, 209, 198–208. [Google Scholar]
- Święcicki, I. Polish R&D Available Support Tools and New Opportunities; Polish Economic Institute: Warsaw, Poland, 2019. (In Polish) [Google Scholar]
- Torrecillas, C.; Fischer, B.; Sánchez, A. The dual role of R&D expenditures in European Union’s member states: Short- and long-term prospects Innovation. Eur. J. Soc. Sci. 2017, 30, 433–454. [Google Scholar] [CrossRef]
- Share of GBARD in Total General Government Expenditure. Available online: https://ec.europa.eu/eurostat/databrowser/view/gba_nabste/default/table?lang=en (accessed on 11 October 2021).
- IEA. Public Energy RD&D in IEA Countries. Available online: https://www.iea.org/reports/energy-technology-rdd-budgets-overview/public-energy-rdd-in-iea-countries (accessed on 22 September 2021).
- IEA. Energy Technology RD&D Statistics. Available online: https://stats.oecd.org/BrandedView.aspx?oecd_bv_id=enetech-data-en&doi=data-00488-en (accessed on 11 October 2021).
- IEA. Low-Carbon RD&D. Available online: https://www.iea.org/reports/energy-technology-rdd-budgets-overview/low-carbon-rdd (accessed on 21 September 2021).
- Iftikhar, Y.; Wang, Z.; Zhang, B.; Wang, B. Energy and CO2 emissions efficiency of major economies: A network DEA approach. Energy 2018, 147, 197–207. [Google Scholar] [CrossRef]
- Ilahi, S.; Wu, Y.; Raza, M.A.A. Optimization approach for improving energy efficiency and evaluation of greenhouse gas emission of wheat crop using Data Envelopment Analysis. Sustainability 2019, 11, 3409. [Google Scholar] [CrossRef] [Green Version]
- Cho, J.H.; Sohn, S.Y. A novel decomposition analysis of green patent applications for the evaluation of R&D efforts to reduce CO2 emissions from fossil fuel energy consumption. J. Clean. Prod. 2018, 93, 290–299. [Google Scholar] [CrossRef]
- Barreto, R.A. Fossil fuels, alternative energy and economic growth. Econ. Model. 2018, 75, 196–220. [Google Scholar] [CrossRef] [Green Version]
- Hellwig, Z. Application of the Taxonomic Method to the Countries Typology According to Their Level of Development and the Structure of Resources and Qualified Staff. Przegląd Stat. 1968, 4, 307–326. [Google Scholar]
- Bąk, I.; Cheba, K.; Szczecińska, B. The Statistical Analysis of Road Traffic in Cities of Poland. Transp. Res. Procedia 2019, 39, 14–23. [Google Scholar] [CrossRef]
- Kukula, K.; Bogocz, D. Zero Unitarization Method and Its Application in Ranking Research in Agriculture. Econ. Reg. Stud. 2014, 7, 5–13. [Google Scholar]
- Kukuła, K. The Method of Zero Unitarization in the Background of Chosen Normalization Methods. Acta Sci. Acad. Ostroviensis 1999, 4, 5–31. [Google Scholar]
- Liu, H.; Yang, G.; Liu, X.; Song, Y. R&D performance assessment of industrial enterprises in China: A two-stage DEA approach. Socio. Econ. Plan. 2019, 71, 100753. [Google Scholar] [CrossRef]
- Gabbatiss, J. In-Depth Q&A: Why Ireland Is ‘Nowhere Near’ Meeting Its Climate-Change Goals. 2019. Available online: https://www.carbonbrief.org/bonn-climate-talks-key-outcomes-from-june-2019-un-climate-conference (accessed on 22 September 2021).
- End of Coal in Sight at COP 26. In Proceedings of the UN Climate Change Conference (COP26), Glasgow, UK, 4 November 2021; Available online: https://ukcop26.org/end-of-coal-in-sight-at-cop26/ (accessed on 14 November 2021).
- Ringela, M.; Knodt, M. The governance of the European Energy Union: Efficiency, effectiveness and acceptance of the Winter Package 2016. Energy Policy 2018, 112, 209–220. [Google Scholar] [CrossRef]
- Knodt, M.; Schoenefeld, J.J. Harder soft governance in European climate and energy policy: Exploring a new trend in public policy. J. Environ. Policy Plan. 2020, 22, 761–773. [Google Scholar] [CrossRef]


| Initiative | Main Goals |
|---|---|
| Strategy Europe 2020 (2010) |
|
| Strategy Energy 2020 (2010) |
|
| Clean Energy for all Europeans “Winter Package” (2015–2016) |
|
| European Green Deal (2019) |
|
| Long-term low-carbon development strategy (2019) |
|
| European Council, 10–11 December 2020 |
|
| The ‘Fit for 55’ package (2021) |
|
| Designation of Variable | Name of Variable | Unit of Measure | Character of Variable |
|---|---|---|---|
| Energy efficiency R&D | million USD (2019 prices and PPP)) | stimulant | |
| Fossil fuels R&D | million USD (2019 prices and PPP)) | stimulant | |
| Renewable energy sources R&D | million USD (2019 prices and PPP)) | stimulant | |
| Nuclear energy R&D | million USD (2019 prices and PPP)) | stimulant | |
| Hydrogen and fuel cells R&D | million USD (2019 prices and PPP)) | stimulant | |
| Other power and storage technologies R&D | million USD (2019 prices and PPP)) | stimulant | |
| CO2 | tons | de-stimulant |
Publisher’s Note: MDPI stays neutral with regard to jurisdictional claims in published maps and institutional affiliations. |
© 2021 by the authors. Licensee MDPI, Basel, Switzerland. This article is an open access article distributed under the terms and conditions of the Creative Commons Attribution (CC BY) license (https://creativecommons.org/licenses/by/4.0/).
Share and Cite
Guzowska, M.K.; Kryk, B.; Michalak, D.; Szyja, P. R&D Spending in the Energy Sector and Achieving the Goal of Climate Neutrality. Energies 2021, 14, 7875. https://doi.org/10.3390/en14237875
Guzowska MK, Kryk B, Michalak D, Szyja P. R&D Spending in the Energy Sector and Achieving the Goal of Climate Neutrality. Energies. 2021; 14(23):7875. https://doi.org/10.3390/en14237875
Chicago/Turabian StyleGuzowska, Małgorzata K., Barbara Kryk, Dorota Michalak, and Paulina Szyja. 2021. "R&D Spending in the Energy Sector and Achieving the Goal of Climate Neutrality" Energies 14, no. 23: 7875. https://doi.org/10.3390/en14237875