1. Introduction
Power demands increase as the needs and standards of living progressively increase. This attribute forces the investigation of new power sources that on the one hand shall not be exhausted soon, and on the other hand, shall not affect ecological balance for the ecosystem due to pollution. Renewal Energy Sources (RES) are friendly energy producers to the ecosystem by utilizing Photovoltaic Systems (PVs), Wind Generators (WECs), or sea waves, etc., thus reducing gas emissions. The latter establishes RES as a major bundle of technologies, for power production, and is friendly to the environment.
RES evolved to important technological sectors during the last few decades, offering energy to cover demands for many electric grids and replacing traditional fuels [
1]. Wind and solar energy are irregular, and thus necessitate energy storage systems to increase their contribution to the total energy generated. Technological developments, electrical economy studies (costs and prices) and energy policies aim at increasing RES influence in the balance of total power [
2], and anticipate that RES will provide an important part of the electric energy generation, and this growth aims at dropping fuel consumption [
3].
The Liquefied Natural Gas LNG replaces the Marine Diesel Oil MDO in energy generation, and benefits the environment [
4]. In other publications, additional to the ship’s diesel-generating power system, is added a solar power system with battery storage and an Energy Management System EMS [
5]. Regarding ecological pollution and energy dissipated from fossil fuels, predictions show that such fuels lead to an increase in the planet’s temperature, or the greenhouse effect [
1,
5,
6]. Future ship and harbor designs focus on the management of electrical energy using smart grids and the use of different MDOs with hybrid energy sources involving RES, storage units, and a shore-side energy supply for ships [
6].
People traveling and merchandising needs have been covered for a long time by ships. Ship sizes and capacities vary according to requirements. Ship operation demands a large quantity of power production for propulsion, lighting, cargo loading, pump operation, etc., which are covered by installed engines—thermal generators using fuels such as oil, diesel, natural gas, lignite. Nevertheless, such engines produce gas emissions CO
2, CO, SO
2, polluting the environment [
6,
7]. In reference [
7], from the analysis of parameters influencing generated energy, energy efficiency and environmental impact of several power system configurations, is established an index of Energy Efficiency and Environmental Eligibility.
Because of new emission control regulations, LNG became a more attractive fuel option as related to MDO, with a higher efficiency and a lower environmental impact: 100% less SO
x, 85–90% less NO
x, and 25% less CO
2. Consequently, alternatives for covering ship power needs are to be sought to replace traditional fossil fuel engines, the Diesel Generators (DGs), for the reduction of gas emissions. RES expresses power production technologies that reduce emissions while producing ‘clean’ power for the operation of a ship [
8,
9,
10]. For this reason, for meeting ship power demands, it is important to combine power generation from RES with thermal engines using fuels.
The main issue to be taken into consideration is that a ship for normal operation has increased power demands, according to its type and application (from hundred kW up to MW) and according to the ship dimensions and capacity. For the RES contribution to be substantial, several RES units should be installed covering jointly a significant portion of ship power needs. Scaling and integrating these sources necessitate a simulation model as a basis for calculations and for power needs in different conditions, as well as balancing RES power generation with ship power demands. The simulation model for such a system must handle, using algorithms and approaches, the problem of the assignment of power sources to the requested power demands varying in time, resulting in a model of operation in terms of power management. Due to the increased power needs of a ship, RES cannot supply exclusively the energy demands. Based on this, for covering the energy demand, an EMS is to assign load demands to RES units, and to control the connection and disconnection of all generating units of all available sources (RES and thermal units).
Simulation models for hybrid grids have been successfully developed for the simulation of domestic grids combined with REs, in order to evaluate grid dimensions, optimality on power distribution and quality of generated power [
7,
11,
12,
13,
14]. An important difference between these models for grids and a model for ship simulation is that grids can always meet additional power needs using external power provision [
15]. Ship operation is an isolated power system that has to meet power needs by its own resources [
5,
16]. A ship model is an ‘always isolated power system’, which has to fulfill all electric load demands by its internal resources [
5]. Autonomous hybrid wind-diesel grids in a dynamic operation presents power quality issues due to the presence of generated harmonics and their propagation in the network [
11,
17,
18].
Other reductions in electricity costs are obtained through the introduction of RES combined with load dispatch techniques. This involves efficient EMS, with advanced technology such as the Internet of Things (IoT), which controls and monitors the operational requirements of each industrial application for which it is designed [
19,
20,
21,
22].
Shipyard drydocks are grid-connected microgrids containing electric loads such as: pumps, elevators, interruptible loads, lightning, and generation units. The EMS of a shipyard drydock involves modules for improving the accuracy of the load forecasts, thus reducing the electricity cost [
23,
24]. A ship with a PV generation system, diesel engine, battery storage, inverter, and control system, was experimentally tested to minimize fuel consumption [
25]. Other hybrid usage of power sources, in a micro-grid power system of a sightseeing ship, with a control strategy in terms of higher efficiency and lower emissions, were presented in [
26,
27].
An LNG tanker is a ship with a specialized LNG cargo control system, for the transportation of liquefied natural gases, at temperatures close to the vaporization temperature −163 °C. Despite tanker insulation, which is designed to limit the entrance of external heat, any small amount of heat will produce a small evaporation of gases. This is the natural evaporation gas, named boil-off gas BoG, which must be removed in order to maintain the tanker compartment internal pressure.
From the publications studied, we found that the most reported cases that integrated RES in their energetic systems are touristic cruise ships. The energy demands of touristic cruise ships are dedicated to the comfort of passengers and tourists, which together with the crew can be from few hundreds up to approximately 6500 persons.
In our case, we undertook the modernization of a big ship, an LNG tanker, with energy demands mainly for the installed machineries for propulsion, keeping and handling of gas cargo, while the number of persons on board was usually as small as 25–35, or maximum less than 50. Specifically, we considered that an important amount of electrical energy is demanded by the propulsion motors, charge and discharge of liquefied gas, conservation of gas cargo at the correct conditions of temperature and pressure, while the personnel on board were only 30 persons.
From a review of the available literature, we did not find a similar study case, such as adding RES-based energy generation units to an LNG tanker for saving of fuels and reduction of pollution. For this reason, the comparison of our results with those of other similar researchers was not possible.
This work undertakes the topic of an LNG tanker and studies the way of improvement of costs of fuels consumed while, at the same time, it diminishes the CO2 emissions by integrating RES-generating units in the electrical energy plant of the ship. We developed a new model for the electrical energy system of the LNG tanker, taking into consideration the existing thermal power units of the ship and the proposed RES units.
Taking into consideration the big size and the kind of ship, (tanker), and the large costs of installation, our research is delimited to the building of model and computer simulation and finds numerical solutions in different true-cases simulated scenarios, without having the possibility of real-world implementation.
By introducing RES in the ship energy system, we intend to lower the costs of fuels and the emissions, or, possibly, minimize the costs of fuels and the emissions. Our work presents a new model for integrating ship environment and RES, under the considerations of saving fuel, reducing the operational costs and the emissions. The model and algorithm utilize-Matlab as a simulation environment. The model uses cargo ship parameters and external data, applying an analytical simulation according to defined specific power needs varying versus time. The model evaluates the ship time-varying operation in terms of power, integrating a combined operation of thermal engines and RES. Additionally, system simulation reveals the capability of RES to undertake quantities of ship load demands, thus balancing the costs for the integration of RES in any type of ship. The analytical model uses the accurate prediction of ship power demands and direct assignment to the available on-ship RES resources: PV panels, WECs, and batteries. Other types of RES can be integrated into this model for future expansion. This is feasible since all units embedded in the model are implemented as independent modules and functions.
Management and assignment of power sources to load demands focuses on a reduction of CO2 emissions. A number of alternative algorithms and approaches can be applied for the realization of EMS using Finite State Machine FSM according to ship type and application, and are available on installed ship engines and generators, inducing power demands, fuel and gas efficiency factors, etc. The ability of using different types of decisions and algorithms for EMS realization through this model defines a major fact for the introduction of simulation models, in order to make numerical calculations for the evaluation and operation of proposed algorithms. Using our simulation model, we evaluated a performance metric for algorithms according to ship requirements, to control EMS states and transitions. Our conclusions are that, following the EMS decision algorithm for power management, we achieved savings of fuel, and a reduction of CO2.
In the following,
Section 2 presents the structure and interoperability of the ship energy system modules.
Section 3 describes the control system structure, the model, the description of states and transitions, and assigns modules to real parameters for LNG tankers to continue onto the simulation with an accurate parameterized model of a ‘real’ ship.
Section 4 implements two simulation scenarios, by setting constant cruising conditions (ocean cruising) and variable cruising conditions (harbor approach), and the control of generation and power demands. Variable cruising conditions due to continuous adjustments of ship speed and floating direction introduce variable conditions of operation for RES since these modify sun radiation levels for PV systems and wind velocity for WECs, and because all RESs have been placed onto ship external decks.
Section 5 discusses the obtained results for the applied scenarios, focusing on the performance.
2. Ship Energy System
LNG tankers use the BoG as fuel for the propulsion system. Thus, the LNG carriers can be powered by BoG, driving Diesel engines, and Dual Fuel DF engines. A DF engine is a diesel engine that can receive both liquid and gaseous fuels. When the DF engine is in gas mode, the air–fuel mixture is fed to cylinders during the suction stroke, while when DF is in diesel mode, the MDO is fed to cylinders at the end of the compression stroke. The DF engine for gaseous and MDO fuel is used for a back-up fuel operation. Thus, a DF engine operates with either natural gas, light fuel oil, or heavy residual fuel oils. Switching between fuels takes place during operation, without loss of power or speed. The DF engine has the same level of power output regardless of the fuel used and drives a generator to supply electric energy to electric motors that drive the propeller [
28].
The total cargo capacity is split into independent horizontal tanks under the deck, at a maximum pressure of 4.20 bar and a minimum temperature of −163 °C. While using the BoG from the LNG cargo to generate power, engines have a lower fuel consumption, and thus, lower operating costs than the conventional steam turbine engines. The electric propulsion system for LNG carriers consists of electric motors, with electric generators driven by Diesel or DF engines, which run with BoG or MDO. The electric generators supply the ship electric network and the electric motors in a variable-speed according to the drive system for propulsion. The equipment for gas loading or unloading, the handling equipment for BoG and the fuel supply system consists of submersible cargo pumps for fuel gas supply, compressors, heaters, vaporizers to heat up the gas and a cargo reliquefaction unit. The vessel is equipped with winches, anchors with drums, hose handling cranes, lifeboats, rescue boats and crew cabins, that constitute the electric loads and the total electric load demand of the ship.
Diesel–electric propulsion units were used as prime movers, due to the AC drive technology, developed in the central power station for propulsion and ship services. Many other vessels are equipped with electric propulsion plants, such as cruise ships, ferries, chemical carriers, offshore vessels, icebreakers, and research vessels.
The BoG solution produces lower levels of CO
2 emissions compared to traditional MDO technologies. Tests with DF engines shown that at low speeds, the engine performance complies with International Maritime Organization IMO regulations regarding the NOx limits when operating on gas [
29]. The CO
2 emission index is used to evaluate the ship design, and compares theoretical CO
2 emissions with real emissions during cargo transport.
One alternative is to introduce the DF diesel-electric concept, where the electric propulsion is done by electric generators driven by DF engines. The generators supply the ship electrical network and the propulsion motors in a variable-speed drive system. For electric pumps, one generator supplies the power demand, [
28]. If the gas supply is interrupted, the DF engines can automatically switch from BoG to MDO. While using BoG to develop useful power, a higher efficiency is obtained due to less MDO consumption. A DF-electric system has 30% higher efficiency over the traditional installation and lower emissions. Another advantage is the use of exhaust gas from boilers to heat the ship and cabins.
In our case, the thermal gas generator is of a DF type, and can run either with BoG or MDO, under the conditions of automatically switching between the two kinds of fuels when the EMS sends the command for state transitions. For reasons of clarity, we will denote this unit as LNG, and will consider that the fuel supplied is mainly gas, and only in back-up extreme conditions receives MDO.
The ship cruise propulsion demands studied by us, as well as all of the other load demands, are covered by three installed thermal engine generators: two Diesel Generators DG1 and DG2 and one Liquefied Natural Gas Generator LNG, and the RES-based generating units: Photovoltaic panels PVs, Wind Generators WECs, Batteries for energy storage, and supply the network, and power converters rectifiers–inverters ac/dc–dc/ac.
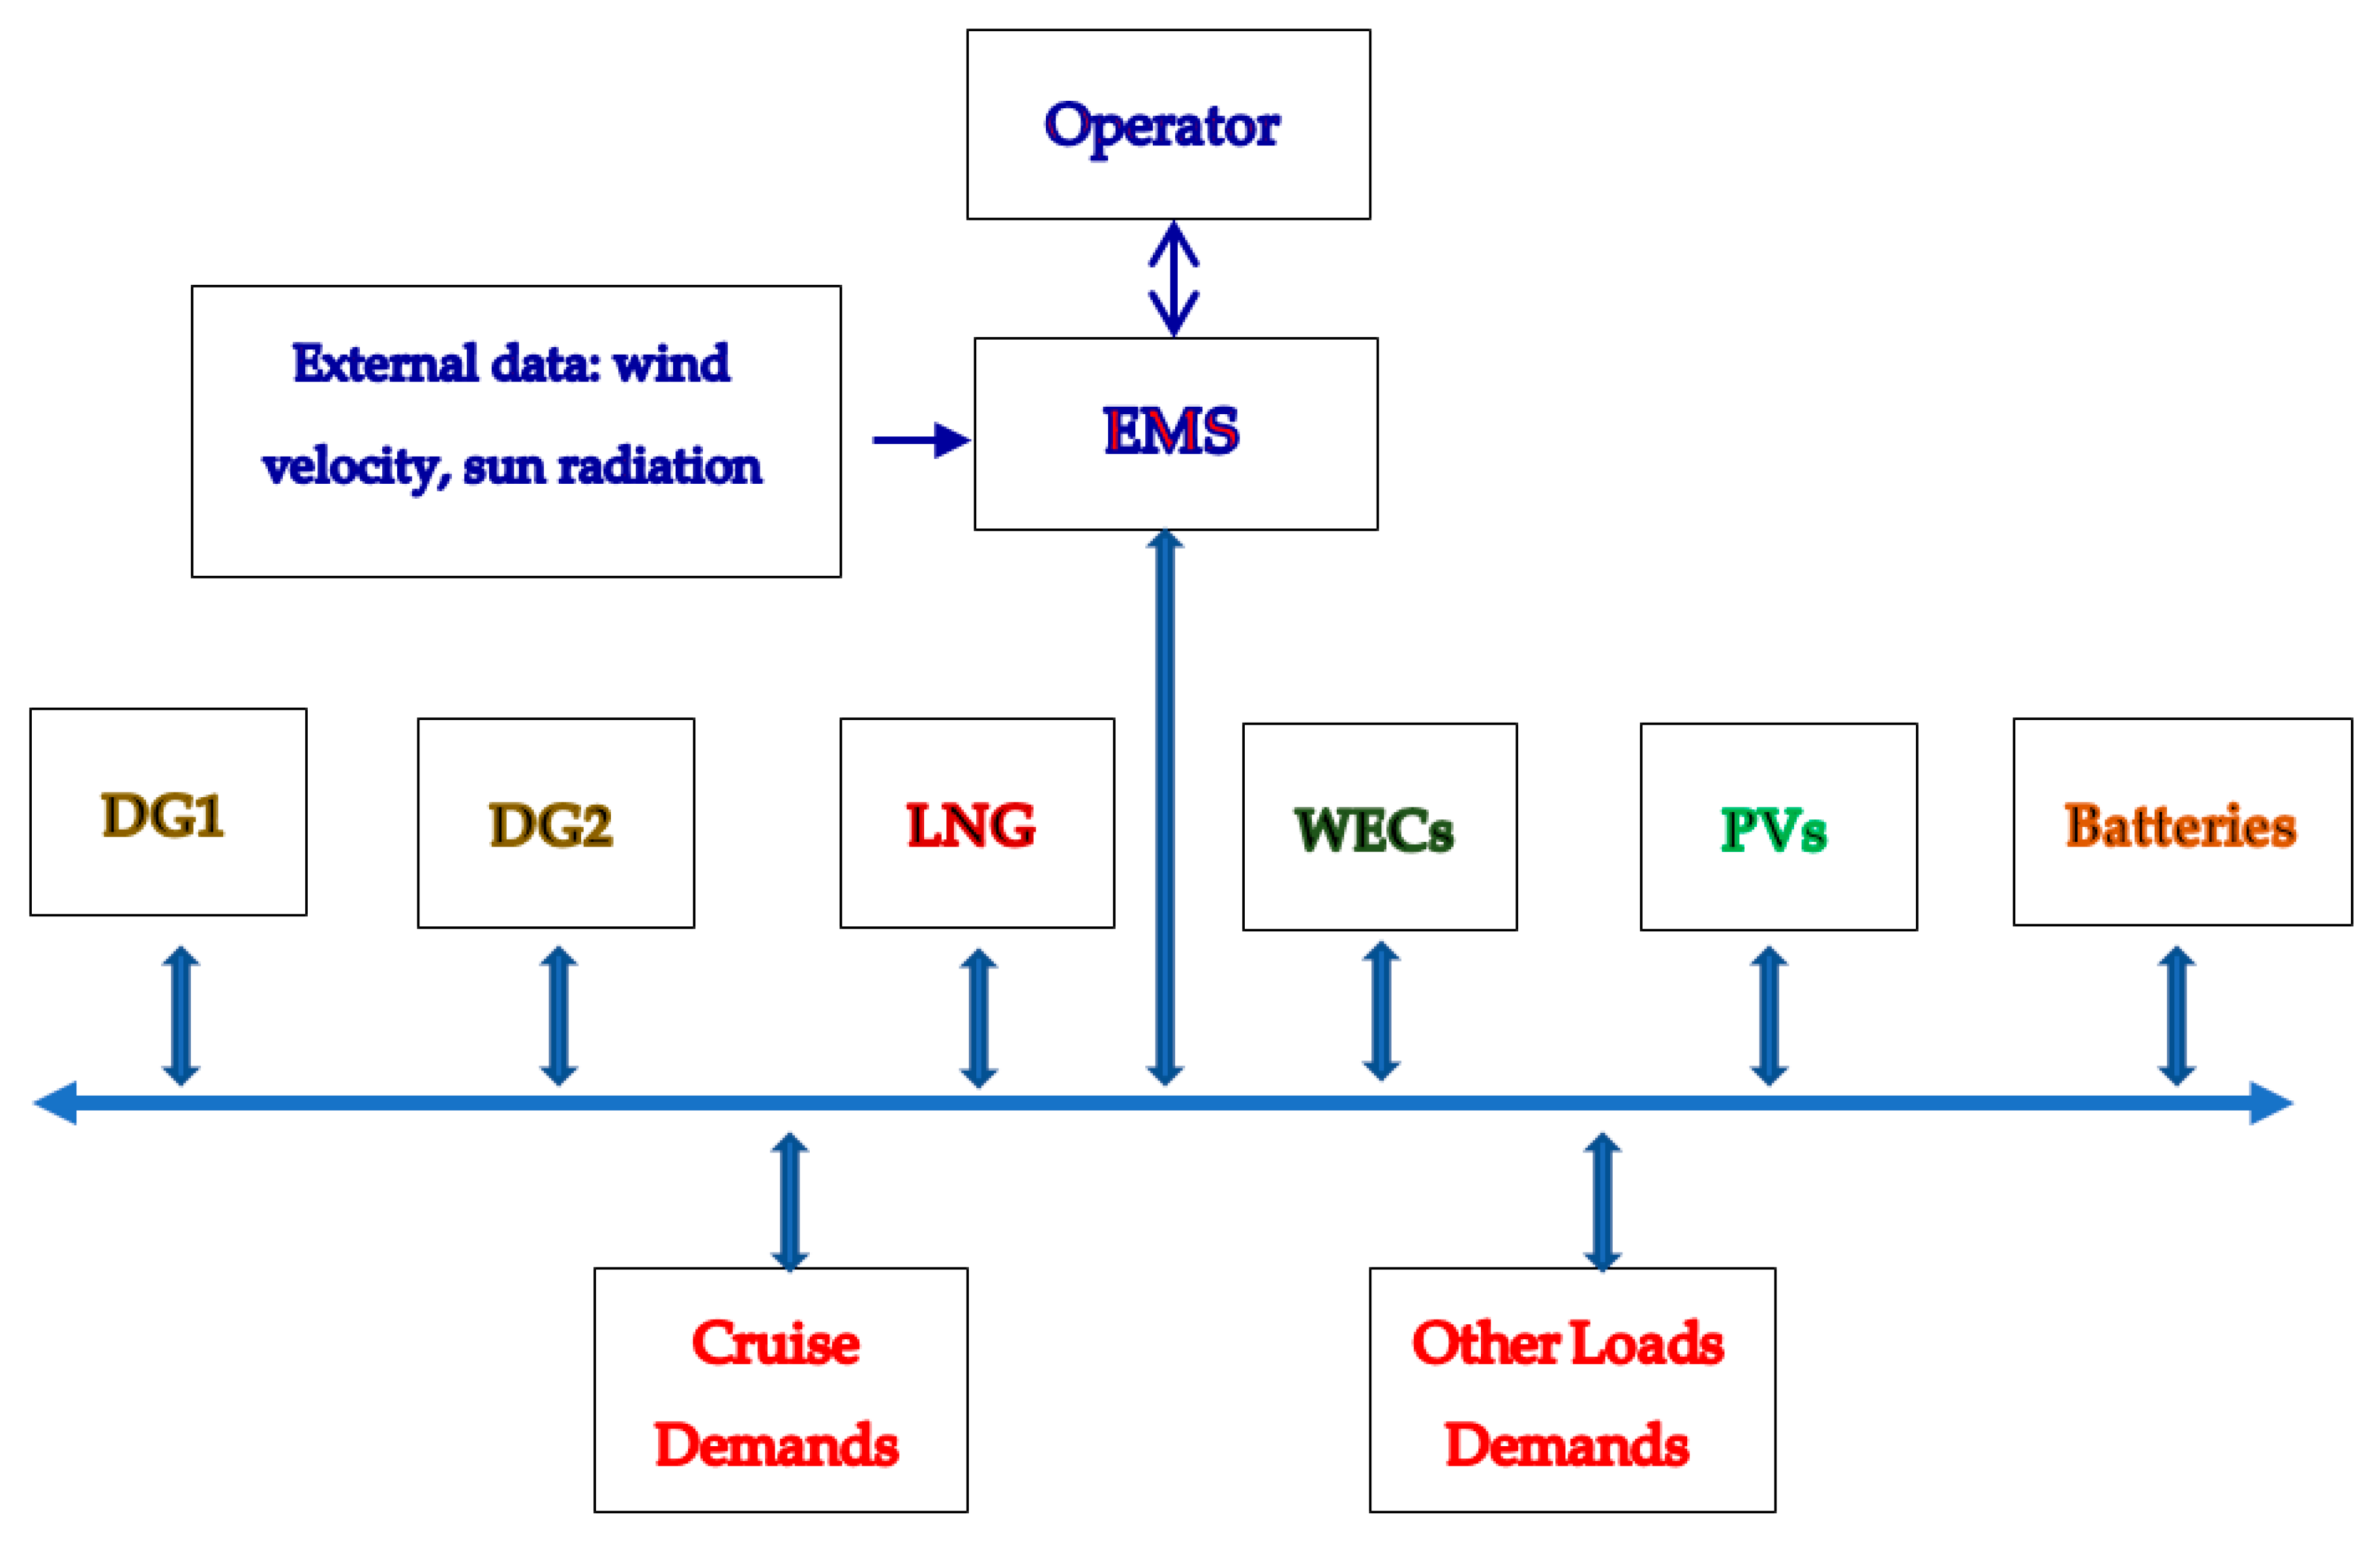
The ship energy system is built up of thermal generation units, RES-based generating units and time-varying loads, involving structural subsystems for the power generation and consumption: PVs, WECs, DGs, LNG, Batteries and EMS. The ship’s power management is implemented by the EMS, which controls the power dispatch between generating units and load demands, during different time periods and operating conditions. Thus, the EMS, depending on the detected states, switches dynamically and achieves a power balance vs. time, when power resources and load demands vary.
Figure 1 shows the energy control system with the EMS, generating units and electric loads (propulsion motors, pumps, compressors, elevators, lights, fans, heating-cooling, air conditions, cabins, etc.).
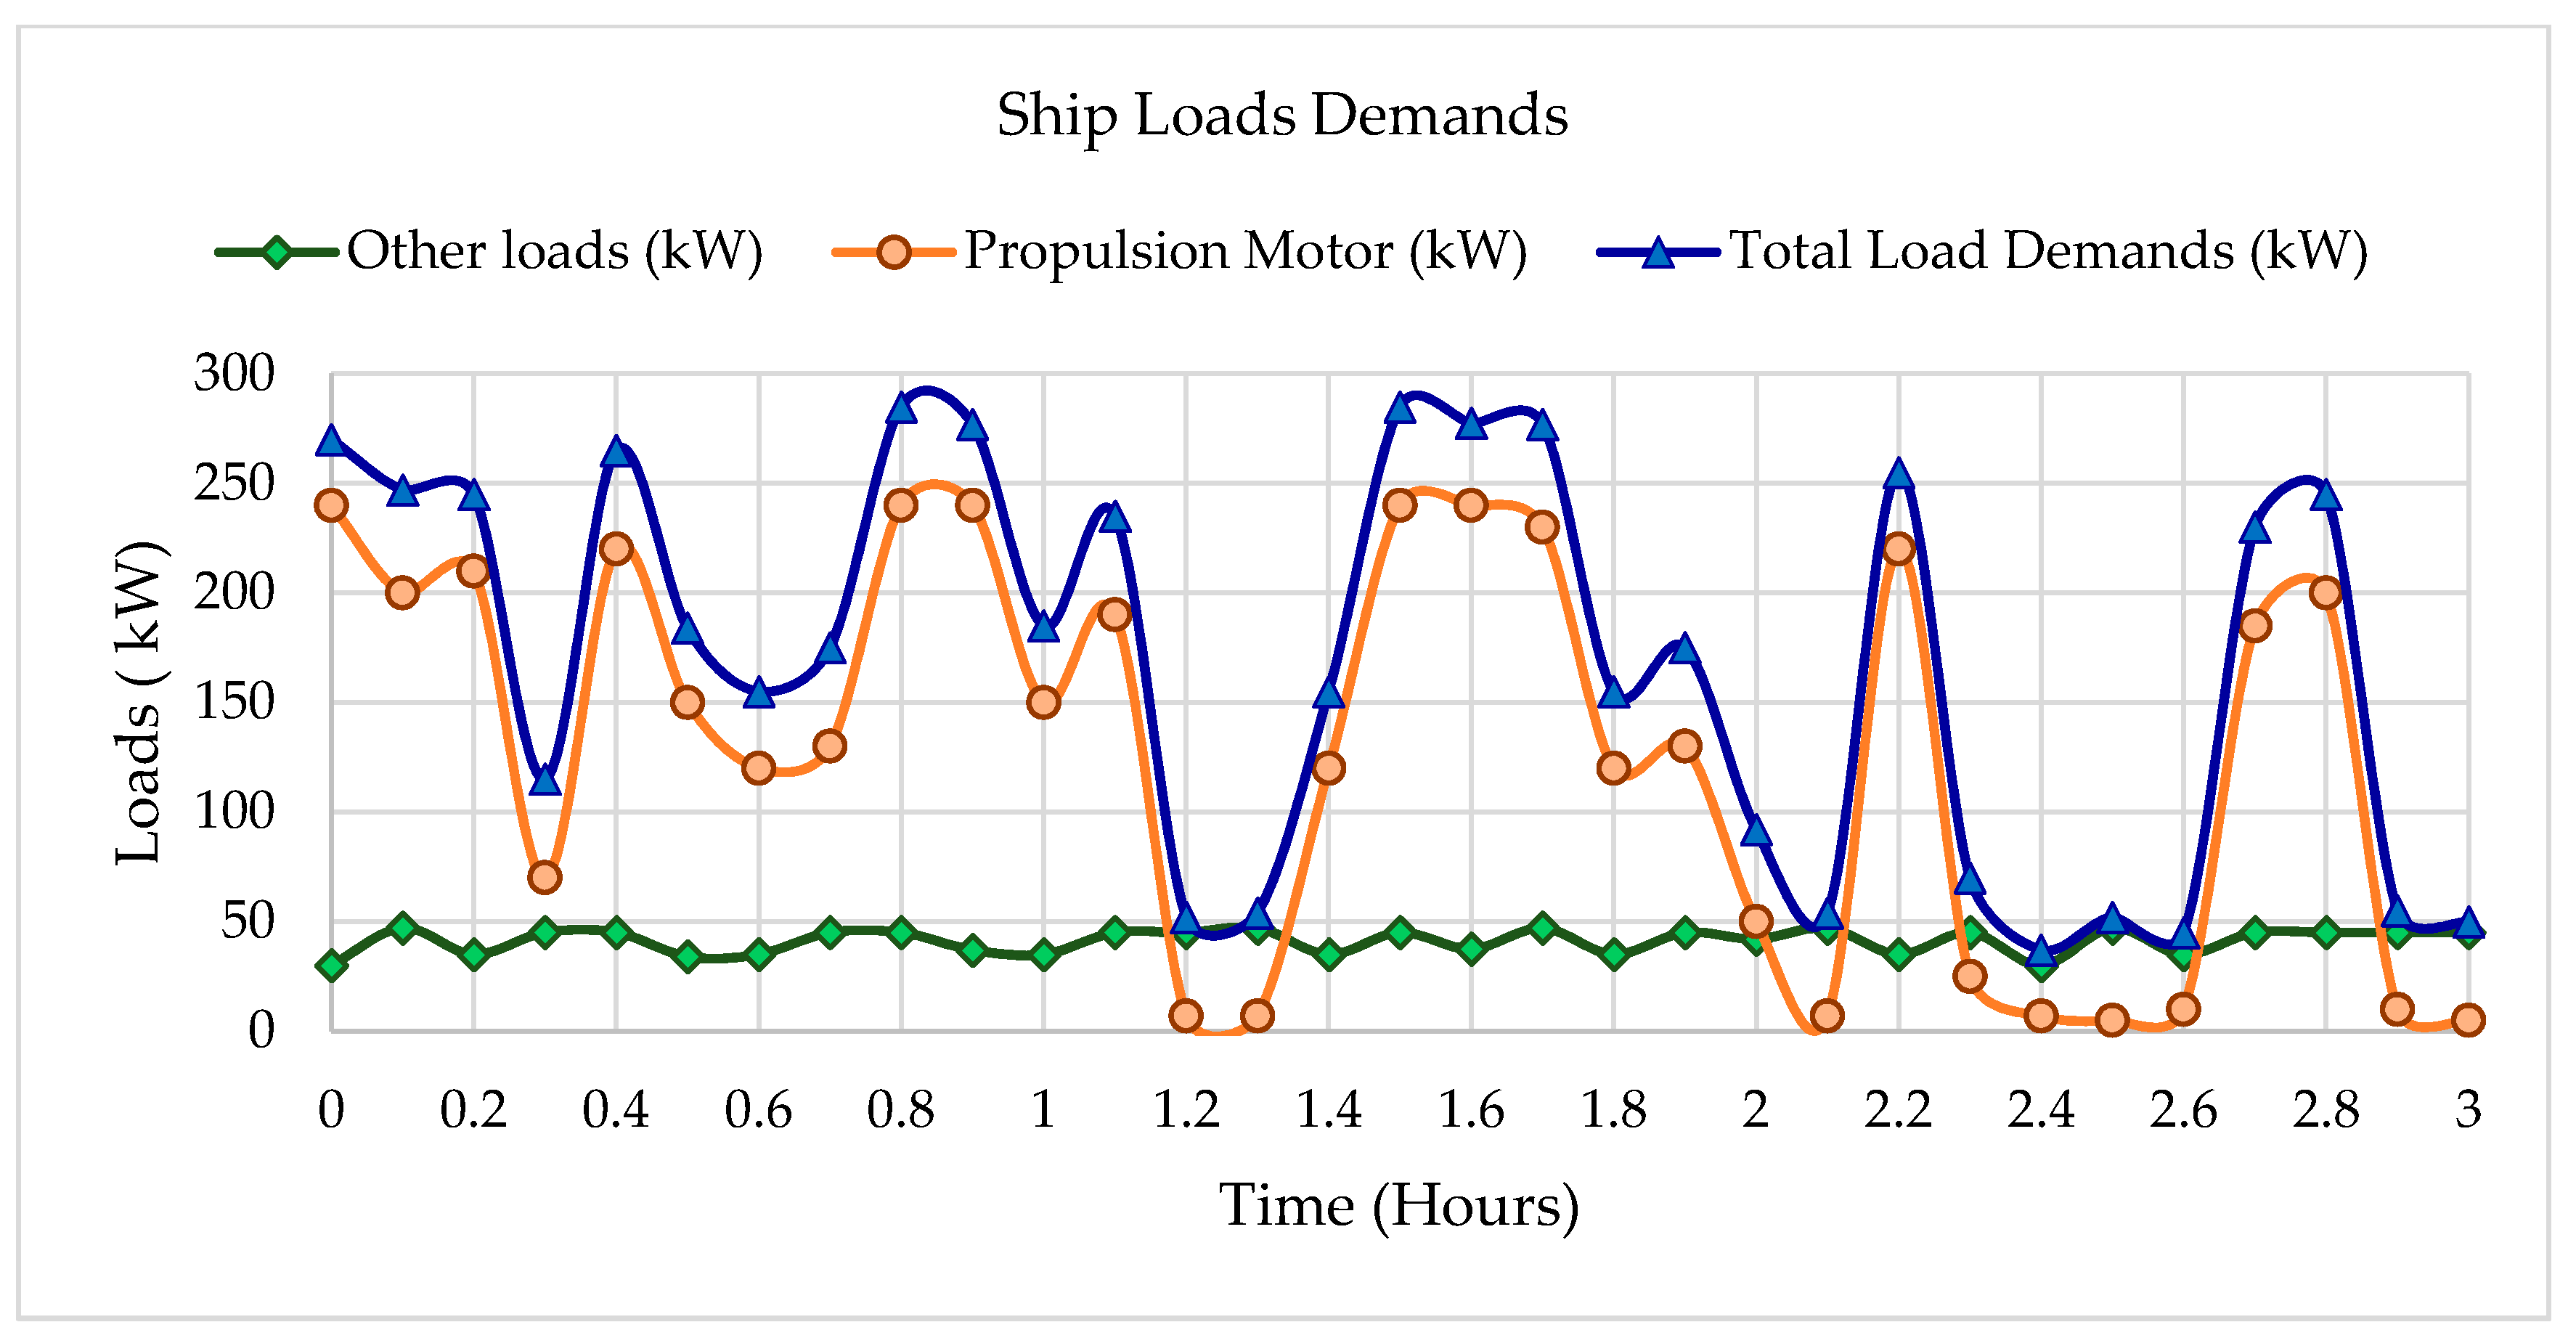
An estimation of ship electric loads varying versus time with one propulsion motor, is in
Figure 2. Depending on cruise conditions, a second propulsion motor can be connected, or disconnected to the propulsion system. It is estimated that the propulsion electric motors represent the ≅ 90% of the total electric load, while the other electrical installations and equipment represent the ≅ 10% of the total electric load.
The RES system has installed WECs capable of operating at a large range of wind velocities, without rotational and structural problems due to increased tensions, compression, bending, and torsion over their wings, which could result in reduced operation during stormy conditions. Rectifier–inverters convert the generated ac voltage of WECs to 3-phase voltage 380 V/50 Hz and supply the ship’s network [
30,
31]. Many batteries are connected (stacked) to form a battery grid array, allowing a charging interface at 24 V. Batteries total charging capacitance is 2000 Ah.
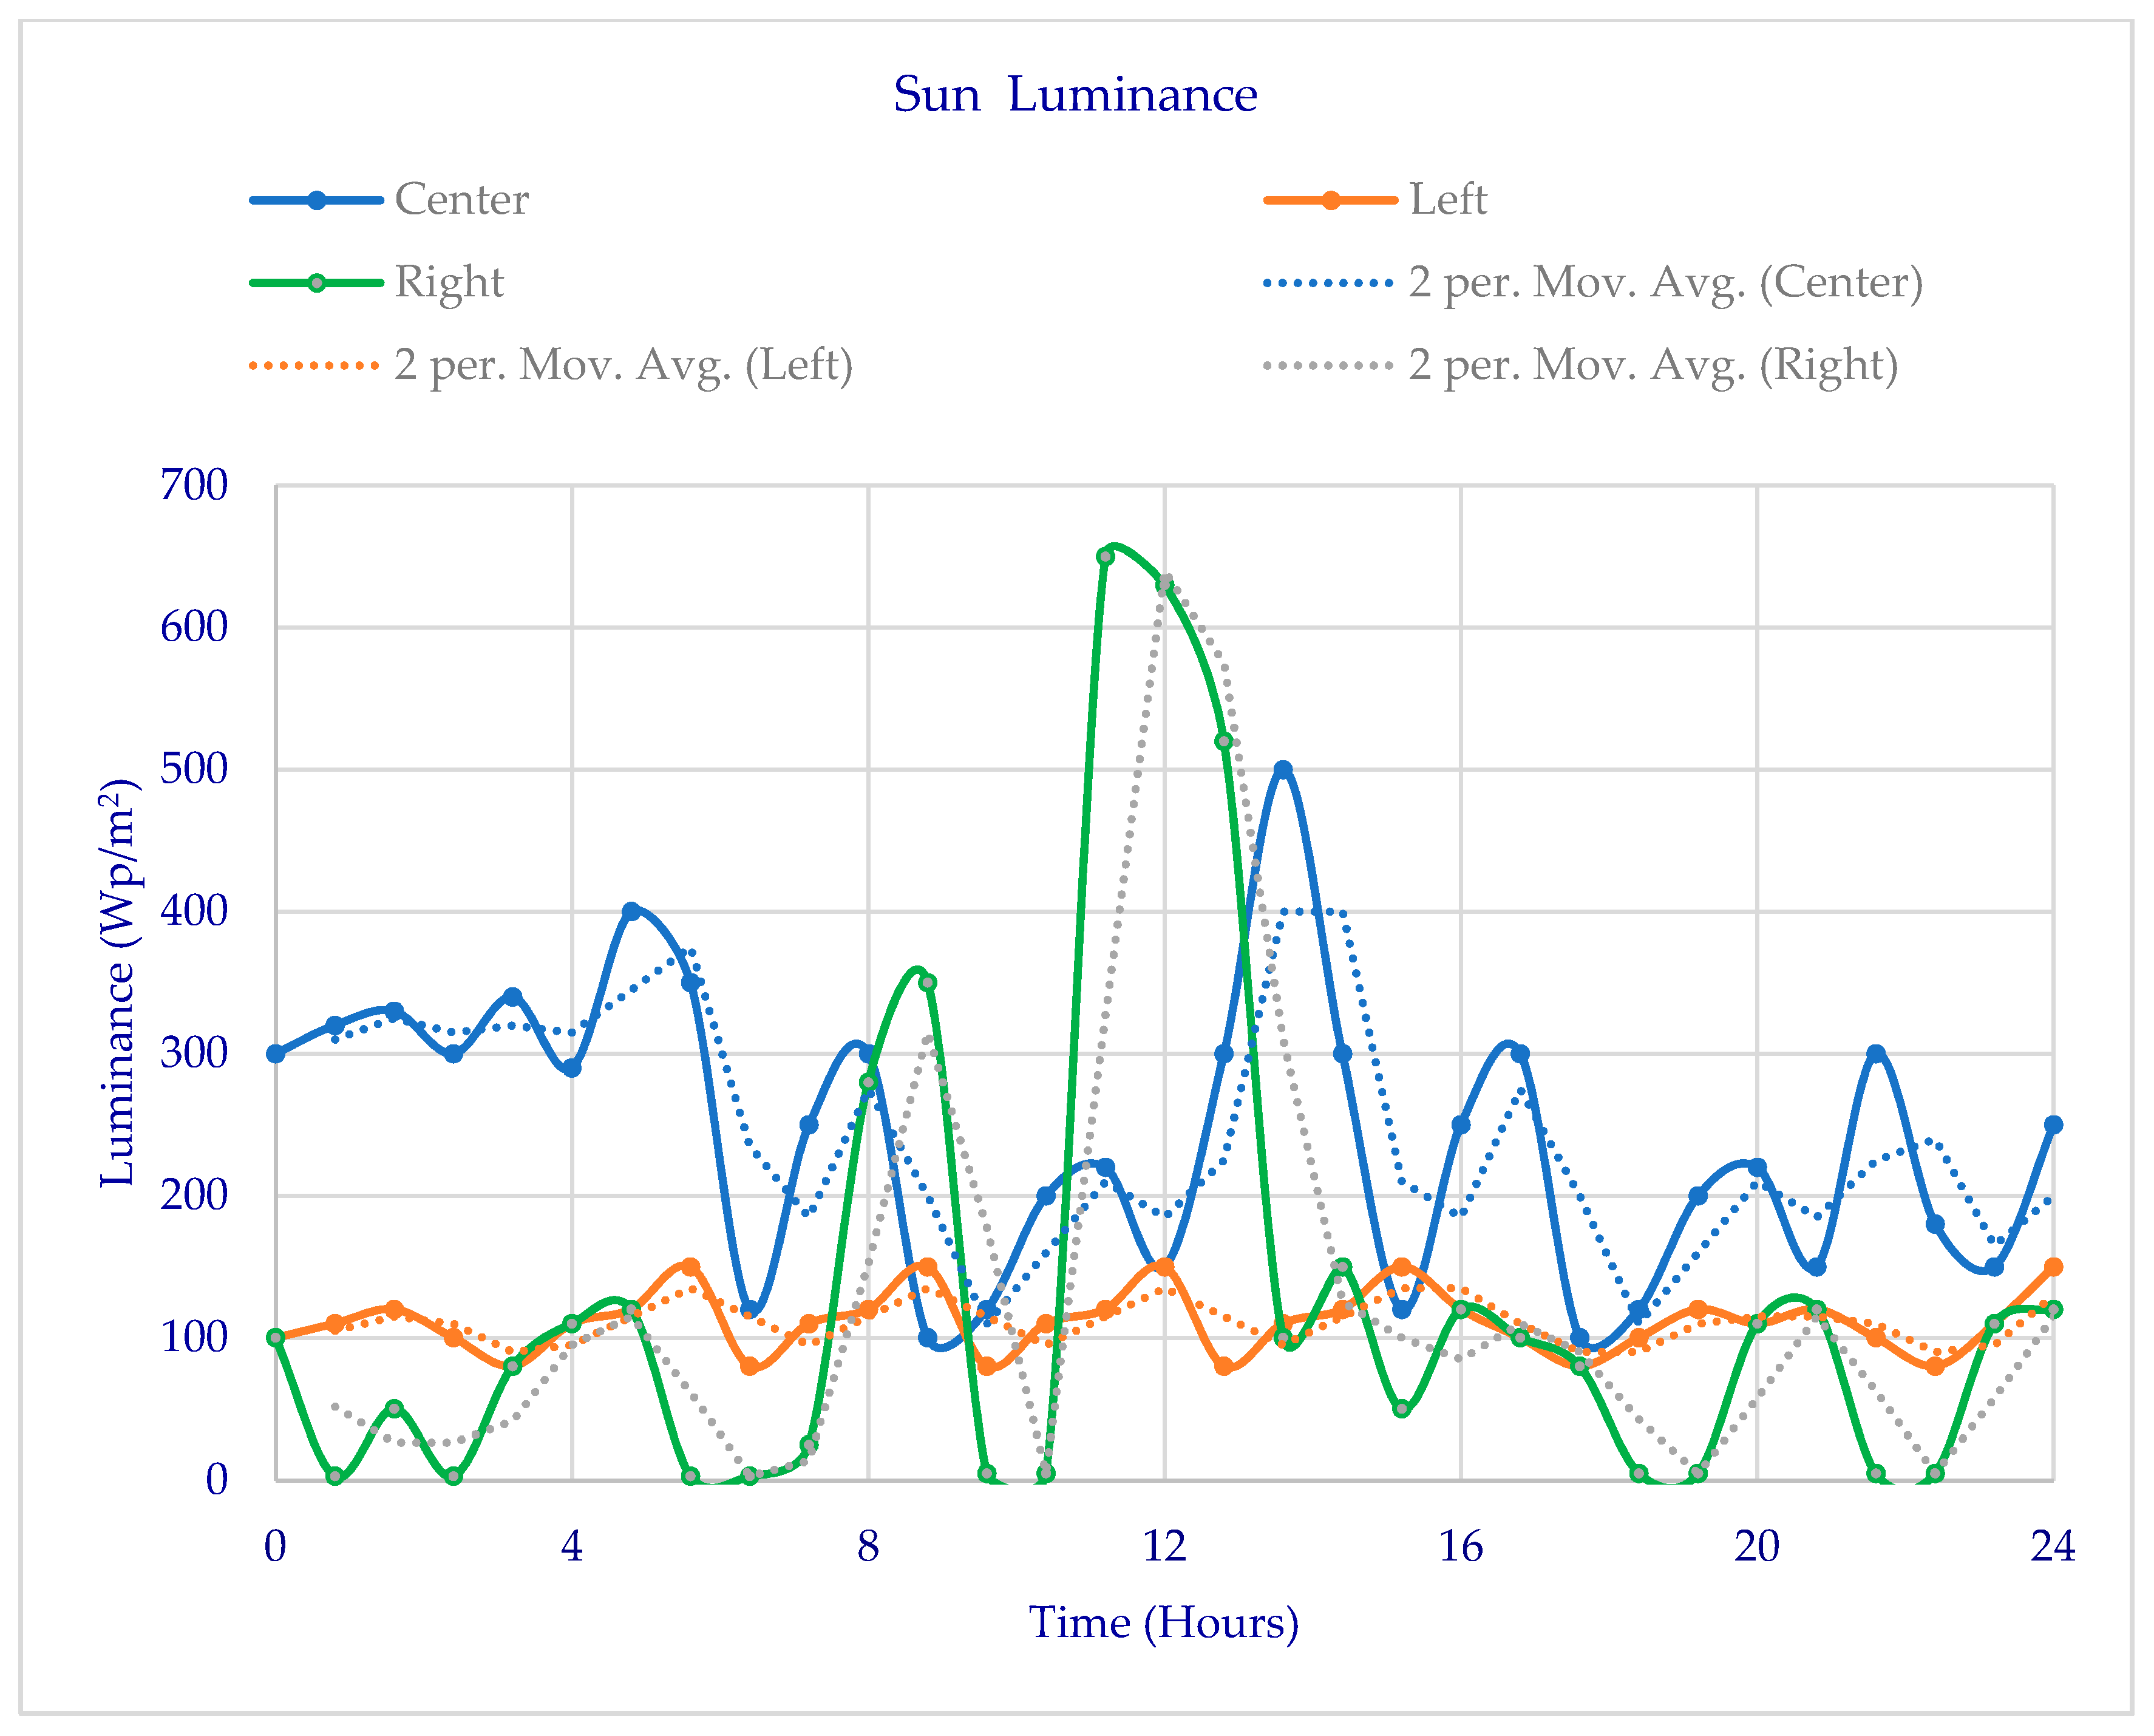
PV panels are distributed over three decks of the ship. Thus, three different sun radiation data files, corresponding to each deck, are required for the model. The inverters convert the dc voltage generated by PVs to 3-phase ac voltage 380 V/50 Hz. We consider that sun radiation levels are periodically modified on a daily basis and are also dependent on the months of the year, on geographical coordinates longitude and latitude, and consequently, depend on the cruise routes of the ship,
Figure 3.
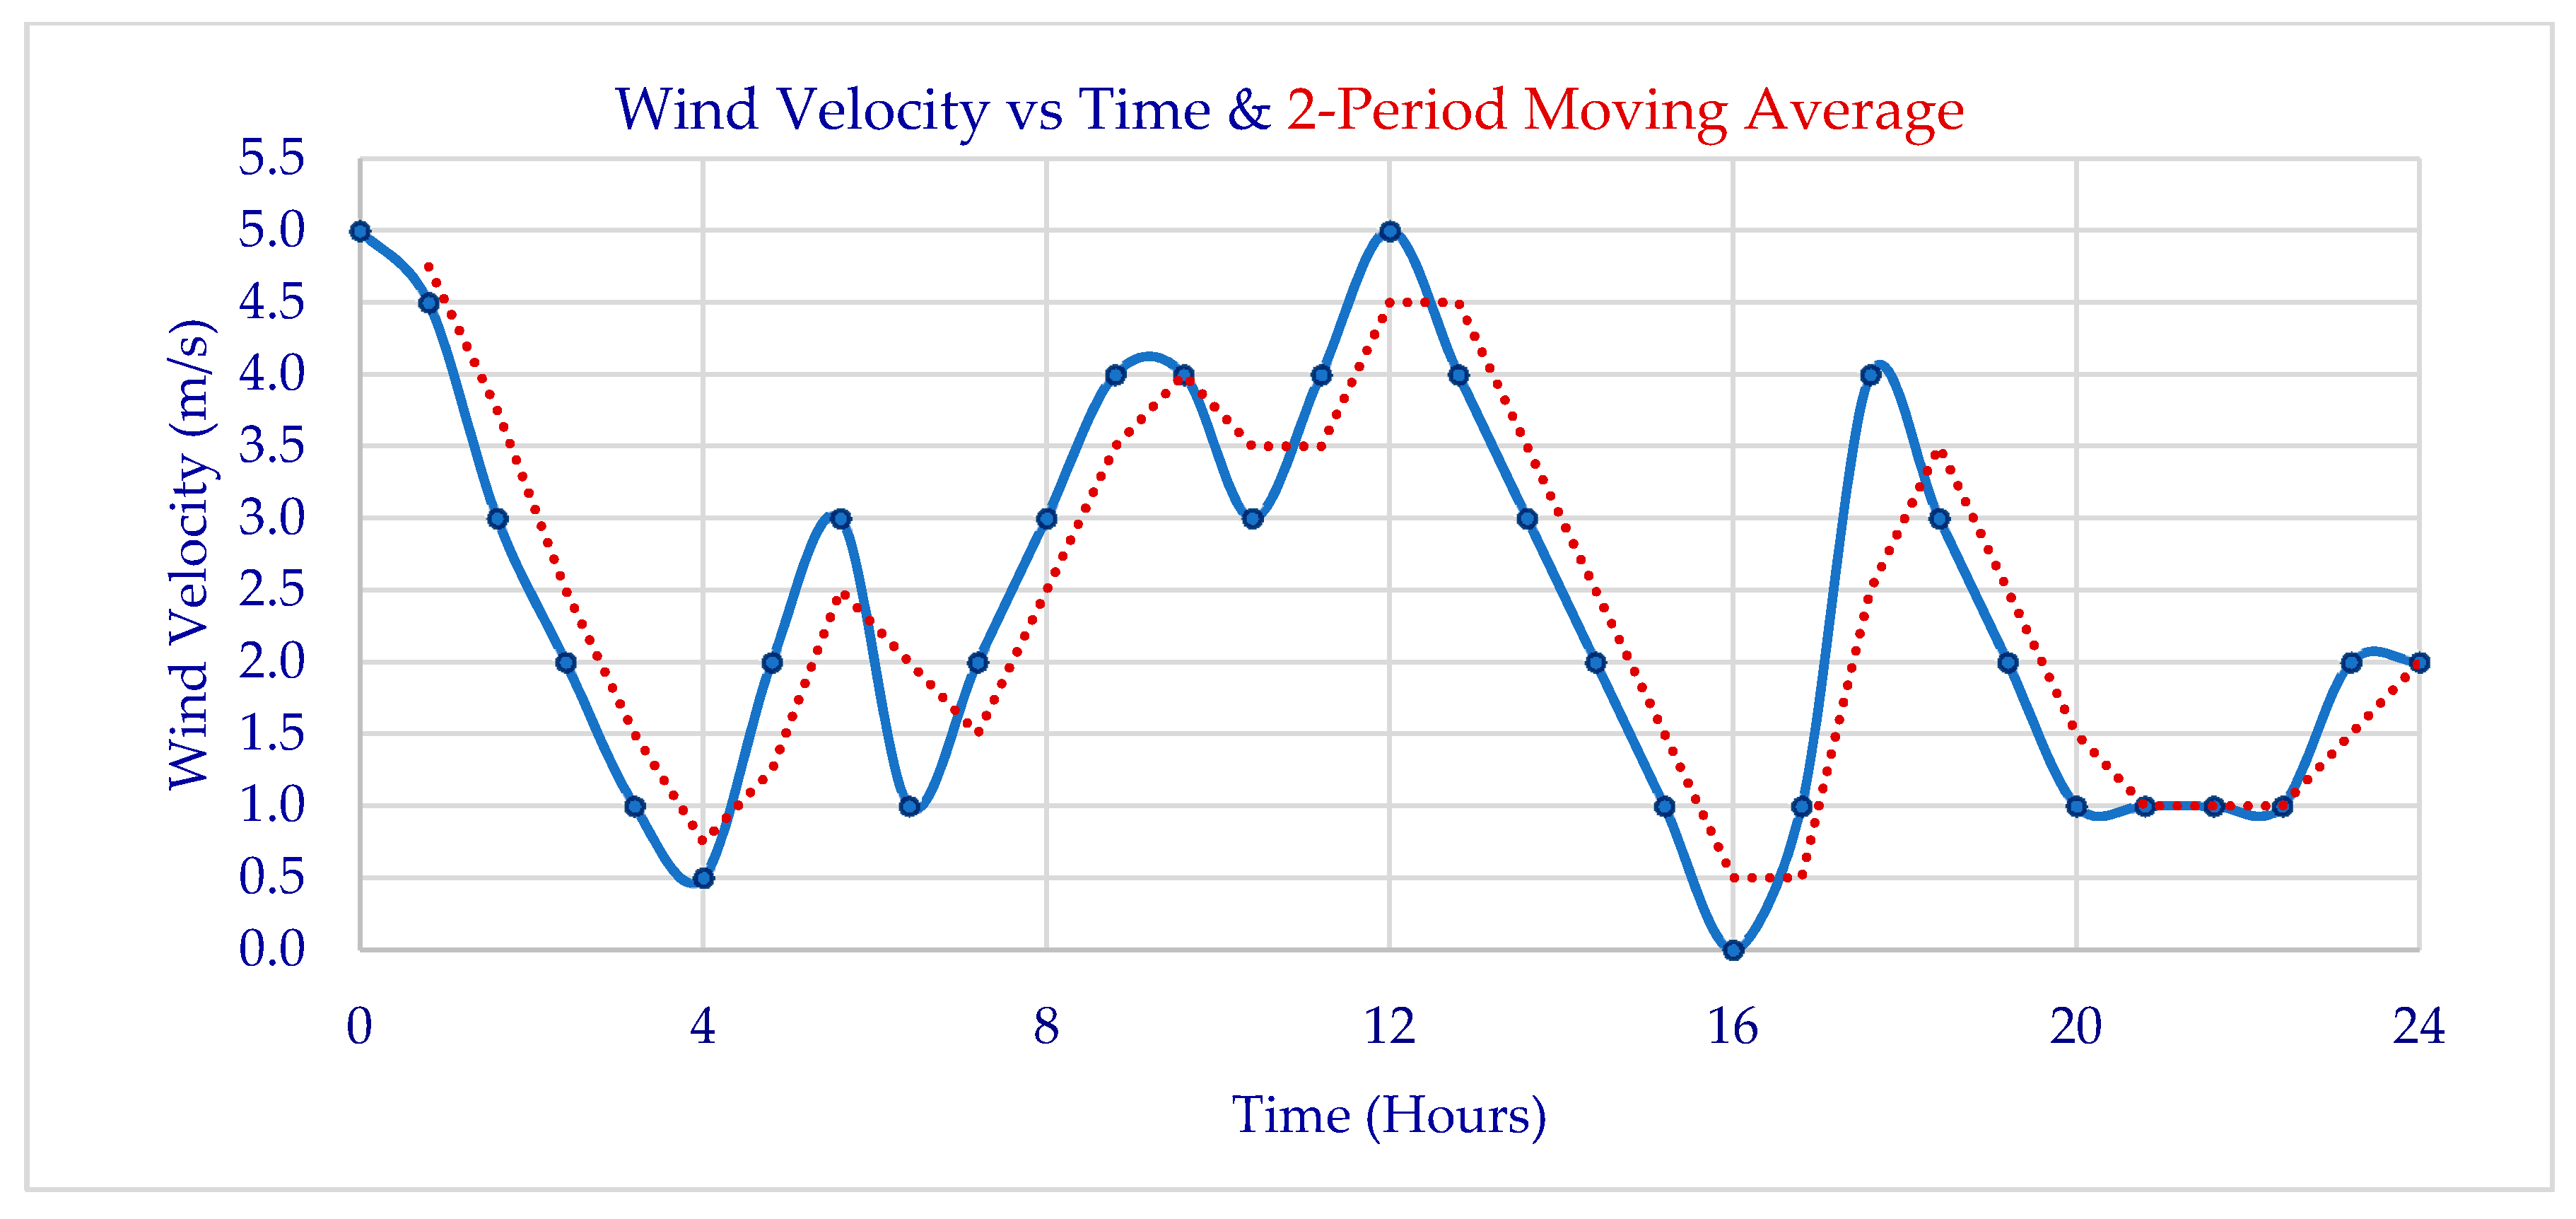
The simulation for WECs uses one wind velocity file for all decks because, during the ship cruise, the wind speeds are affected by geographical zones, and day, or season conditions only, as shown in
Figure 4. The external data files provide information for the wind velocity and sun radiation levels and, thus, the model has the capability of alteration of weather conditions according to the examined scenario. Ship system managers (operators) can select weather, wind and radiation conditions according to different scenarios, allowing the different simulation of different cases and performance evaluations for the system. The ship power management implemented by the EMS uses intelligent techniques that performs an optimal power dispatch of generating units for the load [
25,
32].
The model relates the simulation process with realistic cruise scenarios in order to evaluate (a) ship power cruise conditions; (b) prediction of fuel consumptions and gas emissions; (c) management of power generation; (d) available resources through time. The model has been implemented using Matlab Script Language [
33]. All modules have been defined as functions and code sections. These functions are called during the simulation process versus time, based on numerical calculations, and returning results for every simulated operation point. The simulation process is controlled by the user, defining the simulation period for script model execution. Additional parameters and data are provided to the model using the external data files, offering data versus time.
These external data files integrate in time: sun radiation,
Figure 3, wind velocity,
Figure 4, and ship power load demands,
Figure 2, varied through time for the period under consideration. The model uses the following data files as data resources (in spreadsheet format) for configuration purposes of the external parameters: Ship load demands file, Sun radiation file and Wind velocity file. All these data are user-defined prior to the simulation process in order to implement realistic simulation scenarios. The moving average values are computed from available external data, and introduced in
Figure 3 and
Figure 4 for the replacement of fixed values of sun radiation and wind velocity in intermediary situations.
3. Control System for Energy Management
3.1. Definitions, Input Variables, Output Variables
The EMS controls the operation of ships’ power system modules PVs, WECs, LNG, DGs, Batteries, vs. time, applying commands for cut-in and cut-out of the generating units and loads [
34]. The EMS is designed and implemented in a Finite State Machine FSM structure. The FSM structure consists of a finite number of states, at any given time. The FSM changes from one state to another when it receives changes of input variables and is the transition. Thus, FSM is defined by its states, and input variables that activate transitions [
35,
36,
37].
To model a ships’ systems and subsystems, FSM selects operational conditions from transitions between states. However, for our FSM system it is a complex task to define all the possible transitions: at each step, each component can remain at the same state of a previous step, or make a transition to a new state.
The EMS receives the input variables (
Table 1), connects, or disconnects the generating units, and upon call completion returns the output variables (
Table 2).
3.2. The Mathematical Model
The mathematical model with EMS is implemented in the FSM system, which monitors the tanker’s power demand and power generation, making use of all power sources. The on-board available power sources include the installed thermal engines DG
1, DG
2 and LNG, as well as the RES installed on-board, which are the PVs, the WECs and the batteries system. The modelling of WECs in autonomous systems and the electric power dispatch with thermal power units was previously studied [
32,
38,
39].
Electric power demands are met by setting levels and conditions for decisions for transitions between finite states. Thus, the central power distribution controller EMS controls the transitions in different states, activating, or deactivating, the suitable state from the available power sources.
We identified 12 (twelve) finite states which are described in detail in
Section 3.2. For the steady state operation in the twelve finite states, the mathematical model based on the equations of generated electrical power, load demand and power balance are in Equations (1)–(16). For reasons of simplifying the structure and understanding of the model, we will eliminate the use of states’ index j = 1, …, 12 from each one of the following equations. Thus, for each state j = 1, …, 12, the Equations (1)–(16) constitute the mathematical model (without showing subscript j).
The Power generated by diesel generators DG1 and DG2:
where for each one of DG1 and DG2,
is the efficiency,
is the fuel coefficient and
is the quantity of fuel supplied. From Equation (1) we write successively the equations for the two diesel generators, DG1 and DG2, using the subscripts
1 and
2, P
d1 and P
d2. Then, for each one of DG1 and DG2, we write the balance of powers, for power requested and power provided:
The Power generated by LNG generator is:
where
is the efficiency of LNG generator,
is the fuel coefficient and
is the quantity of fuel supplied to the LNG generator. The balance of powers for the power requested P
gr and power provided P
g by LNG generator is:
The Power generated by the wind generator is:
where:
is the efficiency of each wind generator,
is the power coefficient according to Betz law,
3 is the density of the air, S
w = cross sectional area of the wind turbine (m
2), V
3 = the wind velocity at 3rd power.
The Power generated by PV generator is:
where:
is the efficiency of the solar panels,
. is the surface of photovoltaic panels (m
2), and
is the solar luminance (W/m
2).
The Equations of batteries concern the power required from batteries discharge P
br, the power offered for charging the batteries P
bc, and the state of charge of batteries:
where the state of charge is 0 < S
oC < 1 and P
L is the total electric load.
The Equation of Load Demand is:
where Pk is the load of each one of all n electric installations and drive systems such as propulsion system, pumps, compressors, heaters, vaporizers, lighting, etc.
The total power generated P
T is:
where P
s is the amount of spare power of the electric system, that is not necessary and can be dissipated.
The Power balance equation is:
The Power bound equations are:
In the next
Section 3.3, in
Table 3 are the necessary and sufficient conditions of the above mathematical model.
3.3. The Finite States and Transitions
We defined the models of each state in Equations (1)–(16) from
Section 3.2, the overall transitions of states, and the logical design that selects the next state at each step. Since the FSM model is logically designed, however, it is necessary to define the profile for each operating state of the system. For most states, the profile is similar but at a different power level. In each operating state, the electrical load demands are defined and the priorities are set.
First, observing the states of generating units, EMS assigns the coverage of ship load demands to the RES units (PVs and WECs), as a first priority.
Second, EMS assign remaining power demands towards batteries (if batteries preserve a suitable State of Charge SoC to undertake this assignment).
Third, EMS assigns remaining power demands towards thermal generating units. In this case, EMS directs the remaining power demands primarily to the LNG and, in case that these overcome LNG capacity (eng3_Pmax), it then directs the remaining demands to DG1 and DG2.
Fourth, activation of DG1 and DG2 by the EMS is the last priority for covering power demands because, due to fuel used (MDO), they are the most polluting generating units of the ship in terms of CO2 emissions.
Through scenarios, an important role for the system operation is assigned to the batteries, because by discharging, they offer significant amounts of power. The batteries gain back their discharged power during charging phases, in periods where the ship power needs are lowered and EMS recovers power from PVs or WECs. Decisions and state transition of EMS control the steady state power management for ship cruises, lowering the activation of the two DG units, and thus lowering the CO2 emissions.
The input variables and output variables related to the transition conditions are defined in
Table 1 and
Table 2, respectively. The description of the decision-making situations and conditions for the transition between states is in
Table 3. The EMS Transitions between the Twelve States are deducted for managing the decisions for power generation, as requested by varied load demands vs. time, and are analytically formulated in
Table 3. Transition between states happens according to defined logical conditions based on the level of power demands and available power generation. Thus, the states, the conditions for transition to each state, and the description of finite states, are organized in
Table 3. This
Table 3 shows the necessary and sufficient conditions of the mathematical model from
Section 3.2.
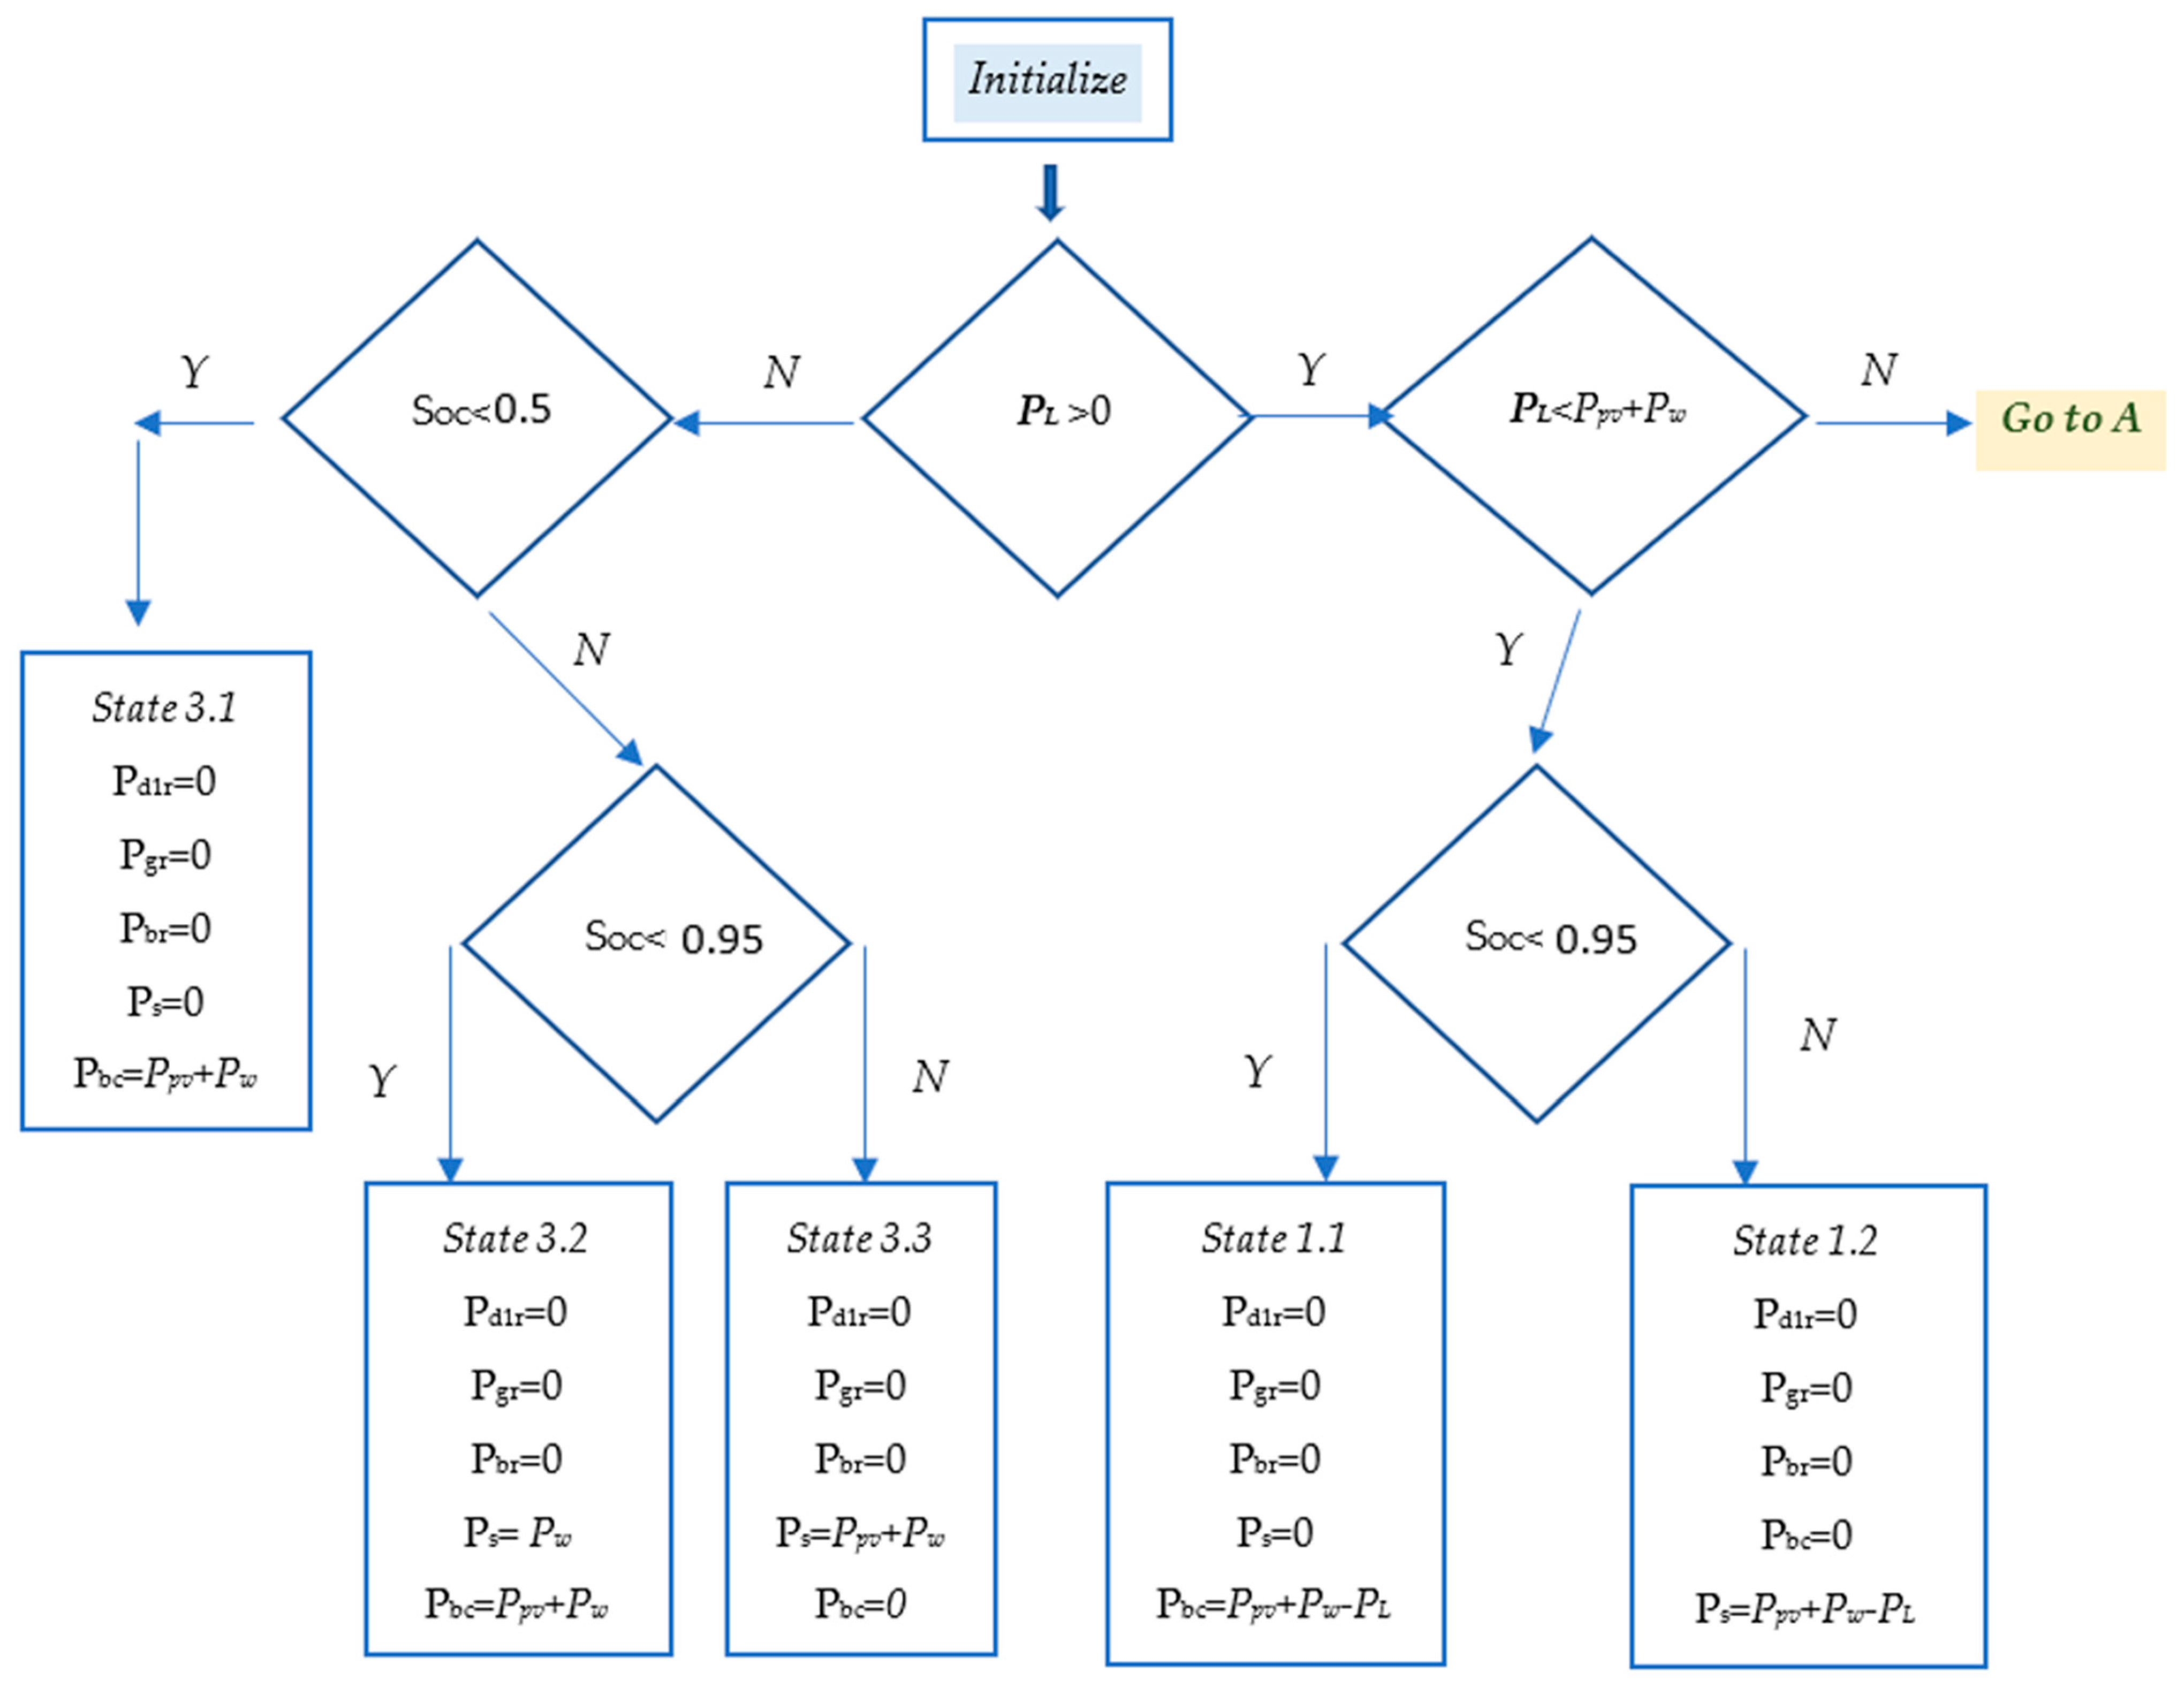
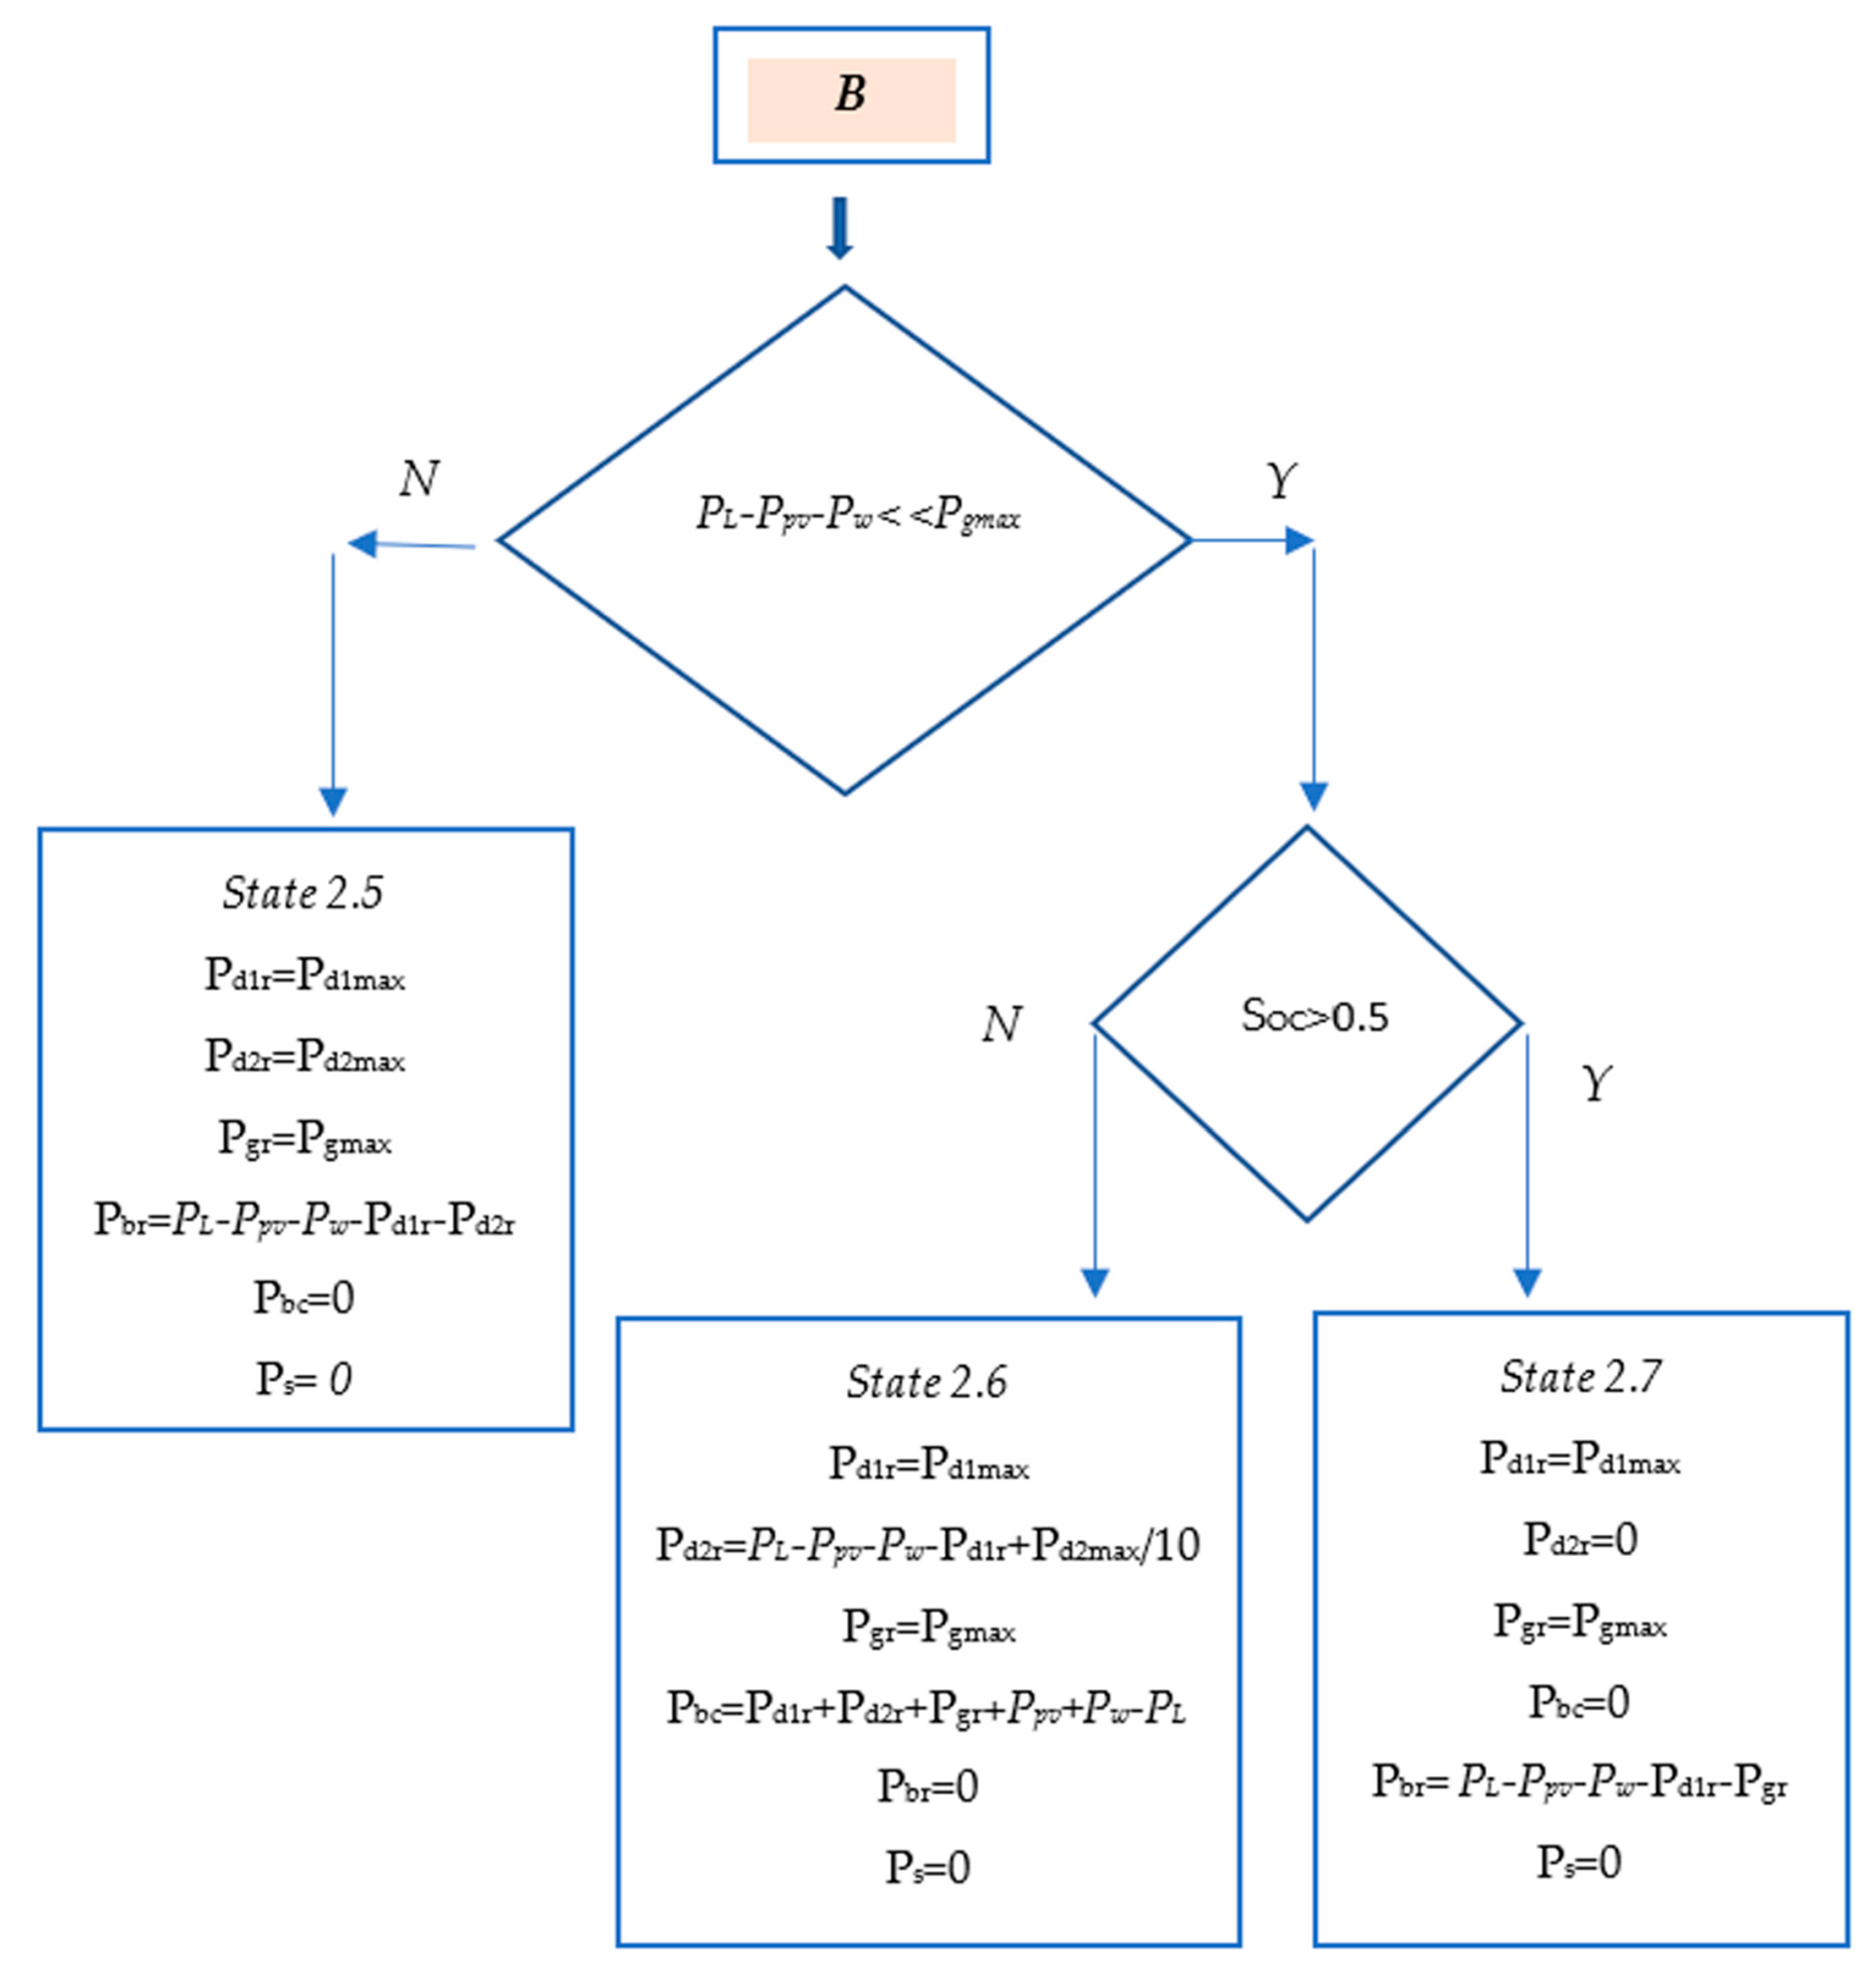
A deeper presentation of the EMS states requires the use of a flow chart. Such a flow chart was developed and organized in
Figure 5,
Figure 6 and
Figure 7, it is complex enough and is inserted within the work materials, as was used during the modelling and programming phase on the Matlab
® simulation environment. Indicatively, we estimated the operation flow chart of the EMS, which describes in a visual way the logical design of the states and transition conditions and processes.
The flowcharts for states and transitions controlled by EMS were implemented and programmed using Matlab
®. Results from the simulation based on the conditions are presented in the
Section 4 Scenarios studied. The thresholds for state transitions were defined using a trial and tuning procedure, while the model was developed.
Power management by the EMS system is implemented using Programmable Logic Controllers PLCs, which have been scaled for industrial applications. A similar use of PLCs is suggested in other relevant research projects and publications [
40].
3.4. Steady State Stability
In this Section, we discuss the steady-state stability, or the power system stability of the tanker for different sequential operating points, which occur when transitions of states arise. We do not study the transient stability issues, mainly based on the small contribution of the RES to the total power balance, which is approximately 1% from WECs and 20% from PVs (see also Technical Data in
Table 4,
Table 5,
Table 6 and
Table 7).
Ships are autonomous and independent energy entities, meeting their needs from the already installed thermal engines on board (Diesel—DF—LNG technology). The retrofit by addition of RES, which is proposed by this research, does not aim at a complete replacement of the existing power generation system of the tanker, but acts as an adjunct to them, with the aim of impairing the produced pollutants from the use of MDO. Consequently, stable operation in terms of electric power for the ship, is guaranteed, since the proposed RES operates in addition to the already installed thermal engines, meeting complementary power demands of the ship, according to the cruise conditions. It becomes clear that, since the amounts of power produced by the “green energy sources” are not enough, coverage of the power difference is done by activating the already existing fossil fuel thermal engines inside the ship.
The stability of the system operation is ensured by the EMS which is programmed according to the transitions between states from
Table 3, from and to the maximum power demands P
L required for the operation of the tanker. Based on the initial design and construction of the tanker in the shipyard can be stated that the coverage of the ship’s power demand P
L is ensured exclusively by the three installed thermal engines DG1, DG2, and LNG. Consequently, the use of RES has an additional and complementary effect on the balance of power, Equations (12)–(16). From the simulation scenarios with the RES of the system deactivated (see
Section 4, Scenarios 1 and Scenario 3), it is concluded that the coverage of the ship’s power demand P
L can be based on the installed thermal engines, DG1, DG2, and LNG, to the detriment of CO
2 emissions. However, the EMS’ decisions for the management of power on board are based on the current and existing energy demands in each time period.
This approach ensures that in no case will the ship energy system, both the power generation units and the load demands, experience power shortages and consequently unstable conditions during the ship’s cruising operation.
The benefit of the hybrid usage of RES, LNG and fossil fuel MDO, to meet operating power demands, is obviously valued in the achievement of reduced pollutants.
Thus, the stable operation in all conditions is already ensured from the initial design stage of the tanker, since the total power demands (
Figure 2) could, exclusively and only be covered by the already existing thermal engines, without even having installed RES.
Indeed, our model presents the discrete relations between states in order to ensure correct and stable transitions between states,
Table 3. On the other hand, power dispatch is managed by the EMS with an FSM control. States and switching conditions have been presented in
Section 3.3.
The transitions from state to state are clearly defined and aim to increase the use of power resources from RES, contributing to the reduction of emitted pollutants. The FSM performs the transitions, taking into account the current conditions and power demand coverage. In addition to the RES, it gradually activates the existing thermal engines of the ship: prefers the LNG and ends up by using the DG1, and DG2, only in situations when the required amounts of power cannot be covered by the combination of RES and LNG.
The thresholds for making the transition decisions from state to state were set through the simulation procedures during the development phases of the model, with the constraint of reducing the use of DGs. In the case where this is not possible, the EMS fully activates the ship’s DGs.
We run many simulation scenarios, not only the four described in
Section 4. In none of the simulation scenarios which we have performed, other than those mentioned in
Section 4, was there any issue of unstable operation, or a lack of electric power on the ship, as the total power requirements do not exceed those that the ship could meet exclusively with the use of its own internal engines, P
L < P
d1 + P
d2 + P
g, Equation (11). The proposal by us of the implementation of the EMS is not intended to replace and displace the tanker’s existing thermal engines, in any case.
4. Scenarios Studied
Four scenarios are examined:
1st Scenario: constant cruise conditions that maintain almost steady routes (constant speed and cruise direction) for a long stretch of the route, such as when crossing long distances over open sea or oceans. RESs are disabled.
2nd Scenario: constant cruise conditions that maintain almost steady routes (constant speed and cruise direction) for a long stretch of the route, such as when crossing long distances over open sea or oceans. RESs are enabled.
3rd Scenario: conditions for harbor approach which involves changing the speed and direction vs. time, breaking, acceleration, thus varying the power demand, accompanied by connect or disconnect cut-in/cut-off of the generating units. RESs are disabled.
4th Scenario: conditions for harbor approach which involve changing the speed and direction vs. time, breaking, acceleration, thus varying the power demand, accompanied by connect or disconnect cut-in/cut-off the generating units. RESs are enabled.
In the implementation of the 3rd and 4th scenarios, it must address the RES system operation under continuous changes of sun radiation levels due to short deviations of direction and turns as the ship approaches the harbor combined with wind velocity changes [
5,
41,
42]. These modifications induce also variations on produced power profiles from the RES systems as the ship maneuvers through passages towards the harbor. The varying power for the RES modules also enforces the transitions in the states of EMS for handling the power demands, resulting in the activation and de-activation loads assigned over batteries, according to the battery charging levels and discharging requirements. To evaluate the results of scenarios, for comparison reasons, the 1st and 3rd scenarios will be examined by disabling the RES system and Scenarios 2 and 4 by activating the RES system. This evaluation approach creates a common reference basis for comparisons of energy requirements in both cases, as well as fuel requirements and CO
2 emissions.
The ship studied in the four scenarios below is an LNG tanker. Simulation scenarios used the numerical data from a commercial LNG cargo tanker with displacement of 45,000 tons, length 220 m, width 40 m, depth 22 m, and 3 decks, that offer a total area of 1800 m
2 for the installation of 900 PVs using panels of 2 m
2 each. This type of LNG tanker has one DF engine. Ship propulsion, and all other electric loads are covered using in total three installed thermal engines generators: one LNG (which is of DF type) and two DGs. Technical data are in
Table 4.
The ship selected for simulation, according its dimensions, offers an installation area for 900 PV panels of 2 m
2 each, expanded over a total surface area of 1800 m
2 accommodated through ship decks. PV panels are organized into three sections over decks (central and left—right rear decks). Technical data of PV panels are summarized into
Table 5.
The proposed RES system utilizes also WECs, capable of operating at almost a large scale of wind velocity levels without rotational and structural problems due to increased tensions over their axes, which consequently result in a reduction of their operation under stormy conditions. The technical properties of WECs used are summarized in
Table 6.
A number of batteries are connected (stacked) to form a battery grid array, allowing charging interface at 24 V [
43]. Connected inverters convert DC voltage to 3-phase AC voltage 380 V rms, 50 Hz. Battery total charging capacity is set at 2000 Ah. Technical specifications for the battery grid are summarized in
Table 7.
For our simulation, we consider that sun radiation levels change over a daily periodic basis and are also dependent to year seasons, and to longitude and latitude according to cruise routes of the ship [
44]. PV panels are distributed over three decks of the ship and, based on placement of the PV systems, three different sun radiation files are required accordingly for each deck. The installation of photovoltaic panels is done on slightly sloping surfaces of the ship’s decks at an angle of 30°. The sun radiation files provide detailed data for sun radiation according to the orientation and placement of ship decks and ship route. A sun radiation diagram is shown in
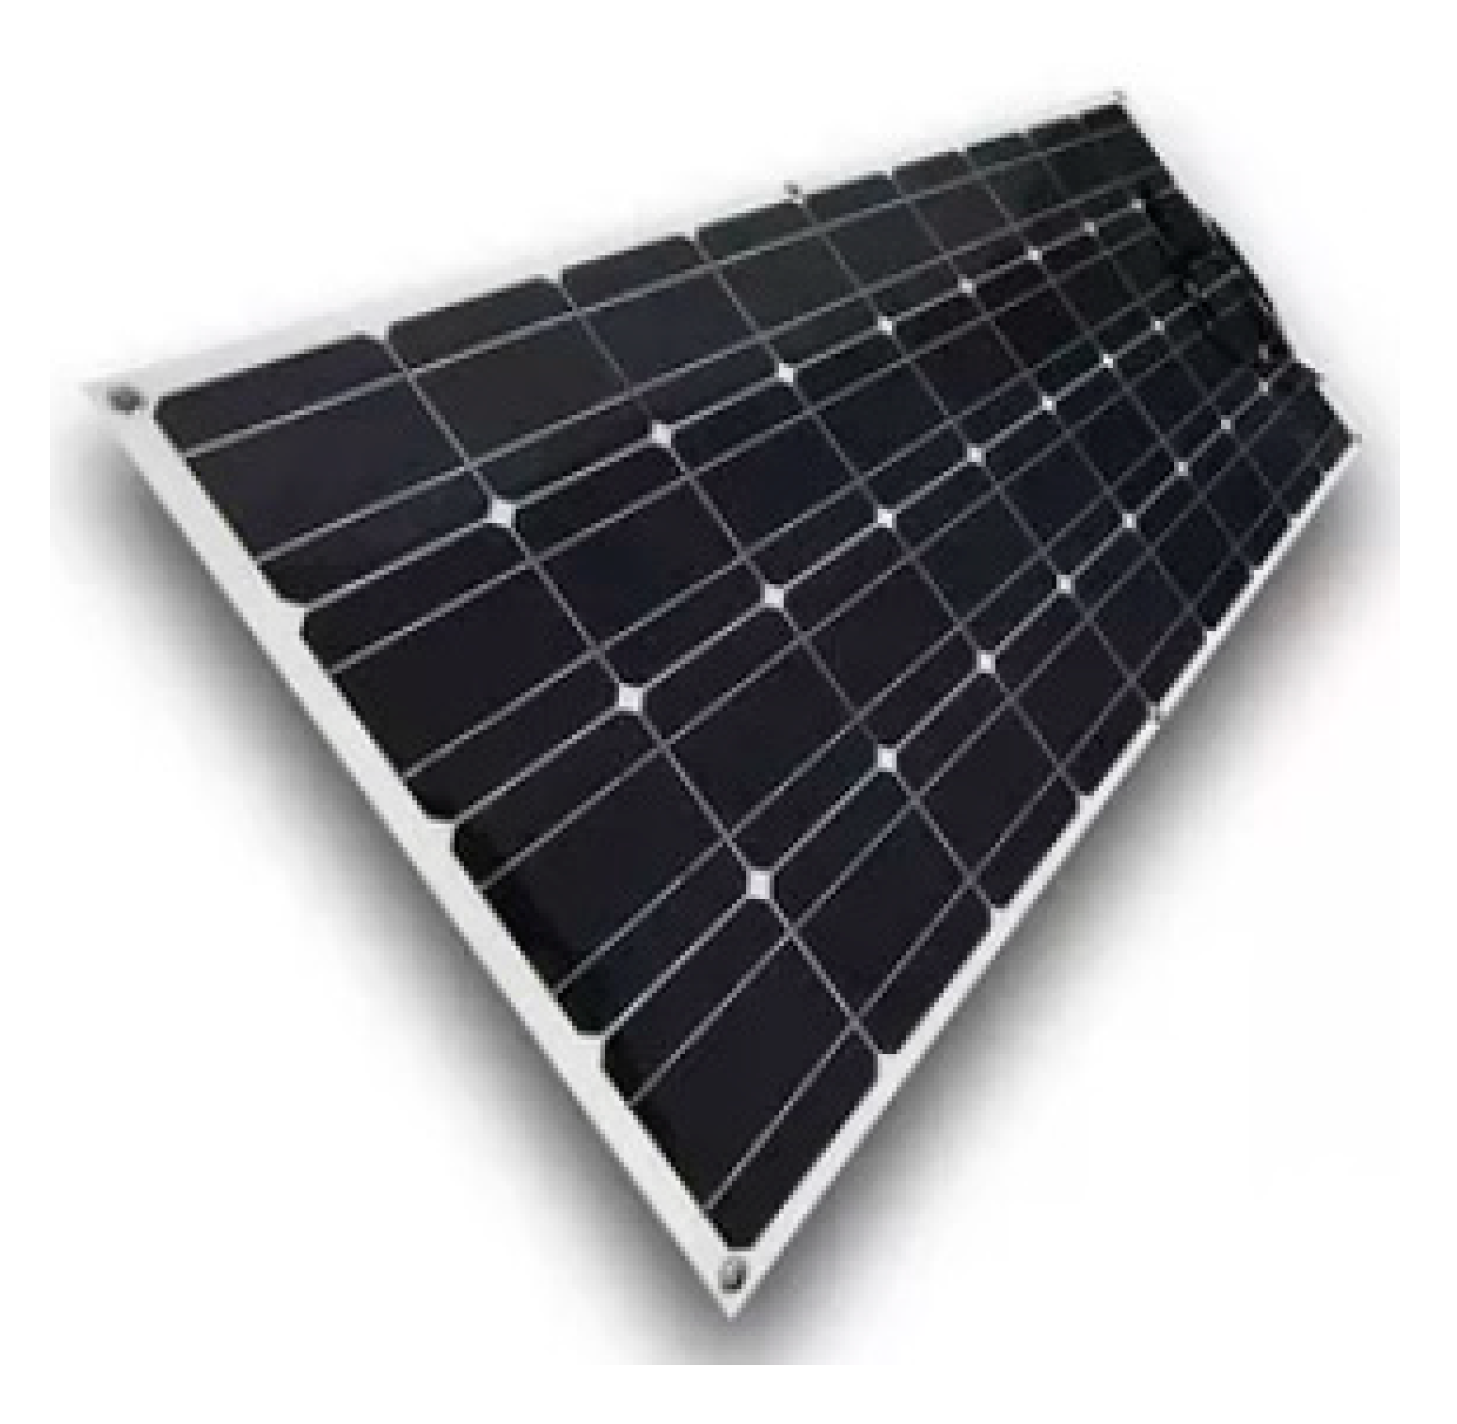
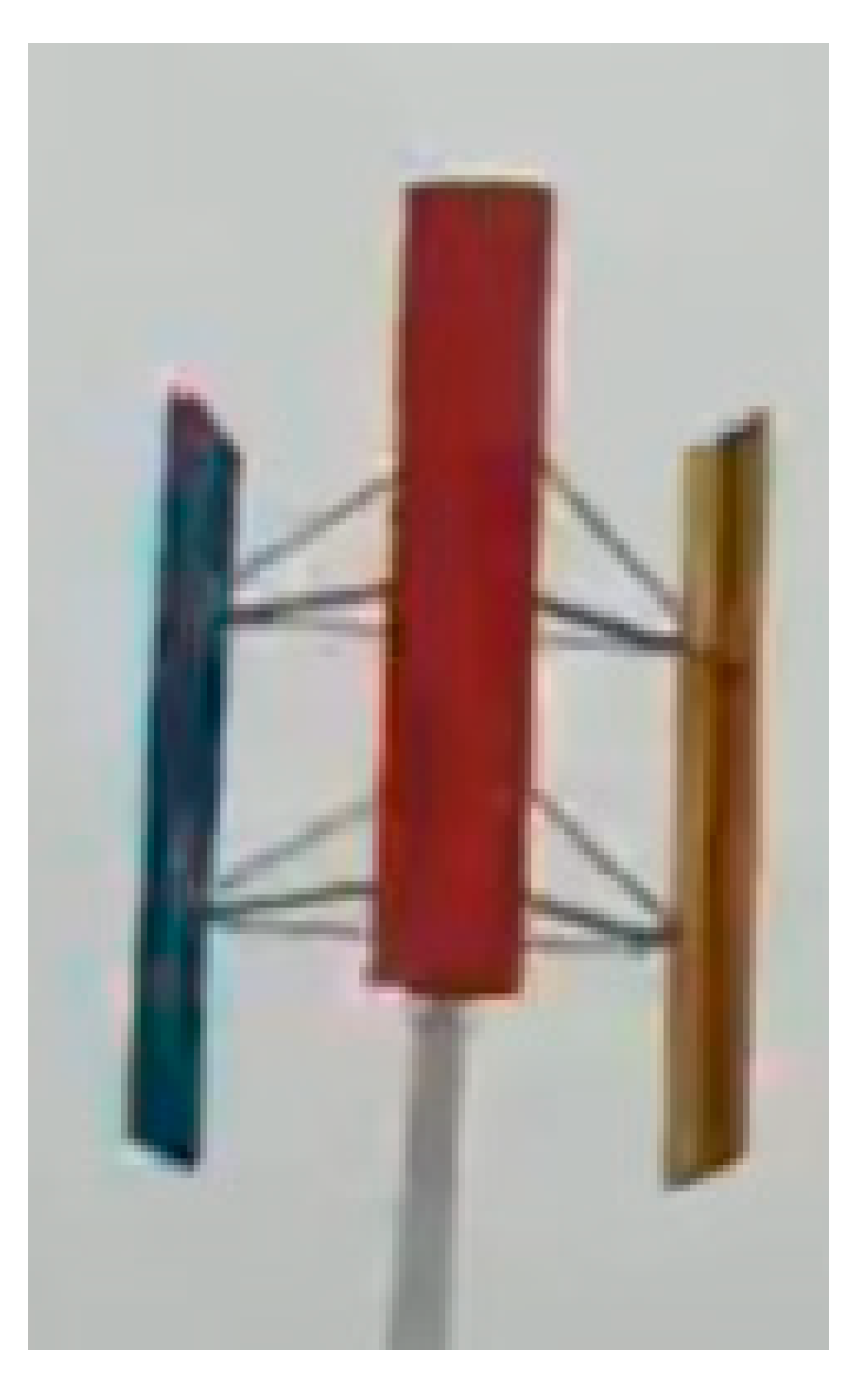
Figure 3. Typical nano-crystalline PV systems, as well as a vertical axis WEC, are shown in
Figure 8 and
Figure 9, respectively.
The WECs are adapted to vertical support axes and ensure continuous operation for a wide range of wind intensities. It should be noted that the aerodynamic resistance introduced in the ship’s construction does not significantly alter the ship’s cruise and therefore does not significantly affect fuel consumption to ensure a stable cruise. The simulation model for WECs uses a common wind velocity file for all decks, since wind levels are mainly affected from the geographical zones and daytime conditions during the ship’s cruise. A typical wind velocity diagram is depicted
Figure 4.
The external data files that provide information for the sun radiation and wind velocity levels offer the capability of dynamic alteration of weather conditions according to the examined scenario in a realistic manner. System operator can modify weather conditions according to simulation scenario, allowing this way a variety of simulation conditions for the system and RES performance.
4.1. Scenario 1. Constant Cruise Conditions and RES System Disabled
The duration of Scenario 1 is set at 24 h. During Scenario 1 we estimate cruise conditions, inducing an almost constant ship speed, set at 2/3 of maximum speed. This cruise condition is translated into an almost constant total power demand, set initially at 450 kW, or an average of 446.2 kW due to fluctuations of loads displacements according to the time-variant operation of other departments of the ship. In this scenario, RES generating units are disabled, the thermal generating units are enabled, and, thus, the total power is supplied by DGs and LNG. The results for Scenario 1 are in
Figure 10 and
Table 8, and depicts the power versus time and the power dispatched by the thermal generating units.
From the obtained results, we can see that the EMS covers the average per day total demands, by energizing during 24 h the LNG at maximum capacity 200 kW, or 44.9%, which is preferable to the DGs, since it produces the lowest CO2 emissions. For the residual power demands, which exceeds the maximum capacity of LNG, EMS activates one DG to generate the 246.04 kW or 55.17%. From simulation results it is shown that 67.18% of CO2 emission is caused by DGs and 32.90% of CO2 by LNG.
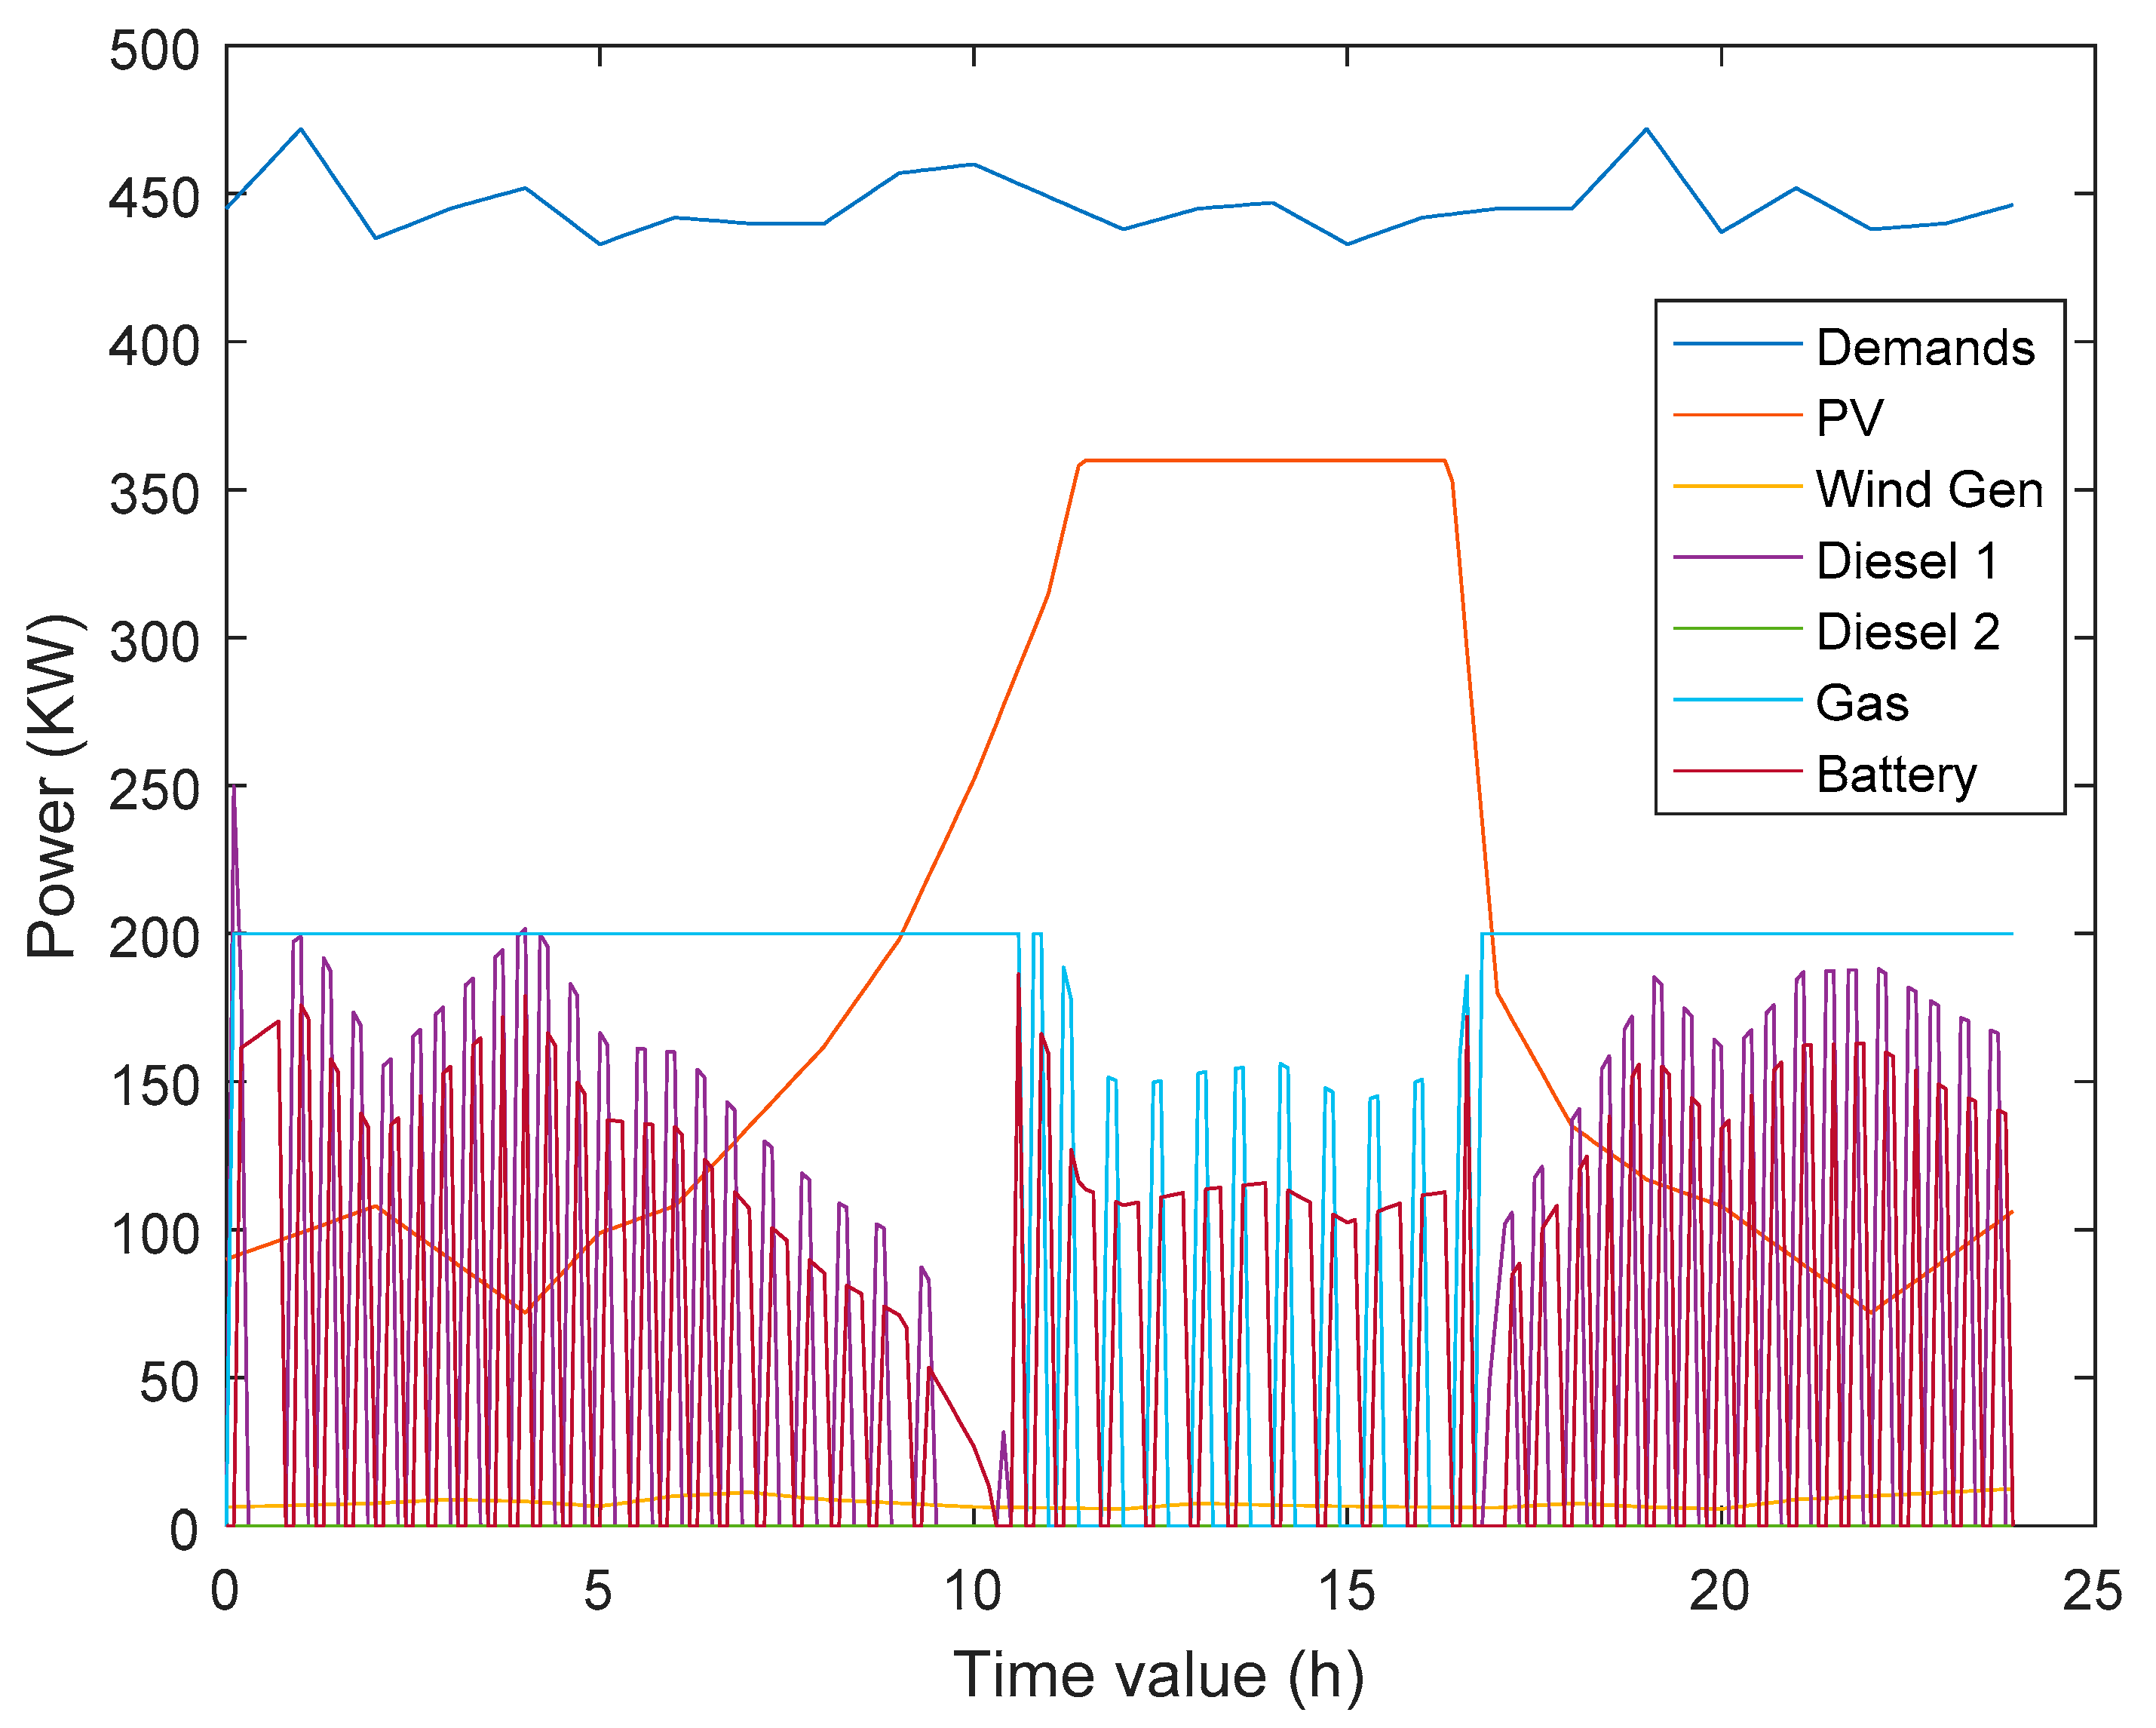
4.2. Scenario 2. Constant Cruise Conditions, RES System Is Enabled
At Scenario 2, we maintain similar cruise conditions for the ship, as defined in Scenario 1, taking into account the operation of the installed RES system. This alters EMS operation, since power resources are enriched by the transitions of PVs and WECs to enabled states. The system of batteries is considered initially at S
oC = 50% of maximum capacity, offering 1000 Ah dc power for the load demand. Results for Scenario 2 are summarized in
Table 8. From these results it can be shown that most of the CO
2 emissions come from LNG. Comparing the results of Scenario 2 (RES enabled) to Scenario 1 (RES disabled), a significant reduction in total CO
2 emission is observed: CO
2 has decreased from 9368.2 kg to 3967.2 kg, and has consequently obtained a decrease of 57.6% for the system.
Figure 11 depicts an overview of ship power demands through simulation time as well as an assignment of ship loads to available power resources (DGs and RES). From the power balance diagram, it can be observed that there is a significant contribution of PVs for covering power needs, mainly during the noon period of the day. This period (noon) defines a deactivation interval for many hours for DGs. For the rest of the periods, EMS accomplishes a power balance through requests to the LNG and in case the remaining loads still exist then EMS requests their coverage by DGs.
Based on the results for Scenario 2, results that PVs undertake the 40.93% of ship load demands, WECs cover 1.74%, batteries through inverter cover the 14.87%, DGs cover the 12.62%, and LNG covers the 36.64%. The use of DGs has been reduced from 55.17% during Scenario 1, at 12.62% during the Scenario 2, and this reduction contributes to a consequent reduction for CO2 emissions. The LNG is higher utilized through decisions from EMS, which prefer activation of this engine compared to DGs.
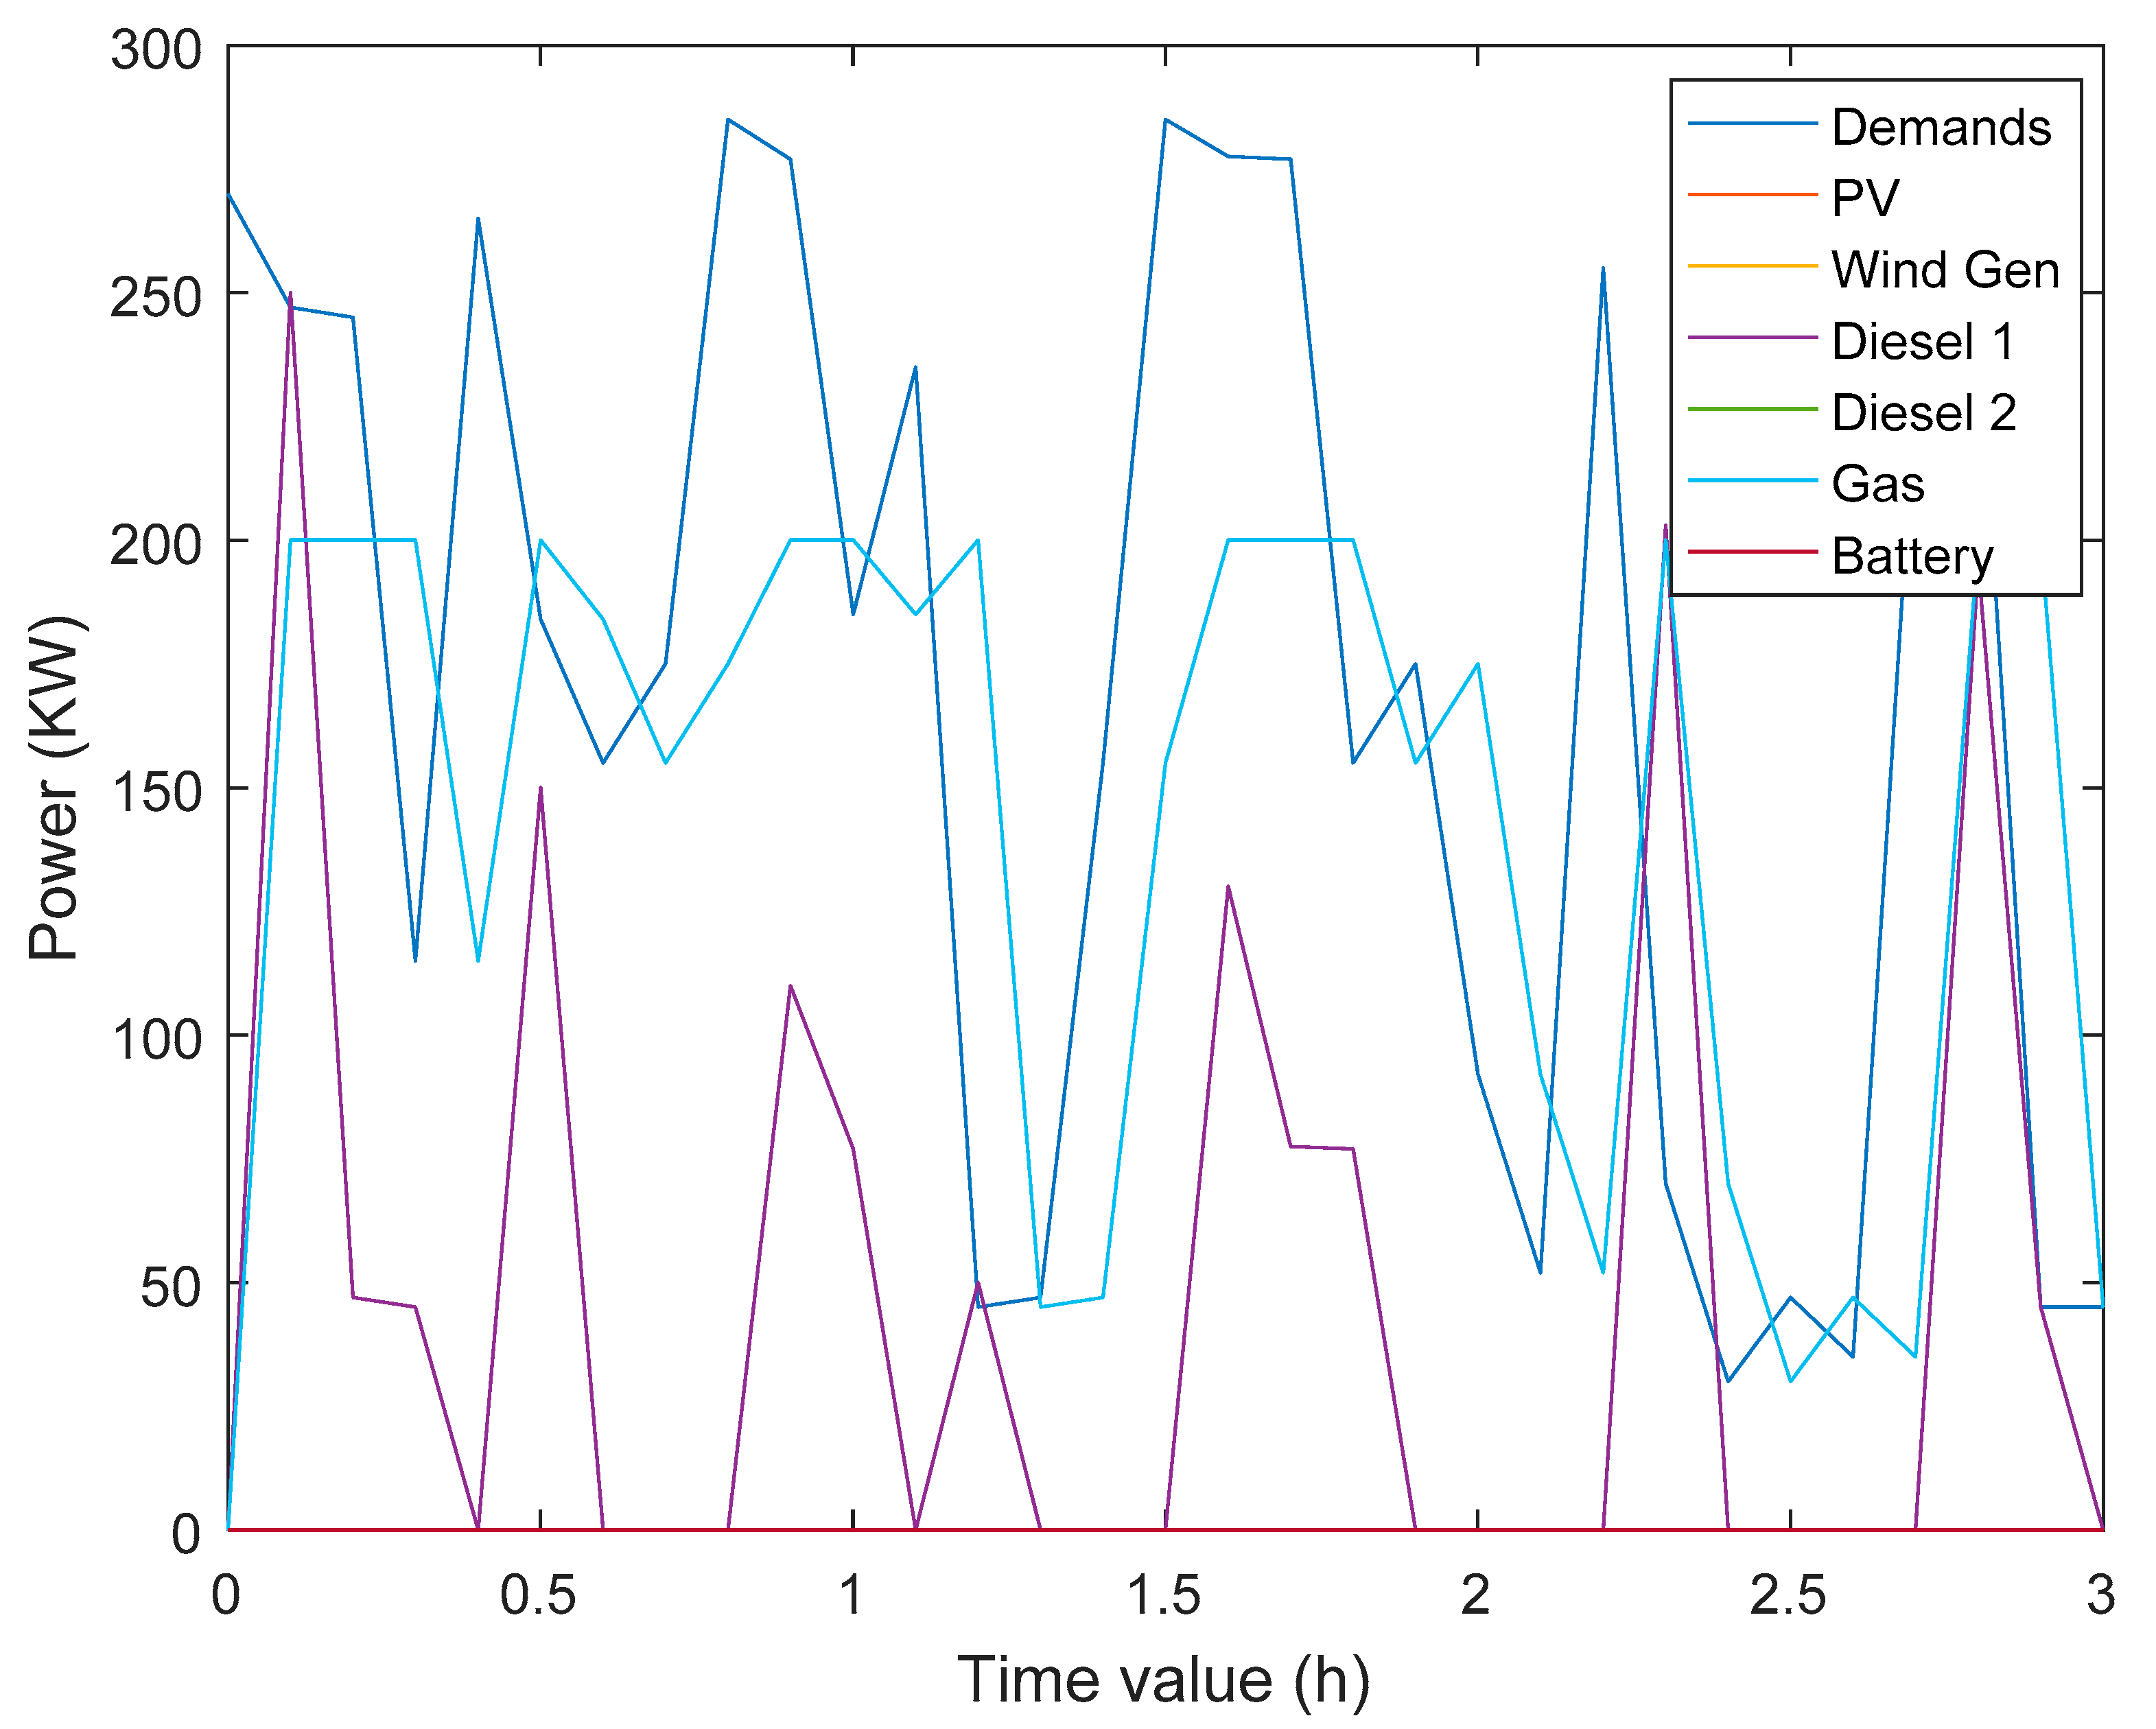
4.3. Scenario 3. Harbor Approach Conditions, RES Disabled
In Scenario 3, we consider that the ship enters the harbor for clogging. The ship maintains a lower speed almost at 1/5 of its maximum, altering directions due to maneuvers. The duration is set at 3 h. During this period, sun radiation levels are varying due to maneuvers for reaching the harbor. Simulation results for Scenario 3 are in
Table 8.
From the simulation results, it follows that a total amount of CO2 emissions reaches 353.27 kg for the entire duration and pollutes the harbor environment. This is in addition to other ships that approach harbor simultaneously. Consequently, pollution levels increase as the harbor size increases. The main factor of the pollution is the operation of DGs during the clogging process.
The percent of 12.10% of ship power demands are covered by DGs while 87.90% is covered by the LNG. An analytical overview of power demands and levels of assignment to generating units for load coverage on ship available resources for the Scenario 3 is depicted in
Figure 12.
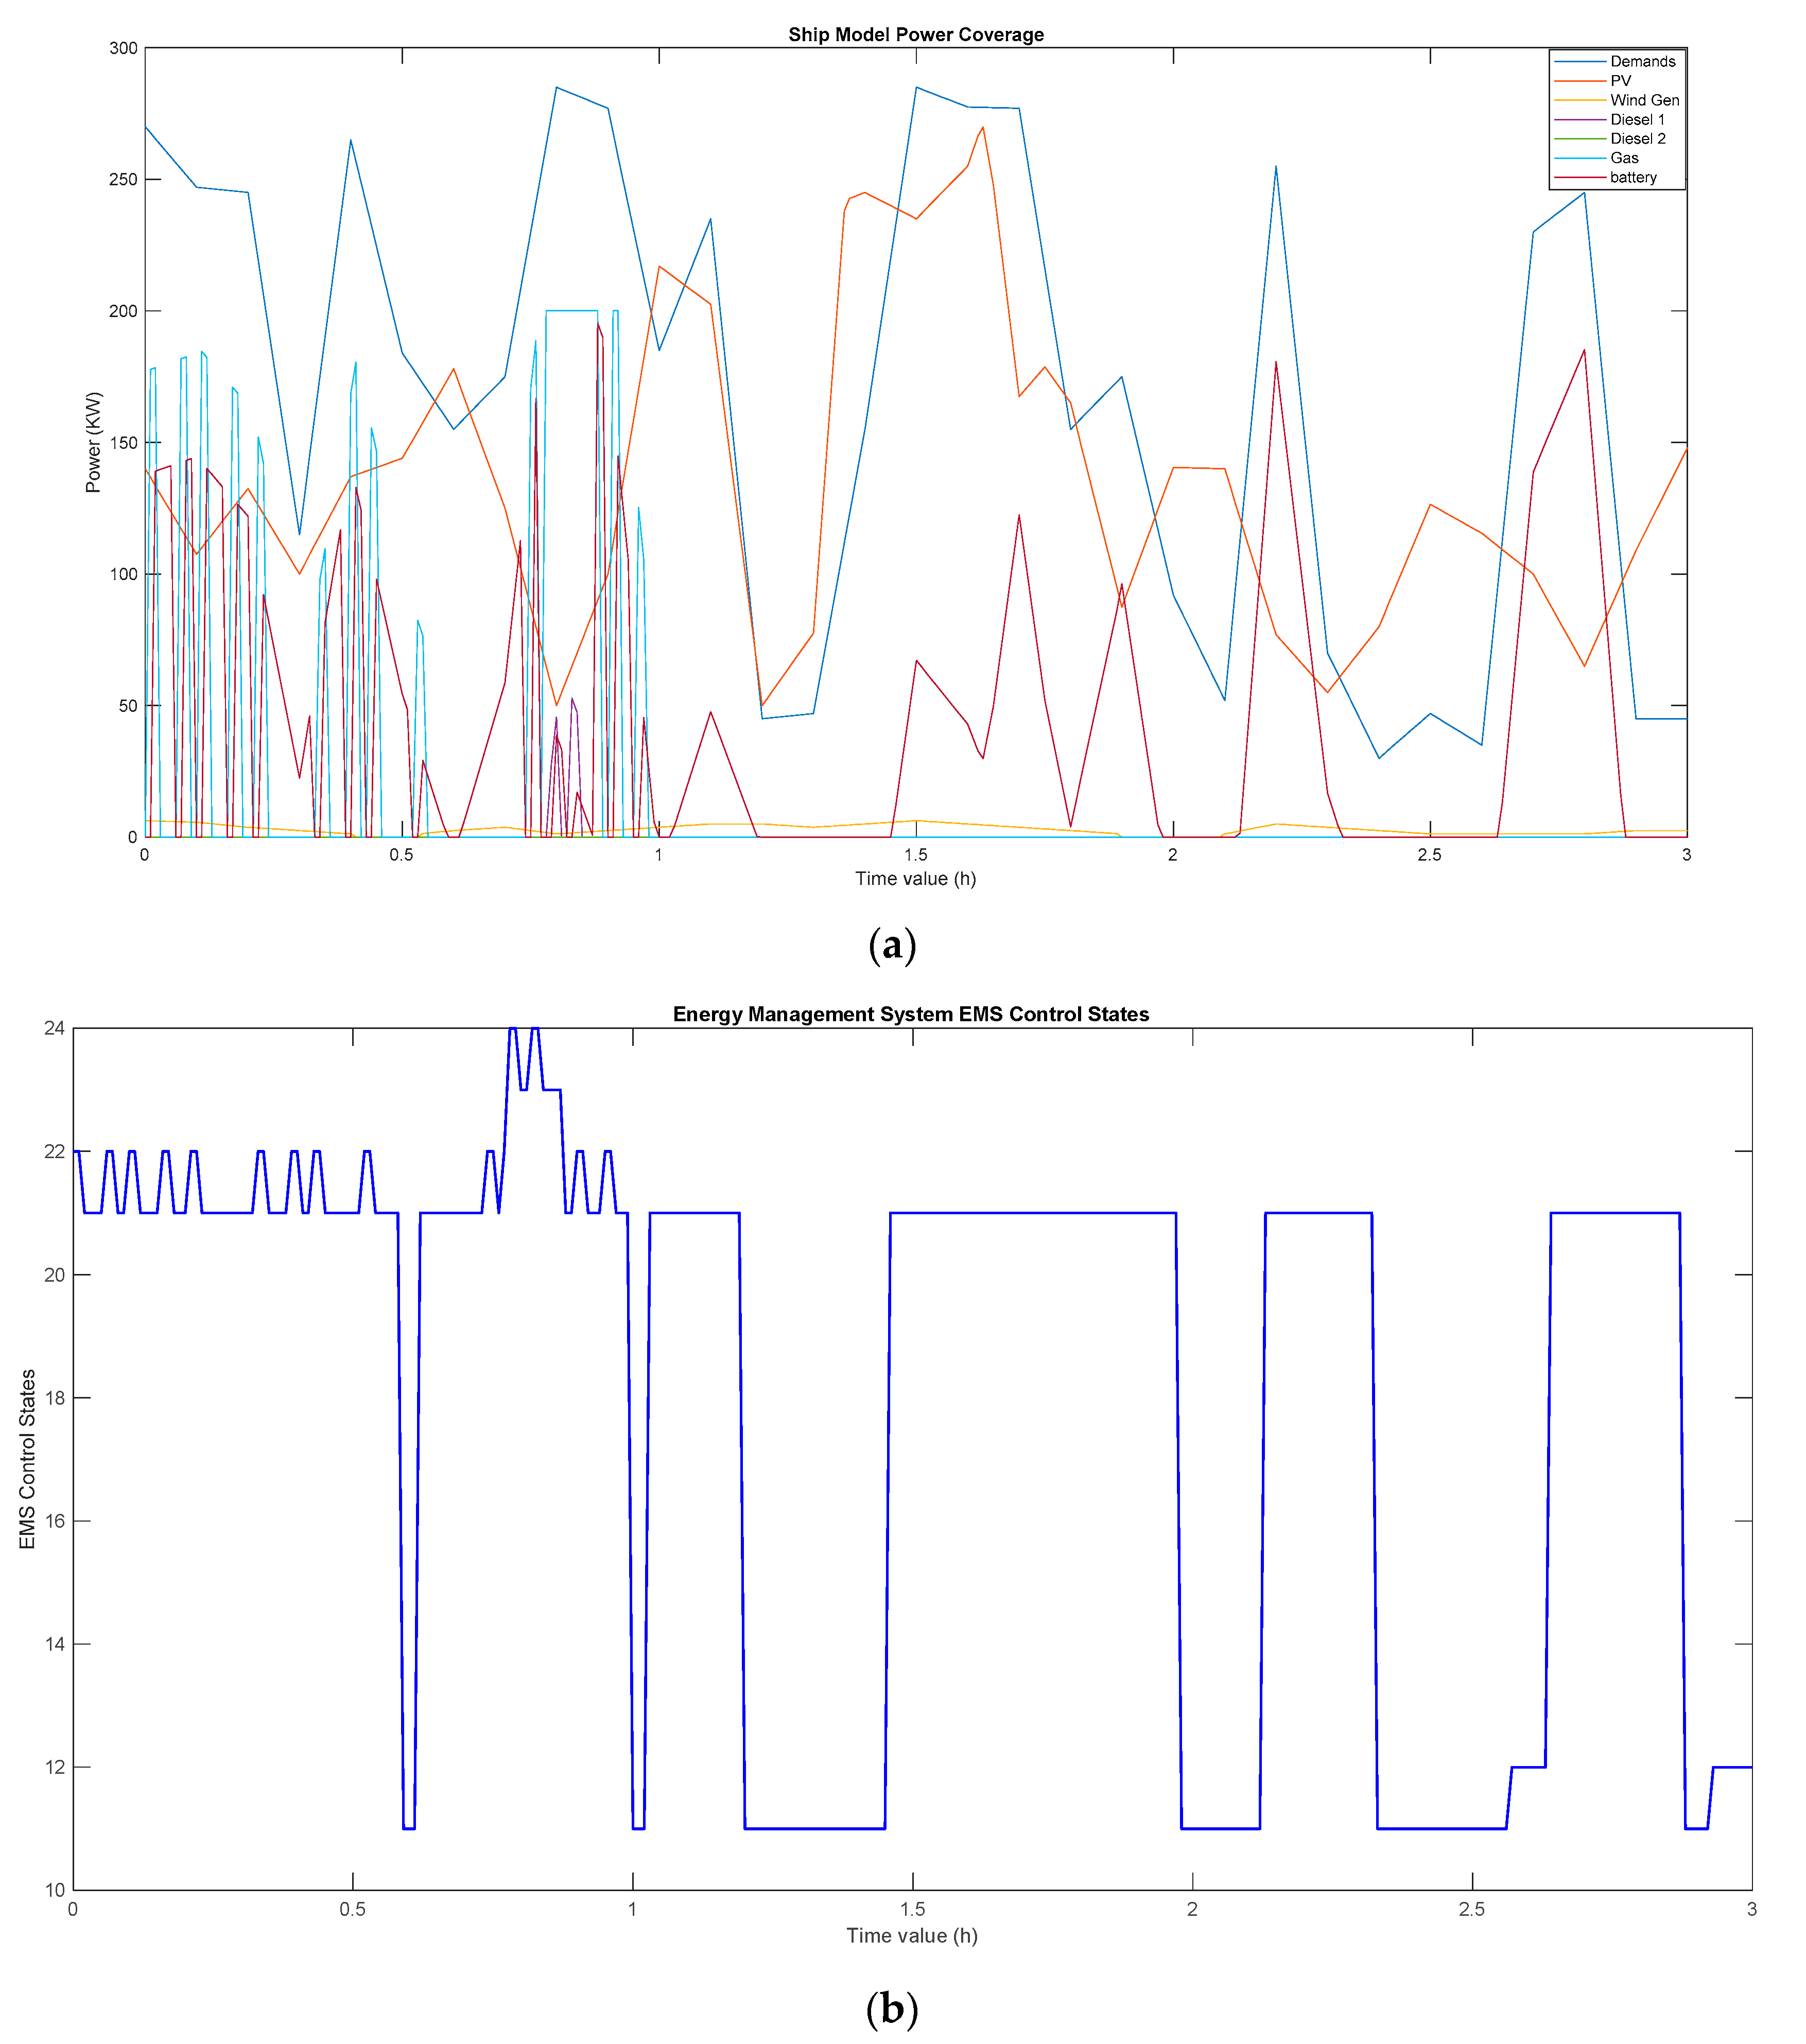
4.4. Scenario 4. Harbor Approach Conditions, RES Enabled
During Scenario 4 the same conditions for the harbor approach are maintained as in Scenario 3, but RESs are activated. Results for Scenario 4 are in
Table 8. From the results, a reduction level of 86.7% for CO
2 emissions is observed, as compared to the Scenario 3. This is explained considering that most of the power demands are covered through RES and LNG, while keeping DGs disabled. The diagram in
Figure 13a depicts an overview of ship power generation and consumption through the period as this is assigned to available resources (thermal engines and RES) and
Figure 13b shows the corresponding EMS Control States.
PVs cover 79.14% of power demands, WECs cover approximately 1.73%, batteries through discharging cover 25.38%, DGs cover 0.35%, LNG covers 11.72%, and an amount of 7.39%, is assigned to the batteries for charging. Diminishing of DGs activation duration is the decision factor, which contributes to CO2 emission reduction for Scenario 4.
5. Discussion of Results
In
Section 4, four representative types of simulation scenarios were studied: (a) normal cruise and (b) harbor approach, with power generation altered between these types of scenarios, which have been examined under two alternatives for the embedded RES: disabling RES (traditional ship operation) and enabling RES.
Comparison of results from all scenarios according to these alternatives are summarized in
Table 8 and
Table 9, showing percentages of fuel consumption and gas emission reduction between scenarios 1 → 2 and 3 → 4.
Table 8 and
Table 9 show that activation of RES undertakes an important part of ship power demands, relaxing the use of DGs. Reduction of fuel consumption (
Table 9) is reflected directly onto lower CO
2 emission. Reduction of gas emissions for normal cruise scenarios 1 → 2 is reaching levels of 76.9% and 18.28% for DGs and LNG respectively. Reduction of CO
2 emissions is higher at levels of 97.16% and 86% for DGs and LNG, respectively, for harbor approach scenarios 3 → 4.
The implementation of EMS does not use prediction techniques and is based on logical design between inputs and outputs. Forecasting techniques for the involvement of RES were not considered, because power demands as well as energy generation from RES changes only if there are fast varying operational and climatic conditions. As previously pointed out, (in
Section 3.4) the overall power system, even if based on existing installed thermal engines DGs and LNG, is stable, capable and sufficient to meet power demands. The EMS power controller does not use predictive techniques either to estimate the operating power requirements of the ship, or to predict the power generated from the RES installed on board. The estimation of the transition processes from the EMS controller finite state machine FSM is based on the current values of the system needs and efficiencies.
Regarding the use of a forecasting method for estimation of energy from RES, which was raised during the review phase of this manuscript, we clarify that such a method was not used in the context of this work. In our opinion, these techniques could be applied in future research, under a similar operating approach, i.e., by combining RES and existing thermal engines of tankers. In our estimation, forecasting techniques could be applied in two directions: (a) towards the forecasting of the ship’s power demand during its cruise and (b) towards the estimation of the meteorological conditions during cruise, thus to assess the predictability of RES power generation.
Approach (a) has not been considered in the present research work, mainly because the power demands of the ship are usually predetermined and known in advance during the cruise. Of course, power demands can change either during the approach of ports (such as in our Scenarios 3 and 4 from
Section 4) or during the phase of change of the meteorological cruising conditions. The last condition of change of power demands due to adverse weather conditions during the cruise, can be simulated in the existing simulation model of our work, by changing the simulation conditions from the corresponding configuration files of power load demands (see
Figure 1 and
Figure 2). At this point, however, it should be noted that none of the simulation scenarios performed by us during the development and testing of the mathematical model requires power levels for the operation of the ship that exceed the maximum total power which can be generated from the ship’s installed thermal DGs and LNG engines.
Approach (b) for applying forecasting techniques refers to meteorological estimates for forecasting weather conditions. Based on the existing simulation model, this is possible by varying light intensity and winds in configuration files, used in the simulation (see
Figure 3 and
Figure 4). Such an investigation therefore has a direct impact on the amount of power generated by RES. In the event that the weather conditions during the cruise are unfavorable, obviously the amounts of power from the RES are significantly lower, the coverage of the power balance is undertaken by the installed thermal engines of the ship through the state transition from the EMS. As already mentioned, EMS bases its operation on the real conditions (power generation—power demands) and based on them, as they change dynamically over time, selects the corresponding state.
Regarding the increase of energy efficiency issue, this can be achieved:
- (a)
mainly, from the retrofit of the tanker thermal Diesel engines and their replacement with DF-based technology engines, which ensures a 30% increase in efficiency over the traditional installations with MDO only (topic discussed in
Section 2);
- (b)
from the retrofit of the tanker with additional RES installations, which according to our study case, offer up to 21% of the power demand and, depending on Scenarios, saves of MDO consumption according to the values from
Table 9.
6. Conclusions and Future Work
This work presented a simulation environment that combines traditional power generation from thermal engines with RES, in an LNG cargo tanker. Definition of ship power demands for steady-state operation, includes conventional electric loads (propulsion motors, lights, pumps, compressors, vaporizers, heating, cooling, kitchens, elevators, etc.), as functions that vary consumption values depending on operating points. Additionally, the contribution of RES is introduced by PV panels, WEC modules, and batteries, without limiting model expansion, as other types of RES can be added autonomously to the existing model. RESs are realized as functions that return the demanded power for every operating point, considering local conditions for sun radiation and wind velocity during simulation periods, localized to cruise a geographical area.
The scenarios show significant reductions in CO2 emissions, and prove also a lesser MDO demand. Diminishing CO2 emissions mainly comes through a reduction of MDO fuel consumption. This is achieved through the transition of states of EMS, which gives priority to LNG operation rather than DGs, in conjunction with RES, while it activates DGs only in case the remaining power demands cannot be covered through other alternatives.
Simulation shows also that a significant constraint for the design and operation of the system is the tanker dimensions, which limit the number of PVs installed over a ship’s decks and the number of WECs installed. However, the model has the ability to alter the numbers of installed subsystems, introducing different control conditions and boundary values, and also, being implemented in other tanker of other dimensions, which slightly changes the results.
PLCs are used to implement the power management within EMS system. The system stability is ensured by the EMS, based on transitions between states of maximum power demands, while the use of RES has a complementary energetic effect. From the scenarios with the RES system deactivated, we obtained that the coverage of the ship’s power demands is assured by the thermal engines only, while the use of RES saves costs, and emissions, and thus adds the environmentally friendly component.
Different algorithms and power management policies could be applied to EMS, and are investigated through simulation. The power management algorithm can be implemented by PLCs, which allows automated finite state transitions of a control system. Nowadays, PLCs are components capable of performing industrial control, offering the ability of digital handling and control for any environment and type for energy distribution. Introduction of new algorithms for the EMS operation can be applied using installed firmware over the PLC device. An EMS algorithm can be a modified on-the-fly, switching to alternative operational modes, as power demands and conditions for ship operation have modified through time. PLC can automatically disconnect RES from a ship power dispatch system, allowing steady state operation based on internal combustion thermal engines only. This feature supports fast debugging of the power distribution system when abnormal conditions may appear, allowing the isolation of malfunctioning power subsystems.
Ship models observing power balance, energy consumption and pollution levels, create a new system. Our scenarios used data of an LNG tanker that offers an area of 1800 m2 for the installation of 900 PVs using panels of 2 m2 each. A reduction of RES in terms of less PVs on the ship at a factor of 50%, without modifying any of other characteristics for the normal cruise scenario, results in a reduction of 23.3% of MDO fuel and a 57.8% reduction in CO2 emissions, if compared to an RES disabled scenario. This reveals that even in case fewer RESs are used (due to cost reasons for the economic investment for installation of RES), a significant gain can be achieved in terms of fuel savings and CO2 emissions.
Simulation also shows the importance of batteries for the loading capacity of the system. Batteries are heavy components and usually require important space areas for installation on a ship. Technology offers a compact solution for small size packages with increased capacity for batteries. EMS optimizes their use, since it determines controllable charging and discharging states at appropriate levels, optimizing both battery lifecycle and system operation.
We conclude that the field of use of RES is inexhaustible and can contribute significantly to the electrical power demands of a ship, since ships do offer adequate space for hosting PVs and WECs on their decks, solving problems for installation and storage of subsystems for the electric grid inside the ship, especially in large tankers. On the other hand, utilizing RESs, ships take significant advantage from their operation by minimizing fossil fuel consumption and consequently CO2 emissions.
Furthermore, we recommend the retrofit of LNG tankers, in addition to the introduction of RES, involving the replacement of existing Diesel engines with DF Dual Fuel engines, since this contributes more to an increase in the savings of fuel costs for MDO and at the same time to a reduction in CO2 emissions. The purpose of this is the design and build of new ships with a reduced CO2 index, which is lower than 70%, as compared with the average ship CO2 index at 100%.
Further research could be developed towards the use of forecasting techniques to estimate (a) power generation and consumption during the cruise and (b) the predictability of RES generation during cruises for different meteorological conditions.


