1. Introduction
Differential interferometric SAR (DInSAR ) analysis is a significant source of information in crisis management dealing with the problem of ground deformations [
1,
2,
3]. DInSAR results can be used for monitoring landslides, volcanic activity [
4], earthquakes [
5], and mining-induced subsidence [
6]. Nowadays, a very large amount of SAR data acquired by Sentinel-1 is freely available, making differential radar interferometry more accessible. However, to take real advantage of DInSAR in crisis management, it is necessary to ensure its automatic processing, which is a subject of many works [
7,
8,
9]. A system that allows for the continuous monitoring of endangered areas and can alert about critical values of ground deformations is needed. Such a solution requires a technique for the automatic identification of subsidence patterns in SAR interferograms. There are many scientific papers on this problem that use different methods. In [
10], the automatic detection of subsidence troughs in SAR interferograms based on circular Gabor filter was proposed. Its detection rate varied from 30% to 53% with a relatively low number of false alarms. In [
11], circlet transform was compared with Hough transform [
12,
13]. There are also works that are based on a convolutional neural network [
14,
15]. Each of those methods has its limitations, which is why their efficiency in trough detection in noisy satellite images is low. Methods [
10,
11,
12,
13] use circular or elliptical troughs in the detection process. In many cases, the shape of the troughs on interferograms is deformed, which significantly reduces the effectiveness of these solutions. Moreover, the proposed method is much less computationally expensive, which is quite important due to the large size of the processed SAR images. However, most of the solutions [
10,
11,
12,
13,
14,
15] can be used to support the detection of subsidence in larger SAR images, but they are not suitable for fully automated operations.
Here, a new algorithm for the automatic detection of subsidence areas in radar interferograms is proposed. It identifies elliptical interferometric fringes that usually correspond to subsidence troughs. The developed method is intended for monitoring mining and postmining ground deformation. When elliptical fringes are caused by other deformation phenomena or atmospheric effects, they are also recognized. Therefore, the interpretation of the obtained results should be connected with a priori information about the studied region.
In the proposed algorithm, mathematical morphology methods are used for analyzing the phase, coherence, and entropy of interferograms, and for the identification of subsidence troughs. To speed up detection, the proposed algorithm consists of two stages. In the first stage, potential areas of subsidence troughs occurrence are identified. Afterwards, those areas are verified. The proposed method was tested on interferograms generated on the basis of Sentinel-1 SAR data.
2. Methodology
The proposed algorithm consists of two main steps. The first step eliminates from further analysis parts of the interferogram where, there are most probably no subsidence troughs. A map of the interferogram phase is used with maps of its coherence and entropy (calculated for data converted into unsigned int 8-bit types with Equation (
1) in a moving window). For the phase map, lines with a sudden phase change (approximately from
to
) are identified. Thos is motivated by the fact that such phase changes are characteristic for interferometric fringes that occur in the case of subsidence troughs represented by a full phase cycle. For this reason, subsidence troughs without full phase cycle may not be included in further analysis. This needs to be improved in the future.
where
—sum of pixels with intensivity
n divided by the number all pixels in window [
16].
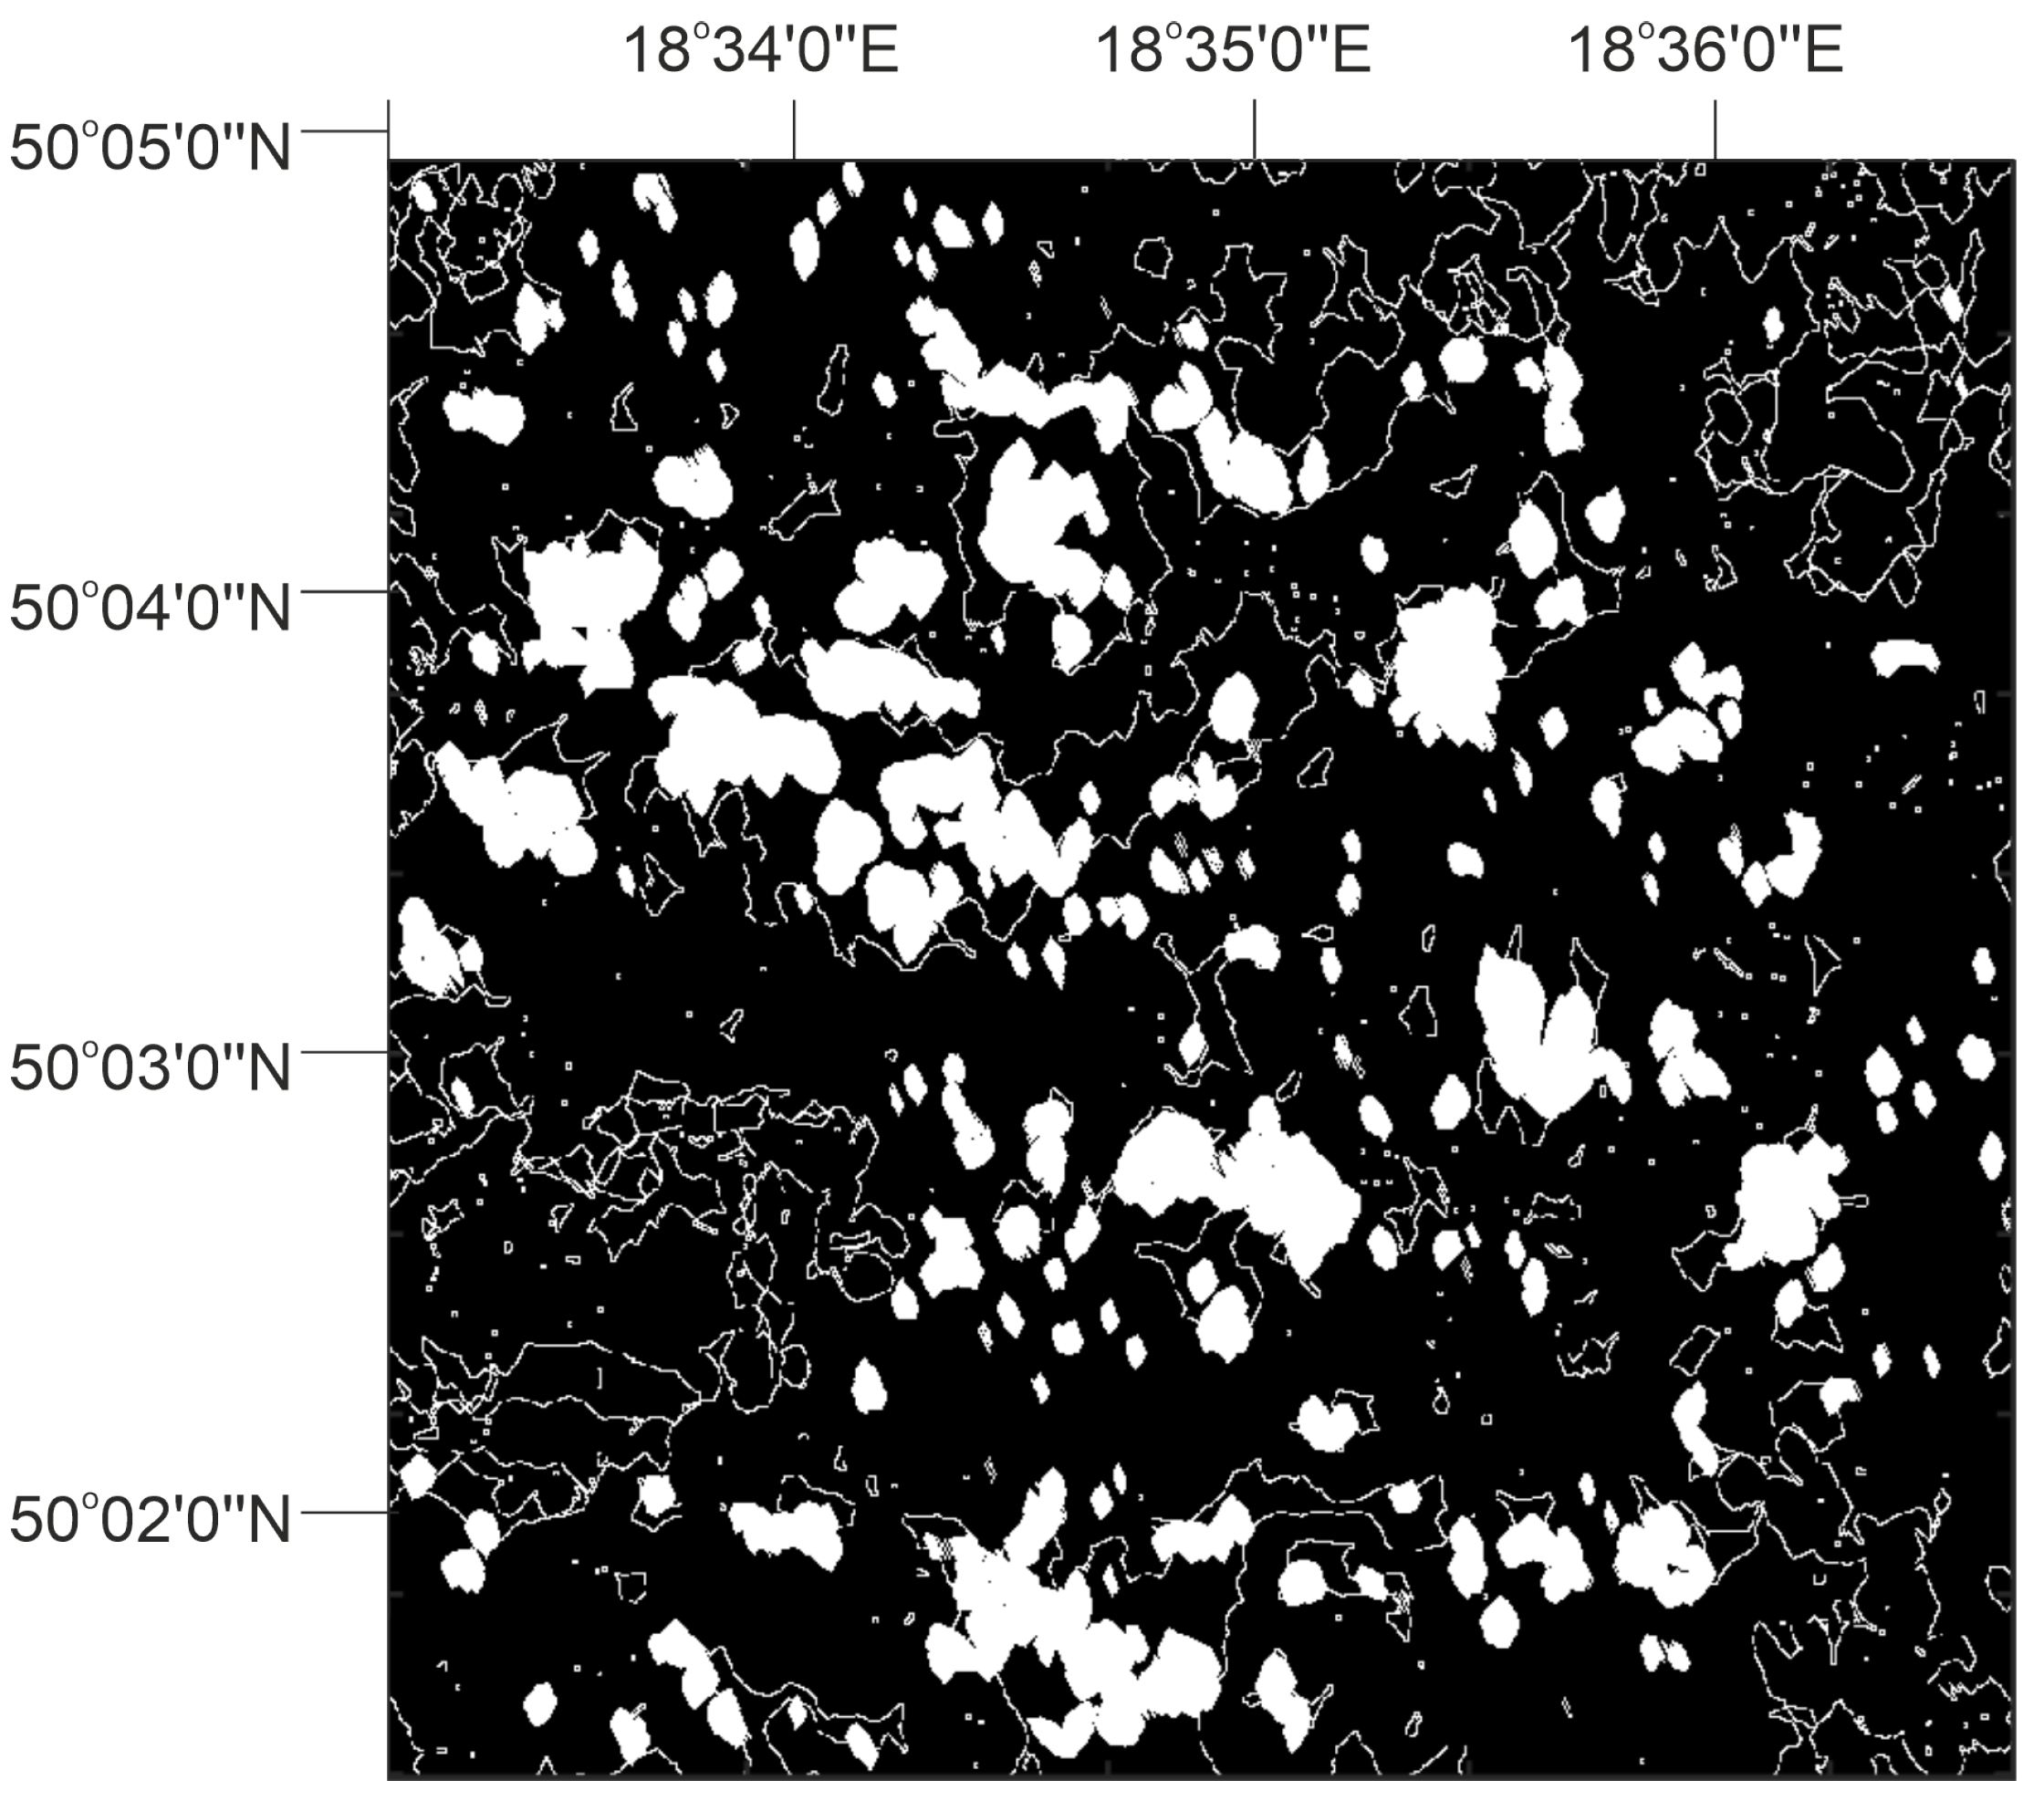
The identified lines that are very short are removed from the next steps of analysis. The continuity of the remained lines is improved by the closing operation with a linear structural element [
17]. Areas inside those lines constitute a set of potential regions, where the centers of subsidence troughs may occur. An example of the obtained results is presented in the
Figure 1 (obtained on the basis of the generated interferogram using Sentinel-1 data).
From the map presented in
Figure 1, all regions with low coherence (noisy regions) and low entropy (homogeneous regions) were removed by considering two logical images presenting coherence larger than a defined threshold (
) and entropy above a defined threshold (
), respectively. To define the appropriate thresholds, tests were performed on several interferograms (different than those for which tests of the method were performed). Those interferograms, generated on the basis of Sentinel-1 images, differed from each other by time interval (6 and 12 days), and a number of subsidence troughs (from 1 to several). For the analyzed values of thresholds, the number of correctly detected troughs was divided by the number of total alarms. Thresholds that gave the highest value of this proportion were chosen as optimal. A procedure for the automatic selection of thresholds (
and
) should be proposed in the future.
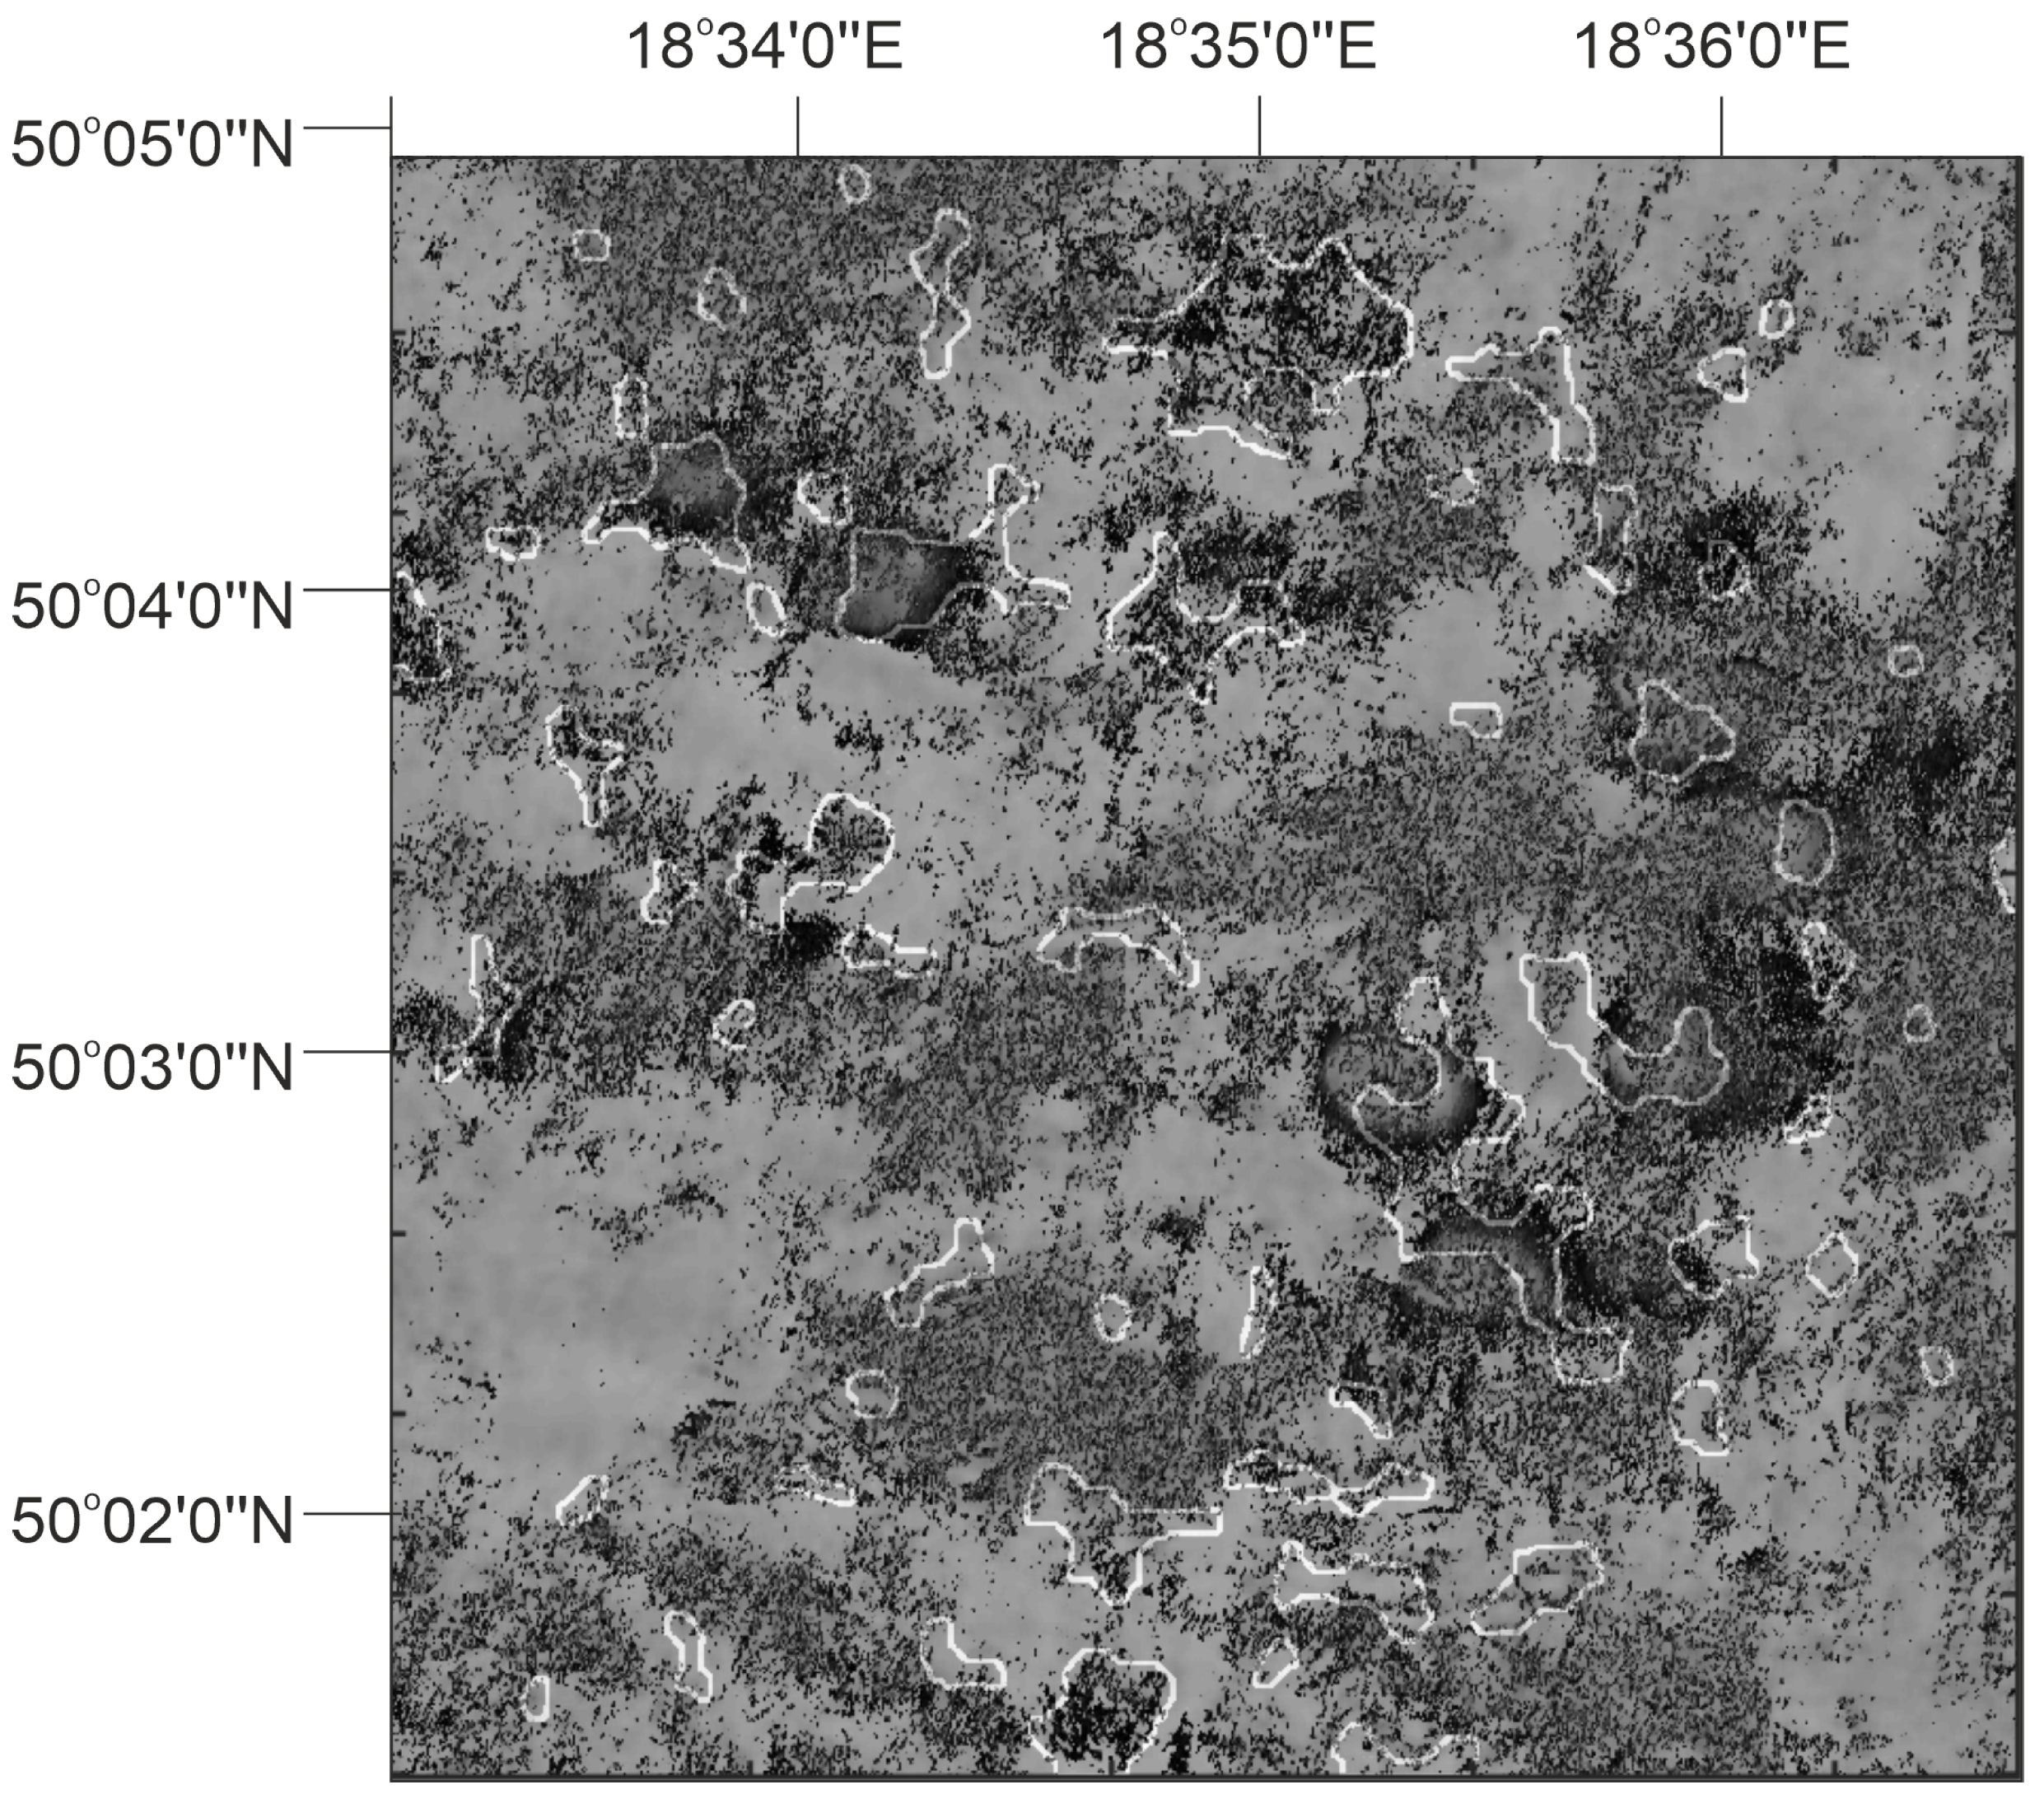
For a map with potential regions where the centers of subsidence troughs may occur, and logical maps of coherence and entropy, multiplication is applied. In
Figure 2, the obtained results (areas surrounded by white lines) are presented on the phase image. Those areas represent more reliable regions (compared to those presented in
Figure 1) where centers of the subsidence trough may occur (called perspective areas). The location and extent of perspective areas are an input for the second step of the detection procedure.
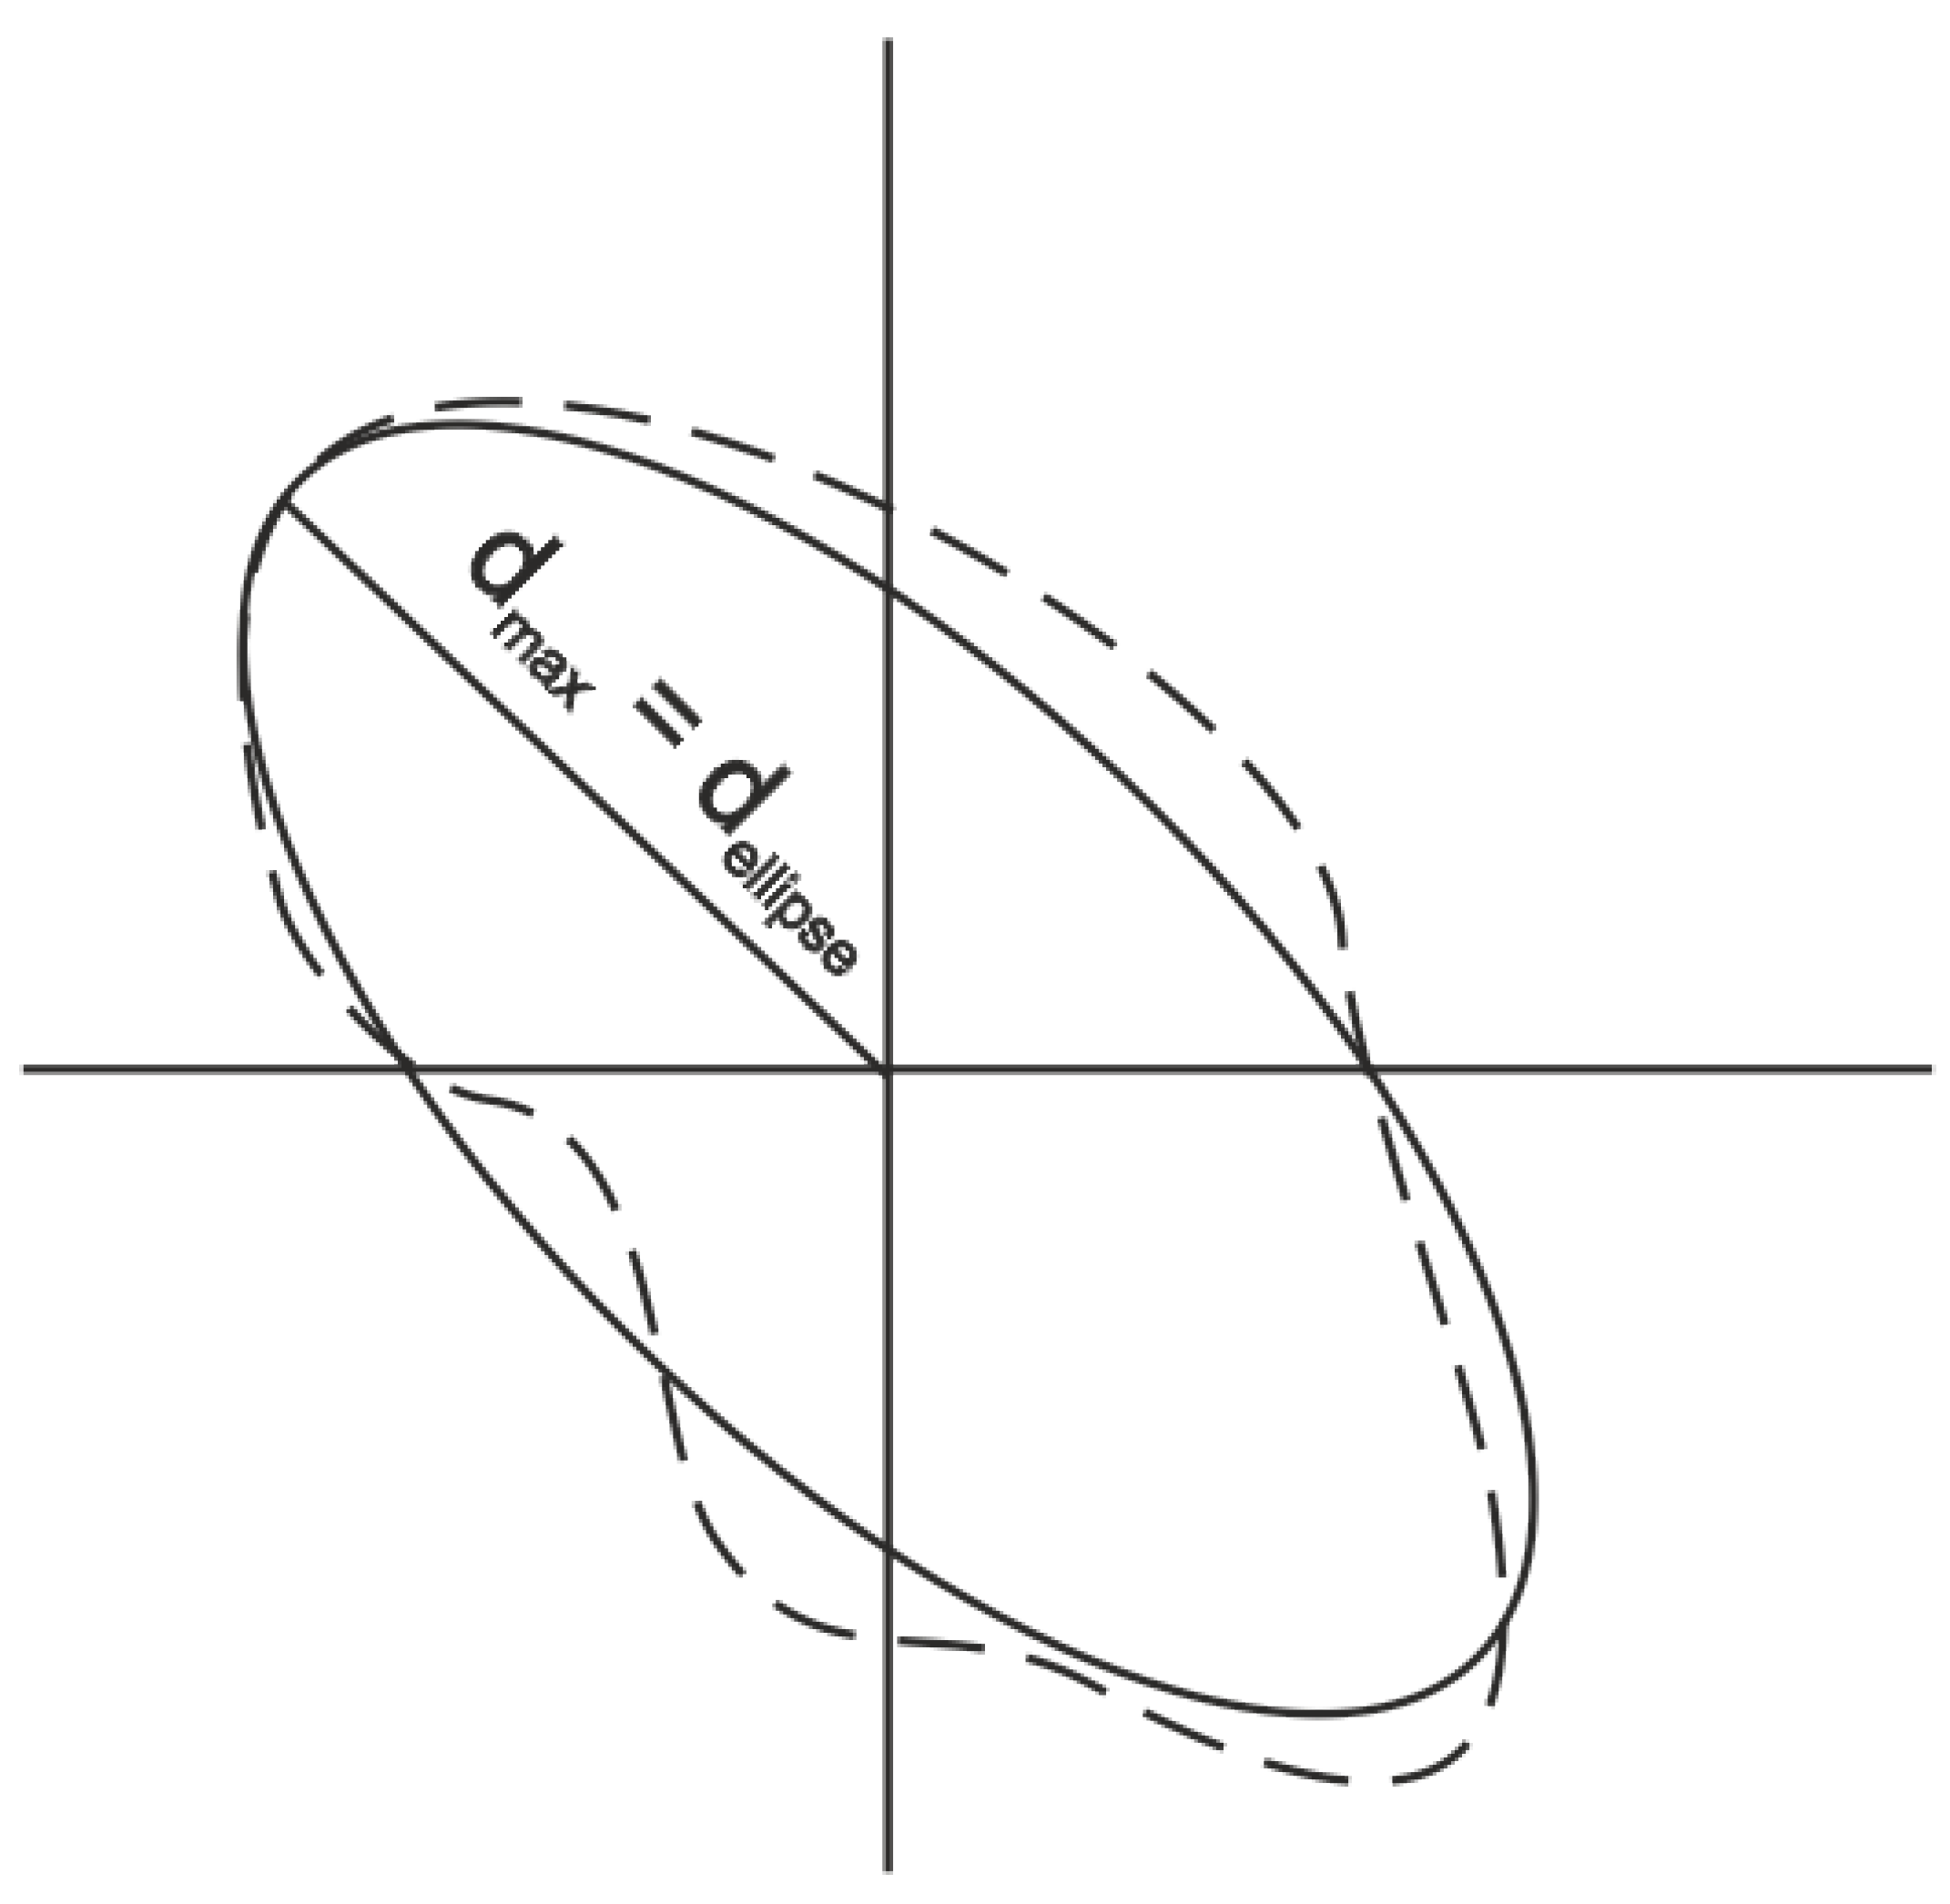
The second stage of the detection algorithm is much more time-consuming than the first one. For each pixel belonging to perspective areas, the center of the theoretical ellipse was set. The method of obtaining values the of theoretical ellipses radius is presented in the next section and
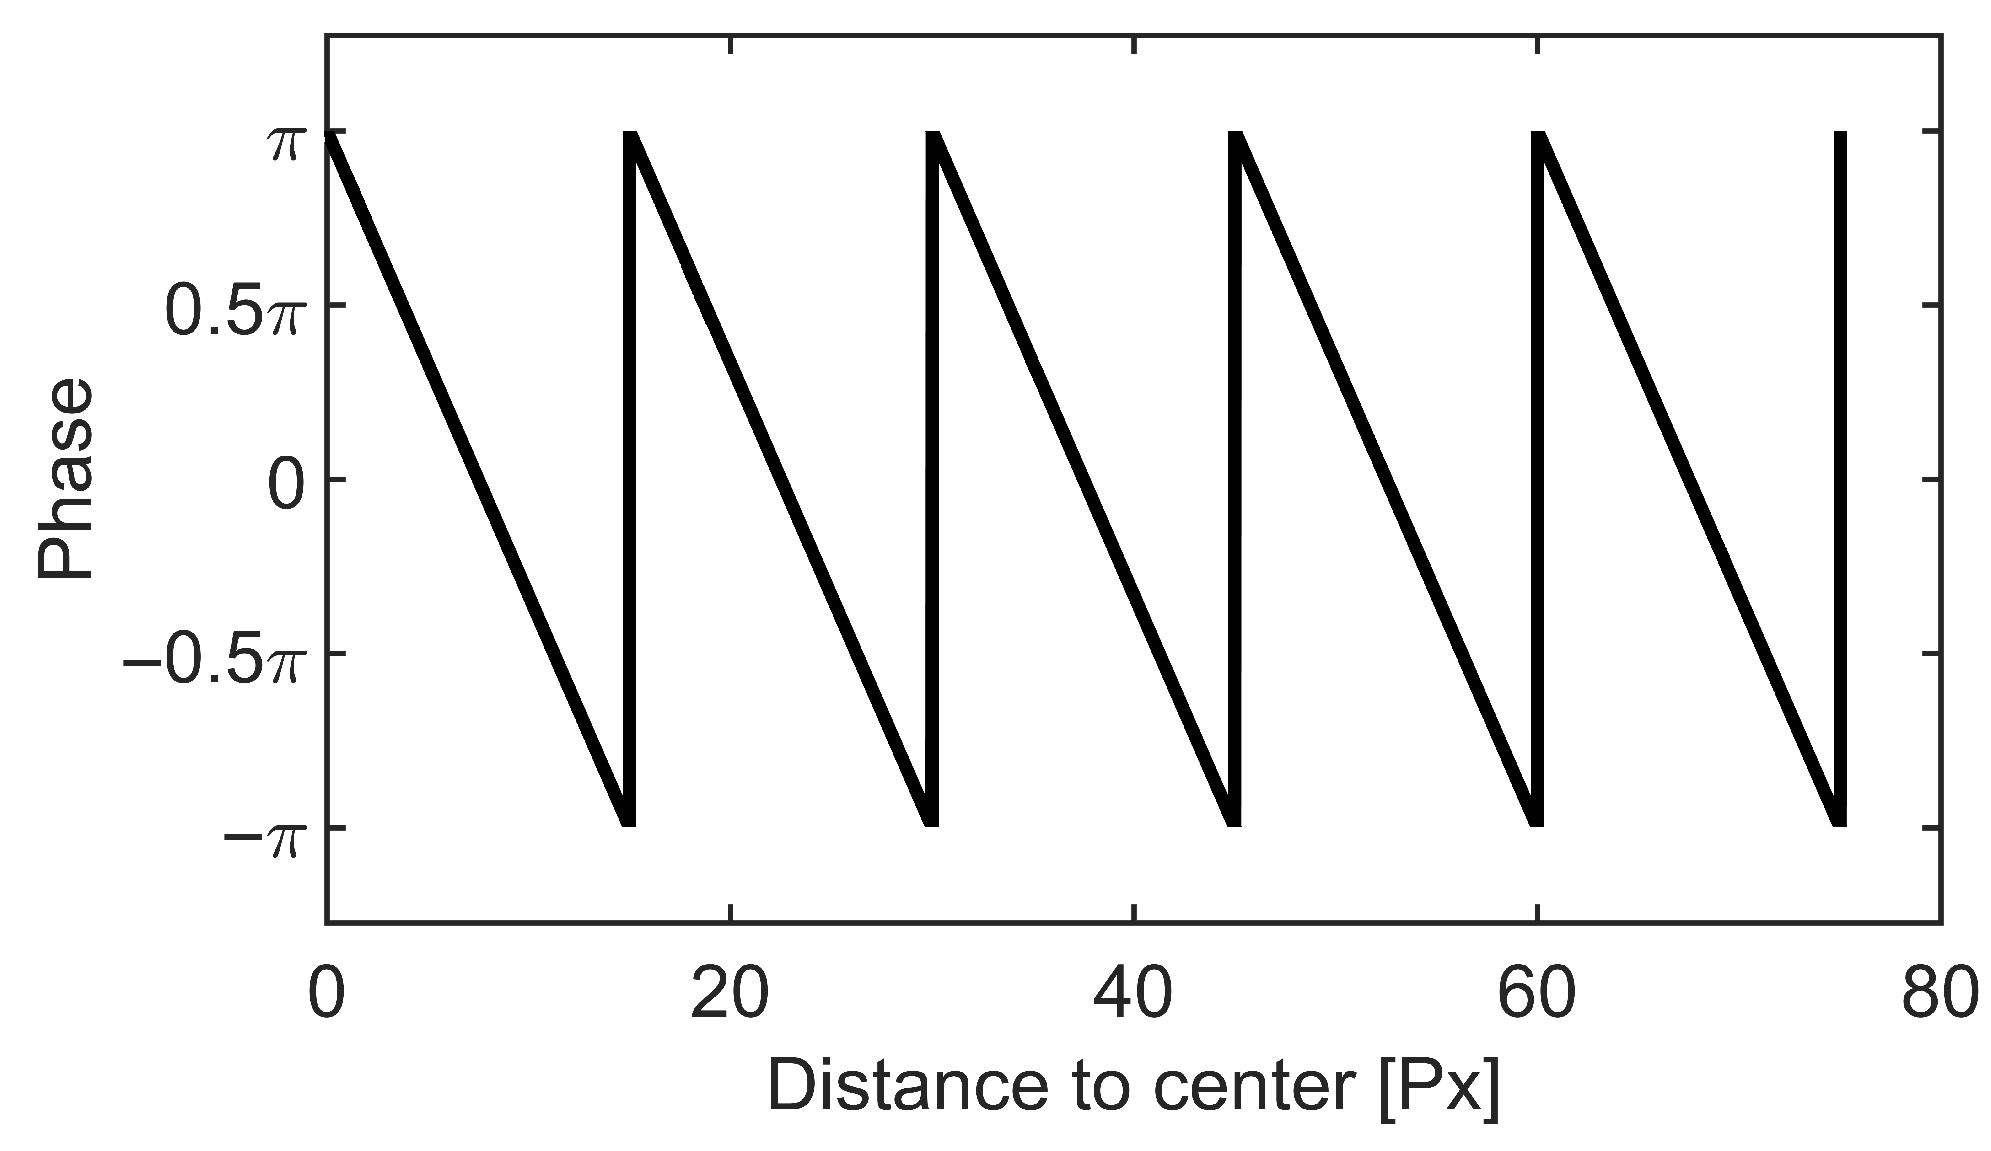
Figure 3. After that, from this center, the rays in each direction (with 5
o step) were created. The length of the rays was set up while taking into account the resolution of the analyzed images and the information about the probable maximal spatial extent of the subsidence trough (in our case, for Sentinel-1 data, this was set to 75 pixels). The correlation between the phase values along those rays and a saw function was calculated, and is presented in
Figure 4 and described in Equation (
2).
where
r—distance to the center of the theoretical ellipse,
—a period of saw function,
—modulo operation. The saw function represents the phase changes characteristic for the interferometric fringes. The shape and period of the saw function are based on a typical period in troughs in tested images.
After that, for each ray, distance
(from the center of the theoretical ellipse) to the maximal value of the calculated correlation was determined. The line connecting the
values for each ray determines the shape of the subsidence pattern (
Figure 3—dotted line). The maximal and minimal values of dmax were used to define the minor and major axes, and orientation of the theoretical ellipse (
Figure 3—solid line).
In the last step of the algorithm, for each pixel from perspective areas, the fitting error (
) between the distance of the maximal correlation function (
) for each radius and theoretical ellipse (
) was calculated according to Equation (
3).
Values of were normalized and inverted to the range of <0,1>, where 1 means . Lastly, only those pixels for which the error function was greater than a threshold (in our case, 0.85) were identified as subsidence areas. The lower the value of the threshold was, the greater the number of false alarms. The greater value of the threshold can suggest that some subsidence areas could be undetected.
3. Experimental Analysis
The developed method was applied to a dataset covering a selected region of the Upper Silesian Coal Basin (USCB) in South Poland. USCB is located in southern Poland and in the Ostrava-Karvina region in the Czech Republic. Mining activity there has been conducted for over 200 years. The USCB region is Poland’s largest hard-coal basin and one of the largest hard-coal deposits in Europe. It is also a large metropolitan region with 37 towns and nearly 3 million residents. It is estimated that an area of around 600 km
2 already suffers from subsidence in USCB [
18].
This is the same test site that was used in [
10], where the detection method based on circular Gabor filters was presented and tested. For the selected region, the subsidence phenomenon is characteristic. The ground deformations are caused by extensive and long-lasting coal exploitation. The occurrence of subsidence troughs was confirmed many times using classical levelling or DInSAR analysis [
19,
20]. In the DInSAR method, a pair of SAR images that correspond to the same area and had been acquired at different times by the same SAR system were used. First, the analyzed SAR images need to be coregistrated, and the phase difference (
) is then calculated for each pixel of the image. In this way, the flattened interferogram is obtained. To remove the component associated with the topography of the studied region, the Digital Elevation Model (DEM) is used. DEM is converted into the synthetic interferogram, which is then subtracted from the flattened interferogram. As a result, the differential interferogram is obtained. Its phase values can be directly linked to ground deformations. The subsidence phenomenon, especially related to mining activity, usually manifests itself on the differential interferograms as elliptical interferometric fringes. The density of the fringes is correlated with the size of the deformations.
In the presented work, as in [
10], the efficiency of the presented subsidence trough detection algorithm was tested using three differential interferograms generated on the basis of Sentinel-1 SAR data. The interferogram concerns the following time spans: 10–22 October 2016 (interferogram I), 10 October–3 November 2016 (interferogram II) and 22 October–3 November 2016 (interferogram III). All interferograms were prepared using SNAP. The interferograms were filtered twice, using the Goldstein and Lee filtering methods. Goldstein filtering was applied before the removal of the topographic phase, whereas the Lee filtering method was applied to differential interferograms. The parameters of both methods are shown in
Table 1. The multilooking procedure was not applied during processing step. More information about the used datasets and their processing parameters can be found in [
10]. The main stages of the subsidence trough detection algorithm were performed using the Mathworks MATLAB 2019b computing package.
The proposed algorithm of the automatic detection of subsidence areas was applied to both interferograms computed using VV and VH channels of SAR images. Results are presented in
Table 2 and
Figure 5,
Figure 6 and
Figure 7.
Table 2 shows a number of undetected troughs that had a very irregular shape.
is a number of areas incorrectly classified as subsidence troughs (false alarms).
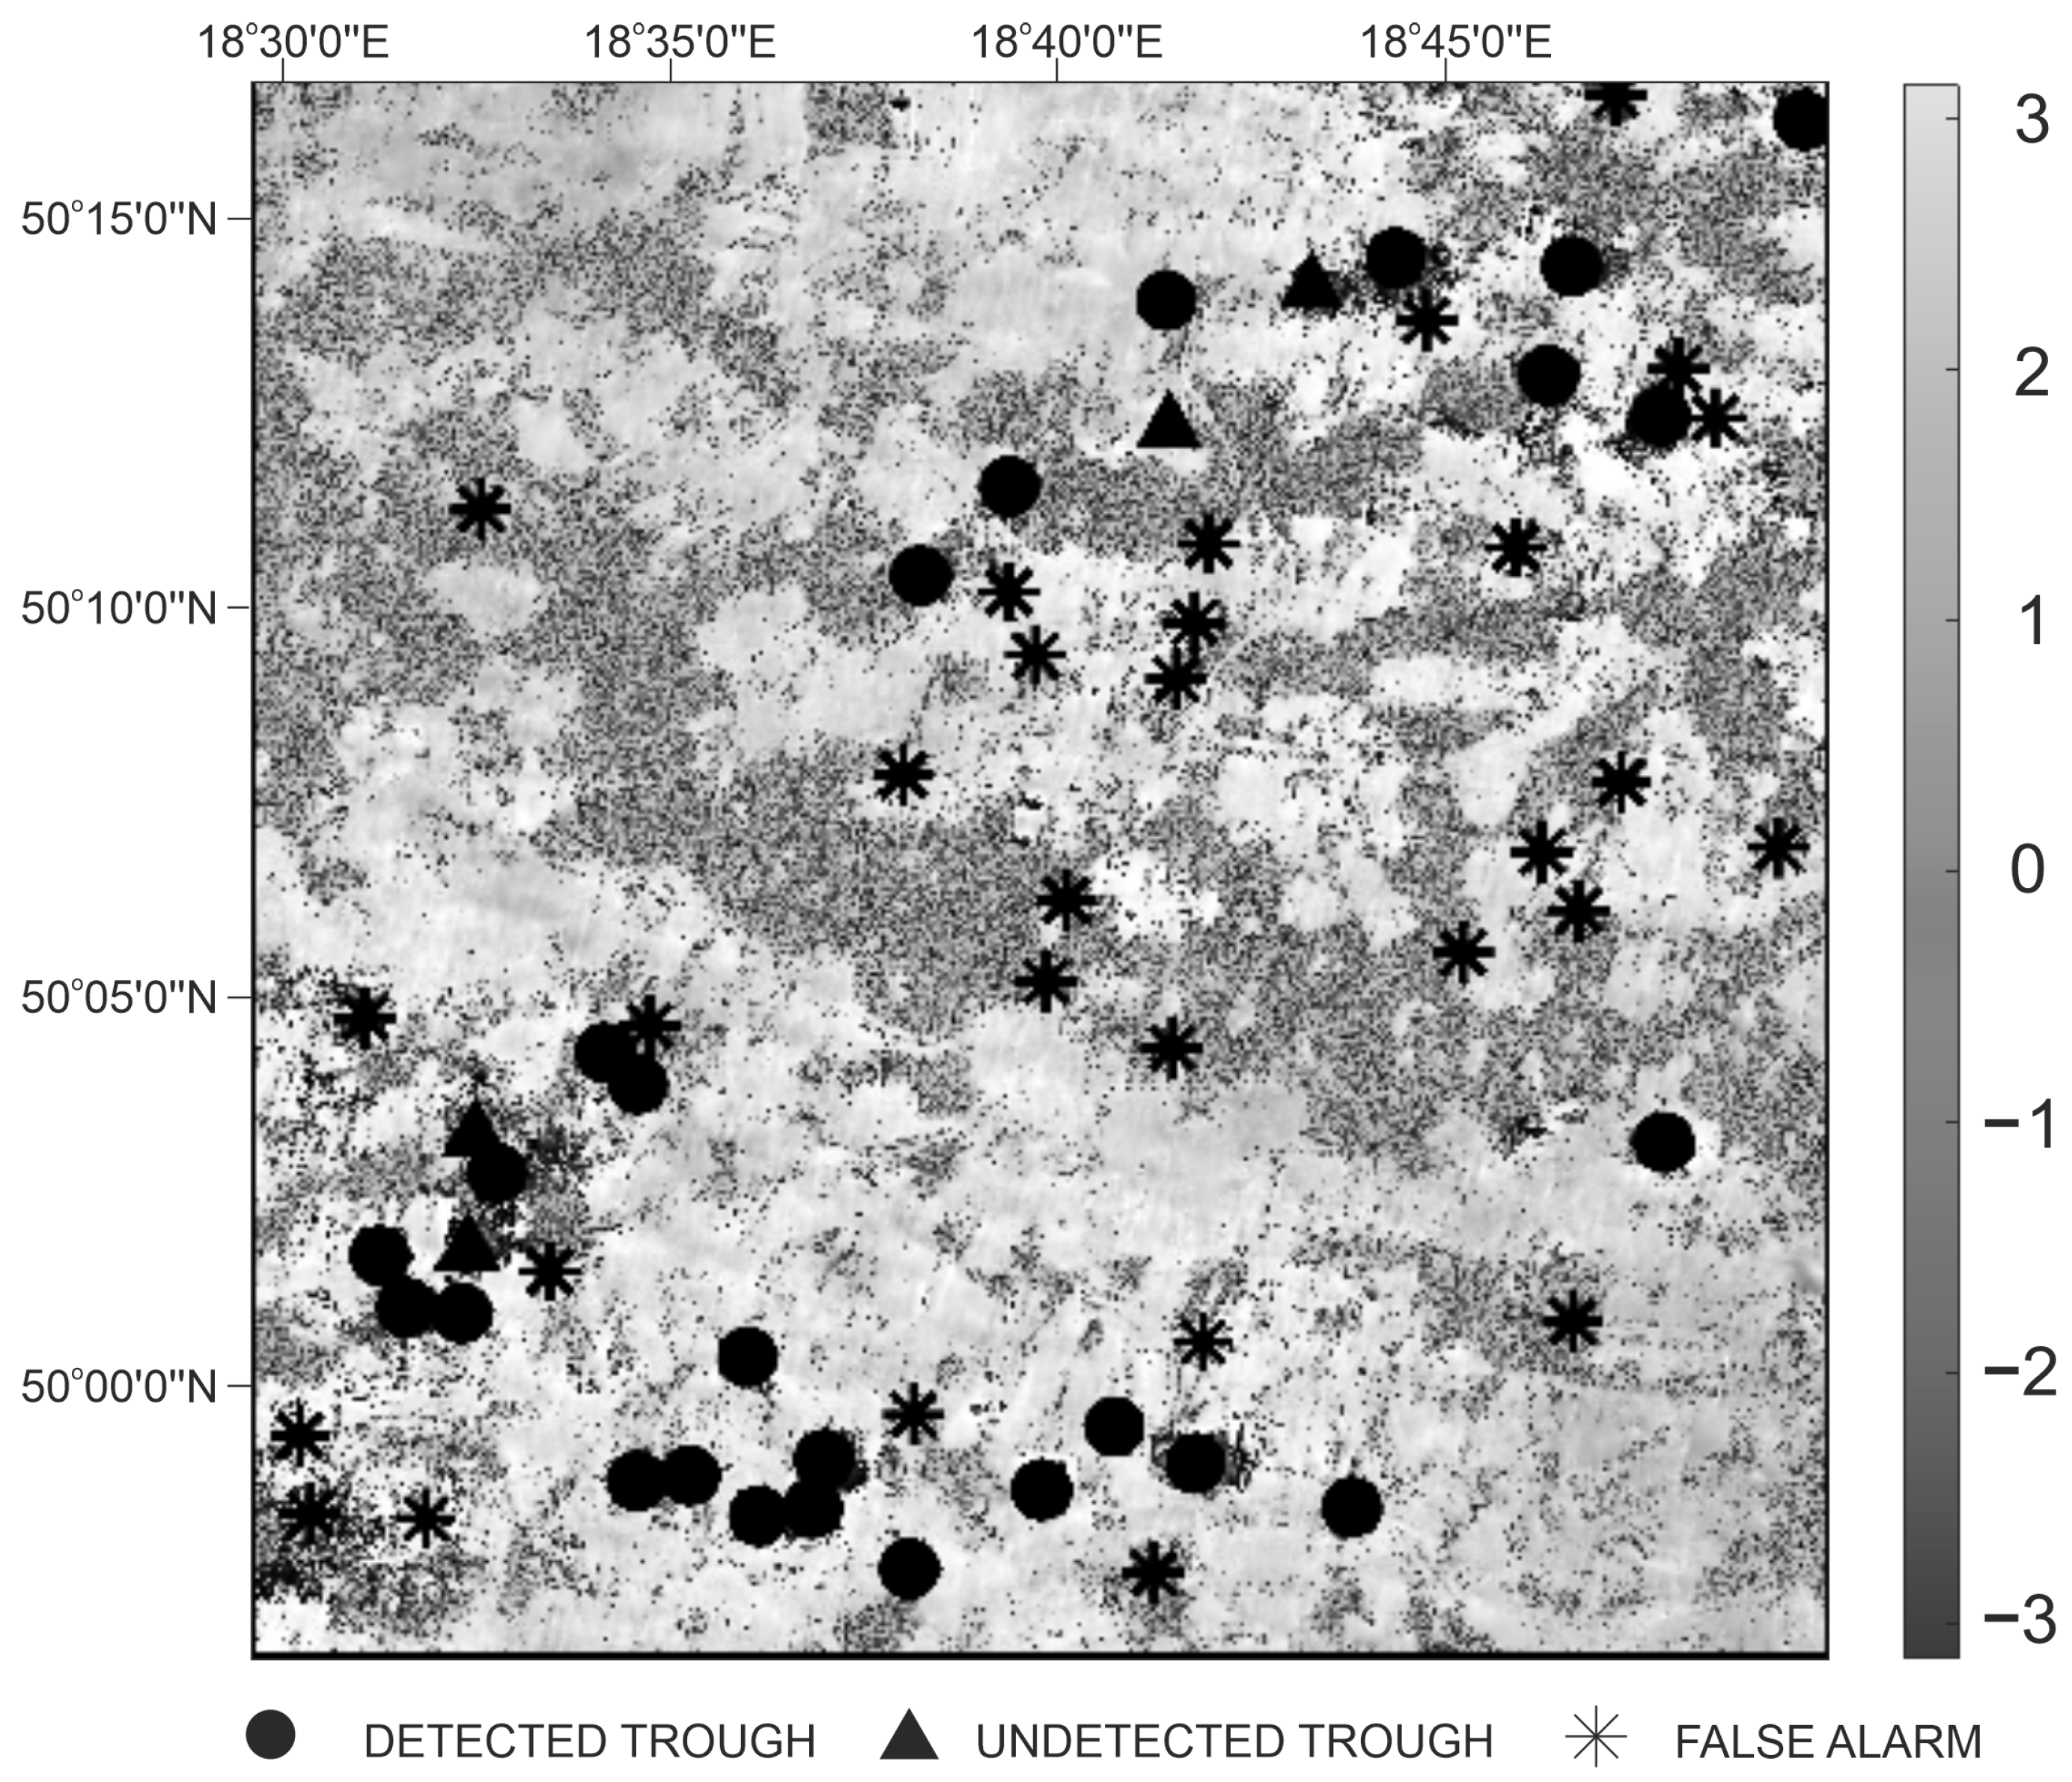
Table 2 shows that, for all analyzed cases, the best results were obtained for VV channels. In the case of VH channels, fewer subsidence troughs were detected, and more false alarms were noticed. Taking into account the results of both polarimetric channels (VH and VV), the number of false alarms could be significantly reduced (even more than sevenfold for interferogram I). However, in such cases, the number of correctly detected troughs can also decrease more than twice the time (interferogram II). The best results of subsidence area detection were obtained for interferogram I (
Figure 5). In this case, for VV channels, 26 subsidence troughs (86.7%) were correctly identified, and 30 false alarms were created.
Table 3 shows that, for interferogram I, the results for VH channels are only slightly worse than for VV channels. Therefore, it is beneficial to take into account both channels. VH and VV results are characterized by a high number of correctly detected subsidence troughs (25, which accounts for 83.3% of all troughs) and a low number of false alarms (only 4 cases).
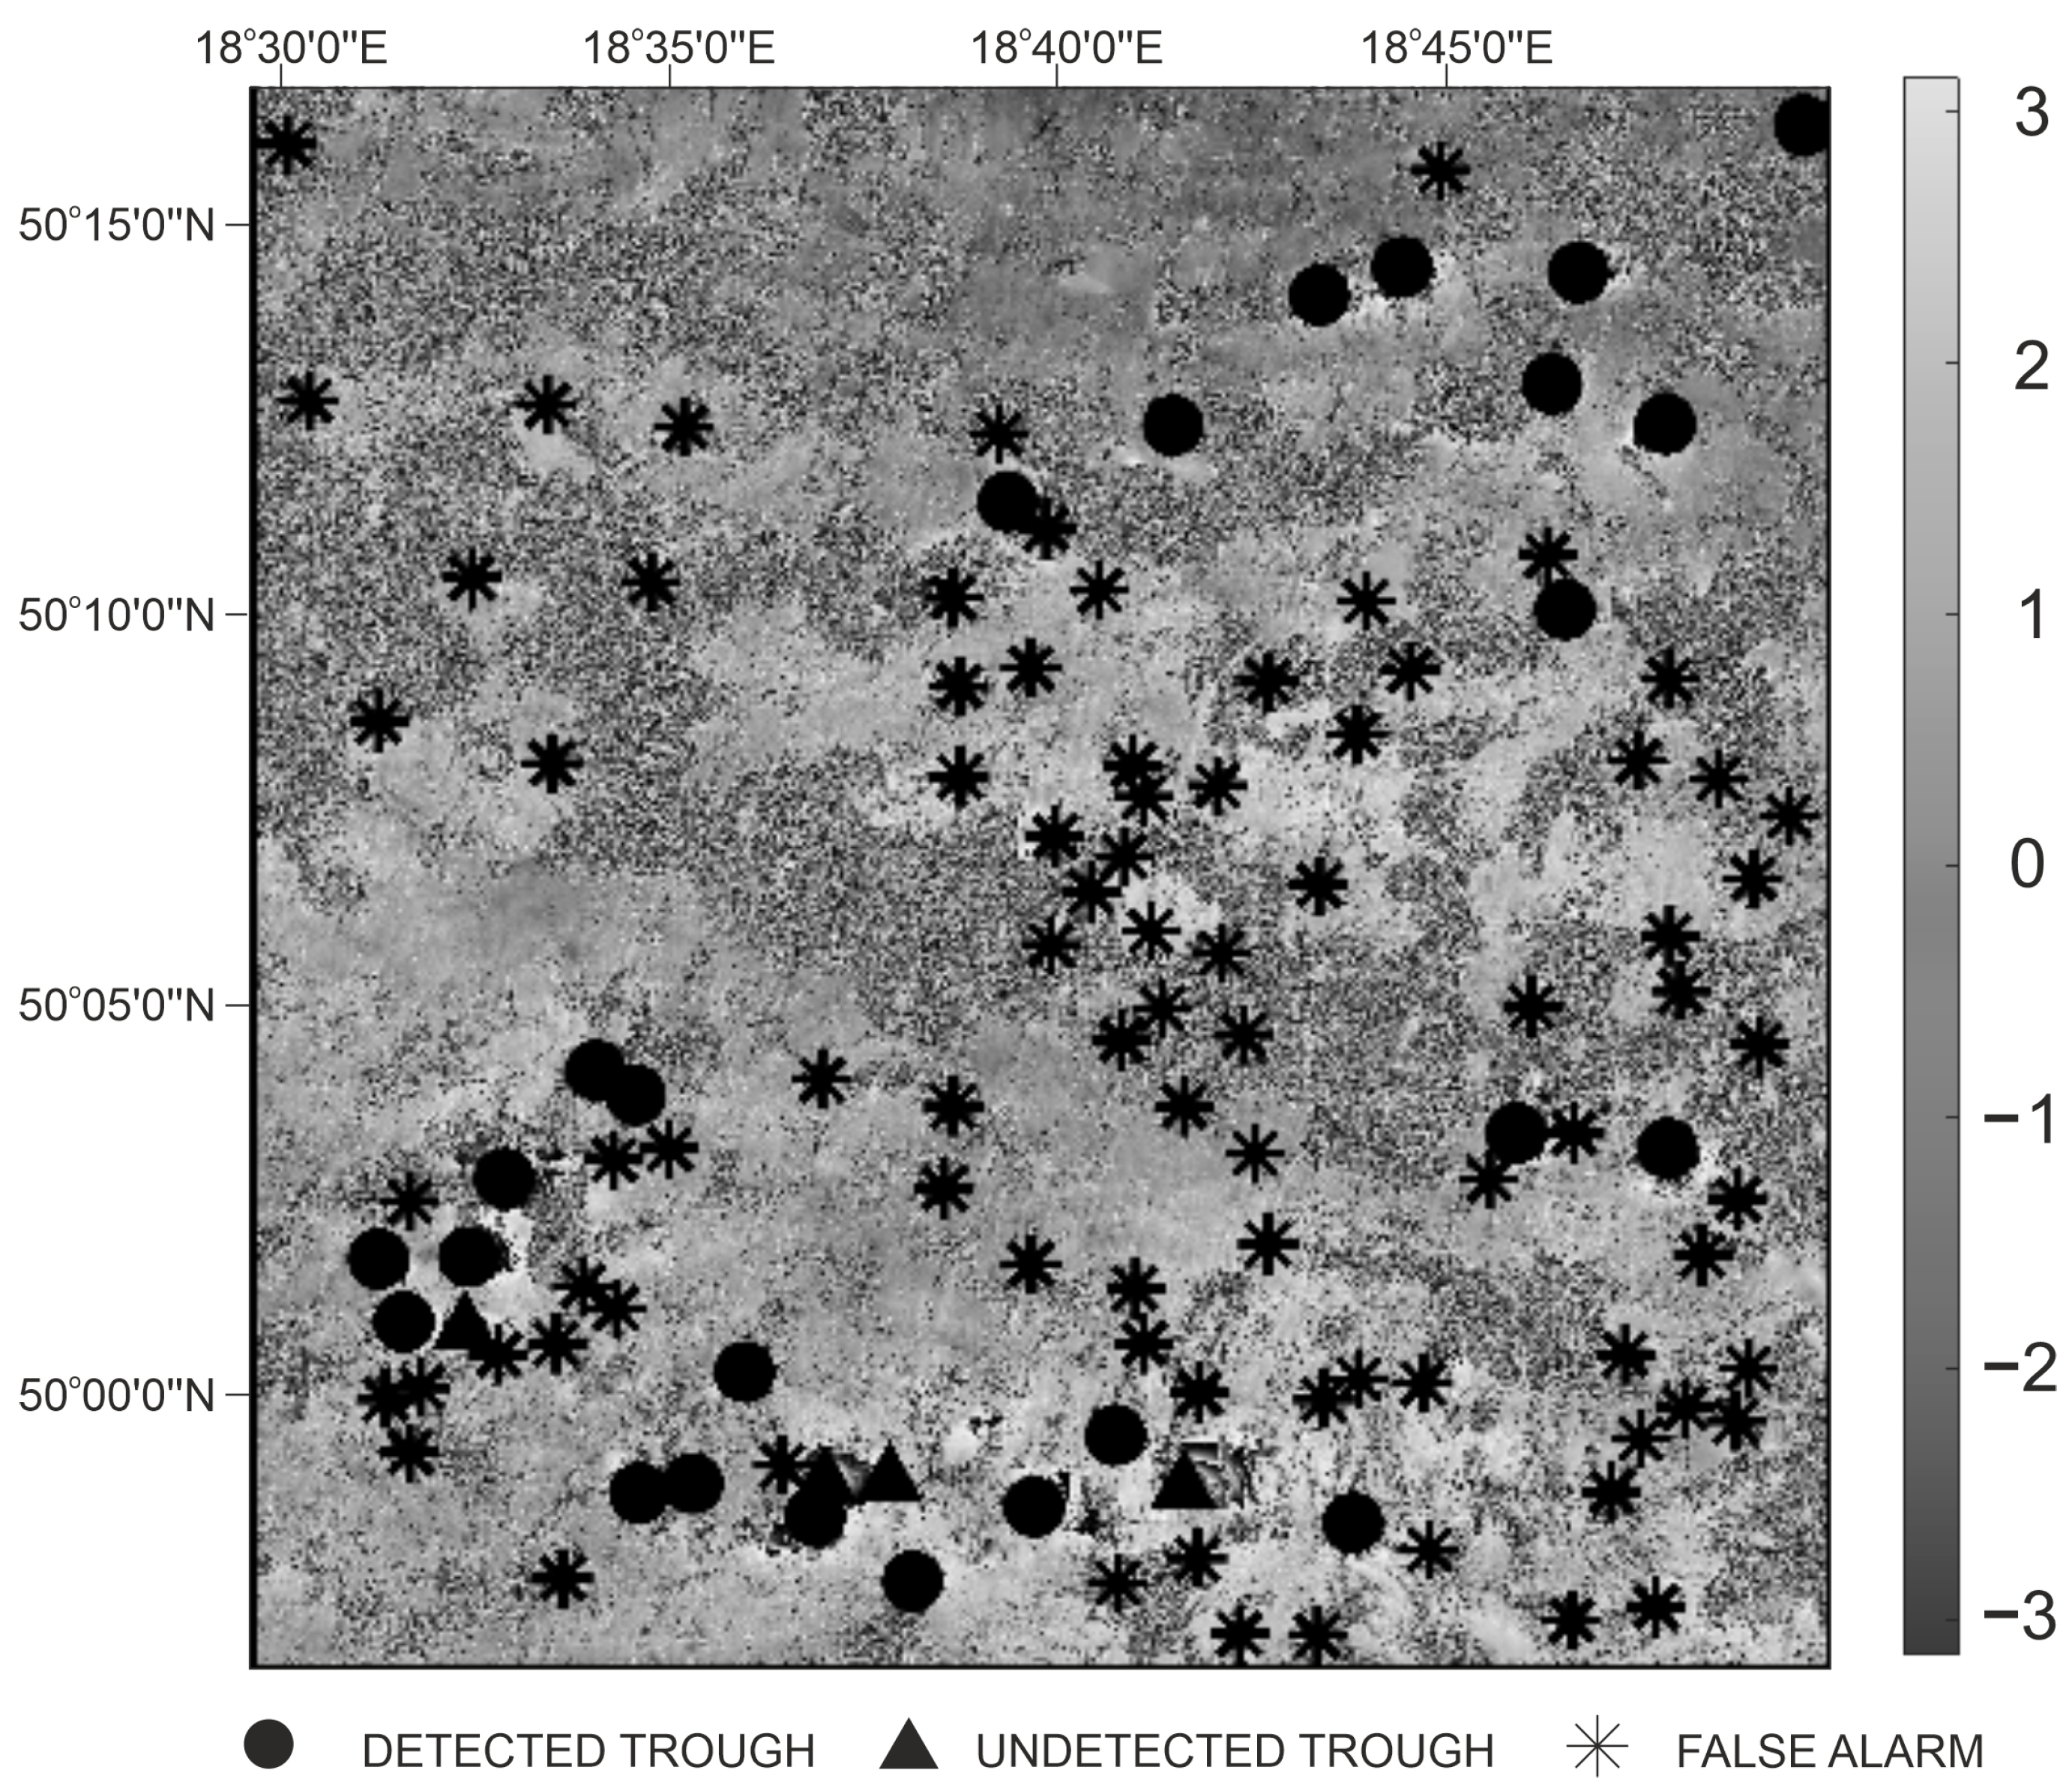
The detection results for interferogram II (VV channel) are presented in
Figure 6. The number of correctly identified subsidence troughs was high and totalled 25 (86.2% of all troughs). However, for interferogram II, the number of false alarms was very high, equal to 86 cases. Additionally, results for the VH channel were significantly worse, and false alarms decreased by using a logical product of VV- and VH-based results, compound detection accuracy.
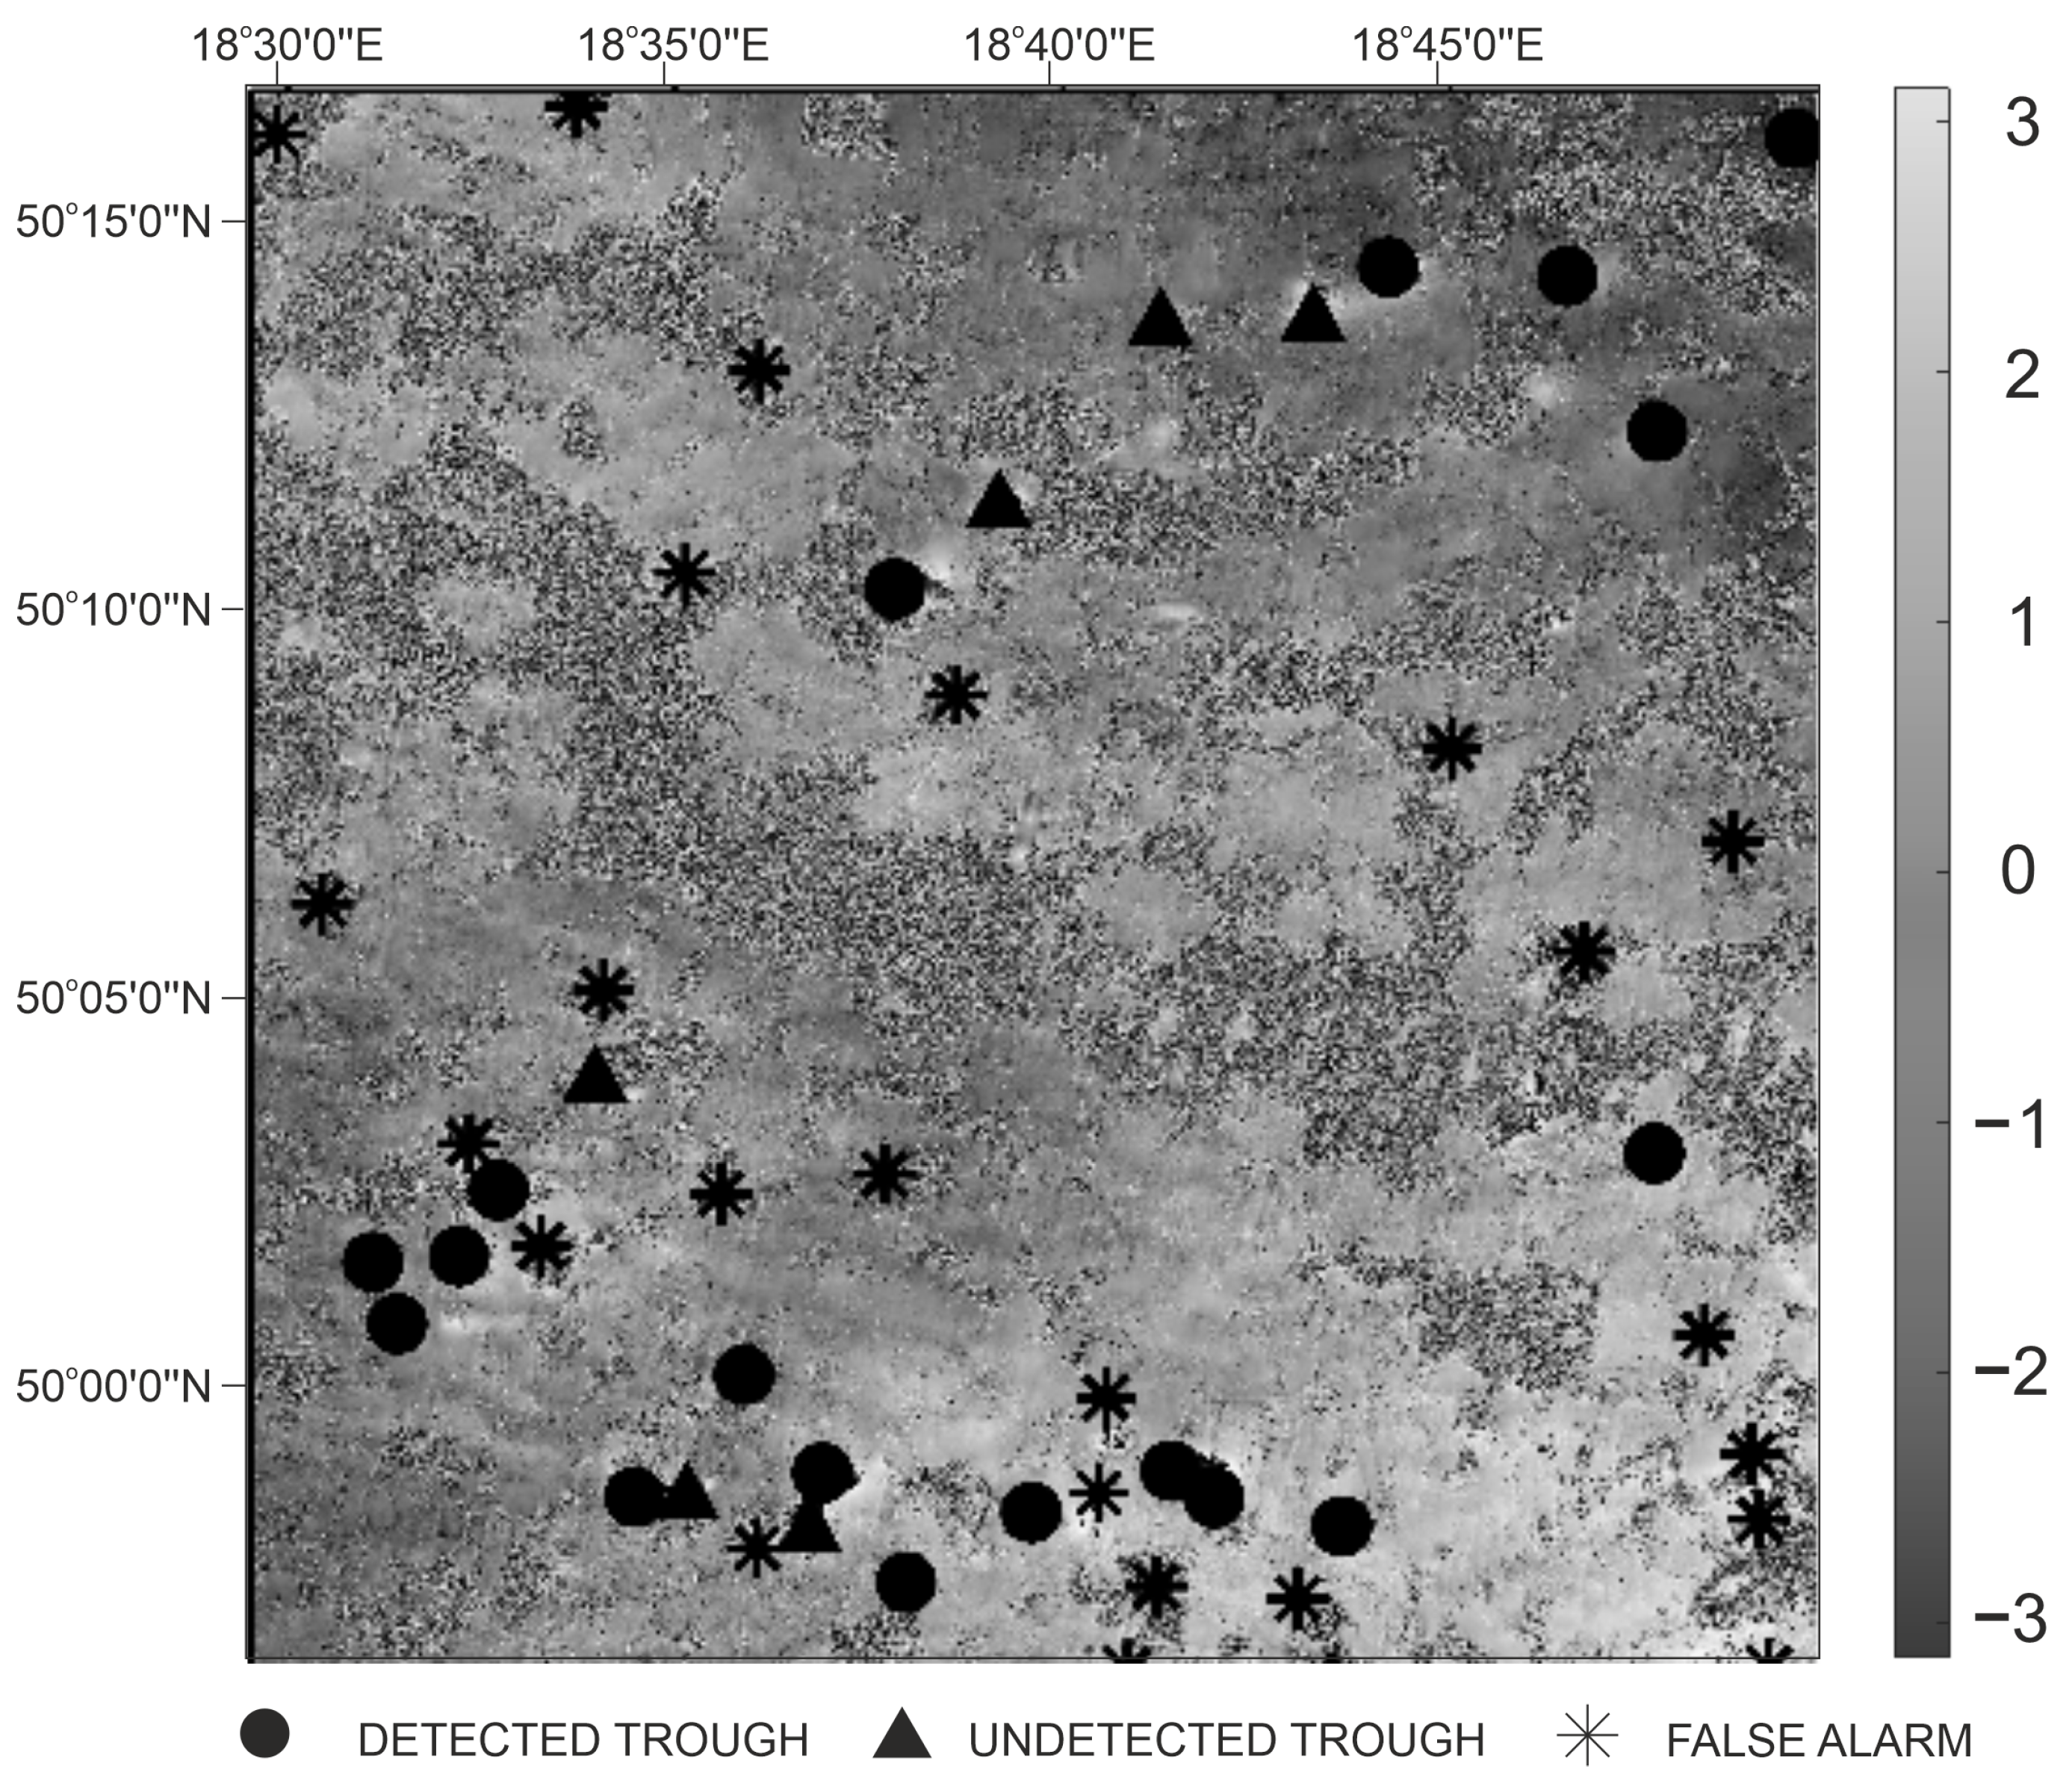
For the third interferogram (VV channel), the proposed method allowed for correctly detecting 18 of 24 (75%) subsidence troughs (
Figure 7). The number of false alarms was 25, which may be significantly reduced to 9 cases when the results of VH and VV are taken into account. In such a case, the number of undetected troughs increased from 6 to 7.
Table 2 also shows that, for all analyzed interferograms, the number of undetected troughs with irregular shapes (
) and a number of false alarms with a shape similar to subsidence pattern (
) were very low, and in both cases did not exceed 20%. In the case of a method based on a circular Gabor filter [
10], the
and value of
reached 60%. For the algorithm proposed in this paper, the irregularity of the subsidence pattern is thus not a crucial problem in the detection procedure.
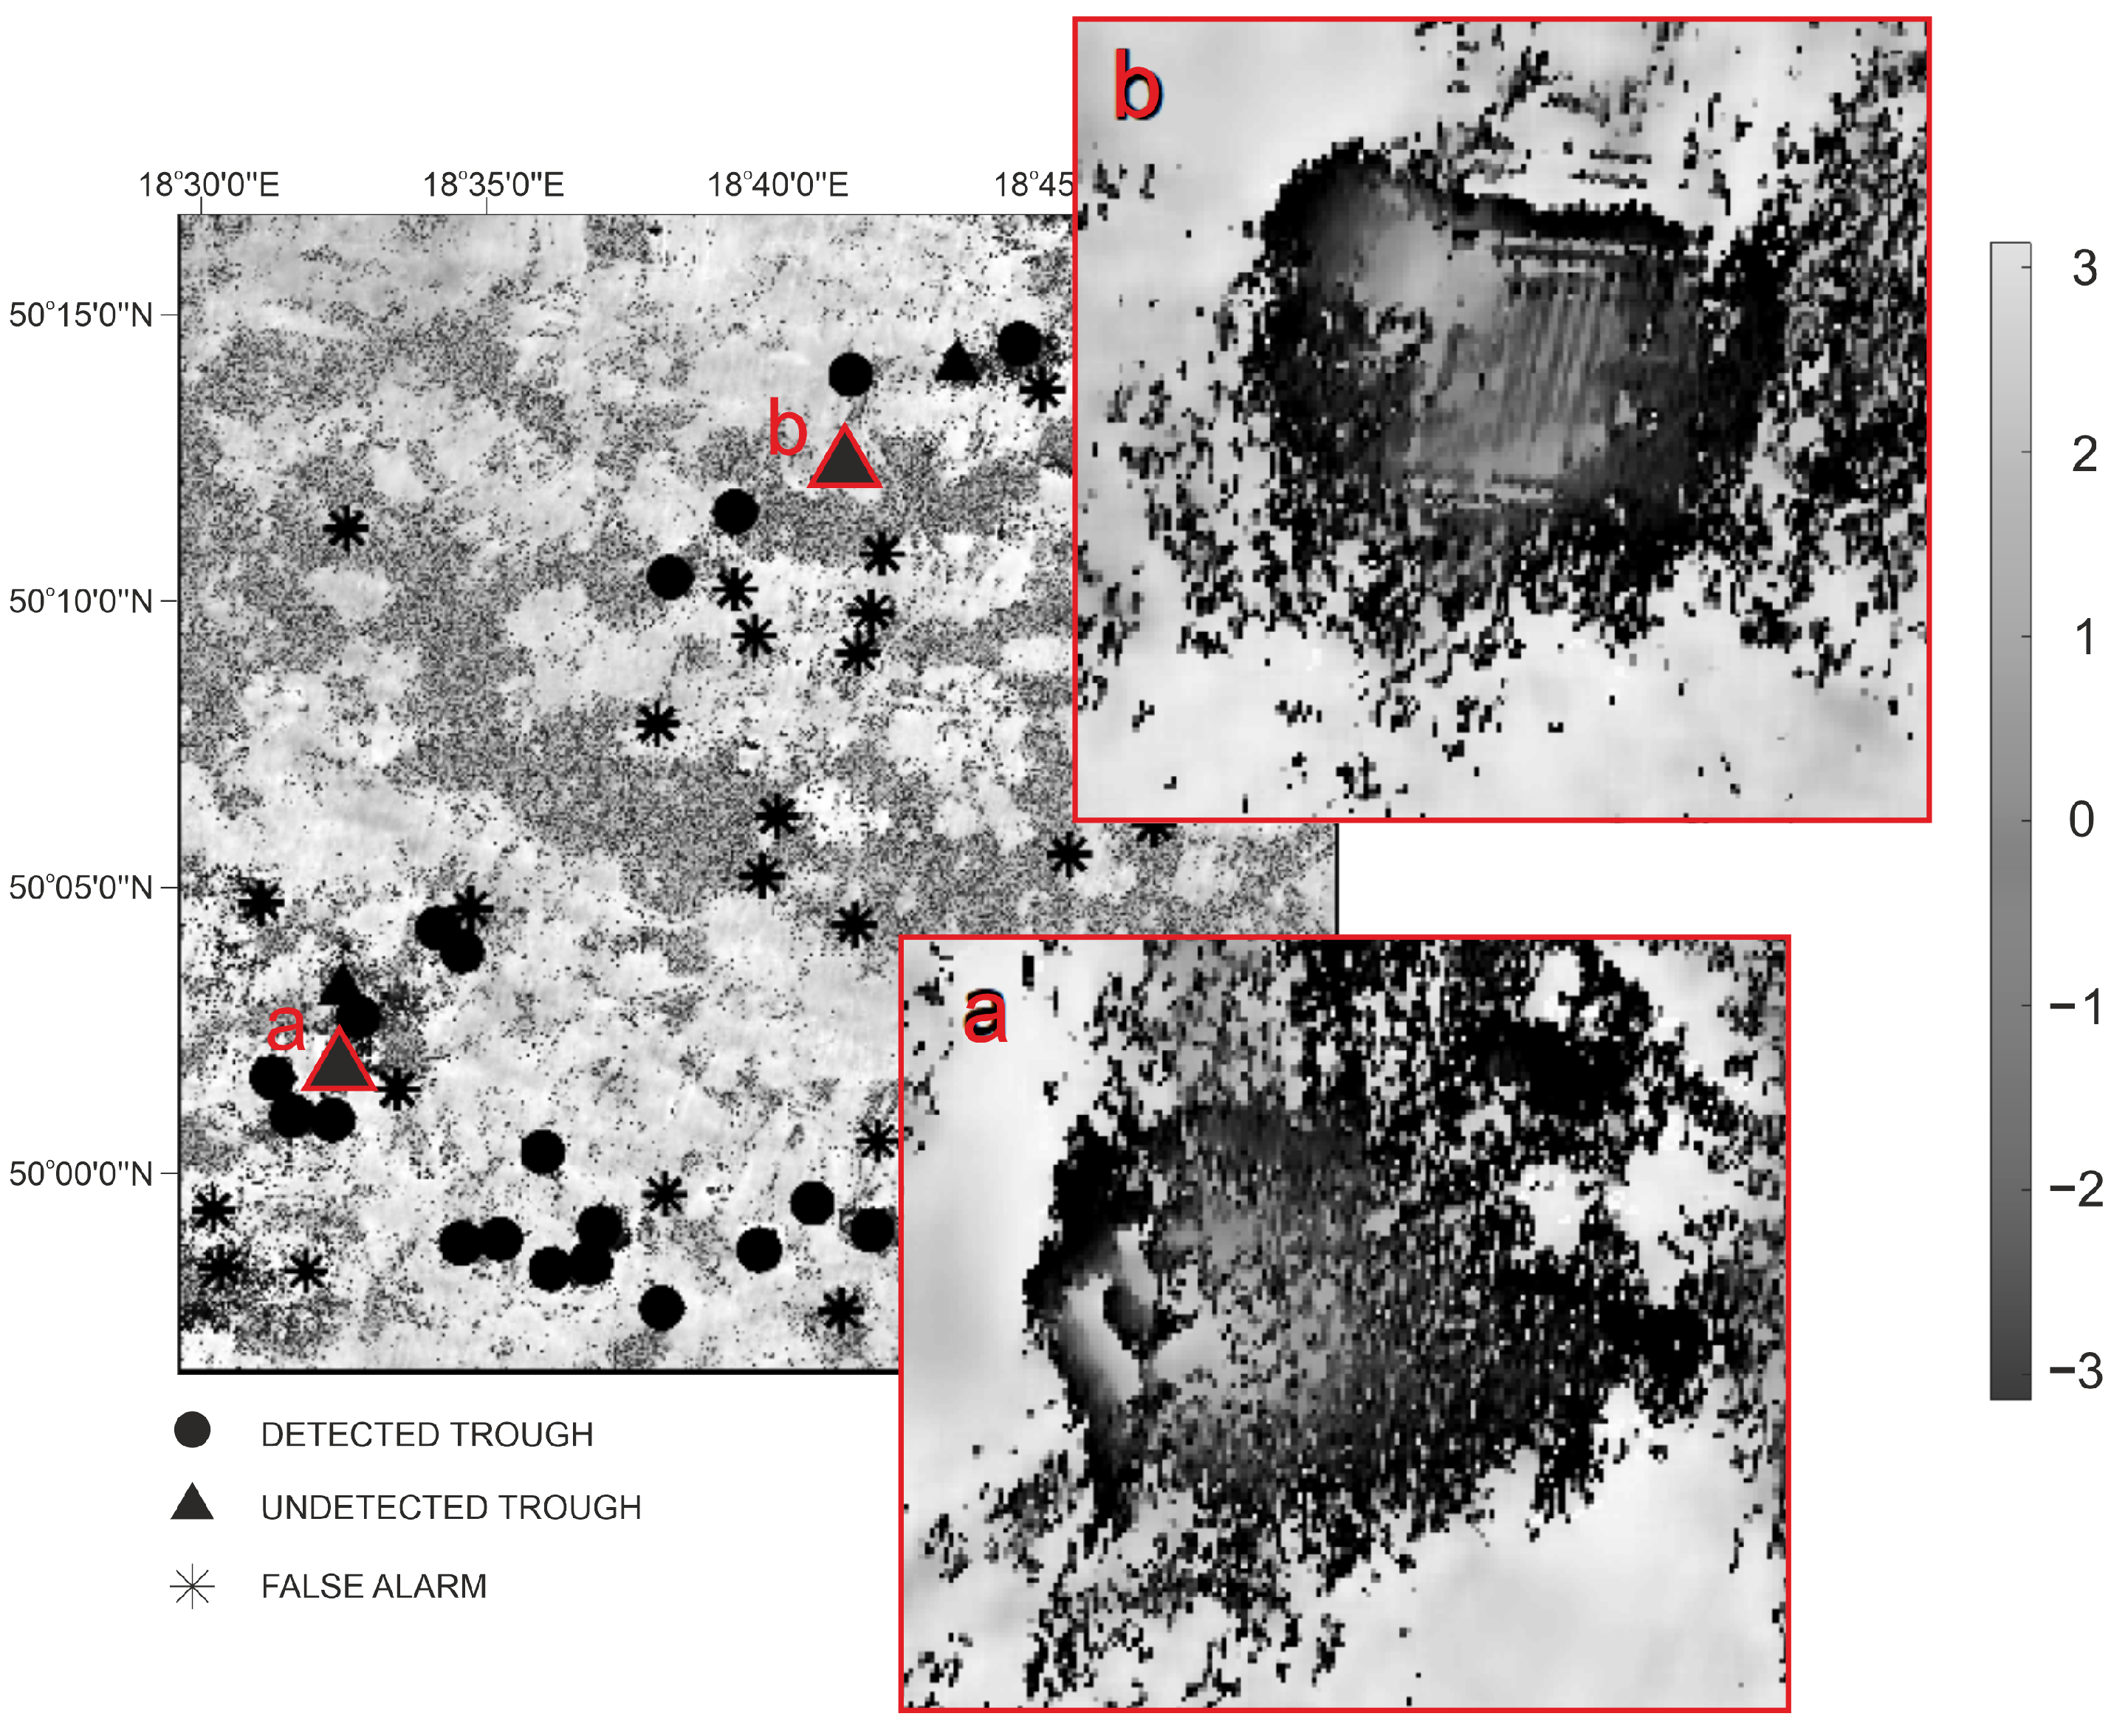
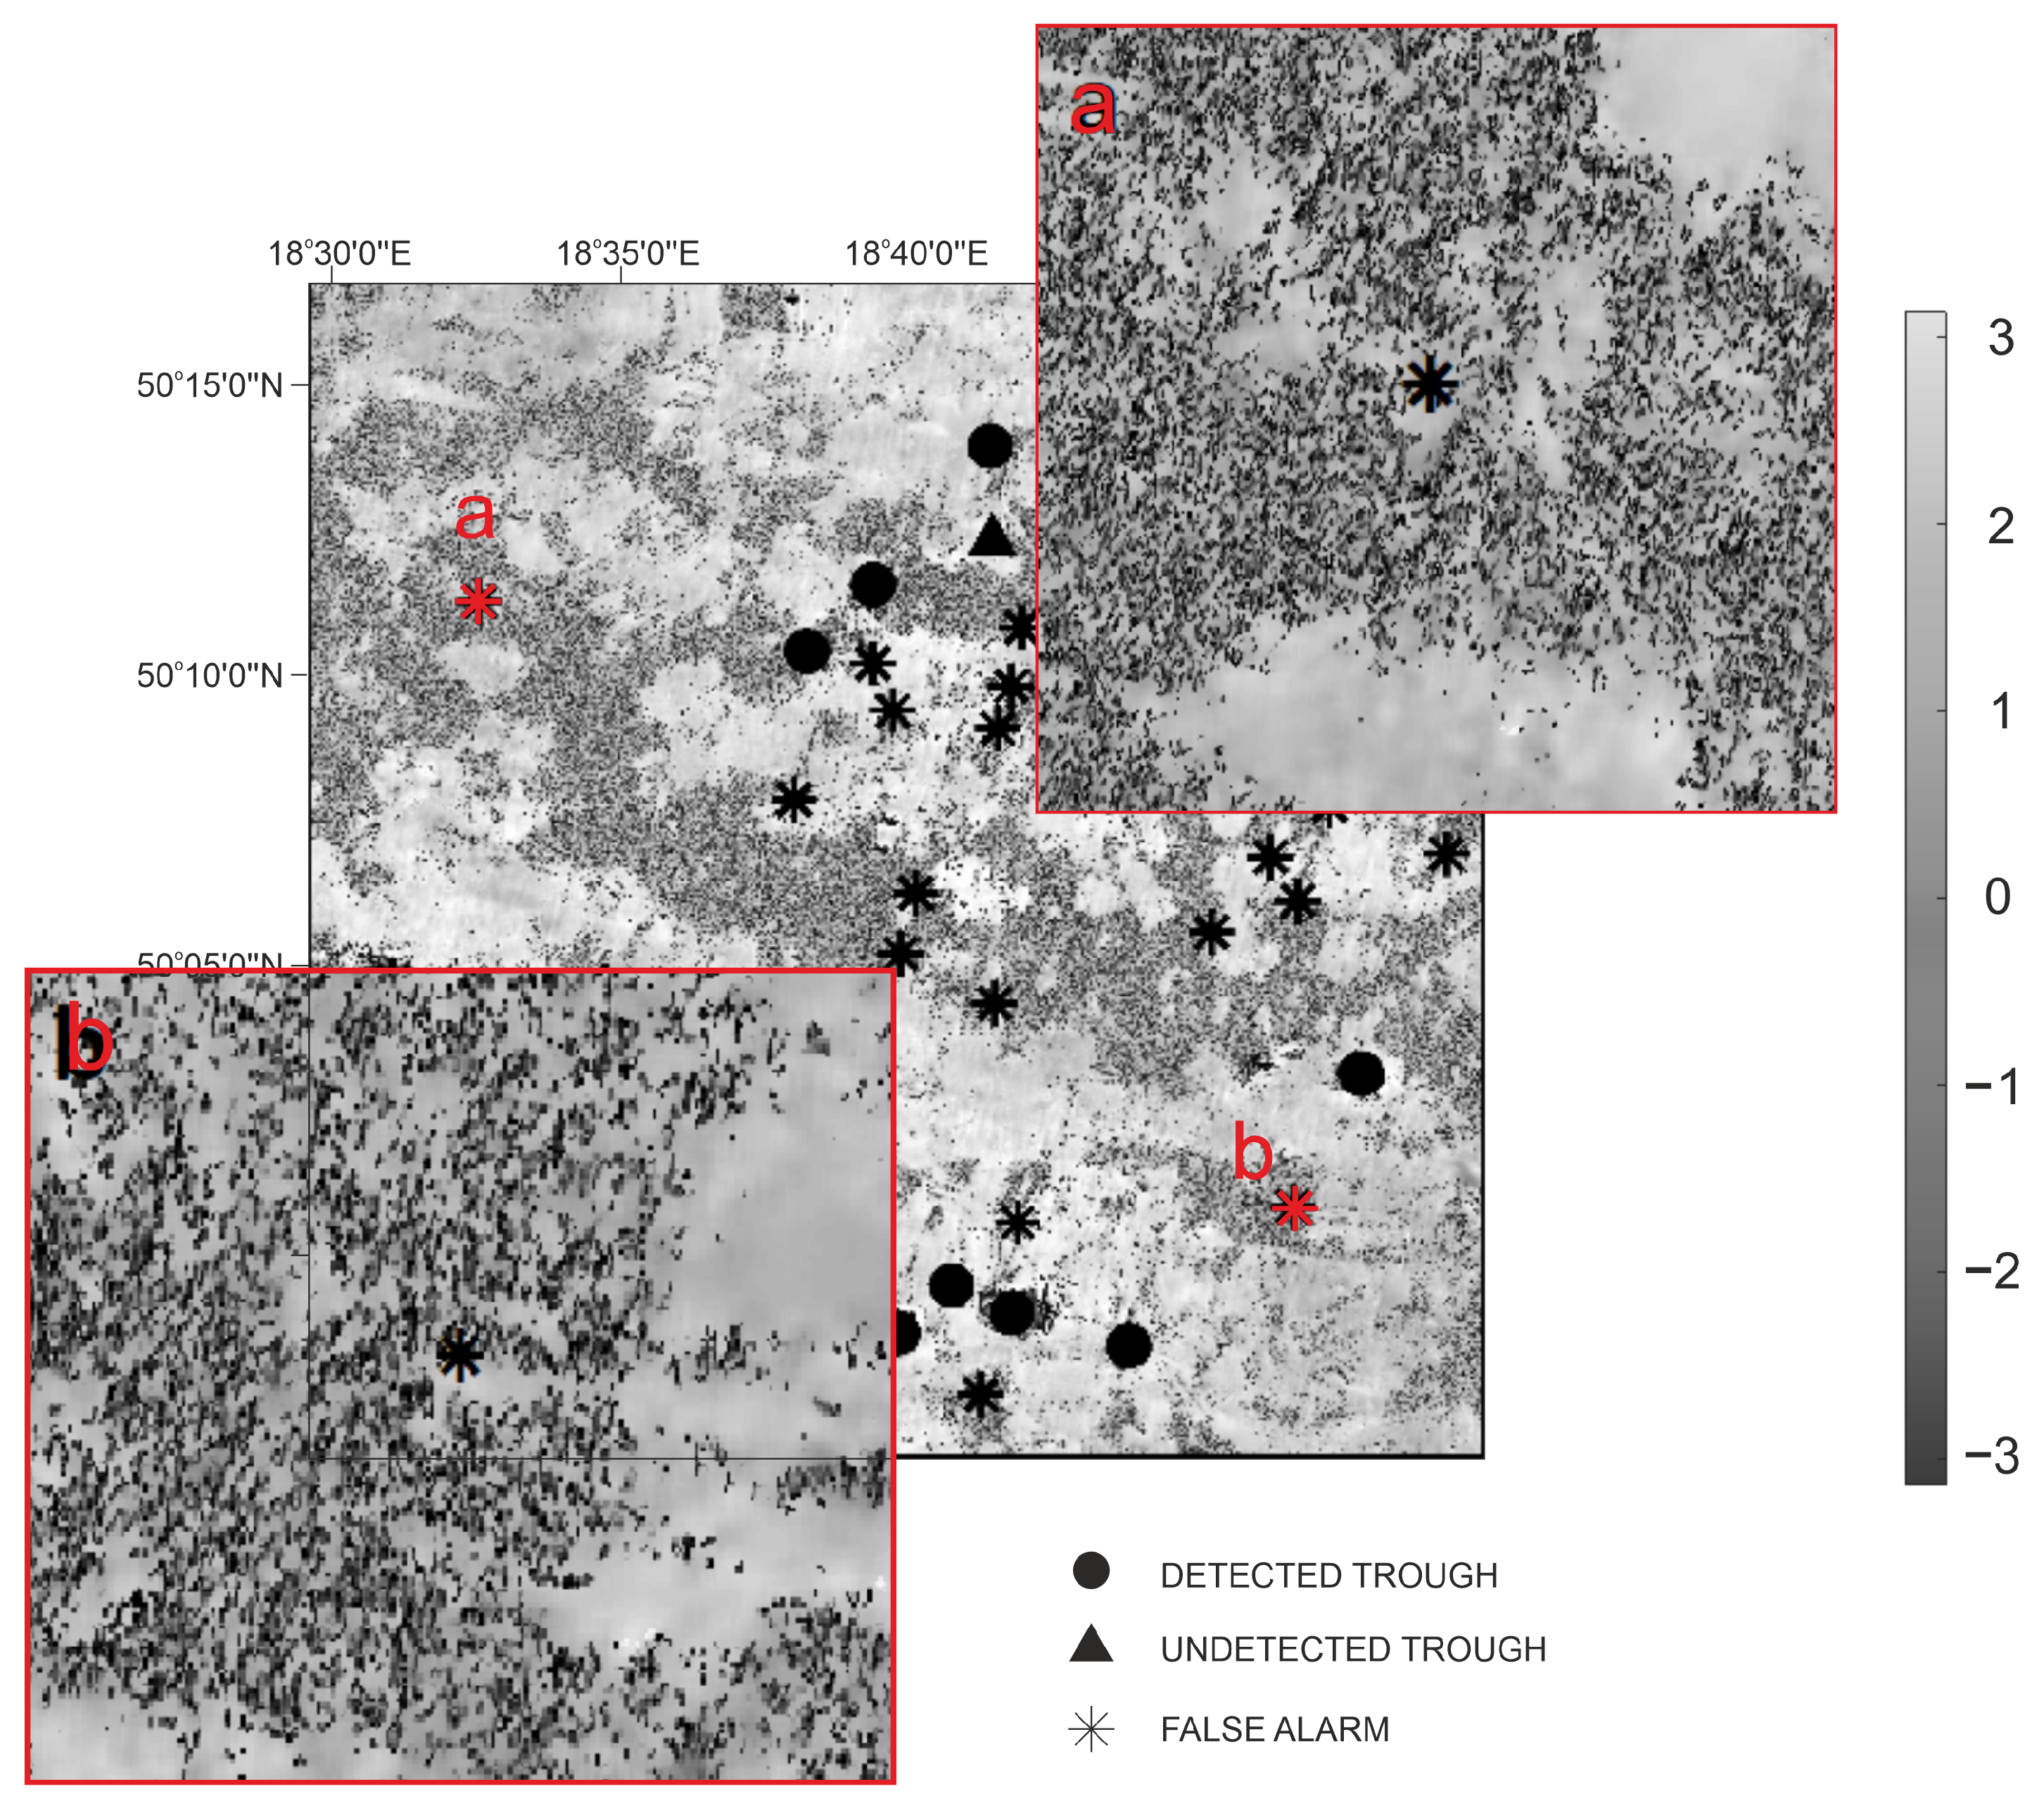
Figure 8 shows the example of two undetected subsidence patterns. The subsidence pattern presented in
Figure 8 (left image) was not detected because of its strong irregularity in different directions. This irregularity produced very high error function values.
Figure 8 (right) shows the subsidence pattern, where an incomplete interferometric fringe pattern occurred (due to the relatively low ground subsidence magnitude—less than half of the radar wavelength).
Figure 9 shows examples of false alarms from interferogram I. They appeared in regions where there were no similar patterns to those characteristic for subsidence troughs. Such regions should be removed from analysis in the first step. However, probably due to a not restrictive enough threshold on coherence and entropy, they passed to the second step of the analysis.
Table 3 shows the comparison between obtained results using the proposed algorithm and those from a method based on circular Gabor filters [
10].
Table 3 shows that, for interferograms I and III, the number of correctly detected troughs by the proposed method was higher than that in the method based on circular Gabor filters. However, for interferogram III, the number of false alarms also increased. In the case of interferogram II, the proposed method gave worse results than those of the method based on circular Gabor filters. For this interferogram, the number of correctly detected troughs was similar for both methods, but the number of false alarms in the method proposed in this paper was significantly higher.


 ,
, 


