Article

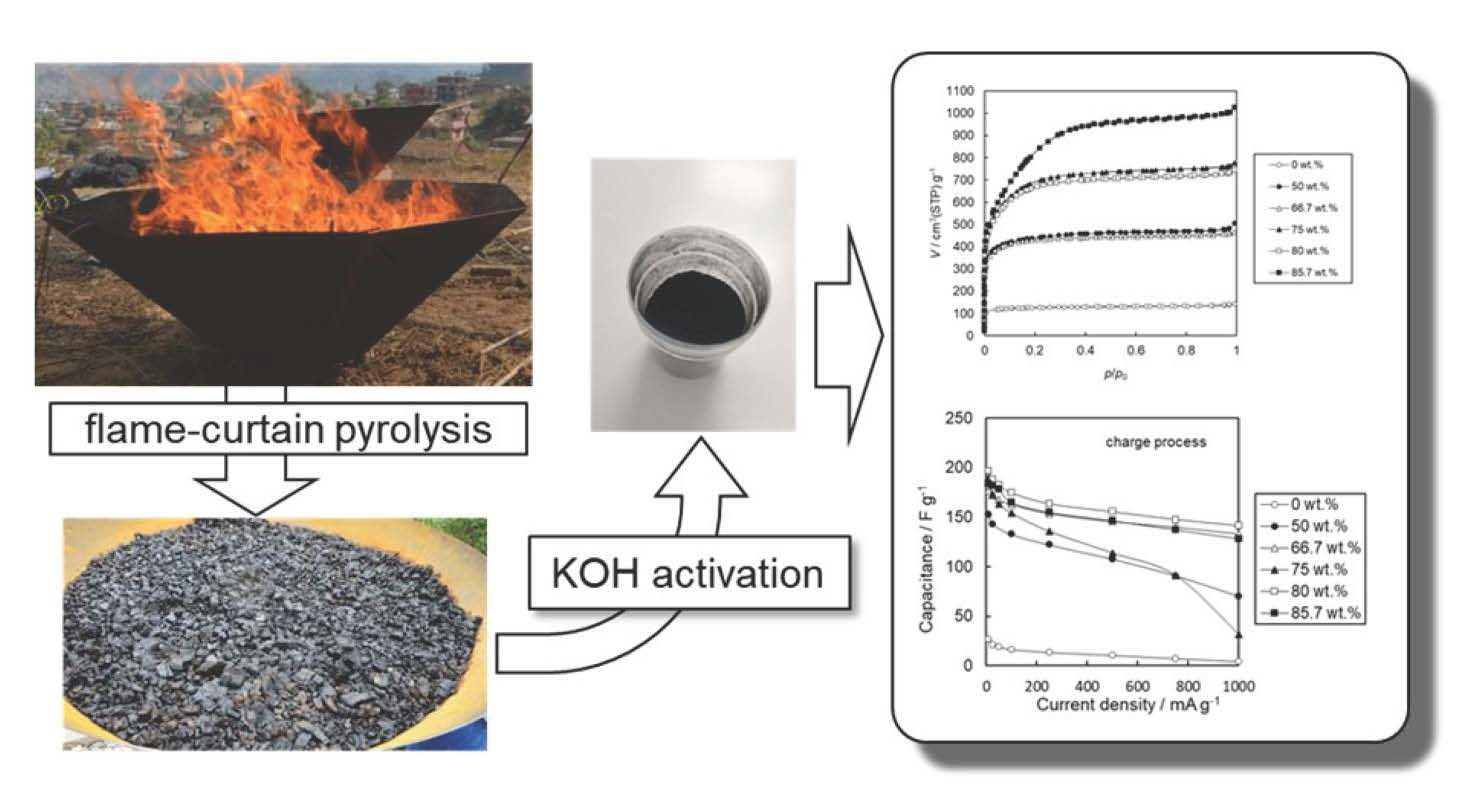
Assessment of Biochar Produced by Flame-Curtain Pyrolysis as a Precursor for the Development of an Efficient Electric Double-Layer Capacitor

1
Department of Applied Chemistry, Faculty of Engineering, Kyushu Institute of Technology, 1-1 Sensuicho, Tobata-ku, Kitakyushu 804-8550, Japan
2
Department of Electronic Engineering, School of Engineering, Hellenic Mediterranean University, Chania, 73100 Crete, Greece
*
Authors to whom correspondence should be addressed.
Energies 2021, 14(22), 7671; https://doi.org/10.3390/en14227671
Submission received: 24 September 2021 / Revised: 28 October 2021 / Accepted: 12 November 2021 / Published: 16 November 2021
(This article belongs to the Special Issue Advances in Carbon Nanomaterials for Energy Storage)

Abstract

:
Pine tree biochar produced by flame-curtain pyrolysis, an inexpensive and simple pyrolysis methodology, was used as the starting material for KOH-activated carbon. Flame-curtain pyrolysis is a simple, low-technology methodology that can be performed by non-specialized personnel. The elemental analysis of the biochars highlighted the high reproducibility of the process. The N2 adsorption isotherms indicated that KOH activation was effective for the preparation of high-surface-area activated carbons from the biochar. The BET specific surface area increased with the quantity of KOH added in the activation process, achieving a maximum value of 3014 m2 g−1 at 85.7 wt.% of KOH addition. The adsorption isotherms of all samples were IUPAC type I, establishing their microporous nature. Results from the Mikhail–Brunauer (MP) method and αs plot indicated that the pore size distribution became wider and the pore volume increased as the KOH content increased. The measured capacitance values followed the same dependence on KOH content. The maximum capacitance value at 1 mV s−1 was determined as 200.6 F g−1 for the sample prepared at 75 wt.% of KOH addition. Therefore, pine tree biochar prepared by simple pyrolysis equipment is a suitable precursor for the development of an electric double-layer capacitor.

Graphical Abstract

1. Introduction

Biochar is a carbonaceous material prepared from biomass such as agricultural waste and by-products from the processing of crops. The physicochemical properties of biochar depend on the type of biomass and pyrolysis conditions. The abundance of suitable biomasses and the development of cost-effective pyrolysis processes have led to the widespread use of biochar in various applications. During the last 15 years, the majority of biochar production has been directed towards application in nutrient-depleted soils in order to improve their physical, chemical and biological properties and increase crop productivity [1,2]. Lately, the use of biochar in more advanced applications is under investigation. Due to the structural similarity with activated carbons and tunable surface chemistry, various biochars have shown very promising behavior as adsorbents for wastewater treatment and as substrates for the development of nanocatalysts to be used in advanced oxidation processes [3,4,5]. Additionally, the preparation of activated carbon requires advanced equipment, increased technical skills and is often costly. If biochar, prepared by simple, inexpensive pyrolysis equipment and from a sustainable source of biomass, can be used as a precursor of high-performance functional materials, then it may offer an efficient and cost-effective alternative to activated carbon. Therefore, from now on the interest in biochar is expected to increase rapidly for applications related to materials science and engineering.
One recently developed alternative to conventional pyrolysis equipment is the flame-curtain pyrolysis kiln, originally proposed by Cornelissen et al. (2016) [6]. Biochar produced this way has been mainly applied in field-scale agricultural projects, establishing its potential for the inexpensive production of high-quality biochar that meets the standards of the European Biochar Certificate (EBC) [7]. This pyrolysis method has been proved to be highly reproducible, provided the feedstock material is dry and has a uniform size distribution [8]. An additional advantage of this approach is the low construction and maintenance cost of the kiln, which allows for extended use at farmer level in developing countries [9]. A typical, 1 m3-capacity flame-curtain kiln can be constructed for as little as EUR 1000, whereas the cost of an electronically controlled, rotary pyrolysis furnace of similar capacity per day may exceed EUR 50,000. Furthermore, the flame-curtain kiln is mobile, which practically means that it can be transferred to where the biomass is, thus saving the cost of transporting large quantities of biomass to the pyrolysis unit.
An emerging industrial application that makes use of carbonaceous materials is an energy storage device called an electric double-layer capacitor (EDLC). The electrode material is one of the most important factors for the high performance of EDLC devices. The electrode used in an EDLC must be electrically conductive and have a large surface area and high stability in the electrolyte with applied voltage. Moreover, large-scale EDLC application requires inexpensive and environmentally friendly materials. Until now, attempts have been made to use a wide range of materials as electrode materials for EDLCs. Carbon-based materials such as graphene and activated carbon have achieved high capacitance values and shown overall promising behavior [10,11,12]. However, such materials may originate from non-renewable sources and their preparation is often lengthy and complex. Lately, the combination of metal oxide nanoparticles with carbon materials for the production of hybrid electrodes has received attention [13,14,15,16]. However, metal oxides such as Ru2O are expensive, thus limiting their industrial application [17].
The use of biomass for the production and application of activated carbons in wastewater treatment has been extensively studied [18]. It has been established that if the waste biomass is freely available and dry, the production of activated carbons appears as a feasible alternative to carbons from non-renewable sources. The application of biomass-derived carbons in EDLCs is an emerging approach in an effort to achieve high performance at a much lower cost. In this framework, Zhang et al. (2021) prepared nitrogen-doped porous biocarbon from grape marcs and activated it with KOH [19]. The resultant activated carbon had a surface area of 2221.4 m2 g−1 and showed excellent capacitance and cyclic stability as an EDLC electrode under acidic conditions. In a similar approach, KOH-activated carbon from pomelo peels resulted in a specific capacitance of 334.3 F g−1 when Na2SO4–NaI–KI was used as the electrolyte solution [20]. Biomasses that have been exploited for the production of carbon electrodes for EDLCs include keratin from human hair [21], peanuts [22] and others [23]. However, although these biomasses were inexpensive, they were converted to biochar using small-scale laboratory equipment, the scalability and financial feasibility of which are questionable.
In our earlier work, pine tree residues were converted to biochar by flame-curtain pyrolysis and then activated with KOH [8]. Our preliminary results indicated their potential to be used as electrodes in EDLCs. The rationale behind this work was to demonstrate sustainability aspects of flame-curtain pyrolysis, such as the low cost of construction and operation, the larger (pilot) scale of biochar production and the reproducibility of the method. The assessment of greenhouse gas emissions during biochar production was beyond the scope of this study and will be monitored in future tests. Furthermore, we investigated the applicability of flame-curtain pyrolysis for the production of biochar as a suitable precursor for high-surface-area activated carbon. Subsequently, the effect of KOH activation on the properties of pine tree biochar was studied and the performance of the activated biochar as an electric double-layer capacitor was evaluated in detail.

2. Materials and Methods

Dry prunings of the stone pine (Pinus pinea L.) were obtained free of charge from the local municipal waste management company of Chania, Greece and used as the raw material for biochar production. A purpose-made flame-curtain pyrolysis kiln was constructed and used for the preparation of biochar. The kiln had a biomass capacity of 0.5 m3, was made of 1.5 mm steel sheets and cost EUR 500. For biochar activation, KOH (>85%, pellets) was obtained from Wako Pure Chemical Industries, Ltd. (Japan) and H2SO4 (98%) from Sigma-Aldrich.
The prunings were randomly separated into 3 batches and flame-curtain pyrolysis was carried out in triplicate. Each batch was pyrolyzed for 1 h at 600 °C, as measured by thermocouples attached to the kiln. No external source of heating was required and the process was self-sustained after the first prunings started to pyrolyze. After quenching with water, the biochar was air-dried for 96 h. The dried biochar was crushed and the 125–250 μm fraction was sieved and stored for further analyses. For the activation procedure, biochar (0.6 g) was mixed with solid KOH. The weight percentage of KOH in the mixture was 0, 50, 66.7, 75, 80 and 85.7. The mixture was placed in a tubular furnace and heated to 800 °C for 1 h under a N2 flow. After cooling, the activated biochar was washed with hot distilled water several times to remove KOH and other water-soluble compounds, followed by drying at 105 °C for 12 h.
The microstructure of both samples was observed by scanning electron microscope (SEM, JEM5310, JEOL). The measurement of C, H, N was performed on a Yanaco CHN Corder MT-5 instrument (Yanaco Apparatus Development Laboratory Co., Ltd. (Japan)). Moreover, X-ray fluorescence (S8 TIGER, Bruker) and X-ray photoelectron spectroscopy (AXIS-NOVA, Shimadzu/KRATOS (Japan)) were performed in order to gain further insight into the elemental composition of biochar. The N2 adsorption isotherms of the samples were measured at 77 K in a commercial apparatus (BELSORP mini II, MicrotracBEL Corporation instrument (Japan)). The data of N2 adsorption isotherms were used for the characterization of the textural properties of the samples. The Brunauer–Emmett–Teller (BET) method was used for the estimation of the specific surface area, and the data were analyzed according to ISO 9277, in case the adsorption isotherm was type I of the IUPAC classification.
The total pore volume was determined from the adsorbed volume at 0.990 relative pressure. The micropore volume was calculated by the t-plot method [24]. Moreover, the total surface area and the external surface area were also estimated by the t-plot method. The Mikhail–Brunauer (MP) analytical method was applied for the pore size distribution at the micropore region [25]. The αs plot was applied for the analysis of the separation of micropores [26]. The CO2 adsorption isotherms were performed at 298 K by using the commercial apparatus in order to compare the sample after KOH activation to the sample before KOH activation.
A three-electrode cell was used for the electrochemical measurements. The activated biochar powder was mixed with polytetrafluoroethylene (PTFE), which is a binder, and acetylene black (AB), which is a conductive aid, at a mixing ratio of 8:1:1 (w/w/w). The mixtures were rolled to 0.5 mm thickness, and then the sheet was cut into a rectangle (20 mm × 8 mm). The sheet sample was set on a Pt plate for collecting the electrode. Another Pt plate was used as a counter electrode. An Ag/AgCl electrode was applied as a reference electrode. A H2SO4 (1 M) aqueous solution was utilized as the electrolyte. Cyclic voltammetry (CV) was carried out in the range of −0.2–0.7 V vs. Ag/AgCl. Galvanostatic charge–discharge measurements were performed for the evaluation of the capacitance values. The capacitance values were calculated from the electric charge for the charge or the discharge process.

3. Results

3.1. Biochar Production
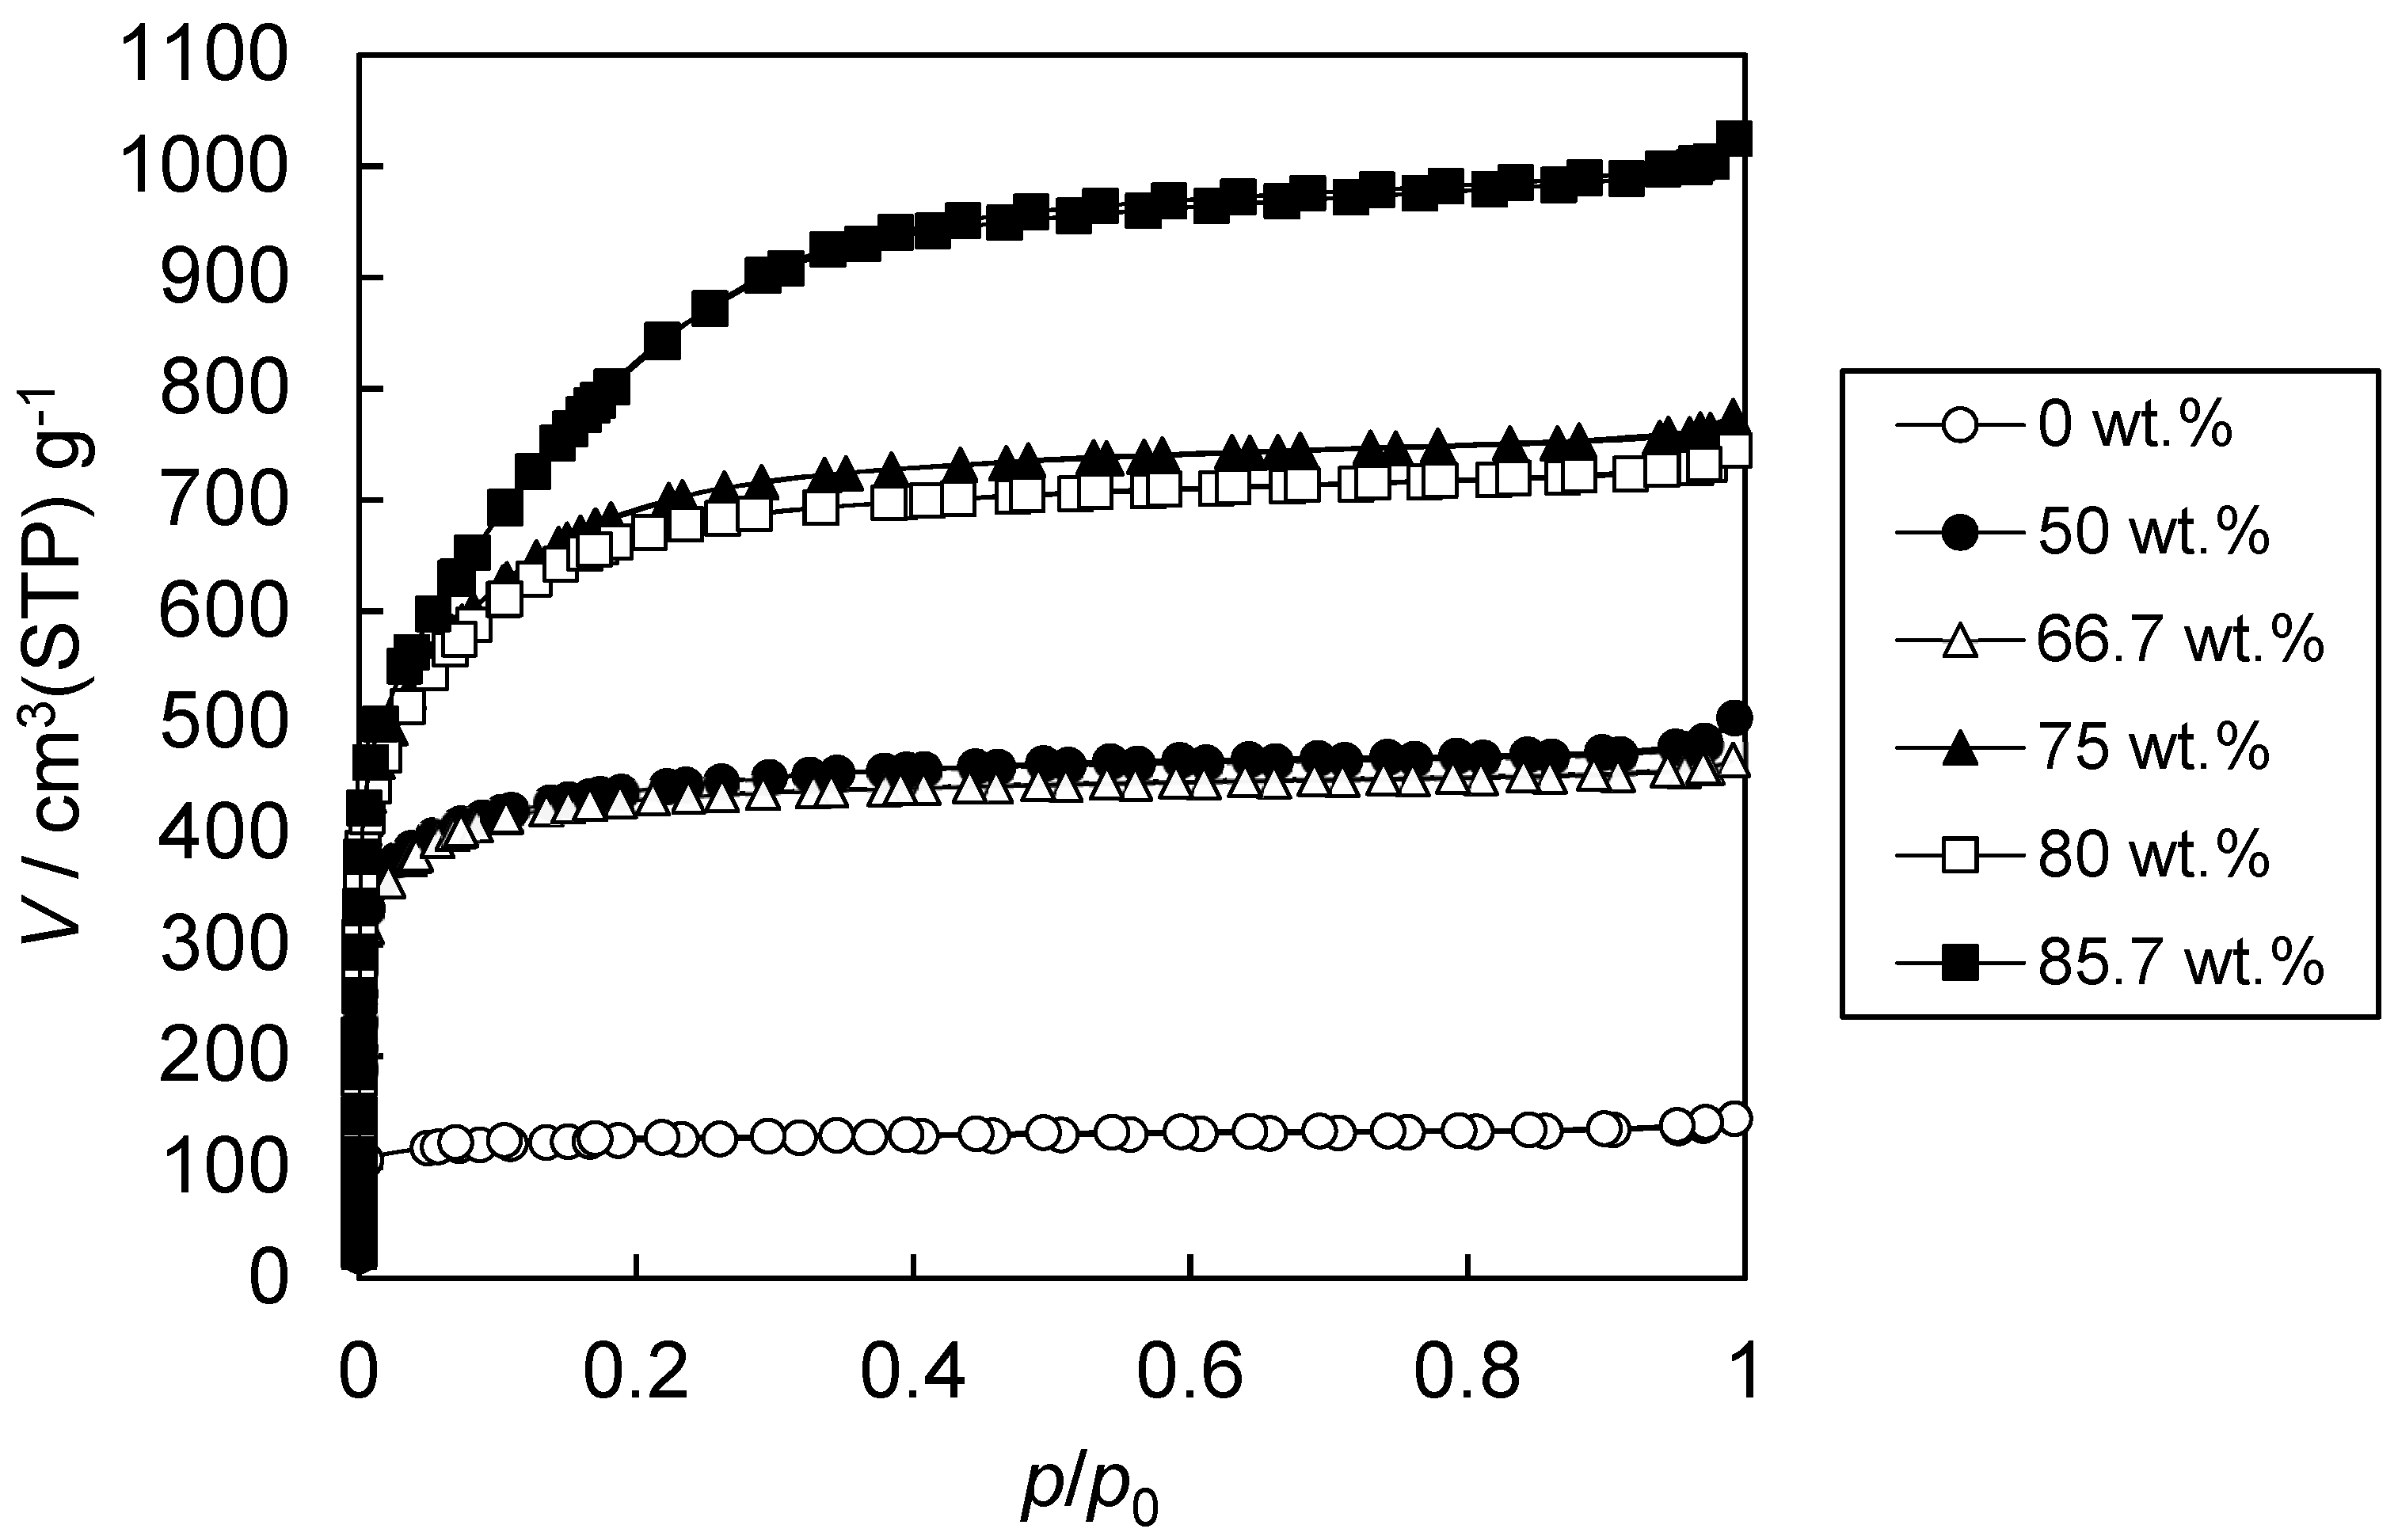
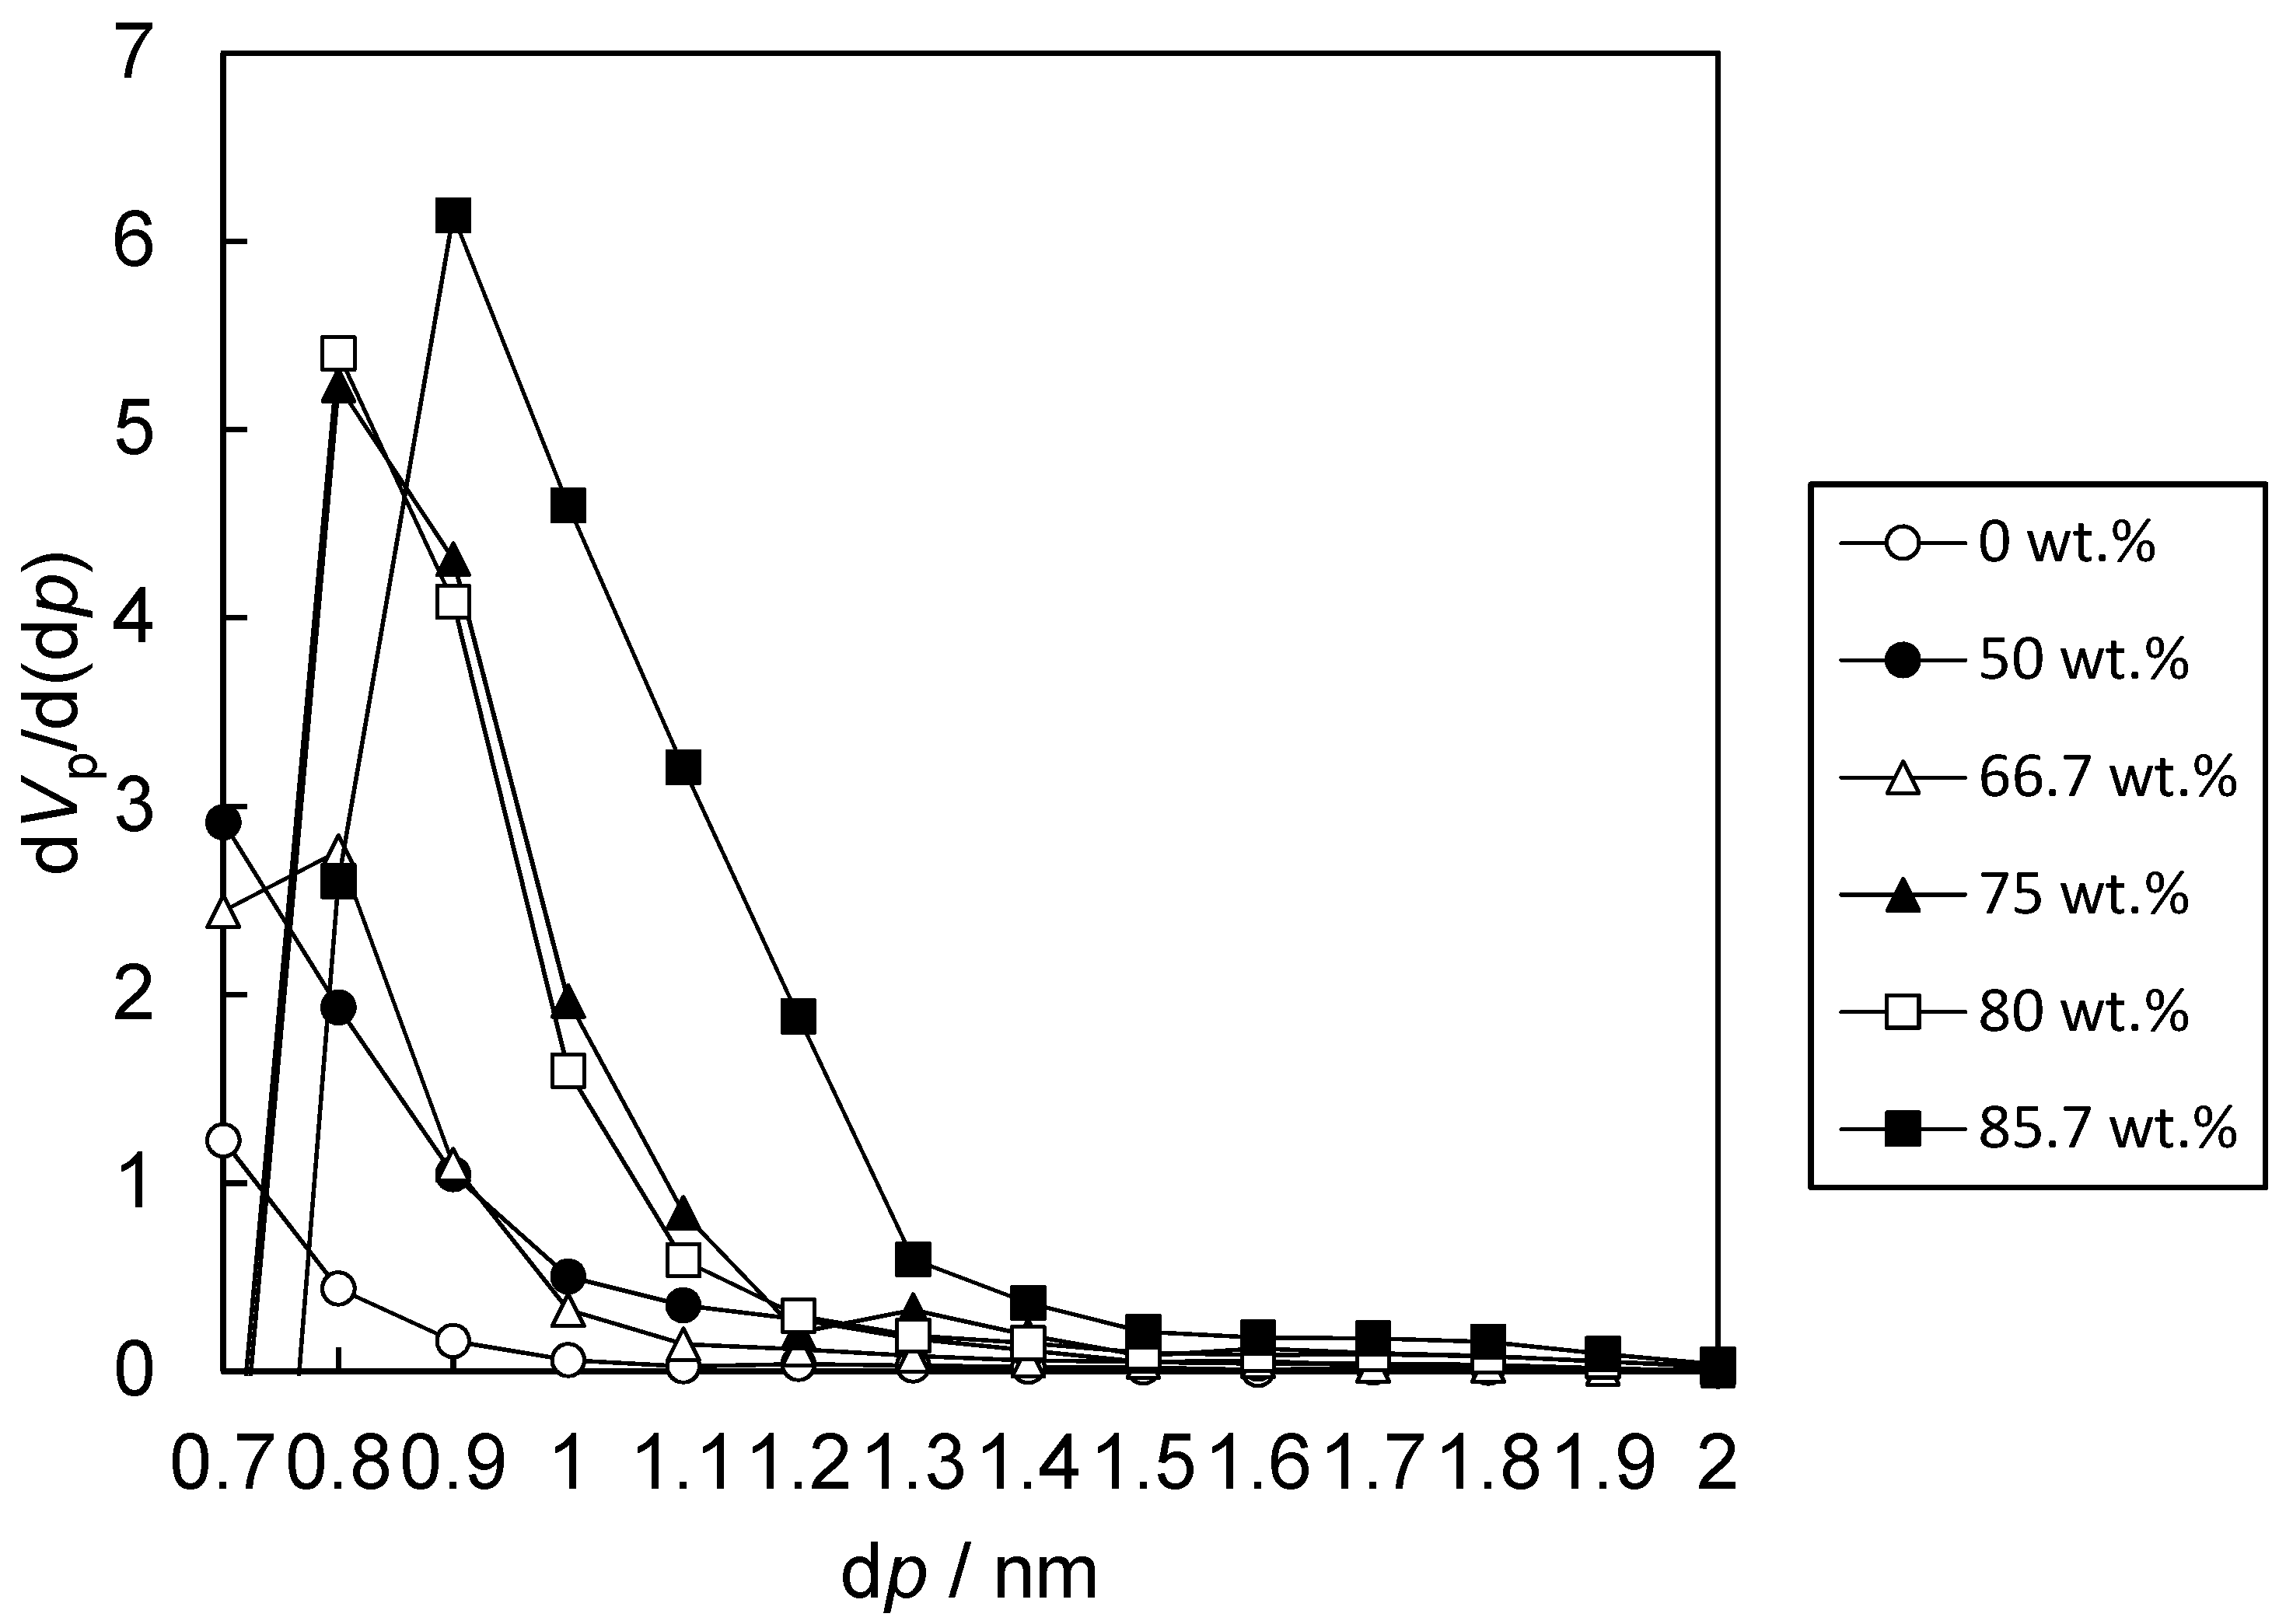
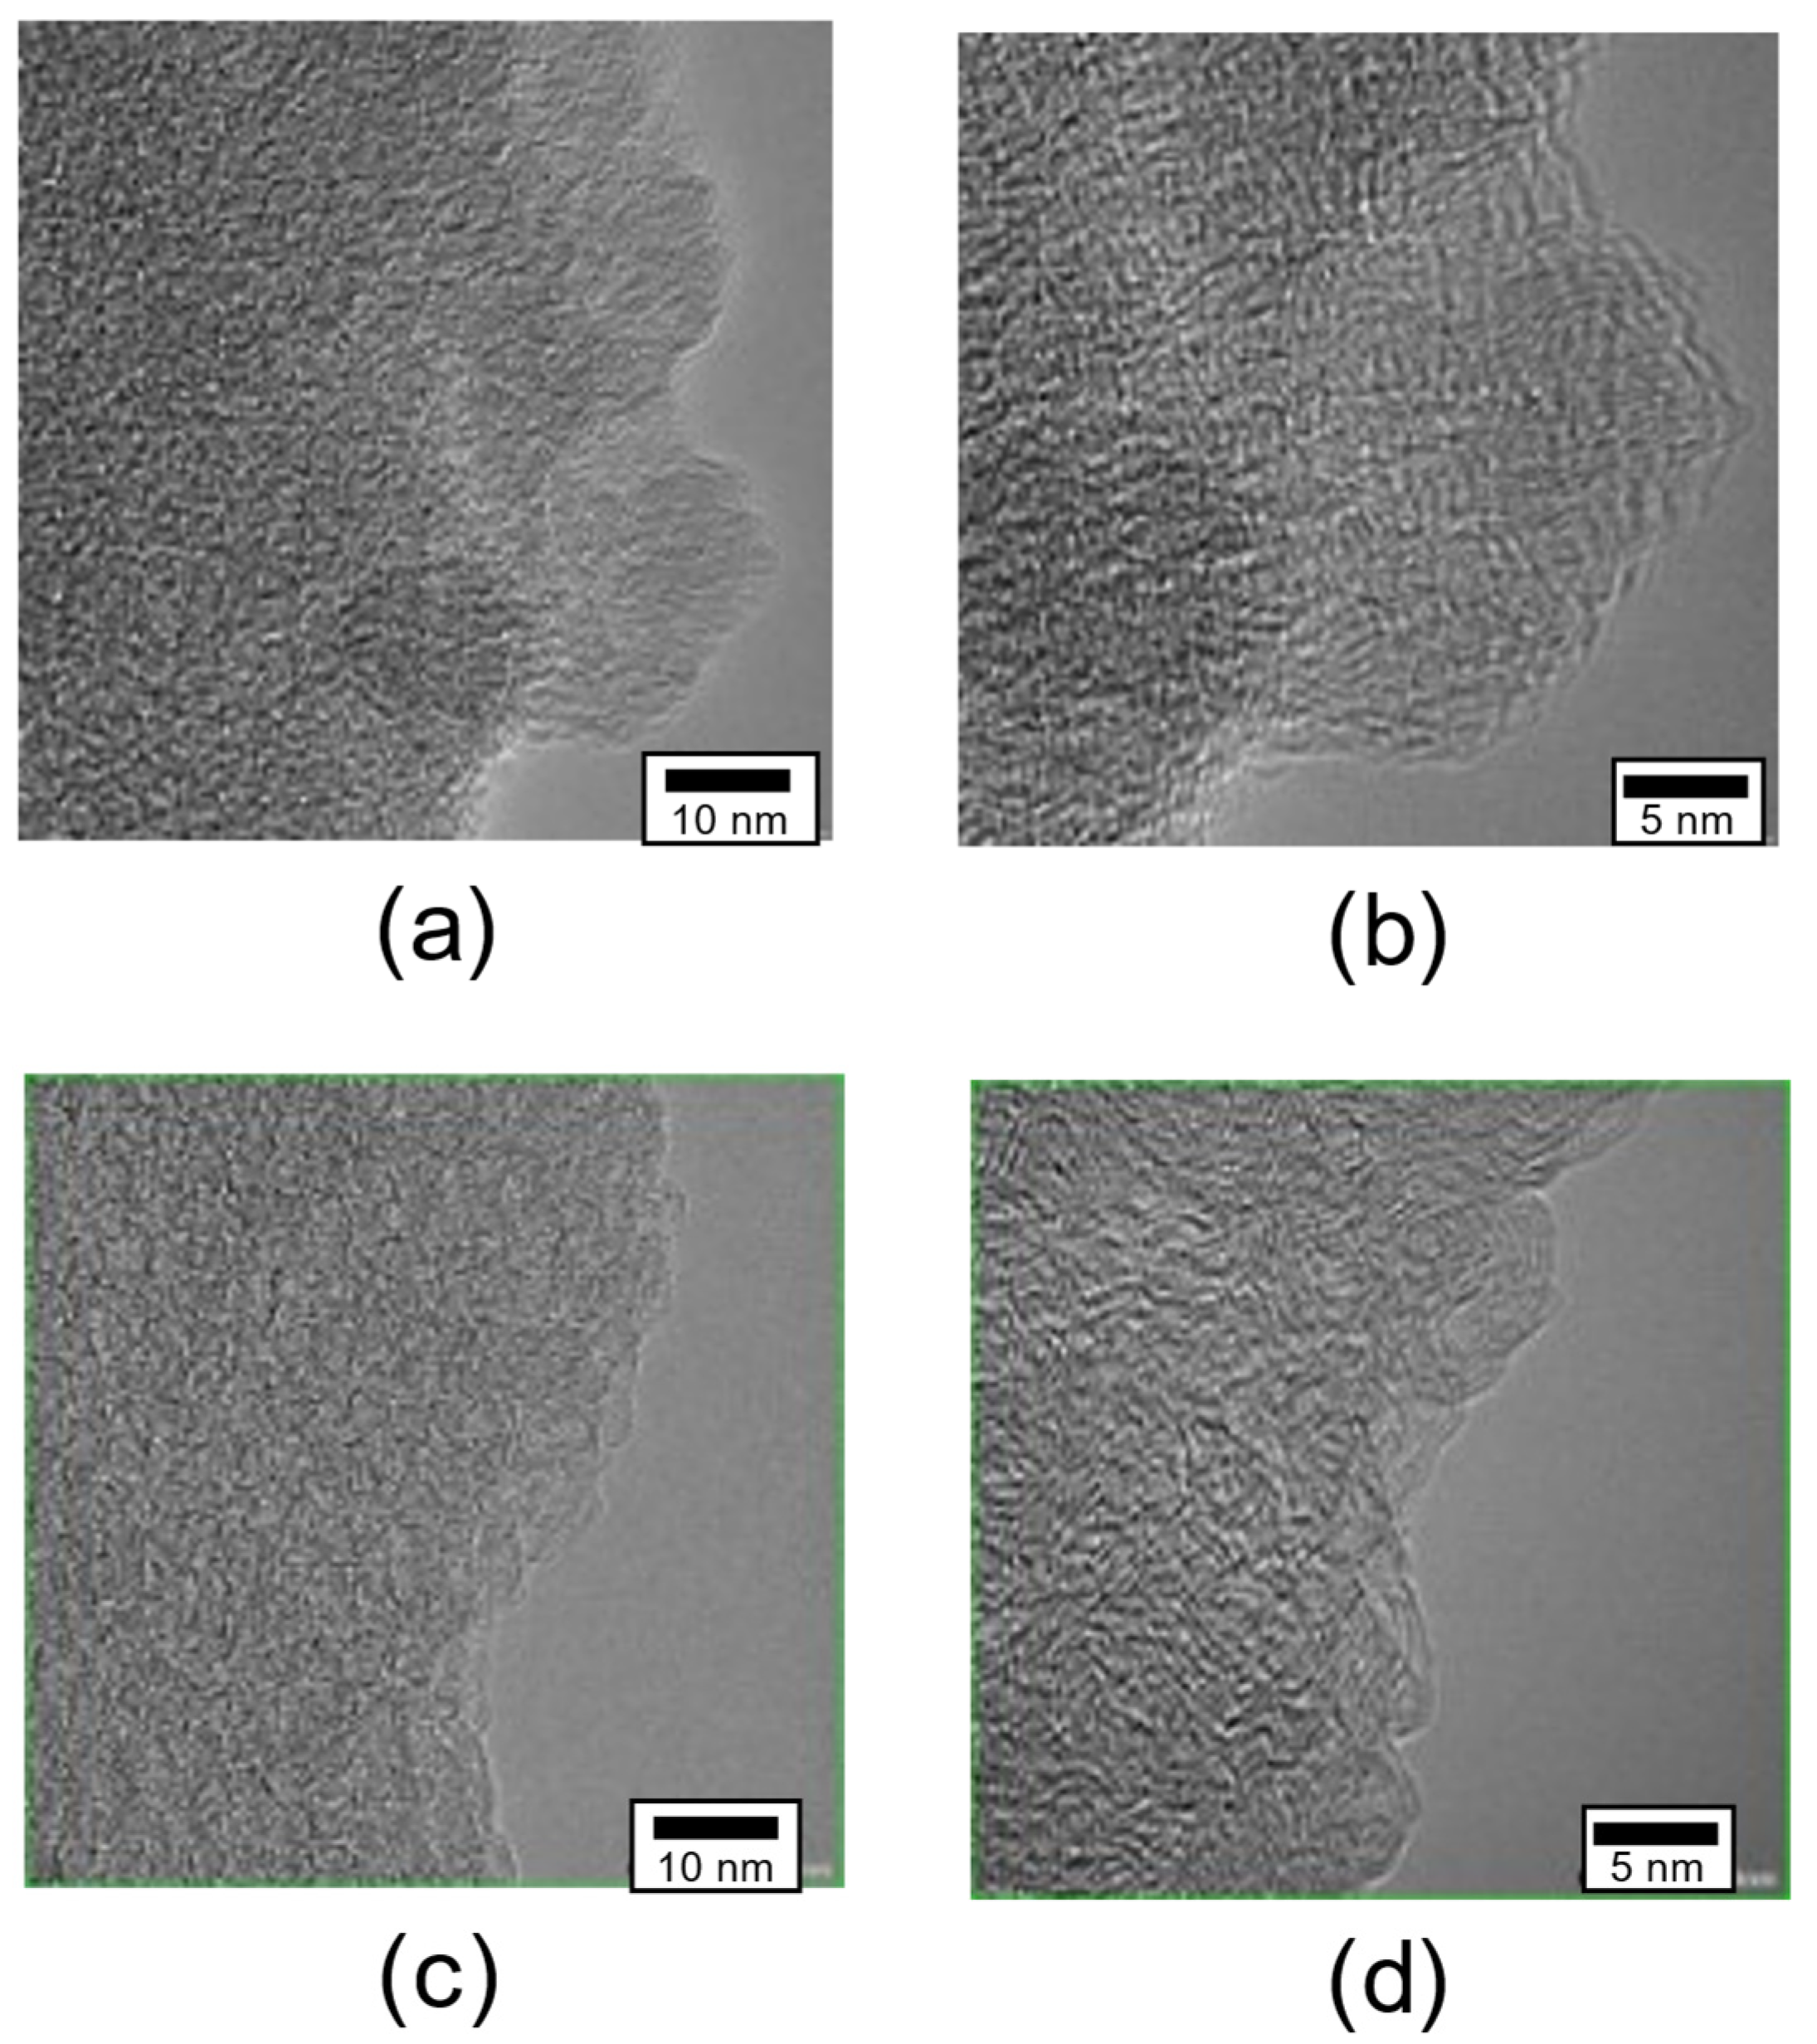
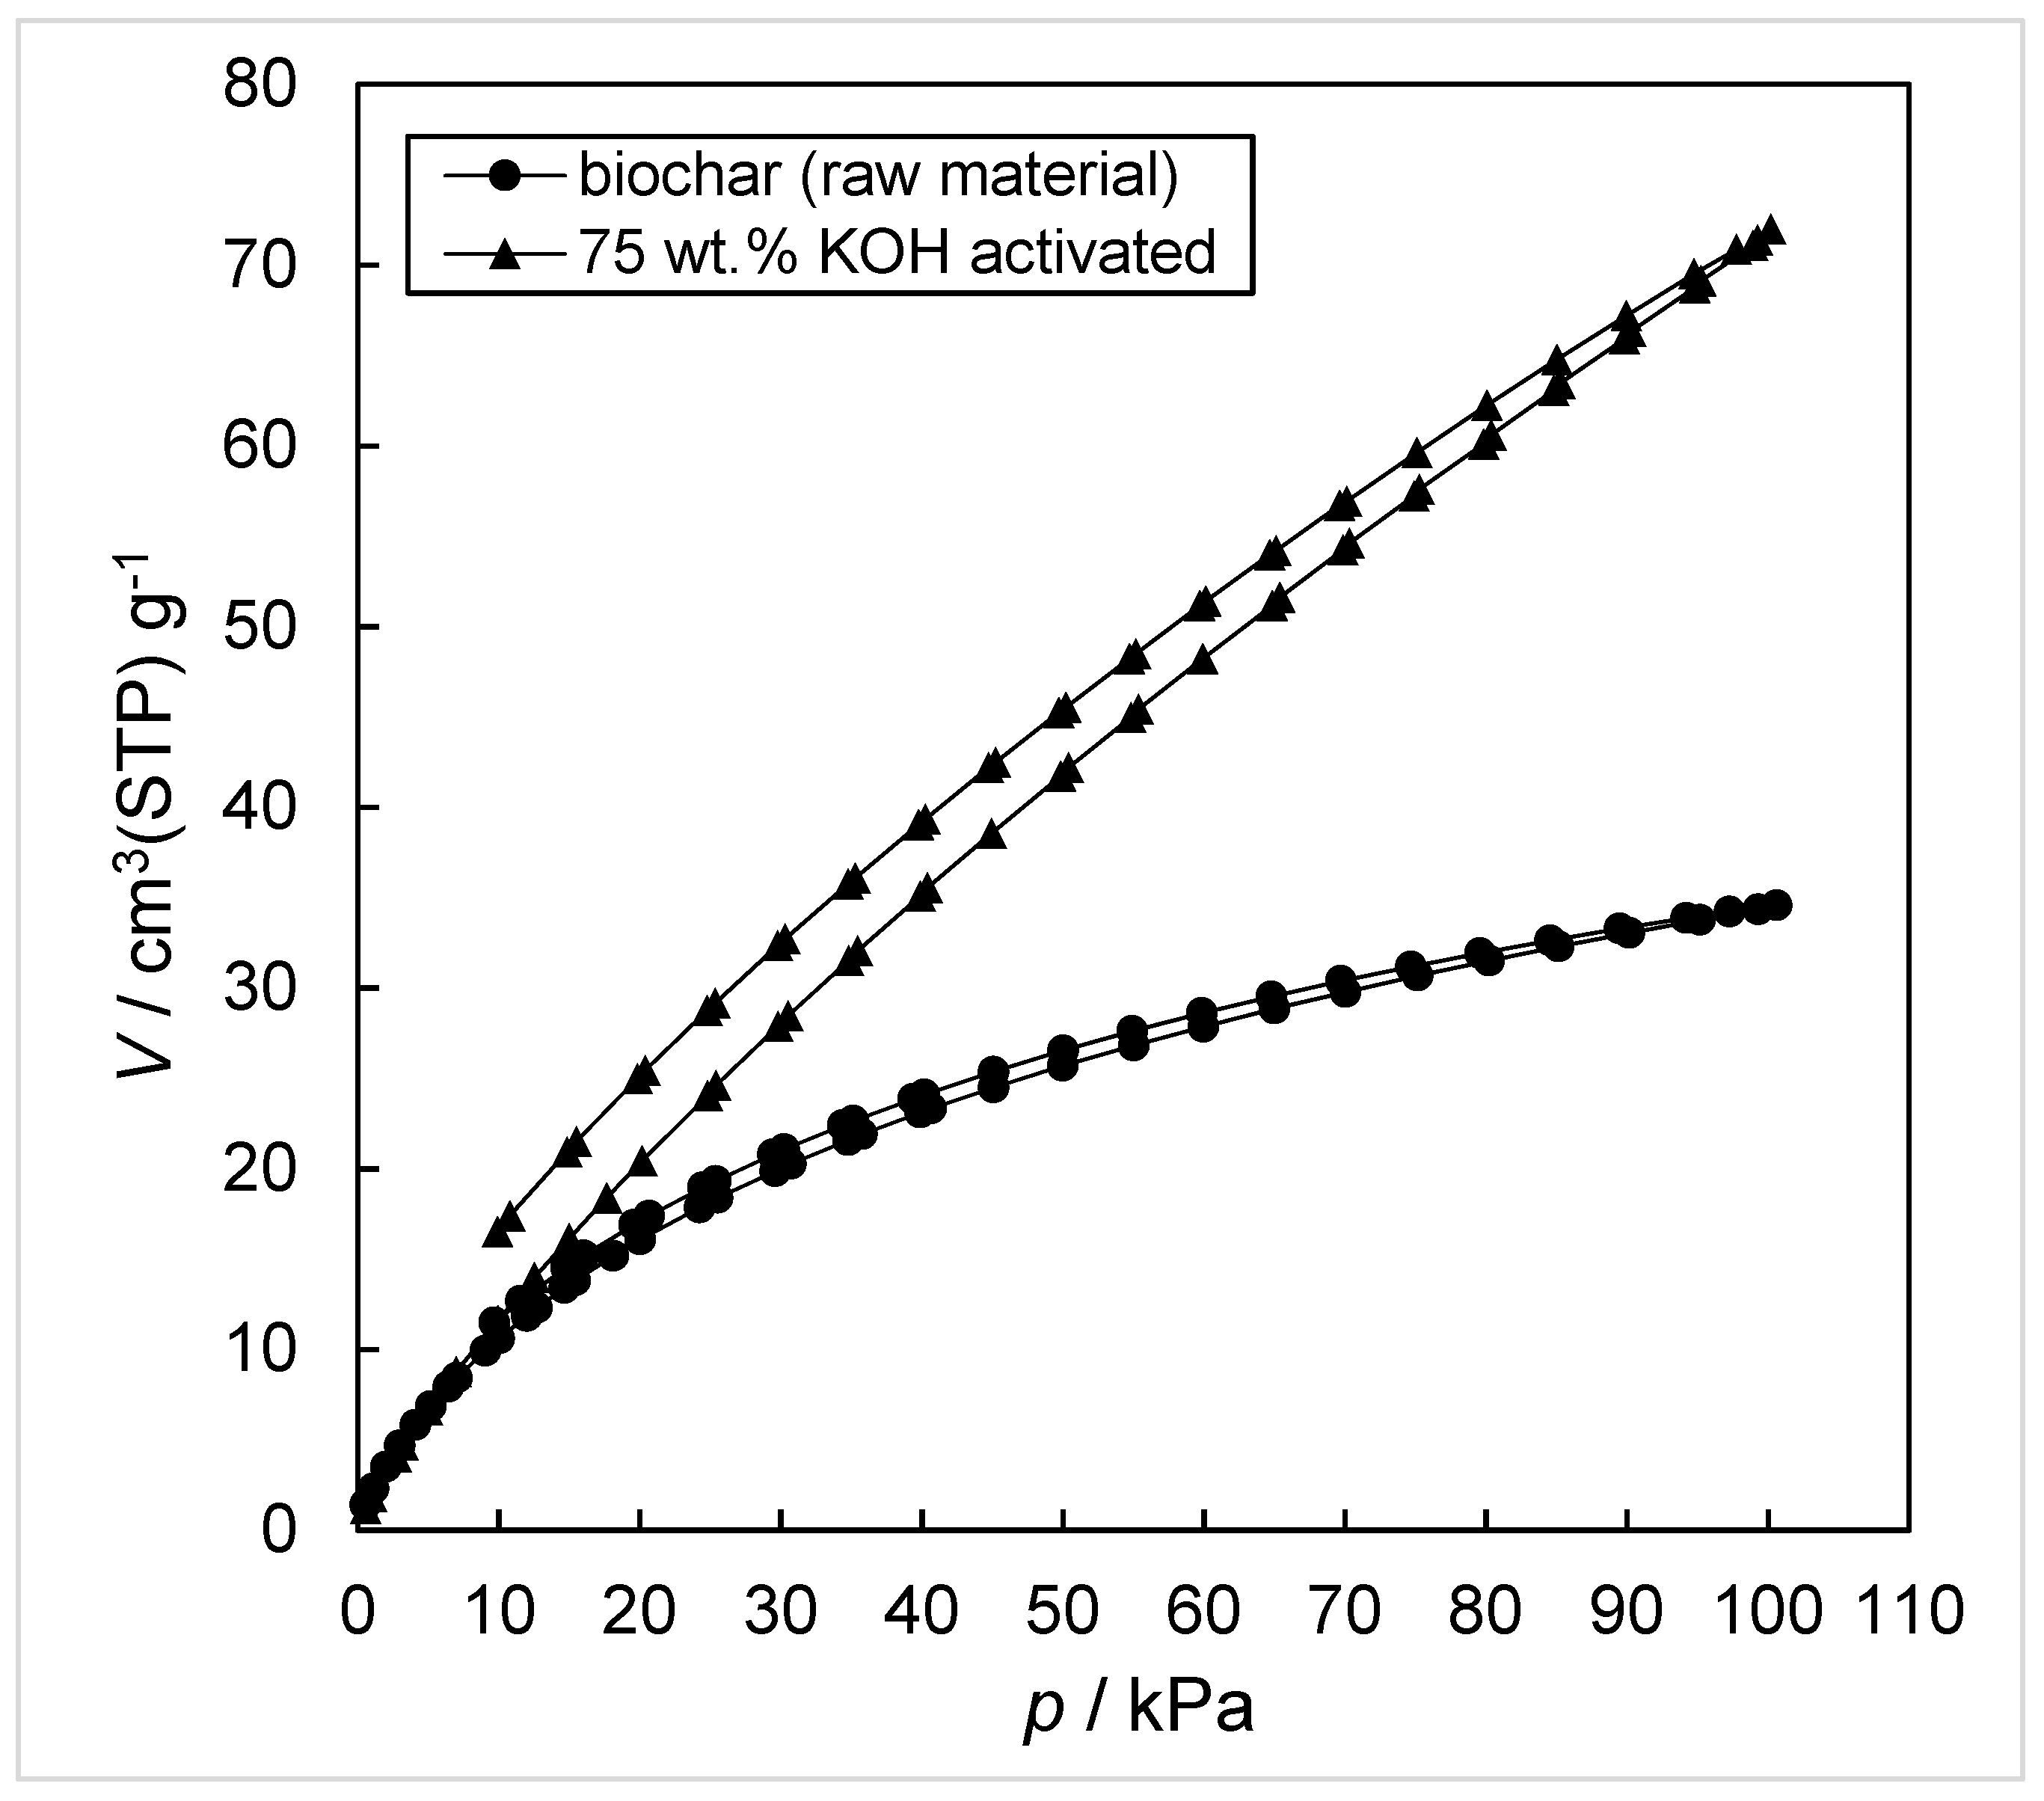
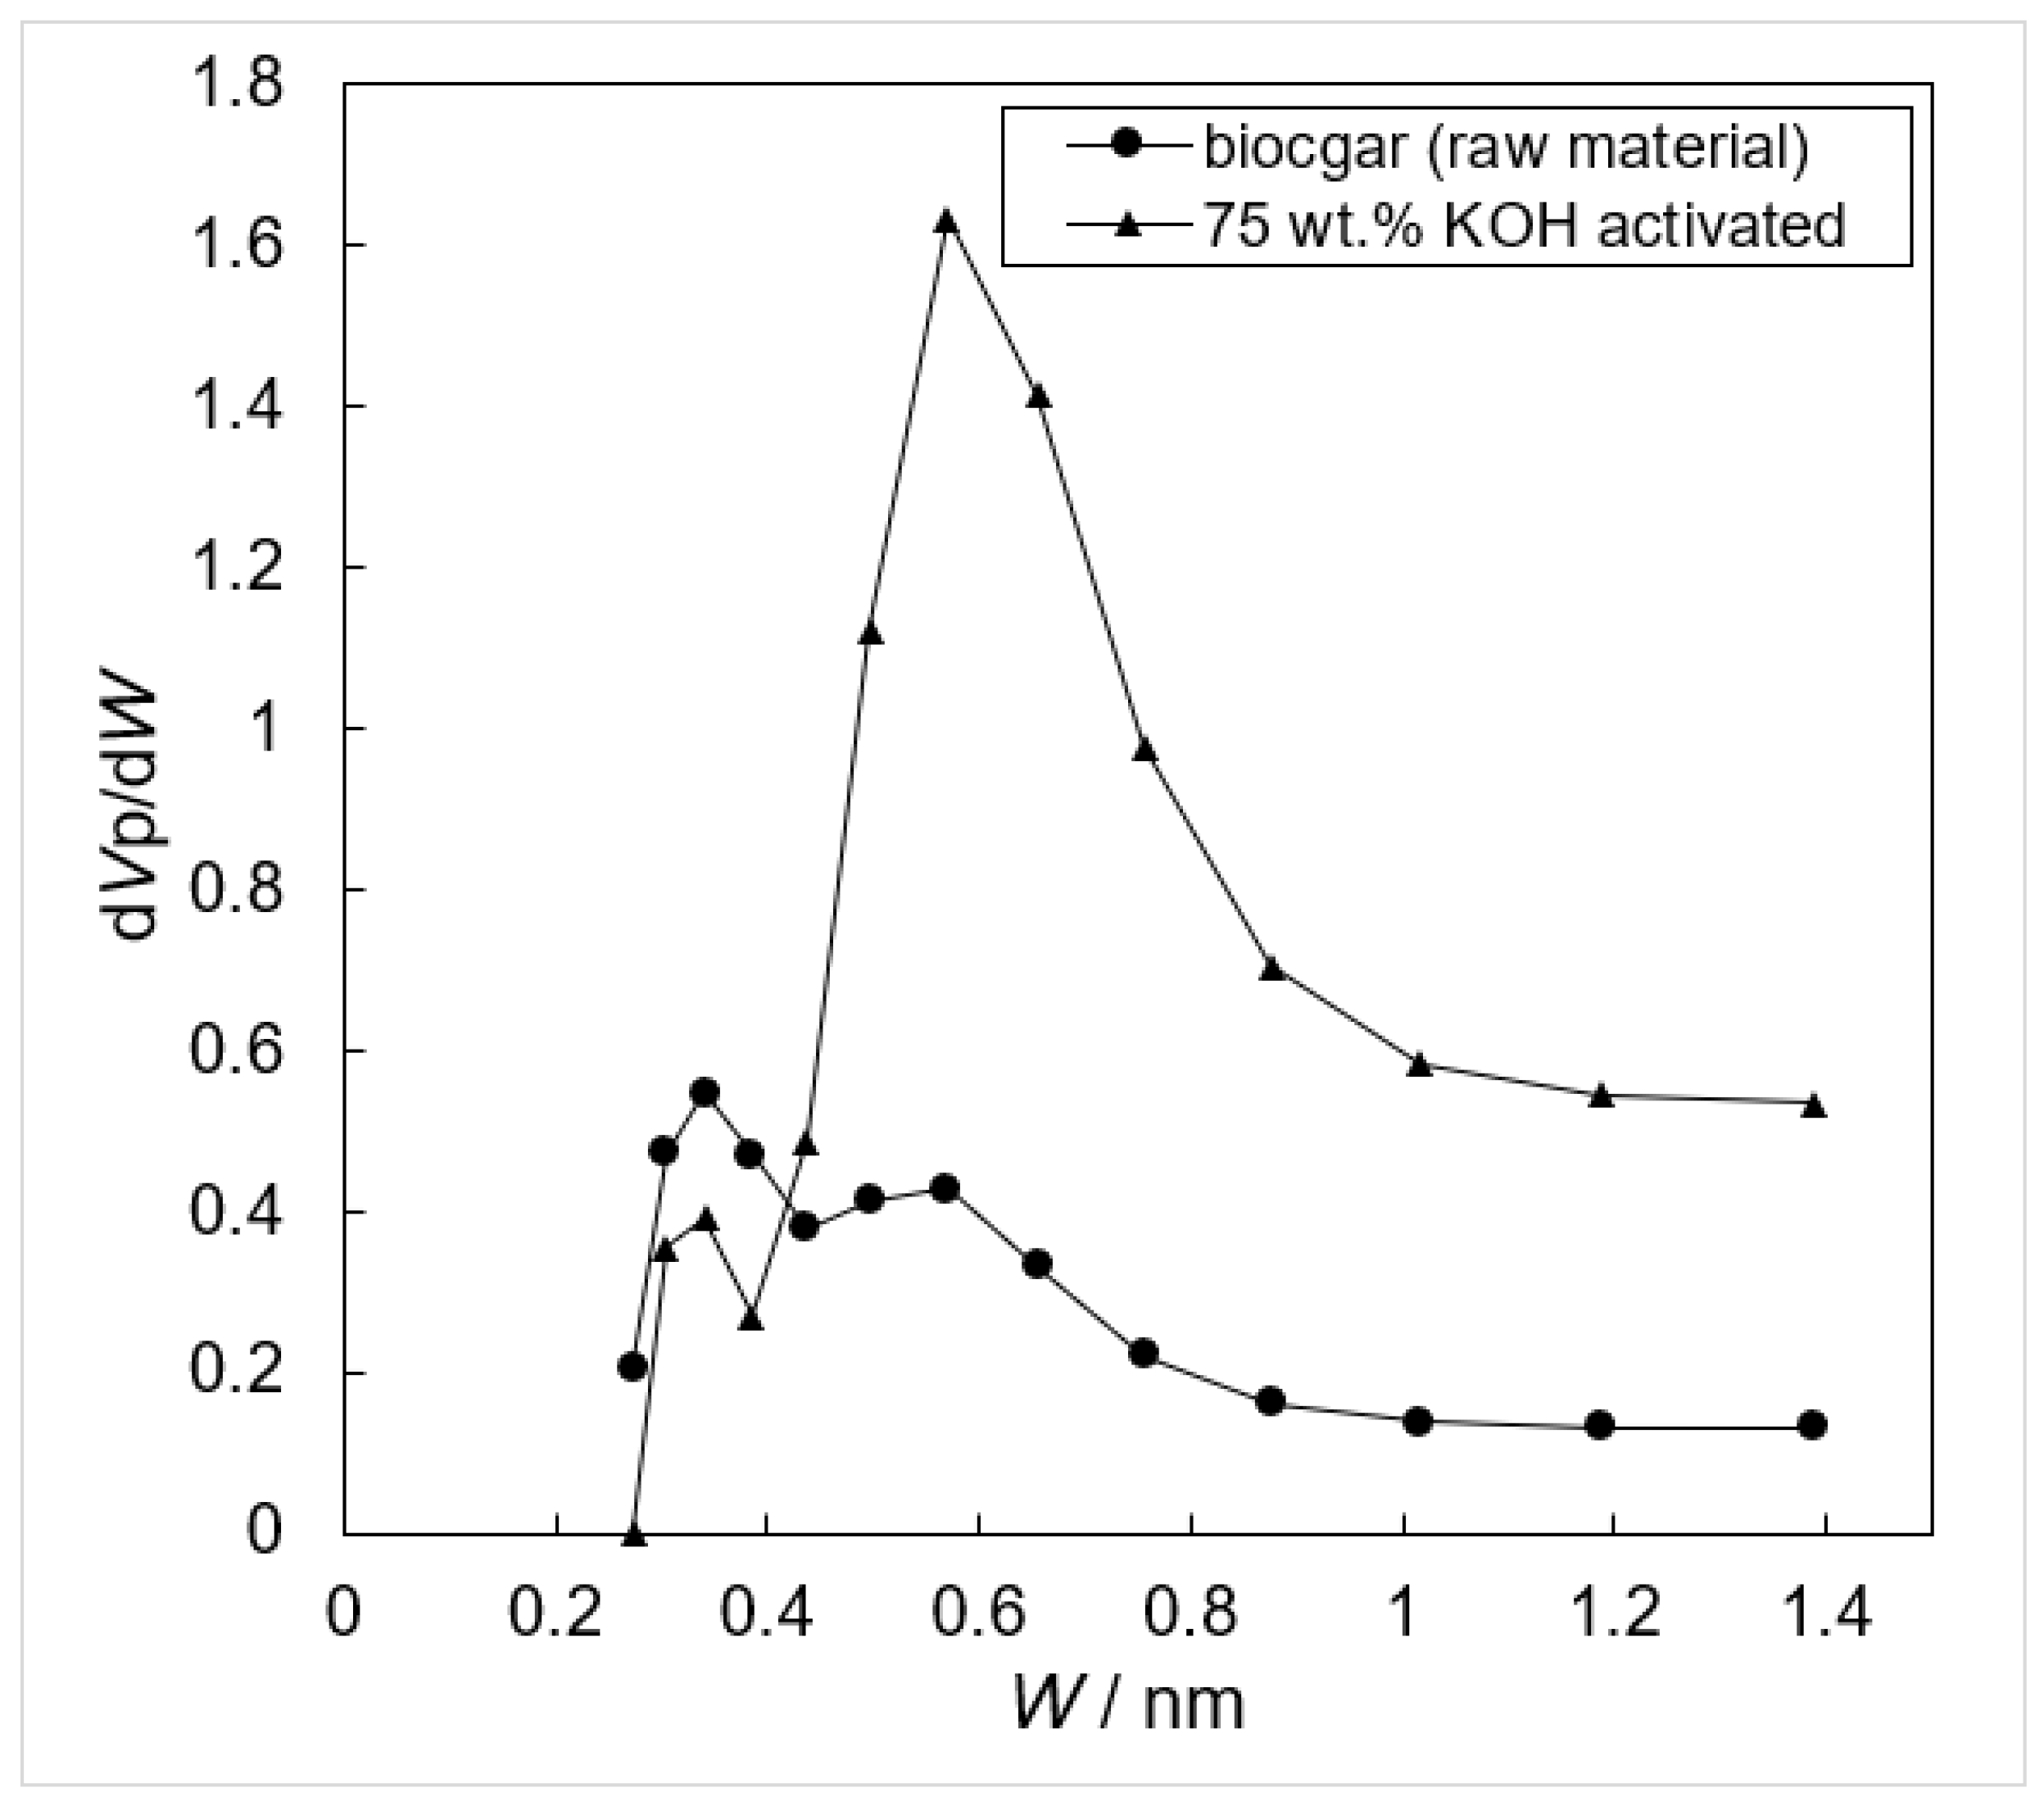
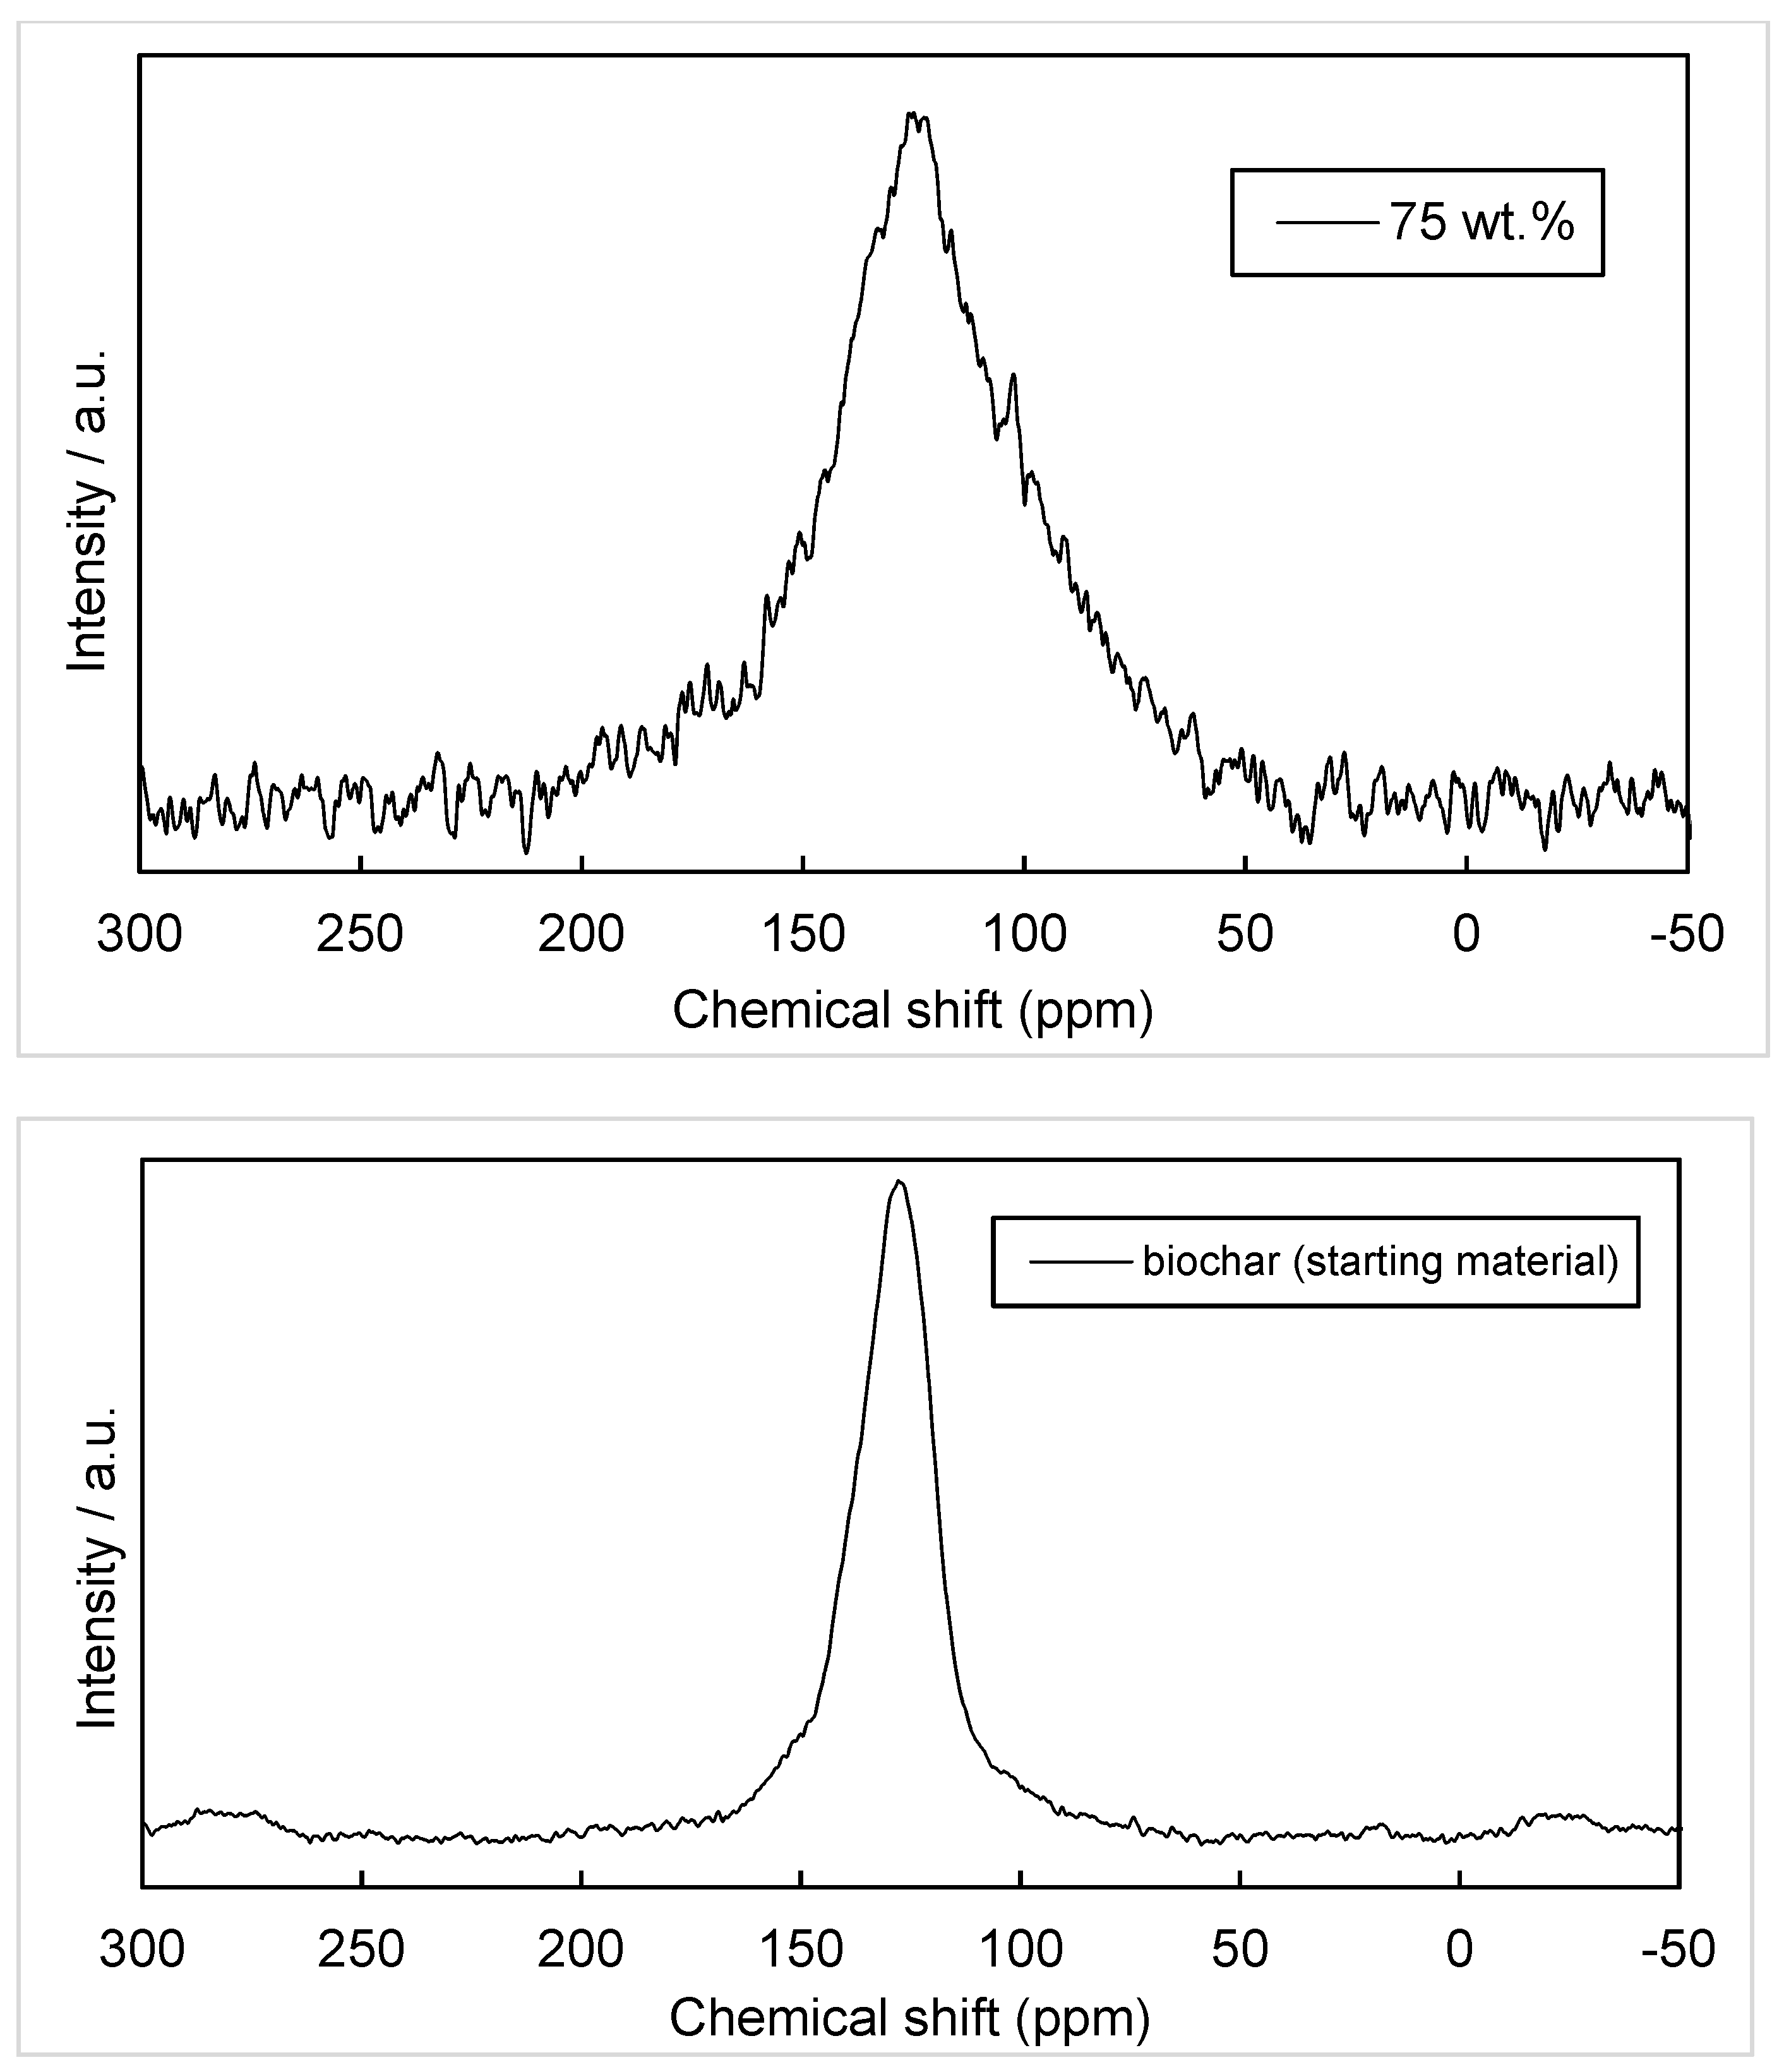
Flame-curtain pyrolysis produced biochar at a yield (100*biochar kg/dry biomass kg) of 22%, within the typical range of pyrolysis yields of other biomasses of lignocellulosic nature. The pH and conductivity values of 8.28 and 250 μS cm−1, respectively, were also similar to the respective values of other biochars that have been produced from woody feedstocks. The results of the elemental, XPS and XRF analyses of the pine tree biochar are reported in Table 1, Table 2 and Table 3, respectively. All values agree well with respective values of other biochars from pine tree residues produced through a wide range of pyrolysis methodologies [27,28,29]. The C, H and O contents and the H/C and O/C ratios demonstrate the capacity of the method to produce highly carbonized biochar of increased structural stability, according to the European Biochar Certificate standards (C content > 50%, H/C ratio < 0.7, O/C ratio < 0.4) and the published literature [30,31]. With respect to the limitations of these analyses, elemental analysis can only detect C, H, N and S, whereas XPS can detect elements heavier than Li (H is not detected). These measurements were performed several times, showing high reproducibility and thus establishing the stability of the flame-curtain pyrolysis process.

3.2. KOH Activation

The SEM images of the activated samples are shown in Figure S1. It appears that as the KOH wt.% increased, the particle size decreased. This tendency is consistent with the earlier results of KOH-activated biochars [32]. The yield, 100*(weight after KOH activation)/(weight before KOH activation), as a function of KOH content is shown in Figure S2. Activation without the addition of KOH (that is, only heat treatment at 800 °C) resulted in a yield of 76%. The addition of KOH reduced the yields. This is an indication that the chemical reactions that generated gaseous or water-soluble compounds were promoted with the addition of KOH. The chemical reactions are discussed later in this section.
Table 4 presents the elemental and ash content in the KOH-activated samples. The C content remained practically unaffected by the addition of KOH. The same was observed for H and N. With respect to the ash content, all samples had ash contents in the range of 5–8 wt.%, and no trend was established between the samples with different KOH wt.%. Most of the “others” can be considered to be oxygen. The percentages of all these elements did not depend on the amount of the KOH used for activation. The reason for not observing a trend in the C, H, N and ash contents of the activated samples could be derived from the KOH activation process, since the flame-curtain pyrolysis process was shown earlier to be highly reproducible. The XRF analysis indicated that most of the residue in the raw biochar can be presumed to be oxides and carbonates of Ca and Na. Moreover, Mg and K also exist to a certain extent. Therefore, the same can be concluded for the KOH-activated samples.
Figure 1 presents the N2 adsorption isotherms of the activated biochars. The adsorbed volume of N2 was considerably increased by the KOH activation process, indicating the suitability of the pine tree biochar to be activated with KOH. For all activated biochars, the shape corresponded to Type I(a) of the IUPAC classification, which suggests that the majority of the pores were micropores with a narrow distribution of pore sizes [33]. Therefore, the KOH-activated samples are considered as microporous solids having a relatively small external surface area. Furthermore, the initial part of the isotherms corresponds to micropore filling (rather than surface coverage), and the low slope of the plateau highlights the multilayer adsorption on the external surface area [34]. As the KOH wt.% increased, the length of the slope increased, at relatively small relative pressure values. This means that the pore size distribution in the micropore range broadens with higher KOH content, an indication of higher microporosity, i.e., the 85.7 wt.% KOH-activated biochar possessed the highest microporosity. Since no hysteresis loop was observed at more than 0.4 of relative pressure, only a few mesopores existed in the samples. The shape of the isotherms is in good agreement with earlier published isotherms of KOH-activated samples [34,35,36]. The BET specific surface area, SBET, as the function of the added KOH is shown in Figure S3. The SBET value of the sample activated without the addition of KOH (0 wt.%) was 500 m2 g−1, which is considered low compared to other activated carbons applied as electrodes in EDLCs. The SBET value significantly increased as the KOH content increased during biochar activation. The SBET value of the sample corresponding to 85.7 wt.% KOH was 3014 m2 g−1.
As determined earlier, the N2 adsorption isotherms indicated the presence of micropores in the activated samples. In order to analyze the pore size distribution of micropores in detail, the MP method and αs plots were applied to the data of the N2 adsorption isotherms. The pore size distribution at the micropore region, as calculated by the MP method, is shown in Figure 2. The estimated peak of pore size distribution shifted to a larger size and the pore volume increased with increasing KOH content. The αs plots of the samples are shown in Figure S4. Although the data at the region of αs < 0.33 are unreliable because of the performance of the measurement apparatus, it was possible to draw conclusions from the αs plots. When the amount of the added KOH was small, the f-swing, which is the hump at the region at αs < 0.5, appeared in the plot. The f-swing corresponds to the filling of N2 molecules in very small pores (0.35–0.7 nm). As the KOH content increased, the f-swing decreased and the C-swing, which is the hump at the region at αs > 0.5, increased. The C-swing is attributed to the corporative adsorption of N2 molecules in small pores in the range of 0.7–2 nm. The results of the MP method and the αs plots suggest that the pore size at the micropore region increased with KOH, thus confirming the conclusion drawn earlier by the adsorption isotherms.
The (Vmicro/Vtotal) values, the micropore volumes (Vmicro), as estimated by the t-plot method, and the total pore volume (Vtotal), as estimated by the volume of adsorbed N2 at 0.99 relative pressure (p/p0), are shown in Figure S5. Some Vmicro/Vtotal percentages exceeded 90%, that is, the vast majority of the pores in all samples were micropores. The percentage of Vmicro/Vtotal increased from 91 to 94.5% when the amount of added KOH increased from 50 to 66.7 wt.%. Beyond that point, it gradually decreased to 92.4 at the highest KOH wt.%. Although the fluctuations are too small to draw safe conclusions, it may mean that the volume of mesopores and macropores also increased with KOH beyond the content of 66.7 wt.%. The relationship between the SBET value and Vmicro was estimated by the t-plot method and is shown in Figure S6. There is a clear linear agreement between the SBET and Vmicro values, as indicated by the regression coefficient value of 0.99. This result means that most of the surface area of the KOH-activated samples is derived from micropores.
From the proposed reaction mechanism of KOH activation for multiwalled carbon nanotubes [37], and the review of the methods for the preparation and activation of activated carbons [38], the proposed chemical reactions during KOH activation can be summarized as follows:
2 K O H   K 2 O + H 2 O
6 K O H + 2 C   2 K + 3 H 2 + 2 K 2 C O 3
K 2 C O 3 + 2 C   2 K + 3 C O
K 2 C O 3     K 2 O + 2 C O 2
K 2 C O 3 + C K 2 O + 2 C O
K 2 O + C O 2   K 2 C O 3
K 2 O + C   2 K + C O
Reactions (1)–(4) and (7) contribute to the generation of gaseous compounds, resulting in the formation of pores in the solid structure. Redox reactions (2), (5) and (7) consume carbon, resulting in the formation of pores and the corrosion of the wall of pores. Reactions (2), (3) and (7) generate free potassium, which penetrates the graphene layers, resulting in the structural expansion of the graphene structure of activated carbon. The reaction Gibbs energy, ΔGr, is calculated from the database of the Gibbs energy of formations, ΔGf [39]. The temperature dependence of the reaction Gibbs energies, ΔGr, is shown in Figure S7. The theory of thermodynamics indicates that the reaction spontaneously progresses when the ΔGr < 0. Reactions (1), (3)–(5) and (7) have ΔGr > 0 at 800 °C (1073 K); therefore, these reactions are not expected to progress during the activation process. Reactions (2) and (6) have ΔGr < 0 at 800 °C (1073 K). As for Reaction (6), this reaction is for the generation of K2CO3, that is, these reactants do not participate in biochar activation. If the carbon in our biochar sample is considered to be mostly in the form of graphite, then Reaction (2) describes the reaction between biochar and KOH, since this reaction can thermodynamically proceed at 800 °C. However, in our earlier work, it was spectroscopically determined that pine tree biochar is mostly amorphous carbon [8]. Dehkhoda et al. (2016) prepared KOH-activated biochars (produced originally from spruce whitewood at 600 °C) purposed to be applied as electrodes in EDLCs. They used FTIR to study the activation mechanism and suggested that the rate of conversion of KOH to K2CO3 (Reaction (2) above) played a more important role compared to the other known reactions [40]. Due to the absence of graphitic structure in our biochar, Reactions (3), (5) and (7) cannot fully account for biochar activation. More compounds—consisting of other elements in addition to C, H and O—may play a role in the reaction mechanism. In order to calculate the ΔGr of the chemical reaction of biochar, which contains C, H and O, at least, the ΔGf is necessary. However, to the best of our knowledge, a database with ΔGf values of biochar-related reactions does not exist. Therefore, to gain further insight into the reaction mechanism, further discussion must be performed.
One of the proposed KOH activation mechanisms is that of metallic K intercalation into the carbon lattices, when activation occurs at a temperature higher than the boiling point of K (760 °C) [41,42]. The carbon lattices are sp2 carbon network layers and the distance between these layers is 0.3354 nm. As the metallic K intercalates between these layers, the distance between them increases and the carbon lattice expands. It is worth noting that the pores (or slits), the diameter of which is less than 0.7 nm, cannot be detected by the t-plot method because the thickness of two layers for adsorbed N2 is approximately 0.7 nm (the molecular size of nitrogen is 0.354 nm). The enhancement of the distance between the sp2 carbon network layers is one of the reasons for the increment of the pore size.
The TEM images of the biochar before KOH activation and the sample activated with 75 wt.% of KOH are shown in Figure 3. All the images contain disordered patterns, highlighting the amorphous nature of the precursor. Any structural differences between the biochar before KOH activation and the sample after KOH activation were unclear in the TEM images.
The CO2 adsorption isotherms at 298 K of the raw biochar and the sample activated with 75 wt.% KOH are shown in Figure 4. The amount of adsorbed CO2 increased after the KOH activation. The micropore size distribution was evaluated from these experimental data by using the Grand Canonical Monte Carlo (GCMC) method, and this is shown in Figure 5. Because the probe molecule is CO2, the effective range calculated from the CO2 adsorption data until 1 atm is 0.32–1.4 nm. The results indicated that the micropores with an approximate width of 0.57 nm were increased by the KOH activation. This increment may be related to the intercalation of potassium between the carbon layers.
As seen earlier (Figure S2), as KOH wt.% increased, the activated biochar yields decreased. At a glance, this result is explained by the other proposed mechanisms that the gaseous H2O and CO2 further contributed to the generation of pores through carbon gasification (physical activation), whereas the water-soluble compounds chemically activated the biochar structure by carbon etching.38 However, biochar is not 100% carbon; therefore, other compounds potentially participate in side-reactions and affect the mechanism of activation. To gain a better understanding of the reaction mechanism, the thermal decomposition of the KOH–biochar mixture should be further examined.
In this study, the addition of KOH resulted not only in the increase in micropore volume but also in a shift of the pore size distribution. The solid 13C-NMR data of the biochar (starting material) and the activated sample (KOH 75 wt.%) are shown in Figure 6. In the case of the biochar, the peak at 128 ppm can be assigned to aromatic C-resonance and the peak at 150 ppm can be assigned to oxygen-substituted aromatic resonance (C–O, C–OH) from the carboxyl, ester or quinone moieties [43]. The very small peak at ~19 ppm might be assigned to the methyl resonance [44]. Although the main peak appeared at 128 ppm for both samples, the peak intensity for the KOH-activated sample was weak as it can be seen by comparing with noise intensity, and the width of the peak was broad. The higher electrical conductivity, that is, the larger quantity of free electrons, may be the reason for the smaller intensity of the KOH-activated biochar peak. The weak peaks at 270 ppm and 20 ppm observed in the spectrum of the original biochar are attributed to spinning sidebands (SSBs). High-intensity peaks corresponding to large concentrations of oxygen-containing functional groups such as the C–OH group, the C=O group and the COOH group did not appear in either sample [44]. Therefore, there is no evidence that the chemical reactions that occurred during KOH activation led to biochar oxidation. Our NMR results agree well with those of other woody biochars and activated carbons that have appeared in the literature [45].

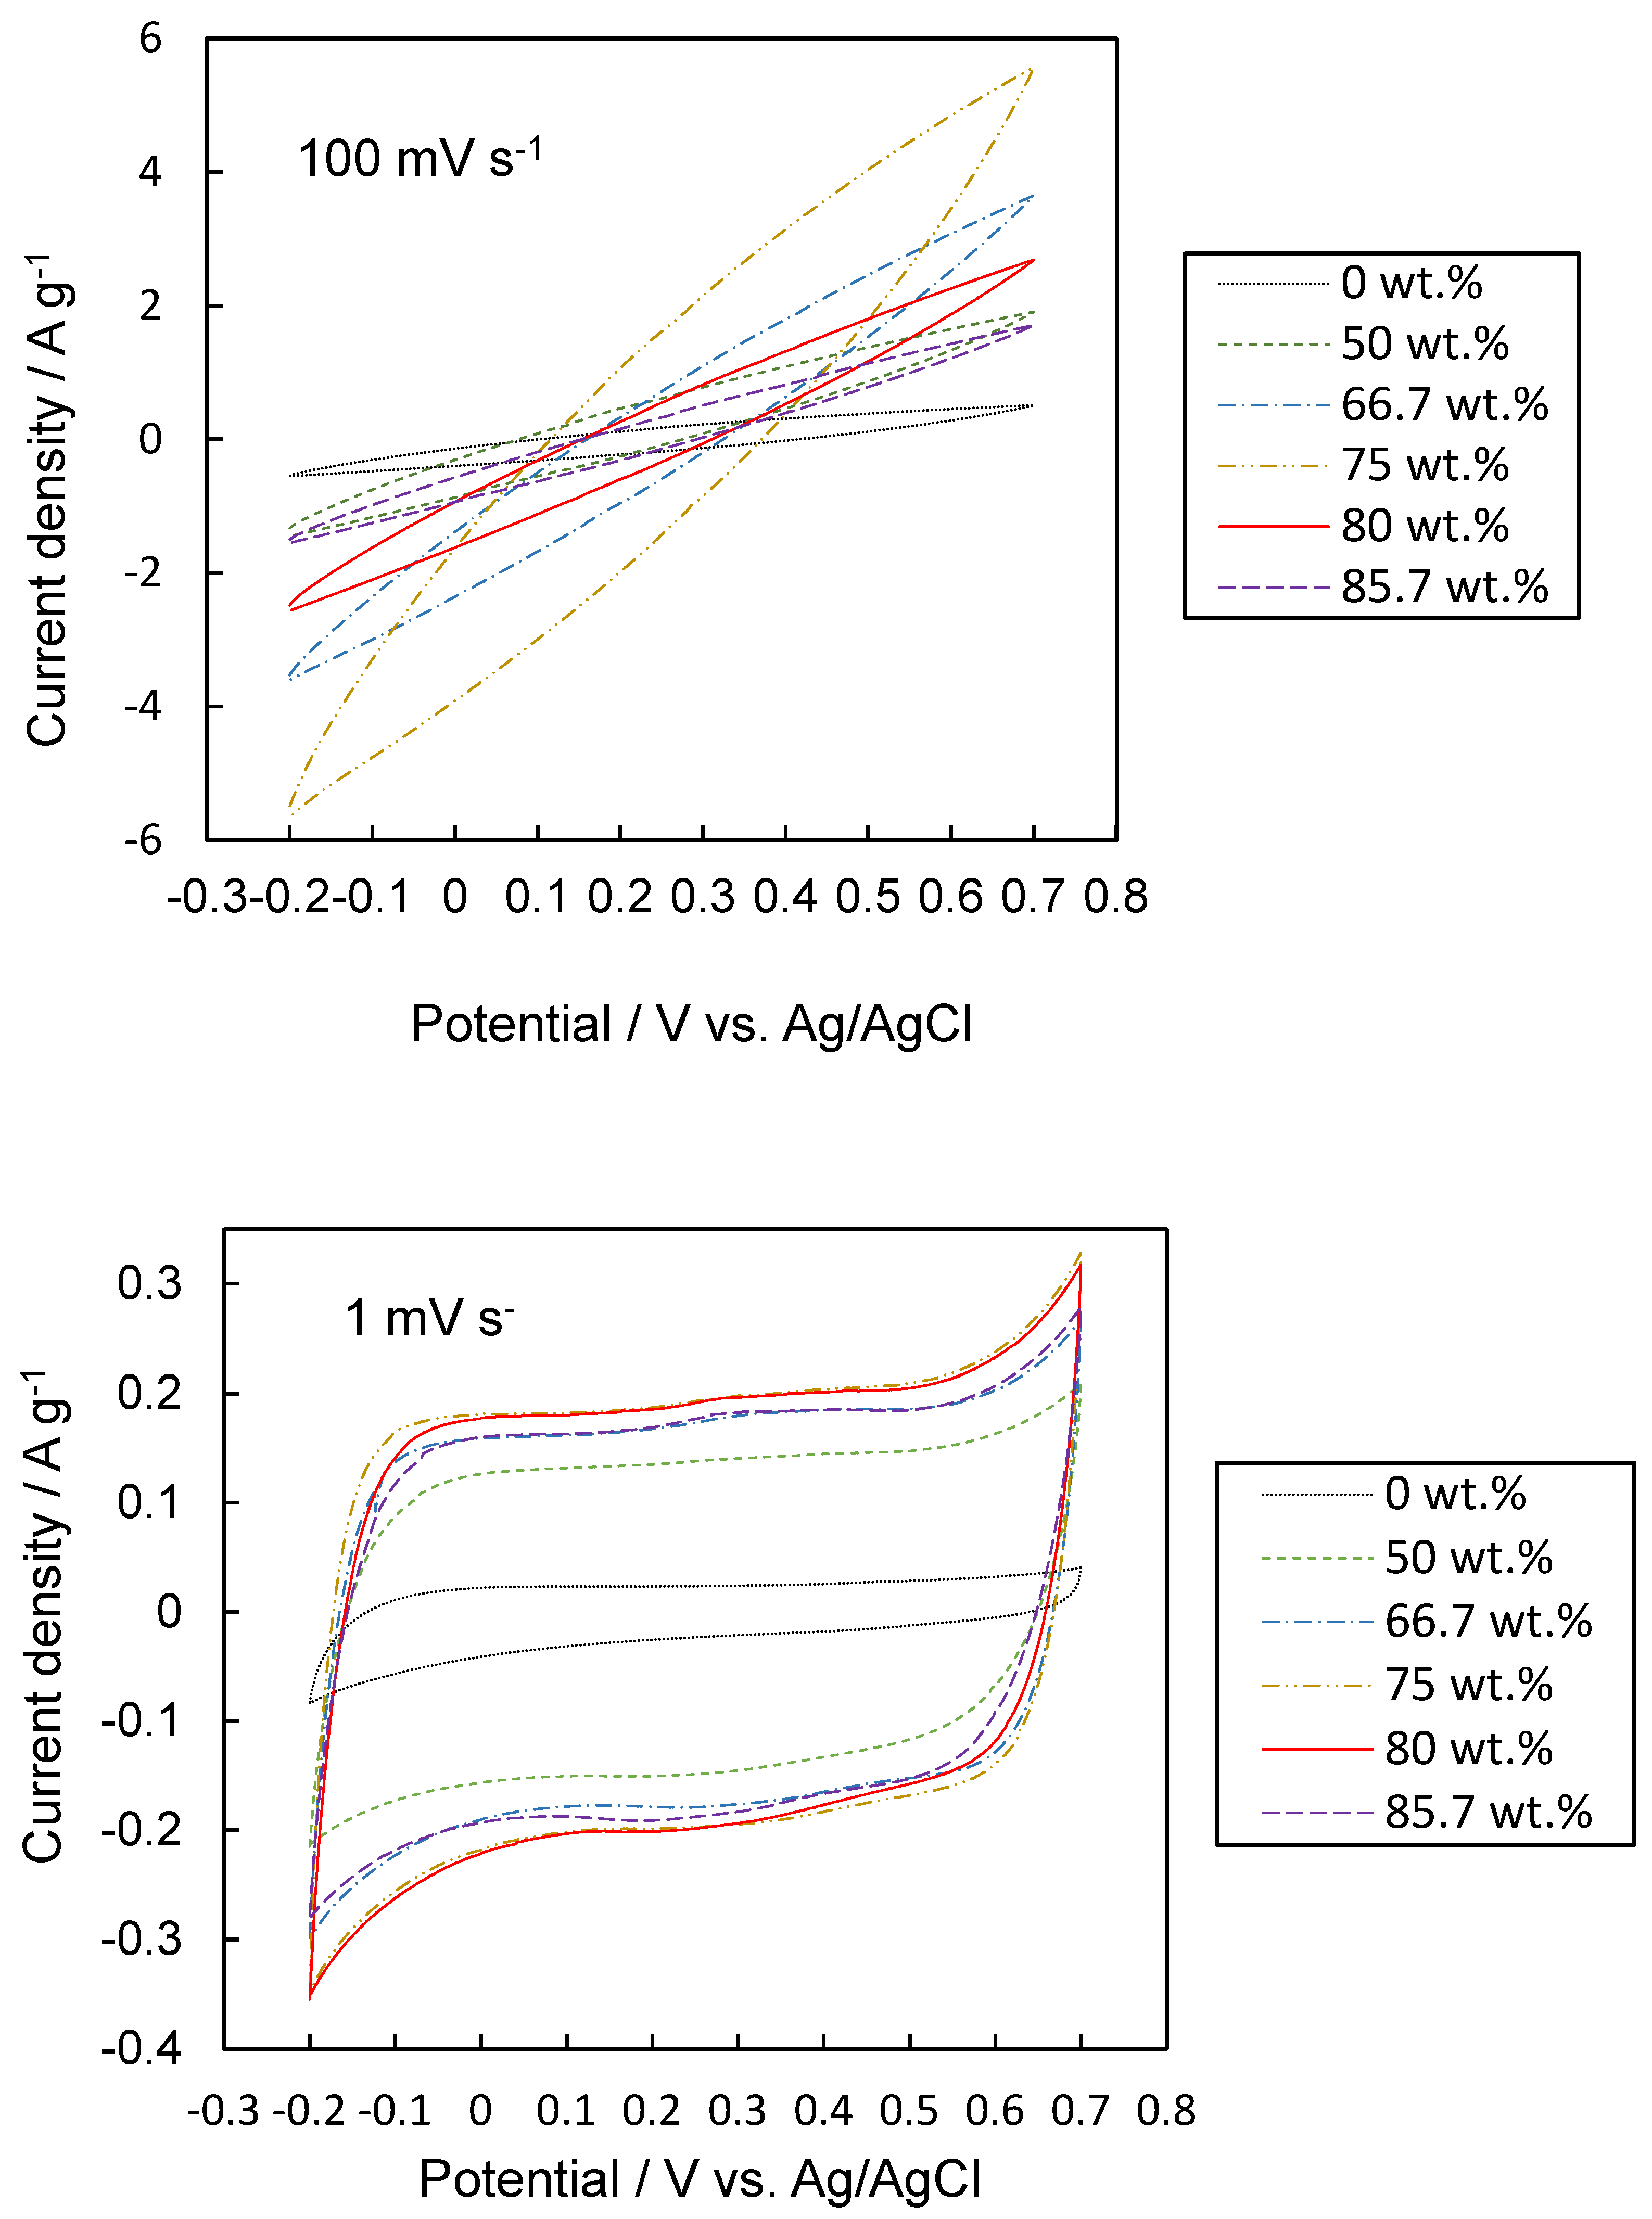
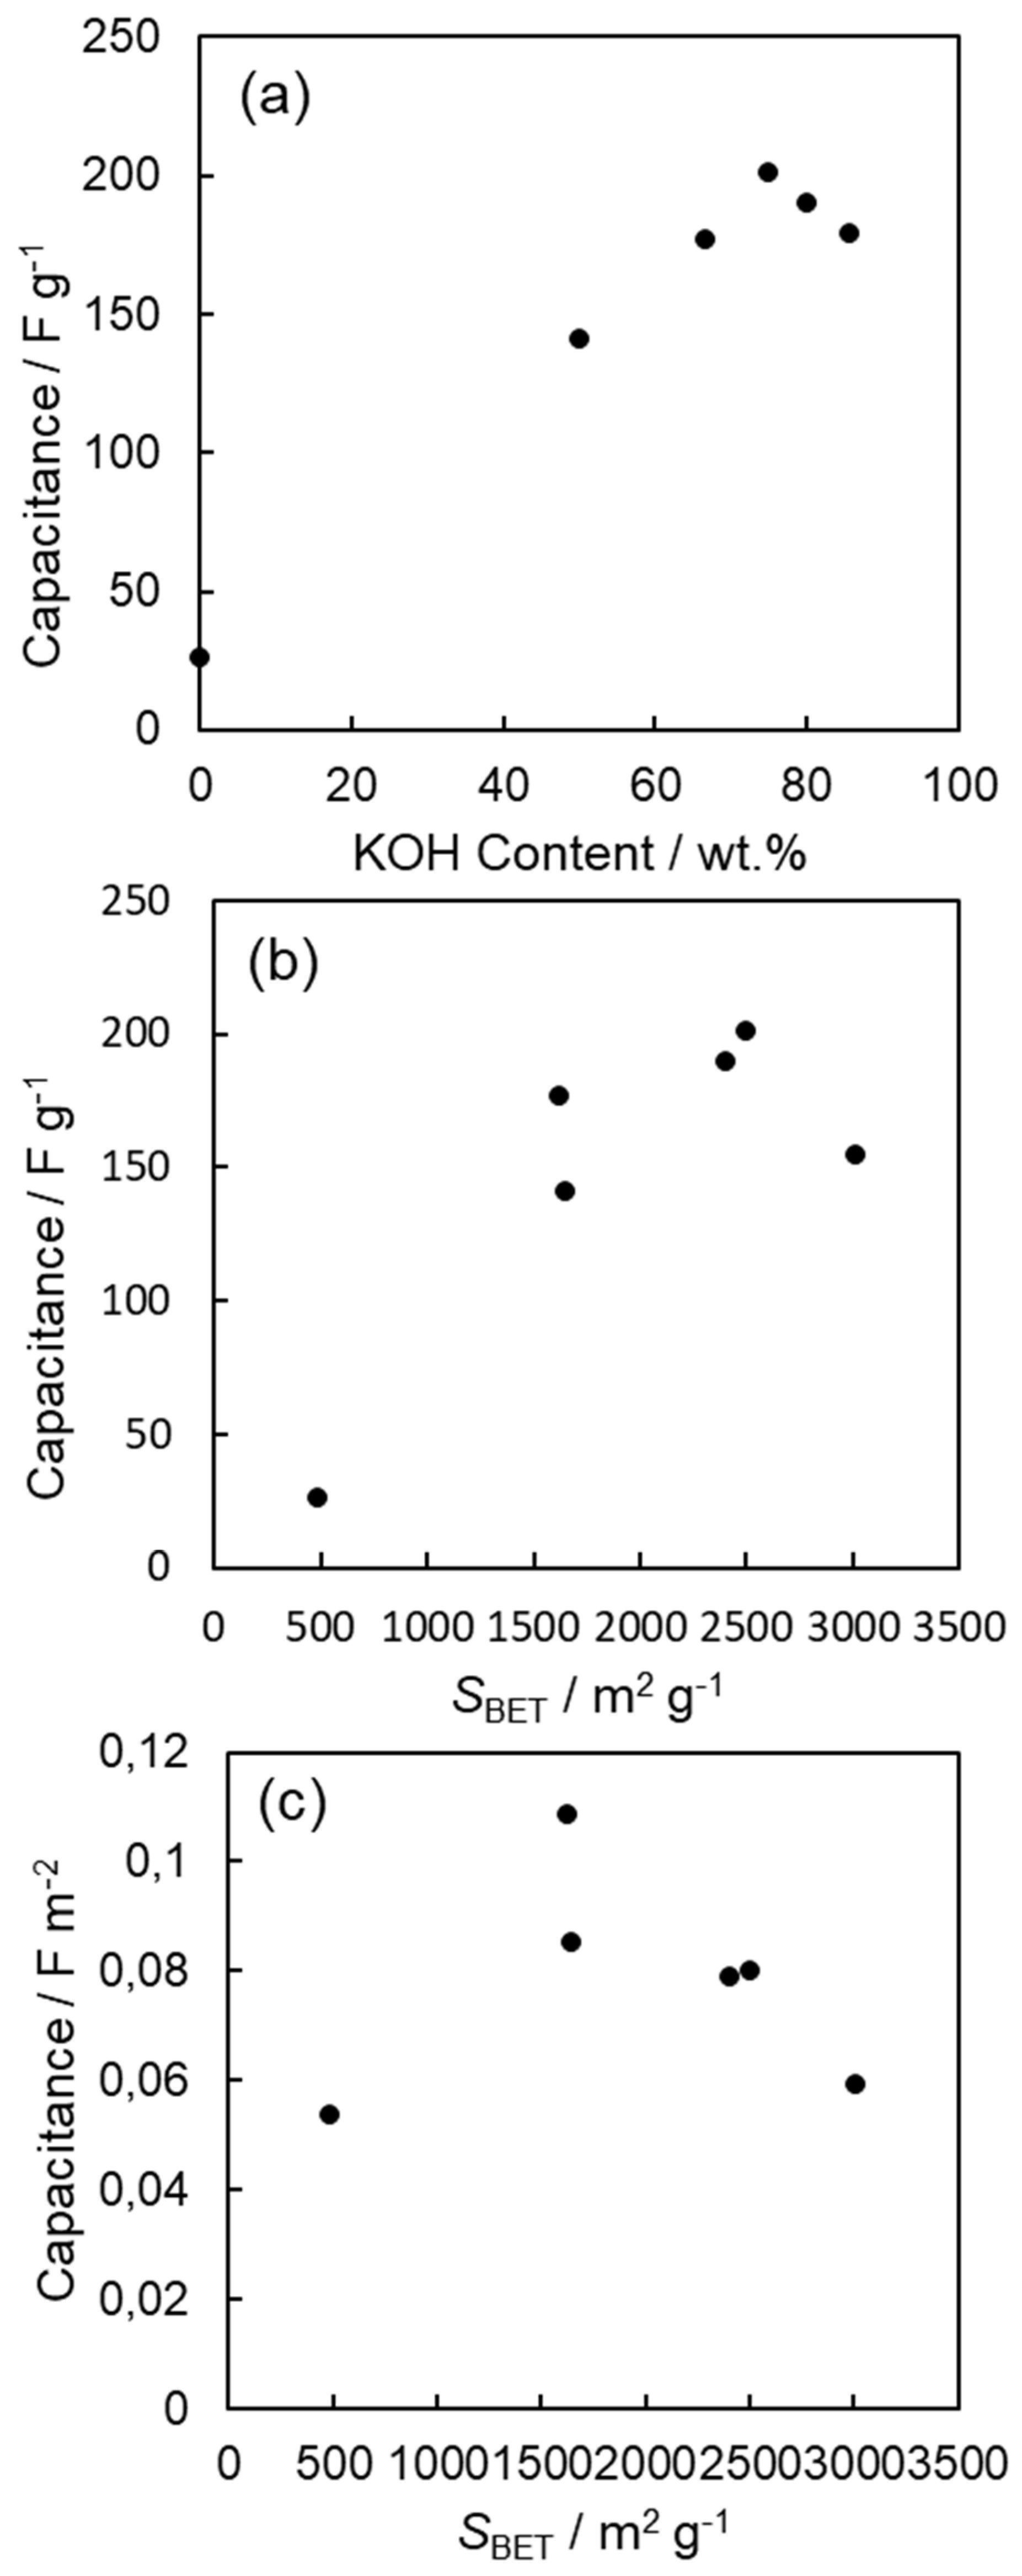
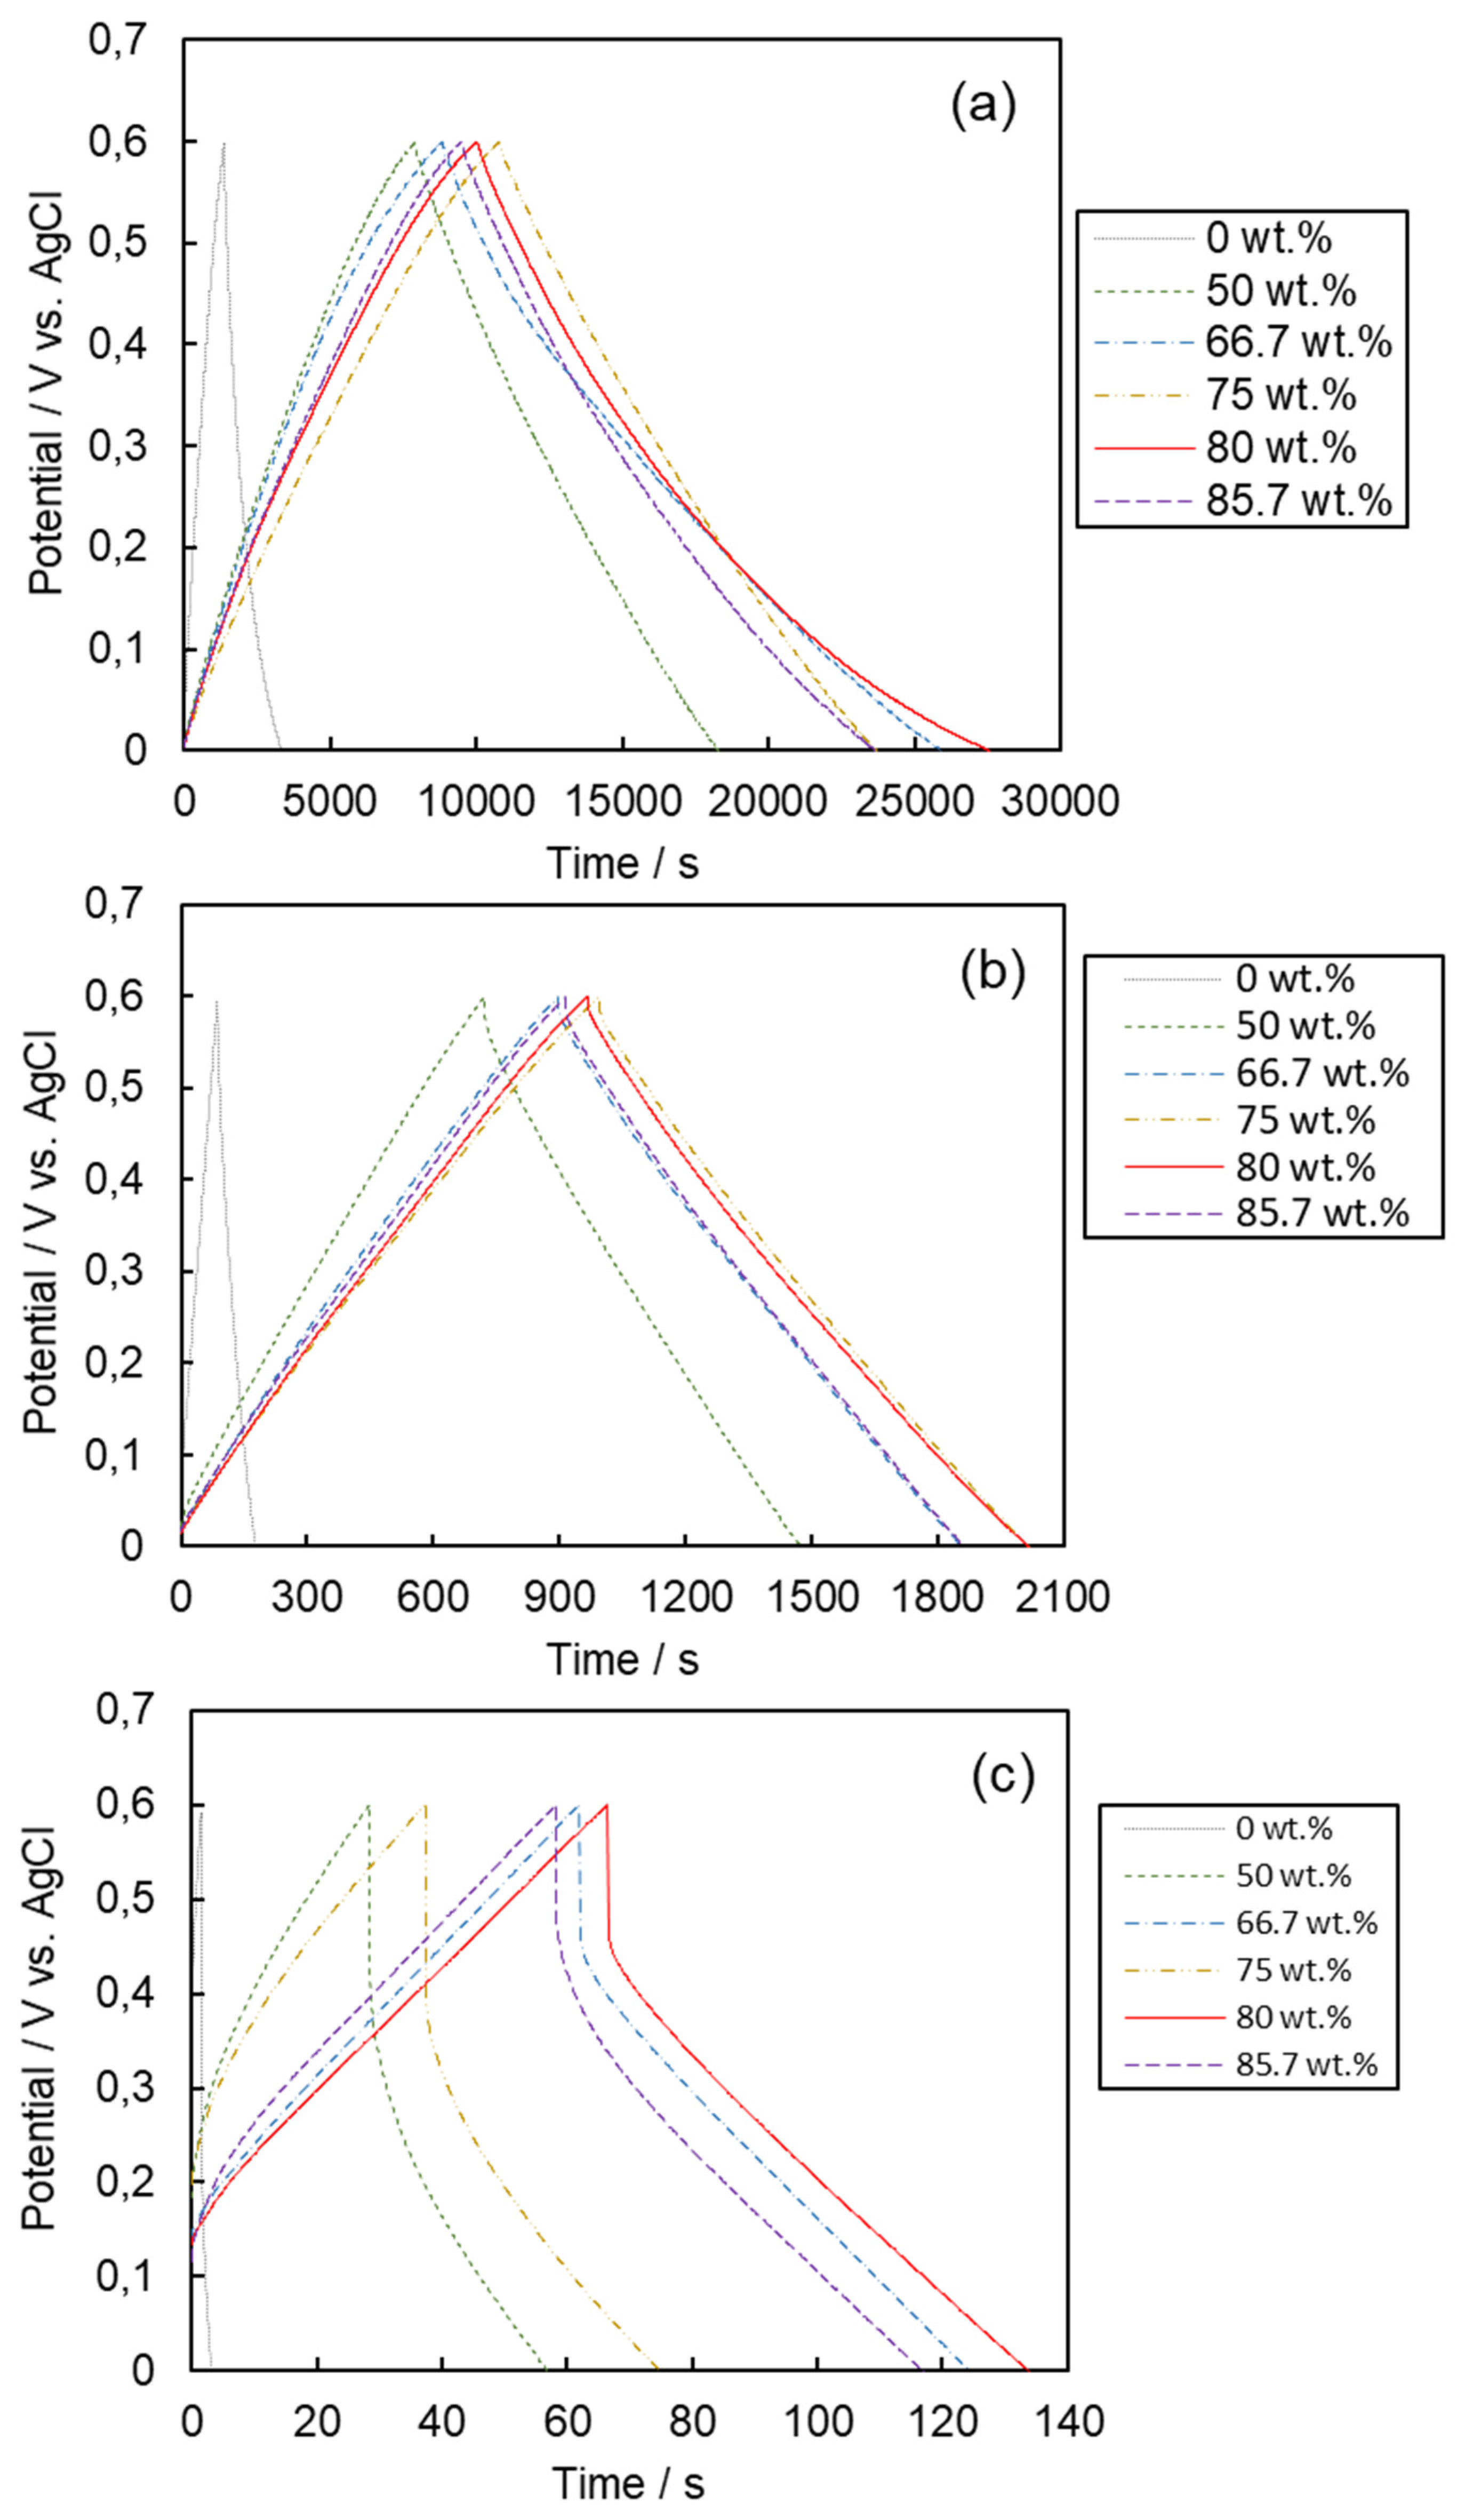
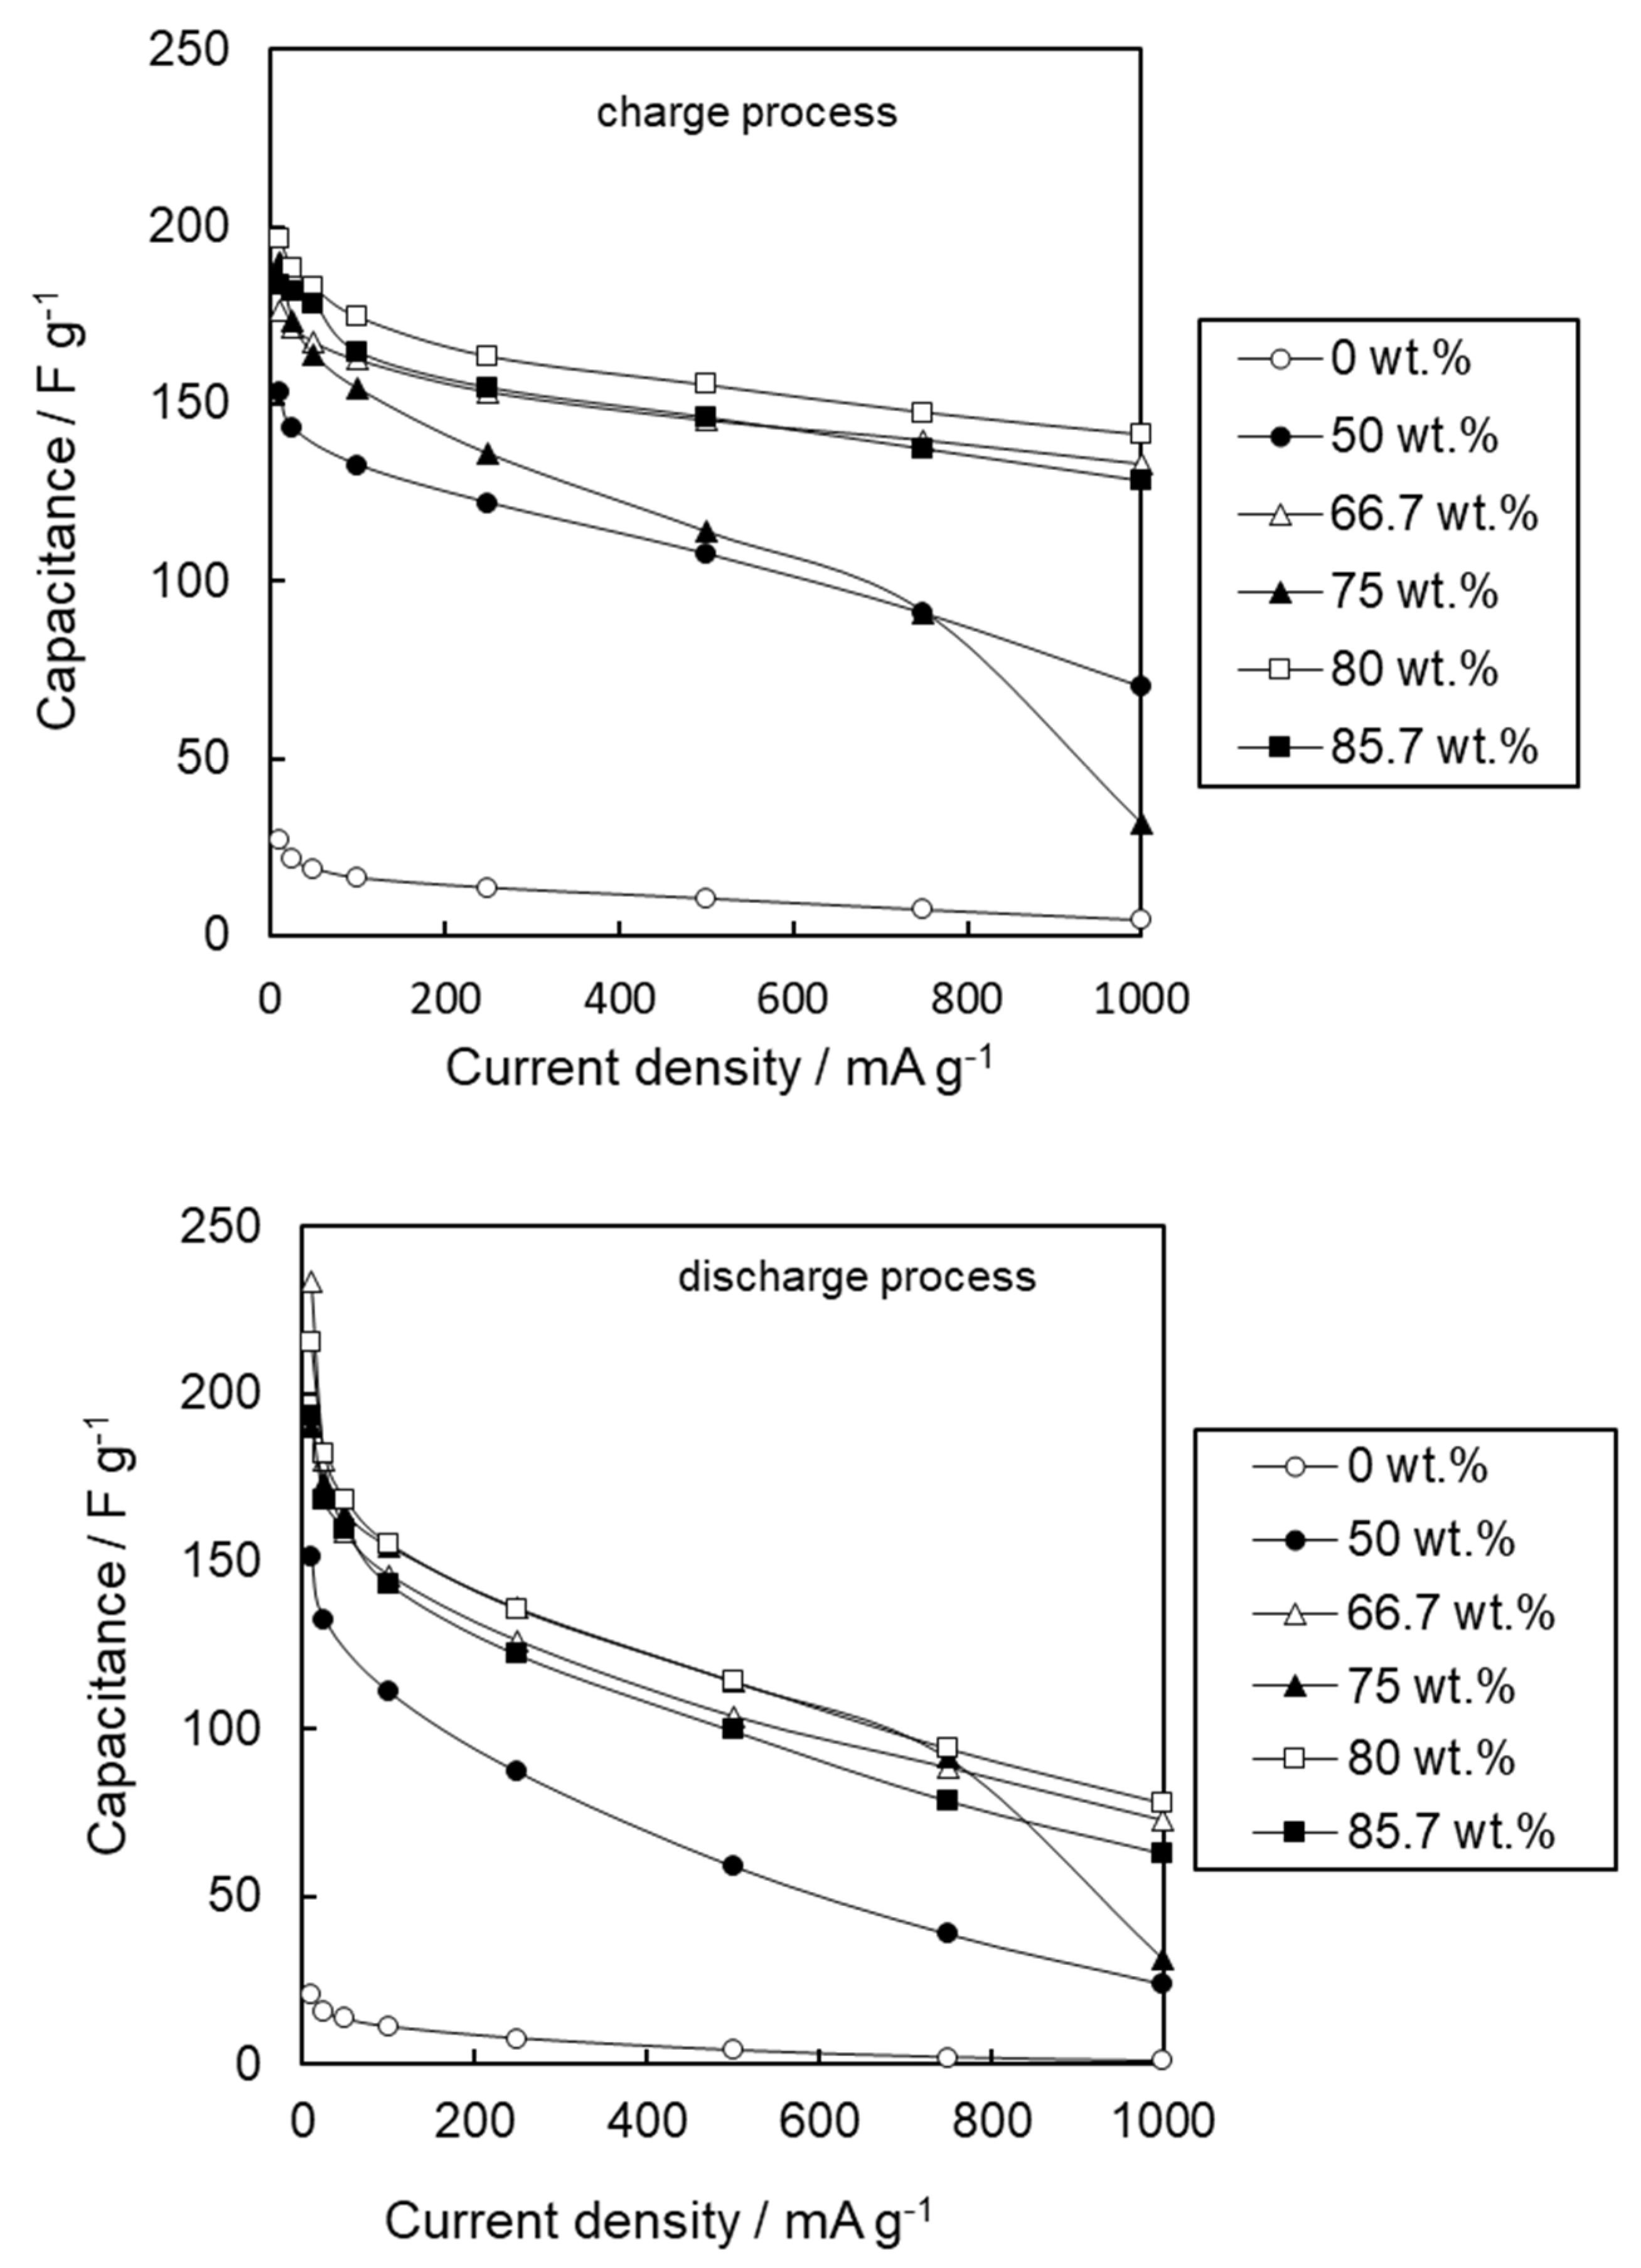
3.3. Electrochemical Performance

The CV graphs of the samples are shown in Figure 7. The area surrounded by the line of the graph increased by the KOH activation. When the scan rate was 1 mV s−1, the shape of the graphs was near to rectangular. Therefore, the formation of an electric double layer was the dominant factor for the capacity. When the scan rate was 100 mV s−1, the graphs were distorted to spindle shape. The reason for the formation of this shape could be the slow response of the current value when the direction of the applied voltage was reversed. The delayed response could be due to the slow diffusion of ion species in small pores.
The capacitance values were calculated from the CV data. The capacitance per gram at 1 mV s−1 as the function of the amount of KOH added for activation is shown in Figure 8a. It can be seen that the capacitance values largely increased with KOH activation. Therefore, KOH activation is effective for the increment of the capacitance value. The capacitance values per gram at 1 mV s−1 as the function of the SBET value are shown in Figure 8b. The capacitance values were improved with the increment of surface area associated with KOH activation. The maximum capacitance value of 200 F g−1 was observed at a surface area of 2500 m2 g−1 and compares favorably to respective values from graphene materials reported earlier [46,47]. However, further enhancement of the surface area was ineffective for the improvement of the capacitance value. The capacitance values per area in correlation to the SBET values are drawn in Figure 8c. The maximum capacitance value per square meter was ~0.1 F m−2 at ~2000 m2 g−1. This value is comparable to the value reported by Baranco et al. (2010), who activated amorphous carbon nanofibers of low graphite content and applied them as a supercapacitor electrode [48]. The authors observed a linear correlation of the capacitance values to the surface areas of their activated materials, a trend not observed in this study. At higher surface areas, a reduction in capacitance value was observed. This is an indication that electrochemical performance is not solely influenced by surface area but additional parameters play a role. It can be concluded that the optimum capacitance values were obtained from the activated biochars having surface areas in the range of 2000–2500 m2 g−1. It has been reported that in 1 M H2SO4 aqueous electrolyte the capacitance value per gram is saturated when specific surface area is more than 1400 m2 g−1 [49].
The data of the galvanostatic charge–discharge measurements are shown in Figure 9. When the current density of the charge–discharge process was 100 mA g−1, the shape of the graphs was almost an isosceles triangle, which is the ideal shape as a capacitor. In the case of 1000 mA g−1 current density, the data indicated the behavior as a capacitor, although IR drops clearly appeared. When the current density was 10 mA g−1, some of the graphs were tailed at the discharge process. The cause of the tailing might be leakage current, which appeared at a small current density.
The capacitance values calculated from the data of charge–discharge measurements are shown in Figure 10. An increase can be observed up to a KOH content of 80.7 wt.%; however, at a higher KOH content the capacitance values decrease. The ratios of the capacitance value at the discharge process to that at the charge process, Cdischarge/Ccharge, as a function of current density are shown in Figure S8. The Cdischarge/Ccharge value corresponds to the ratio of the available electric energy to the stored electric energy, that is, the energy efficiency. Typically, the Cdischarge/Ccharge value should be less than 1; however, some of the values at the lower current density region were more than 1. The reason for this irregularity may be the tailing of the discharge process. Therefore, the values that were less than 1 should be discussed for the efficiency. The Cdischarge/Ccharge value increased by the KOH activation, and the samples that were prepared at more than 66.7 wt.% of KOH tended to have similar values. These data indicated that KOH activation improved the energy efficiency.
The capacitance value per area, C (F g−1), can be expressed as follows [50,51,52]
C = Cext * Sext + Cpore * Spore
where Cext (F m−2) is the capacitance value per area of the external surface, Sext (m2 g−1) is the external surface area, Cpore (F m−2) is the capacitance value per area of the pore surface and Spore (m2 g−1) is the pore surface area. Subsequently, Equation (8) can be converted as follows:
C/Sext = Cext + Cpore * (Spore/Sext)
If both Cpore and Cext are constant values, the plots of the (C/Sext) values vs. the (Spore/Sext) should be linear, and these values are calculated from the slop and the y intercept of the line, respectively. The relationship between the (C/Sext) values and the (Spore/Sext) values of the discharge process at 500 mA g−1 is shown in Figure S9. Other relationships between the (C/Sext) values and the (Spore/Sext) values are shown in Figure S10. Because the plots exhibited good linearity, the Cpore and Cext values for the KOH-activated samples were estimated from the slope and the intercept, respectively. However, the intercept was negative, thus corresponding to a negative Cext value. The estimated Cpore and Cext values are shown in Figure S11 as the function of current density. The reason for the negative Cext values might be the existence of residual ash, which acted as an electrical insulator in the samples. Because the external surface areas were estimated by the t-plots of N2 adsorption isotherms, the estimated values also include the value of the ash surface. Generally, ash is an electric insulator and acts as the internal resistance. As the result, the capacitance value is reduced by the existence of ash. Additionally, the Cpore value (~0.07 F m−2), which is based on t-plot, might be underestimated, and this value is comparable to the capacitance value per area calculated by using the SBET value. The removal of ash may be a suitable strategy for the improvement of the performance of this biochar as an EDLC electrode material.
Table 5 compares the optimum capacitance values obtained in this study to the ones obtained in earlier studies. Although the electrode preparation conditions and the electrolyte are different in each case, it can be observed that the electrochemical performance of the activated biochar electrode is comparable to or even better than other materials in the published literature. Furthermore, flame-curtain pyrolysis produced reproducible biochar at pilot-scale compared to the studies of Table 5, which prepared the precursor at laboratory scale.

4. Conclusions

In this study, the fields of waste management and environmental sustainability were combined with advanced materials science. It was demonstrated that the pilot-scale production of biochar from pine tree residues using the flame-curtain pyrolysis methodology is a very reproducible process. Furthermore, the cost of construction and operation of the pyrolysis kiln is very low, and if the biomass is freely available, biochar can be sustainably produced and used as a precursor for activated carbon suitable for advanced applications. KOH activation of the pine tree biochar was successful and resulted in high-surface-area, microporous activated biochars. Electrochemical measurements highlighted their suitability as EDLC electrodes and the performance of the optimum activated sample compared favorably to that of known materials commonly used in this field. Before further comparisons can be made, it is important to assess the sustainability and preparation costs of other EDLC electrode materials commonly found in the literature. Do they originate from renewable sources? Is wastewater produced and are greenhouse gases emitted? How may their preparation cost affect their large-scale application? Future studies on the application of activated biochars as EDLC electrodes need to address these questions and furthermore validate their electrochemical potential in a wider set of conditions, such as various original biomasses and activating reagents.

Supplementary Materials

The following are available online at https://www.mdpi.com/article/10.3390/en14227671/s1, Figure S1: SEM images of the samples after KOH activation, Figure S2: The yield, 100*(weight after KOH activation)/(weight before KOH activation), as a function of KOH content, Figure S3: The BET specific surface area, SBET, as the function of the added KOH, Figure S4: The αs plots of the samples, Figure S5: The (Vmicro/Vtotal) values as a function of KOH content, Figure S6: The relationship between the SBET value and Vmicro values, Figure S7: The temperature dependence of the Gibbs energies (ΔGr) of the chemical reactions, Figure S8: The capacitance values calculated from the data of charge–discharge measurements, Figure S9: The relationship between the (C/Sext) values and the (Spore/Sext) values of discharge process at 500 mA g−1 for KOH-activated samples, Figure S10: The relationship between the (C/Sext) values and the (Spore/Sext) values of KOH-activated samples, Figure S11: The estimated Cpore values and the estimated Cext values as the function of current density.

Author Contributions

Conceptualization, T.T., D.K.; methodology, T.T., D.K.; validation, T.T., D.K.; formal analysis, T.T., D.K.; investigation, S.T., T.K.; resources, T.T., D.K.; data curation, T.T., S.T., T.K.; writing—original draft preparation, T.T., D.K.; writing—review and editing, T.T., D.K.; visualization, T.T., S.T., T.K.; supervision, T.T.; project administration, T.T. All authors have read and agreed to the published version of the manuscript.

Funding

This research received no external funding.

Institutional Review Board Statement

Not applicable.

Informed Consent Statement

Not applicable.

Data Availability Statement

Not applicable.

Acknowledgments

The authors would like to thank the Cooperative Studies Using Collaborative Research Facilities of Wood Composite of Research Institute for Sustainable Humanosphere of Kyoto University. This work was performed under the Cooperative Research Program of “Network Joint Research Center for Materials and Devices” for solid 13C-NMR measurement.

Conflicts of Interest

The authors declare no conflict of interest.

References

  1. Ahmad, Z.; Mosa, A.; Zhan, L.; Gao, B. Biochar modulates mineral nitrogen dynamics in soil and terrestrial ecosystems: A critical review. Chemosphere 2021, 278, 130378. [Google Scholar] [CrossRef]
  2. Waqas, M.; Asam, Z.; Rehan, M.; Anwar, M.N.; Khattak, R.A.; Ismail, I.M.I.; Tabatabaei, M.; Nizami, A.S. Development of biomass-derived biochar for agronomic and environmental remediation applications. Biomass Convers. Biorefin. 2021, 11, 339–361. [Google Scholar] [CrossRef]
  3. Qiu, B.; Tao, X.; Wang, H.; Li, W.; Ding, X.; Chu, H. Biochar as a low-cost adsorbent for aqueous heavy metal removal: A review. J. Anal. Appl. Pyrolysis 2021, 155, 105081. [Google Scholar] [CrossRef]
  4. Zhao, J.; Boada, R.; Cibin, G.; Palet, C. Enhancement of selective adsorption of Cr species via modification of pine biomass. Sci. Total Environ. 2021, 756, 143816. [Google Scholar] [CrossRef]
  5. Zhou, X.; Zhu, Y.; Niu, Q.; Zeng, G.; Lai, C.; Liu, S.; Huang, D.; Qin, L.; Liu, X.; Li, B.; et al. New notion of biochar: A review on the mechanism of biochar applications in advannced oxidation processes. Chem. Eng. J. 2021, 416, 129027. [Google Scholar] [CrossRef]
  6. Cornelissen, G.; Pandit, N.R.; Taylor, P.; Pandit, B.H.; Sparrevik, M.; Schmidt, H.P. Emissions and char quality of flame-curtain “Kon Tiki” kilns for farmer-scale charcoal/biochar production. PLoS ONE 2016, 11, e54856. [Google Scholar] [CrossRef] [PubMed] [Green Version]
  7. European Biochar Certificate (EBC). Guidelines for a Sustainable Production of Biochar; European Biochar Foundation: Arbaz, Switzerland, 2016; pp. 1–22. [Google Scholar]
  8. Kalderis, D.; Tsuchiya, S.; Phillipou, K.; Paschalidou, P.; Pashalidis, I.; Tashima, D.; Tsubota, T. Utilization of pine tree biochar produced by flame-curtain pyrolysis in two non-agricultural applications. Bioresour. Technol. Rep. 2020, 9, 100384. [Google Scholar] [CrossRef]
  9. Owsianiak, M.; Cornelissen, G.; Hale, S.E.; Lindhjem, H.; Sparrevik, M. Influence of spatial differentiation in impact assessment for LCA-based decision support: Implementation of biochar technology in Indonesia. J. Clean. Prod. 2018, 200, 259–268. [Google Scholar] [CrossRef]
  10. Garakani, M.A.; Bellani, S.; Pellegrini, V.; Oropesa-Nuñez, R.; Castillo, A.E.D.R.; Abouali, S.; Najafi, L.; Martín-García, B.; Ansaldo, B.A.; Bondavalli, P.; et al. Scalable spray-coated graphene-based electrodes for high-power electrochemical double-layer capacitors operating over a wide range of temperature. Energy Storage Mater. 2021, 34, 1–11. [Google Scholar] [CrossRef]
  11. Yue, Z.; Dunya, H.; Ashuri, M.; Kucuk, K.; Aryal, S.; Antonov, S.; Alabbad, B.; Segre, C.U.; Mandal, B.K. Synthesis of a very high specific surface area active carbon and its electrical double-layer capacitor properties in organic electrolytes. ChemEngineering 2020, 4, 43. [Google Scholar] [CrossRef]
  12. Daraghmeh, A.; Hussain, S.; Haq, A.U.; Saadeddin, I.; Servera, L.; Ruiz, J.M. Carbon nanocomposite electrodes for electrical double layer capacitor. J. Energy Storage 2020, 32, 101798. [Google Scholar] [CrossRef]
  13. Kumar, N.; Singh, M.; Kumar, A.; Tseng, T.Y.; Sharma, Y. Facile and One-Step in Situ Synthesis of Pure Phase Mesoporous Li2MnSiO4/CNTs Nanocomposite for Hybrid Supercapacitors. ACS Appl. Energy Mater. 2020, 3, 2450–2464. [Google Scholar] [CrossRef]
  14. Zhang, M. A Novel Energy Band Match Method and a Highly Efficient CuO–Co3O4@SiO2 Catalyst for Dimethyl Carbonate Synthesis from CO2. Sci. Adv. Mater. 2021, 13, 115–122. [Google Scholar] [CrossRef]
  15. Zhang, M. Diethyl carbonate synthesis from CO2 with dehydrating agent of ethylene over catalysts of supported and mixed Ni–Cu@Na3PW12O40. Chem. Pap. 2020, 74, 4493–4505. [Google Scholar] [CrossRef]
  16. Zhang, M. Synthesis of Co1.5PW12O40 and its catalytic performance of completely converting methanol to ethylene. Chem. Commun. 2016, 52, 1151–1153. [Google Scholar] [CrossRef] [PubMed]
  17. González, A.; Goikolea, E.; Barrena, J.A.; Mysyk, R. Review on supercapacitors: Technologies and materials. Renew. Sustain. Energy Rev. 2016, 58, 1189–1206. [Google Scholar] [CrossRef]
  18. Paraskeva, P.; Kalderis, D.; Diamadopoulos, E. Production of activated carbon from agricultural by-products. J. Chem. Technol. Biotechnol. 2008, 83, 581–592. [Google Scholar] [CrossRef]
  19. Zhang, J.; Chen, H.; Bai, J.; Xu, M.; Luo, C.; Yang, L.; Bai, L.; Wei, D.; Wang, W.; Yang, H. N-doped hierarchically porous carbon derived from grape marcs for high-performance supercapacitors. J. Alloys Compd. 2021, 854, 157207. [Google Scholar] [CrossRef]
  20. Nguyen, N.T.; Le, P.A.; Phung, V.B.T. Biomass-derived activated carbon electrode coupled with a redox additive electrolyte for electrical double-layer capacitors. J. Nanopart. Res. 2020, 22, 371. [Google Scholar] [CrossRef]
  21. Sinha, P.; Yadav, A.; Tyagi, A.; Paik, P.; Yokoi, H.; Naskar, A.K.; Kuila, T.; Kar, K.K. Keratin-derived functional carbon with superior charge storage and transport for high-performance supercapacitors. Carbon 2020, 168, 419–438. [Google Scholar] [CrossRef]
  22. Zhao, G.; Li, Y.; Zhu, G.; Shi, J.; Lu, T.; Pan, L. Biomass-Based N, P, and S Self-Doped Porous Carbon for High-Performance Supercapacitors. ACS Sustain. Chem. Eng. 2019, 7, 12052–12060. [Google Scholar] [CrossRef]
  23. Li, T.; Ma, R.; Lin, J.; Hu, Y.; Zhang, P.; Sun, S.; Fang, L. The synthesis and performance analysis of various biomass-based carbon materials for electric double-layer capacitors: A review. Int. J. Energy Res. 2020, 44, 2426–2454. [Google Scholar] [CrossRef]
  24. Galarneau, A.; Villemot, F.; Rodriguez, J.; Fajula, F.; Coasne, B. Validity of the t-plot method to assess microporosity in hierarchical micro/mesoporous materials. Langmuir 2014, 30, 13266–13274. [Google Scholar] [CrossRef]
  25. Wei, X.; Jiang, X.; Wei, J.; Gao, S. Functional Groups and Pore Size Distribution Do Matter to Hierarchically Porous Carbons as High-Rate-Performance Supercapacitors. Chem. Mater. 2016, 28, 445–458. [Google Scholar] [CrossRef]
  26. Villarroel-Rocha, J.; Barrera, D.; Blanco, A.; Jalil, M.; Sapag, K. Importance of the αs-plot method in the characterization of nanoporous materials. Adsorpt. Sci. Technol. 2013, 31, 165–183. [Google Scholar] [CrossRef] [Green Version]
  27. Gómez, N.; Rosas, J.G.; Cara, J.; Martínez, O.; Alburquerque, J.A.; Sánchez, M.E. Slow pyrolysis of relevant biomasses in the Mediterranean basin. Part 1. Effect of temperature on process performance on a pilot scale. J. Clean. Prod. 2016, 120, 181–190. [Google Scholar] [CrossRef]
  28. Park, J.H.; Wang, J.J.; Kim, S.H.; Kang, S.W.; Jeong, C.Y.; Jeon, J.R.; Park, K.H.; Cho, J.S.; Delaune, R.D.; Seo, D.C. Cadmium adsorption characteristics of biochars derived using various pine tree residues and pyrolysis temperatures. J. Colloid Interface Sci. 2019, 553, 298–307. [Google Scholar] [CrossRef]
  29. Zhao, C.; Shao, B.; Yan, M.; Liu, Z.; Liang, Q.; He, Q.; Wu, T.; Liu, Y.; Pan, Y.; Huang, J.; et al. Activation of peroxymonosulfate by biochar-based catalysts and applications in the degradation of organic contaminants: A review. Chem. Eng. J. 2021, 416, 128829. [Google Scholar] [CrossRef]
  30. Fawzy, S.; Osman, A.I.; Yang, H.; Doran, J.; Rooney, D.W. Industrial Biochar Systems for Atmospheric Carbon Removal: A Review; Springer International Publishing: Cham, Switzerland, 2021. [Google Scholar] [CrossRef]
  31. Bakshi, S.; Banik, C.; Laird, D.A. Estimating the organic oxygen content of biochar. Sci. Rep. 2020, 10, 13082. [Google Scholar] [CrossRef]
  32. Tsubota, T.; Hohshi, Y.; Ohno, T.; Kumagai, S. KOH activation of solid residue of Japanese citron after extraction by microwave process and property as EDLC electrode. J. Porous Mater. 2020, 27, 727–734. [Google Scholar] [CrossRef]
  33. Cychosz, K.A.; Thommes, M. Progress in the Physisorption Characterization of Nanoporous Gas Storage Materials. Engineering 2018, 4, 559–566. [Google Scholar] [CrossRef]
  34. Wu, F.C.; Tseng, R.L.; Juang, R.S. Comparisons of porous and adsorption properties of carbons activated by steam and KOH. J. Colloid Interface Sci. 2005, 283, 49–56. [Google Scholar] [CrossRef] [PubMed]
  35. Khezami, L.; Ould-Dris, A.; Capart, R. Activated carbon from thermo-compressed wood and other lignocellulosic precursors. BioResources 2007, 2, 193–209. [Google Scholar] [CrossRef]
  36. Mistar, E.M.; Alfatah, T.; Supardan, M.D. Synthesis and characterization of activated carbon from Bambusa vulgaris striata using two-step KOH activation. J. Mater. Res. Technol. 2020, 9, 6278–6286. [Google Scholar] [CrossRef]
  37. Raymundo-Piñero, E.; Azaïs, P.; Cacciaguerra, T.; Cazorla-Amorós, D.; Linares-Solano, A.; Béguin, F. KOH and NaOH activation mechanisms of multiwalled carbon nanotubes with different structural organization. Carbon 2005, 43, 786–795. [Google Scholar] [CrossRef]
  38. Heidarinejad, Z.; Dehghani, M.H.; Heidari, M.; Javedan, G.; Ali, I.; Sillanpää, M. Methods for preparation and activation of activated carbon: A review. Environ. Chem. Lett. 2020, 18, 393–415. [Google Scholar] [CrossRef]
  39. Barin, I. Thermochemical Data of Pure Substances; VCH: Weinheim, Germany, 1989. [Google Scholar]
  40. Dehkhoda, A.M.; Gyenge, E.; Ellis, N. A novel method to tailor the porous structure of KOH-activated biochar and its application in capacitive deionization and energy storage. Biomass Bioenergy 2016, 87, 107–121. [Google Scholar] [CrossRef] [Green Version]
  41. Wang, J.; Kaskel, S. KOH activation of carbon-based materials for energy storage. J. Mater. Chem. 2012, 22, 23710–23725. [Google Scholar] [CrossRef]
  42. Sajjadi, B.; Zubatiuk, T.; Leszczynska, D.; Leszczynski, J.; Chen, W.Y. Chemical activation of biochar for energy and environmental applications: A comprehensive review. Rev. Chem. Eng. 2019, 35, 777–815. [Google Scholar] [CrossRef]
  43. Srinivasan, P.; Sarmah, A.K.; Smernik, R.; Das, O.; Farid, M.; Gao, W. A feasibility study of agricultural and sewage biomass as biochar, bioenergy and biocomposite feedstock: Production, charac-terization and potential applications. Sci. Total Environ. 2015, 512–513, 495–505. [Google Scholar] [CrossRef]
  44. Kim, H.S.; Nishiyama, Y.; Ideta, K.; Miyawaki, J.; Matsushita, Y.; Park, J.I.; Mochida, I.; Yoon, S.H. Analysis of water in Loy Yang brown coal using solid-state 1H NMR. J. Ind. Eng. Chem. 2013, 19, 1673–1679. [Google Scholar] [CrossRef]
  45. McBeath, A.V.; Smernik, R.J.; Krull, E.S.; Lehmann, J. The influence of feedstock and production temperature on biochar carbon chemistry: A solid-state 13C NMR study. Biomass Bioenergy 2014, 60, 121–129. [Google Scholar] [CrossRef]
  46. Hor, A.A.; Hashmi, S.A. Optimization of hierarchical porous carbon derived from a biomass pollen-cone as high-performance electrodes for supercapacitors. Electrochim. Acta 2020, 356, 136826. [Google Scholar] [CrossRef]
  47. Zhi, M.; Xiang, C.; Li, J.; Li, M.; Wu, N. Nanostructured carbon-metal oxide composite electrodes for supercapacitors: A review. Nanoscale 2013, 5, 72–88. [Google Scholar] [CrossRef] [PubMed]
  48. Li, W.; Bu, Y.; Jin, H.; Wang, J.; Zhang, W.; Wang, S.; Wang, J. The preparation of hierarchical flowerlike NiO/reduced graphene oxide composites for high performance supercapacitor applications. Energy Fuels 2013, 27, 6304–6310. [Google Scholar] [CrossRef]
  49. Barranco, V.; Lillo-Rodenas, M.A.; Linares-Solano, A.; Oya, A.; Pico, F.; Ibañfez, J.; Agullo-Rueda, F.; Amarilla, J.M.; Rojo, J.M. Amorphous carbon nanofibers and their activated carbon nanofibers as supercapacitor electrodes. J. Phys. Chem. C 2010, 114, 10302–10307. [Google Scholar] [CrossRef]
  50. Endo, M.; Maeda, T.; Takeda, T.; Kim, Y.J.; Koshiba, K.; Hara, H.; Dresselhaus, M.S. Capacitance and Pore-Size Distribution in Aqueous and Nonaqueous Electrolytes Using Various Activated Carbon Electrodes. J. Electrochem. Soc. 2001, 148, A910. [Google Scholar] [CrossRef]
  51. Shi, H. Activated carbons and double layer capacitance. Electrochim. Acta 1996, 41, 1633–1639. [Google Scholar] [CrossRef]
  52. Tsubota, T.; Nagata, D.; Murakami, N.; Ohno, T. Spherical activated carbon derived from spherical cellulose and its performance as EDLC electrode. J. Appl. Polym. Sci. 2014, 131, 1–7. [Google Scholar] [CrossRef]
  53. You, X.; Misra, M.; Gregori, S.; Mohanty, A.K. Preparation of an Electric Double Layer Capacitor (EDLC) Using Miscanthus-Derived Biocarbon. ACS Sustain. Chem. Eng. 2018, 6, 318–324. [Google Scholar] [CrossRef]
  54. Oh, T.; Kim, M.; Choi, J.; Kim, J. Design of graphitic carbon nitride nanowires with captured mesoporous carbon spheres for EDLC electrode materials. Ionics 2018, 24, 3957–3965. [Google Scholar] [CrossRef]
  55. Fujishige, M.; Yoshida, I.; Toya, Y.; Banba, Y.; Oshida, K.-I.; Tanaka, Y.-S.; Dulyaseree, P.; Wongwiriyapan, W.; Takeuchi, K. Preparation of activated carbon from bamboo-cellulose fiber and its use for EDLC electrode material. J. Environ. Chem. Eng. 2017, 5, 1801–1808. [Google Scholar] [CrossRef]
  56. Chen, H.; Liu, D.; Shen, Z.; Bao, B.; Zhao, S.; Wu, L. Functional Biomass Carbons with Hierarchical Porous Structure for Supercapacitor Electrode Materials. Electrochim. Acta 2015, 180, 241–251. [Google Scholar] [CrossRef]
  57. Takeuchi, K.; Fujishige, M.; Ishida, N.; Kunieda, Y.; Kato, Y.; Tanaka, Y.; Ochi, T.; Shirotori, H.; Uzuhashi, Y.; Ito, S.; et al. High porous bio-nanocarbons prepared by carbonization and NaOH activation of polysaccharides for electrode material of EDLC. J. Phys. Chem. Solids 2018, 118, 137–143. [Google Scholar] [CrossRef]
  58. Köse, K.Ö.; Pişkin, B.; Aydınol, M.K. Chemical and structural optimization of ZnCl2 activated carbons via high temperature CO2 treatment for EDLC applications. Int. J. Hydrog. Energy 2018, 43, 18607–18616. [Google Scholar] [CrossRef]
  59. Gao, Q.; Titirici, M.M. Achieving high volumetric EDLC carbons via hydrothermal carbonization and cyclic activation. J. Phys. Energy 2020, 2, 025005. [Google Scholar] [CrossRef]
  60. Chang, P.; Yang, F.; Xie, Q.; Li, T.; Dong, J. 2D porous carbon nanosheet from sulfonated pitch-based graphene quantum dots for high volumetric performance EDLCs. J. Power Sources 2020, 479, 228825. [Google Scholar] [CrossRef]
Figure 1. N2 adsorption isotherms of the samples at 77 K.
Energies 14 07671 g001
Figure 2. Pore size distribution at the micropore region calculated by MP method.
Energies 14 07671 g002
Figure 3. TEM images of the samples: (a,b) raw biochar; (c,d) biochar activated with 75 wt.% KOH.
Energies 14 07671 g003
Figure 4. The CO2 adsorption isotherms at 298 K of the biochar as raw material and the 75 wt.% KOH-activated biochar.
Energies 14 07671 g004
Figure 5. The micropore size distribution determined from CO2 adsorption isotherms by using the GCMC method.
Energies 14 07671 g005
Figure 6. The solid 13C-NMR of the biochar (starting material) and the KOH 75 wt.% activated sample.
Energies 14 07671 g006
Figure 7. CV graphs of the samples.
Energies 14 07671 g007
Figure 8. The capacitance values of the samples at 1 mV s−1. Capacitance per gram dependence on (a) KOH content, (b) surface area, and (c) capacitance per area dependence on surface area.
Energies 14 07671 g008
Figure 9. Charge–discharge data of the samples. At current density of (a) 10 mA g−1, (b) 100 mA g−1 and (c) 1000 mA g−1.
Energies 14 07671 g009
Figure 10. The capacitance values calculated from the data of charge-discharge measurements.
Energies 14 07671 g010
Table 1. Percentage of elements in pine tree biochar produced by flame-curtain pyrolysis estimated from CHN measurement.
SampleNo. 1No. 2No. 3Average
C/wt.%77.9277.9378.0577.97
H/wt.%2.682.62.542.61
N/wt.%0.890.720.830.81
residue/wt.%5.995.745.645.79
others/wt.%12.5213.0112.9412.82
Table 2. Percentage of elements in pine tree biochar produced by flame-curtain pyrolysis estimated from XPS measurement.
No. 4No. 5Average
C/wt.%84.6484.2684.45
O/wt.%12.2312.1812.21
Ca/wt.%1.461.931.70
Na/wt.%1.671.631.65
Table 3. Percentage of elements in pine tree biochar estimated from XRF measurement (C is removed from the estimation).
Concentration/wt.%
Ca74.51
Mg6.71
K4.87
Na4.11
Si2.75
Fe1.94
P1.85
Cl1.70
S1.56
Table 4. Percentage of elements in KOH-activated samples.
SampleC
/wt.%
H
/wt.%
N
/wt.%
Residue
/wt.%
Others
/wt.%
raw biochar77.972.610.815.7912.82
0 wt.%83.651.150.737.178.03
50 wt.%77.001.10.756.5715.33
66.7 wt.%68.701.410.417.2722.21
75 wt.%77.561.160.595.4115.87
80 wt.%72.141.230.325.9720.34
85.7 wt.%81.110.890.197.5810.42
Table 5. Comparison of activated biochar developed in this study to previously reported materials (nr a: not reported).
Material NameFeedstockPreparation ConditionsElectrolyteSurface AreaCapacitance (F g−1)Scan Rate (mV s−1)Number of Electrodes in CellReference
KOH-activated miscanthus biocharMiscanthus plantPyrolysis (700 °C), KOH activation (900 °C—1 h)1 M Et4NBF43024116.9 10 nr[53]
Carbon nitride Melamine (for carbon nitride)Annealing (450 °C—4 h), heating (550 °C—2 h)6 Μ ΚOHnr a131.653[54]
Mesoporous carbon spheresSodium carboxymethyl
cellulose
Carbonization (800 °C—4 h)6 M KOH320231.45 3[54]
AC-0600Bamboo cellulose fiberCarbonization (600 °C), NaOH activation (720 °C)1 M Et4NBF4 in propylene carbonate236643 From charge–dischargenr[55]
NBKBCBamboo powderPyrolysis (750 °C for 1 h) Impregnation with KOH
Second pyrolysis (750 °C for 1 h)
Doping with N and B
1 M KOH171.5281From charge–discharge3[56]
NBKBCBamboo powderPyrolysis (750 °C for 1 h) Impregnation with KOH
Second pyrolysis (750 °C for 1 h)
Doping with N and B
1 M H2SO4171.5318From charge–discharge 3[56]
SW-2.5 NPolysaccharidesPyrolysis (600 °C—1 h) Impregnation, NaOH activation (720 °C—1 h)Et4NBF4/propylene carbonate2294.346.1From charge–discharge2[57]
IR1-C36 (tea)Pine coneZnCl2 activation (500 °C—2 h) Second activation (800 °C—36 h)1 M TEABF4/acetonitrile200787.110 2[58]
CDHC-220Microcrystalline celluloseHydrothermal carbonization (220 °C—4 h)
Pyrolysis (1050 °C—3 h), H2O2 oxidation (200 °C—8 h)
1 M TEABF4/acetonitrile9647352[59]
PCN1-800Sulfonated pitchKOH activation (800 °C—1 h) Annealing (800 °C) Pure EMIMBF42429160.4202[60]
Activated biocharPine tree residuesFlame-curtain pyrolysis (600 °C—1 h), KOH activation (800 °C—1 h)1 M H2SO43014200.613This study
Publisher’s Note: MDPI stays neutral with regard to jurisdictional claims in published maps and institutional affiliations.

