1. Introduction
The development of intelligent electricity grids (Smart Grids) brings new challenges to reliability and safety; therefore, the presence of faults in various components in Smart Grids is a critical issue. Furthermore, in the same component, the faults can be of different types and prompt diagnostics and maintenance actions need to be taken.
In the scientific literature, different methods for diagnosing faults and for the maintenance of the various components present in the smart grids are described. The applications of smart meter data, based on machine learning techniques for the processing, prediction, and monitoring of the distribution network, are described in [
1]. To detect substation faults for timely repair, a fault detection method in switching process, based on the time-series model, is proposed in [
2]. Different techniques are used to predict and diagnose the faults of power transformers [
3,
4]. In particular, a novel sensor platform, based on software defined networking, is proposed to monitor the electrical parameters and eliminate any future fails in distribution transformers [
3], while a data-driven method, which uses a combination of principal component analysis, particle swarm optimization, and support vector machines to enable a better fault diagnosis of power transmission and conversion transformers, is proposed and investigated in [
4]. Elsayed et al. [
5] proposed a battery management and diagnostic system for Smart Grid, based on calculation individual state of charge levels and C-rates, while a consortium blockchain technology is used in [
6] to diagnose smart terminal and grid protection devices. The data mining for predictive maintenance in an industrial big data environment is studied to predict the remaining life of key components of machining equipment by analyzing multisource heterogeneous data [
7]. A predictive maintenance approach for sectionalizing switches, circuit breakers, and current transformers in bays of electric transmission and distribution substations is proposed in [
8]. In particular, a relationship similar to the signal-to-noise ratio is used to detect degradation in electrical contacts, based on the spectral analysis of the load current that is flowing through the bay’s components. In [
9], the deep learning model in the framework of the internet of things is used to predict and diagnose the faults of wind power generation. The most meaningful techniques in the field of instrument fault detection and isolation are characterized on physical redundancy and analytical redundancy-based approaches [
10,
11].
Primarily, there are two categories of methods: (i) model-based methods in which the data coming from the real components are analyzed and compared with the outputs of the models of the healthy components and (ii) data-based methods in which the data coming from the real components are compared with the stored data measured on the healthy real physical components [
12]. Various fault detection and diagnosis approaches are investigated based on threshold methods [
13], fuzzy logic methods [
14], domain transformation methods (Fourier transform, wavelet transform) [
15], classification methods (decision tree, feature extraction, support vector machine classifier, neural network classifier) [
16], and state estimation methods [
17].
To guarantee the quality of the service and reduce downtime, maintenance is typically carried out with defined times (for example every six months) or following breakdowns, using redundant systems or with stringent intervention times. However, the physical redundancy, utilized in different areas [
18], does not represent the optimal solution, because a fault on a component could be generally due to the device aging or to particular climatic and electromagnetic operating conditions also suffered by the redundant device. It is preferable to develop suitable Fault Detection and Isolation (FDI) schemes for early identifying incipient faults, thus enabling a policy of predictive maintenance which allows reducing the related costs and downtime for the process under consideration. In addition, it is necessary to consider a further issue regarding assuring the reliability of measurement data used for the diagnosis, because even the sensors and the instruments can be interested by faults, aging, and changing of the input/output characteristic, thus altering both diagnosis results and maintenance timelines. Consequently, to have a reliable FDI of a system, it is needed to also implement an Instrument Fault Detection and Isolation (IFDI) scheme that is able to identify faults occurring on sensors and devices used to monitor the system itself.
So, if on one hand, predictive maintenance is very important to guarantee the quality of the services and to allow optimized and low-cost maintenance schemes, on the other hand, the application of FDI and IFDI solutions is typically based on multisource sensors that can generate large amounts of data. This aspect, although we are in the era of industry 4.0 and Big Data, can become a problem, as these huge amounts of data, necessary for diagnosis, can overload the communication network and the system (communication storage and processing). Therefore, it is necessary to have architectures that allow reducing and managing this information at the cloud level [
19].
The novelty of this article is focused on the proposal of an FDI and IFDI diagnostic scheme that allows solving the above-mentioned problems. In particular, the proposal is based on two main approaches: (i) the use of a pyramidal architecture (structured with local measurement systems, diagnostic systems, and supervisors), that improves the data management at different architectures levels, and (ii) a suitable choice of synthetic parameters allowing to perform FDI and IFDI diagnostics using a reduced quantity of information to be managed.
The proposed architecture also aims to create a structure for advanced distributed diagnostics useful for a global predictive maintenance in the smart grid. Just for instance, the synthetic diagnosis parameters extracted in one point of the smart grid (e.g., a substation) can be also used as a diagnostic input for the components present in other points of the grid.
In the architectural proposal of the distributed diagnostic system, the attention was focused on the AC/DC converter typically present in the MV/LV substations. The synthetic diagnostic parameters proposed in this paper are consequently referring to the chosen application (AC/DC converter diagnosis), but it can be easily extended to the other components present in the substations; obviously, in this case, some of the synthetic diagnosis parameters could change.
Finally, the proposed solution can be structured as (i) an add-on device to be installed on the component on which the FDI has to be pursued (in this case, all the sensors, data acquisitions, and processing of the acquired data to evaluate the synthetic parameters and send them to the hierarchically superior diagnostic devices are on board to the device); (ii) a device that can use sensors, data acquisition systems, and intelligence already present in modern smart grid substations (obviously, in this case, it may be necessary to carry out a customization process of the devices and systems in the substations in order to apply also the FDI and IFDI schemes).
After a brief recall on the FDI and IFDI schemes reported in
Section 2, the proposed system is described in
Section 3 detailing both the architecture and the hardware/software solutions. In
Section 4, the proposed case study on the FDI–IFDI of AC/DC converters is reported. After a brief introduction about AC/CD converters systems and faults (
Section 4.1), an experimental analysis was presented to analyze the range of variations of the quantities of interest (
Section 4.2). Then, the proposed FDI/IFDI scheme for AC/DC converter is described (
Section 4.3) and experimentally validated emulating several faults on both the AC and DC side of the converter (
Section 4.4). A final discussion is reported in
Section 5.
2. Brief Recall on FDI and IFDI Schemes
The growing need to improve safety and reliability in industrial processes is leading to increasingly widespread use of automatic measurement and control systems with self-diagnosis capabilities, i.e., equipped with FDI features. In this framework, the IFDI plays a fundamental role as well. Indeed, the IFDI includes all those hardware and software solutions for the detection and diagnostics of faults that affect the measurement instrumentation used for monitoring a system. These systems, in addition to preserving the safety of operators and systems, also allow detecting the degradation of the adopted to monitor the system of interest, thus allowing making a reliable FDI and reducing the frequency of normal maintenance, with a consequent reduction in costs.
The first essential step for the fault diagnosis is the detection of any fault (fault detection). To be able to detect a fault, the following conditions have to be satisfied:
A good knowledge of the system to be monitored;
The possibility of generating residuals, i.e., functions whose value increases when a fault occurs;
The possibility of determining, in the experimental tuning phase, the thresholds, after which the residuals become a symptom of failures.
A form of redundancy is indispensable to generate the residuals. To this aim, two approaches can be followed: physical and analytical. The former consists of a twin system that operates in parallel with the one under monitoring. The latter consists of a model of the system in question that works in parallel with the one under monitoring. In this last case, there are different techniques for determining an equivalent model of the system in question.
Physical redundancy has higher costs and bulk compared to analytical redundancy as it requires the presence of a twin system. However, the schemes based on physical redundancy are generally easy to implement and ensure high sensitivity in detecting faults. As regards analytical redundancy, on the other hand, it is based on the knowledge of several models of the system under monitoring:
Nominal model: is the model of the system in the absence of faults;
Failure models: these are the models of the system in the presence of failures;
Observed model: is the model evaluated on the basis of the measured values;
The residuals are obtained by comparing the expected values, obtained from the nominal model, and the measured values, obtained from the observed model. In case of failure, the latter is isolated by comparing the values of the observed model with those of the different failure models. In practical applications, the most common approaches for generating residuals are as follows:
Monitoring of a set of measured quantities, when the model of the system consists in the knowledge of the values that said quantities must assume in fault-free conditions (absence of faults);
Comparison between the measured outputs of the system under examination and the estimated outputs from its nominal model, when the real system and its nominal model receive the same input;
Comparison between some characteristic parameters of the real system and those of the corresponding nominal model.
Once the residuals have been defined, it is necessary to set the thresholds against which the residues are to be compared. These thresholds are determined in the experimental phase and must be greater than the residuals in fault-free conditions and lower than the residuals when a fault occurs.
Once the value of a certain number of residuals exceeds the corresponding thresholds, thus highlighting the occurrence of a fault, it is necessary to locate the fault (fault isolation). Only a careful analysis of residuals exceeding the corresponding thresholds can lead to the isolation of the fault.
Since the development of the model of a system is based on the processing of the input and output signals of the system itself, in the case of sensors (or more in general, instruments), the generation of a model would require knowledge of the input signal to the sensor (by measuring). However, since the only means to know the input of a sensor is the sensor itself, in the case of diagnosis on measurement instrumentation (IFDI), it is not possible to estimate both the observed model and the output of the nominal model. Therefore, in the case of diagnosis on the measuring instrumentation, it is suitable to use, rather than mathematical models schematizing the functioning of the measuring instrument, the relationships existing between the different measured quantities. In this way, the analytical redundancy relations between the measured quantities in the event of fault-free become the nominal model of the measurement instrumentation, the values assumed by these relations in the event of failures constitute the failure models, while the values evaluated based on data acquired in real-time constitute the observed model. The detection of the fault is made by continuously verifying the consistency of the redundancy relationships, using the dynamically measured data (observed model).
The IFDI represents, in the context of fault detection and isolation, a particular case in which faults on the measurement instrumentation are detected and localized. The approach based on physical redundancy requires the use of several sensors greater than the minimum required by the application, by a factor of two or three (or even greater) depending on the diagnostic capabilities required. It is easy to understand that the use of two sensors that measure the same quantity allows only the fault detection phase, while to identify the faulty sensor with an acceptable probability, greater physical redundancy is required. The use of more than two twin sensors also allows the creation of fault-tolerant measurement stations, in which a fault on a sensor does not affect the reliability of the measurements, being able to replace the measurement of the faulty sensor with that of one of the other fault-free sensors.
As regards the approach based on analytical redundancy, it allows avoiding replicating twin sensors and can be considered more robust concerning the physical one whenever the fault on the sensors is due to extreme operative conditions or to the presence of external damaging disturbances. Indeed, in such cases, the twin sensors could fail for the same event, thus making a reliable diagnosis impossible.
As said before, the analytical redundancy is based on the verification of the consistency of the analytical relationships existing between the quantities measured by the different sensors, and in the case of diagnosis on measuring instruments, it is not possible to use a nominal model of the sensor, since the latter’s input is unknown, and the previously mentioned approaches 2 and 3 for the generation of residuals are not directly applicable. Generally, as for IFDI, the techniques based on analytical redundancy reported in
Figure 1 can be followed [
10,
11].
Whenever a good knowledge of the system is available, the most effective approach is based on the use of parity relations and analytical models because they do not require facing the issues arising by training, validating, and testing, which is typical of the design and tuning phases of artificial intelligence-based techniques [
20,
21,
22,
23].
In addition, they allow achieving low computational burden with a consequent improvement of the diagnosis promptness and allow enabling the compliance with hard real-time constraints even if the FDI and IFDI schemes have to run on low powerful microcontrollers [
24,
25].
3. The Proposed System
As previously mentioned, the proposed system has been developed with the aim of providing predictive maintenance of AC/DC converters employed in the MV/LV substations. Considering this particular framework, the developed system has been designed in order to be scalable and easily upgradable.
A simplified block diagram of the proposed system, which involves only one diagnostic system, is reported in
Figure 2. It is composed of three main components: (a) a measurement system for the acquisition of the quantities that are fundamental for monitoring AC/DC converters; (b) a diagnostic system that implements the schemes for the identification of faults on AC/DC converters (FDI) and on the sensors and measuring devices (IFDI); and (c) a supervisor unit with suitable rules for the predictive maintenance of the above-mentioned converters. These three units are connected among them through an Ethernet-based local area network (LAN). Each measurement system is located in proximity of the AC/DC converter. The diagnostic system, from a hierarchical point of view, is located to an upper layer with respect to the measurement unit, and it can receive measurement data from more than one measurement system. Consequently, it can implement FDI and IFDI schemes for identifying incipient faults in several AC/DC converters. The supervisor receives data from many diagnostic systems; as a consequence, it represents the highest layer of the proposed architecture.
It is worth noting that this general architecture has been designed so that the supervisor receives data pre-processed by the diagnostic systems and, in turn, diagnostic systems receive data pre-processed by each measurement system. This implementation should allow obtaining the following benefits for the entire system:
Data operations that need a big computational burden are carried out by the peripheral nodes of this network. As a consequence, the computational burden of the upper layers’ nodes will not increase very much when the number of peripheral nodes will increase. The system has only to manage more network connections.
Each node will send to its upper node only pre-processed data, reducing the amount of data to be transmitted on the network. This choice allows the improvement of network efficiency and reliability. Furthermore, it allows to choose cost-effective hardware with limited computing resources for building these nodes.
The decentralized data processing allows obtaining better scalability of the proposed architecture, especially when possible faults occur in a node that cause the need to replace it.
3.1. Measurement System
As the measurement system regards, a simplified sketch is reported in
Figure 3. As previously said, it is installed in the proximity of the AC/DC converter to be monitored. It is designed in order to sense and acquire the input AC voltage (V
AC) and current (I
AC) of the AC/DC converter and its output DC voltage (V
DC) and current (I
DC).
In particular, an AC voltage probe has been designed for the acquisition of VAC. It has been realized with a ZMPT101B Active Single Phase Voltage Transformer Module. It has an input AC voltage range up to 250 V, and it is equipped with an isolation transformer. The probe’s output is a voltage signal that is proportional to the AC input voltage.
As I
AC and I
DC regard, they are sensed with an ACS712 [
26] Hall-effect-based linear current sensor. The output of this sensor is a voltage signal proportional to the input current.
A DC voltage probe has been connected to the AC/DC converter output. It is a suitably designed voltage divider circuit.
The output of each sensor and probe has been connected to a data acquisition (DAQ) board, namely a National Instruments™ NI USB-6001 [
27]. It is a low-cost, multifunction DAQ device. It offers 8 analog 14-Bit input channels with a maximum sampling rate equal to 20 kS/s.
The DAQ board is connected through a USB cable with an industrial personal computer (PC) having the following characteristics: CPU Intel Core i5-4200U processor up to 2.60 GHz, 4 GB RAM, 256 GB SSD hard disk drive, Ethernet network interface card, and Windows 10 operating system.
A picture of the electronic board including the above-mentioned components is reported in
Figure 4.
The PC automatically runs at startup a suitably designed LabVIEWTM program, which sets the DAQ board sampling rate to 2.5 kS/s, retrieves data samples from the DAQ board, and calculates the following parameters:
The root mean square value of the input AC voltage (Vin_rms).
The root mean square value of the input AC current (Iin_rms).
The peak value of the input AC voltage (Vin_pk).
The peak value of the input AC current (Iin_pk).
The frequency of the input AC voltage (f_in).
RTHD_I defined as follows:
where
Iin,i and
Iout,i are the rms value of the
i-th harmonic of the AC current and DC current, respectively.
where
Vin,i and
Vout,i are the rms value of the
i-th harmonic of the AC voltage and DC voltage, respectively.
The mean value of the output voltage (Vout).
The mean value of the output current (Iout).
The ripple of the output voltage (RVout).
The ripple of the output current (RIout).
The main frequency component of the ripple of the output voltage (f_out).
Furthermore, this program updates the value of each parameter every 2 s and periodically transmits them to the Diagnostic System.
A picture of the front panel of the designed LabVIEW program is reported in
Figure 5.
Each sensor and probe, adopted in the realized measurement stations, has been preliminary tested and metrologically characterized.
3.2. Diagnostic System
The main aim of this system is to identify faults occurring either on an AC/DC converter or on the measurement system. To reach this goal, it applies IFDI and FDI schemes suitably designed for this application. They will be described in the next section.
The above-mentioned IFDI and FDI schemes are carried out by a LabVIEW program whose front panel is shown in
Figure 6. It runs on an industrial personal computer (PC) having the following characteristics: CPU Intel Core i5-4200U processor up to 2.60 GHz, 4 GB RAM, 256 GB SSD hard disk drive, Ethernet network interface card, and Windows 10 operating system.
In particular, it receives data from the measurement systems connected to it and processes them to identify the following faults of the measurement system and related to the AC/DC converter:
DC Voltage sensor fault.
DC current sensor fault or loads issues.
AC voltage sensor fault.
AC current sensor fault.
A generic fault of the sensing section.
AC/DC converter fault.
AC/DC converter fault or loads issues.
All these failures are indicated by a round LED indicator on the LabVIEW program front panel.
Furthermore, for each measurement system connected to it, it provides a log containing a count of the AC overvoltage anomalies.
Data processed by the diagnostic system, containing the detected faults and anomalies are periodically sent to the supervisor.
3.3. Supervisor
As previously mentioned, the goal of the supervisor is the implementation of rules for the predictive maintenance of the AC/DC converter. A suitable LabVIEW program has been suitably designed to allow this task.
Figure 7 reports a picture of the front panel of the supervisor LabVIEW program.
In particular, it has been customized in order to supervise up to eight measurement systems and, per each of them, it can show if a fault is occurring: sensing system failure, AC/DC converter failure, or if it is evolving to failure.
Furthermore, per each measurement station it plots five quantities of interest: VDC, VDC ripple, IDC ripple, RTHD_I, and RTHD_V.
If a failure of the sensing system occurs, it is possible to check which sensor is under failure, analyzing the Boolean-led indicators reported per each measurement station.
4. The Case Study and Results
4.1. Brief Recalls about AC/DC Converter Systems and Faults
As for the case study considered in this paper, a typical AC/DC converter employed for powering electronic systems installed in the MV/LV substations has been considered, whose main nominal features are reported in
Table 1 [
28].
In particular, AC/DC converters can be considered as electronic devices able to feed DC loads converting the AC electrical energy taken by the electrical network. To this aim, with reference to a typical operation of an AC/DC converter, three main sections can be highlighted: (i) the AC electrical power network, (ii) the electronic device itself, and (iii) the DC load. This scheme is reported in the simplified block diagram of
Figure 8 that sketches both the ideal operating and the main functional parts of a generic converter.
Sections (i) and (iii) are external to the AC/DC converter, but they are directly connected to it; consequently, their deviations from nominal values influence the behavior of the AC/DC converter itself and can concur to accelerate the aging and malfunctioning of the components present in the electronic power device. As an example, on the AC main (i.e., section (i)), dangerous phenomena for the AC/DC converter can be considered as power surges, high-voltage spikes and sags, transients, frequency variations, and electrical line noise, to cite a few. As for the section (iii), dangerous operating conditions are related to overloading and switching characteristics of the load that might influence the operation of the AC/DC converter.
The above-mentioned phenomena, together with the aging of the electronic components internal to the device, can worsen the performance and finally can produce faults in all the sections considered in
Figure 8, namely the input noise filter, the input and the output smoothing filters, the DC/DC converter, and the control circuit, which are contained in section (ii).
In a more detail, the presence of power surges and high-voltage spikes forces all the above-mentioned functional parts to operate in an unwanted range. In the absence of electrostatic traps or voltage suppressors, these events frequently cause the breakdown of the AC/DC converter with consequent output faults. Moreover, electrostatic traps may lead to broken or premature aging of capacitors, transistors, and diodes that are in the block diagram of
Figure 8 (section (ii)). The effect of this aging can be highlighted by looking at the increasing of the ripple on the voltage (
RVout) and current DC (
RIout) output.
Moreover, considering Power Quality phenomena as dips, sags, swells, transients, and frequency deviations, generally, they do not directly cause instantaneous brokenness in the AC/DC converter but increase the premature aging of the above-mentioned components. In addition, in this case, the DC voltage and current signals and the AC current signal may show deviation from the expected behaviors.
As a consequence, these considerations led to identifying the set of parameters to be monitored and the fault symptoms, which should be considered for identifying either a fault occurred on the AC/DC converter or an operating condition of the AC/DC converter that could lead to a possible fault. In particular, based on the above considerations, the set of parameters of interest that we have considered are Vout, Iout, f_out, RVout, and RIout (output current ripple).
After such quantities of interest and fault symptoms are identified, the FDI scheme can be designed for generating the residuals, i.e., functions whose values overcome suitable thresholds in case of faults. To these aims, a preliminary experimental analysis has to be performed for quantifying the variability ranges of the parameters of interest (i.e., the “nominal model” for the input/output quantities of the AC/DC converter) when no faults have occurred. Then, the deviations from nominal variability ranges are adopted for highlighting the occurrence of a fault on the AC/DC converter.
4.2. Preliminary Experimental Analysis
To analyze the range of variation of the quantities of interest, a preliminary experimental analysis has been carried out. These quantities have been measured by using the experimental setup reported in
Figure 9 in terms of block diagram (a) and picture (b).
In particular, besides the measurement instrumentation and probes needed for acquiring the quantities of interest on both AC and DC sides, the experimental setup includes a programmable power source and electronic load, which are used for emulating several operating conditions of the AC/DC converter, by varying the AC source and the kind of load according to the technical standard series EN 61204, which describes the test methods for low-voltage power supply devices (including switching types) providing d.c. output(s) up to 200 V d.c. at a power level up to 30 kW, operating from a.c. or d.c. source voltages of up to 600 V. As for the electronic load, a ZSAC C4244 has been used and was remotely controlled through a RS-232 interface.
As for the AC and DC voltage probes as well as the AC and DC current, the sensors are the same as those used for the prototype development in order to keep the same features and calibration data during all experimental activity.
As for the digital scope, it is a LeCroyTM Waverunner LT264 (350 MHz-bandwidth, 1 GS/s-sampling frequency) remotely controlled by means of a IEEE-488 interface bus, whereas the AC power source is a Pacific Smart source 305AMX.
In particular, as for the AC source, the rms value will be varied inside the AC/DC converter nominal range for monitoring its overall behavior versus this quantity of influence. In the same way, different constant loads (which led to different output DC current values) and switching loads (considering suitable time profiles) will be considered in order to analyze several operating conditions of the AC/DC converter.
With reference to the development of the FDI scheme, these tests will allow identifying the AC/DC converter nominal model, which in turn provides the variation range of the quantities of interest in the absence of faults. To this aim, the test conditions described in
Table 2 have been considered for testing the AC/DC converter. For each test condition, 10 consecutive repetitions have been collected for analyzing the mean values and the experimental standard deviations of the quantities of interest.
As an example,
Figure 10 reports the time evolutions of the measured quantities on both sides (AC and DC) for the test condition #1.
Starting from the collected data, the quantities of interest for the FDI have been analyzed.
Table 3 provides the experienced ranges and standard deviations achieved during all the considered test conditions of
Table 2.
The values reported in
Table 3 have to be fused with values reported in
Table 1 for achieving the nominal model (to be considered in absence of a fault) of the AC/DC converter.
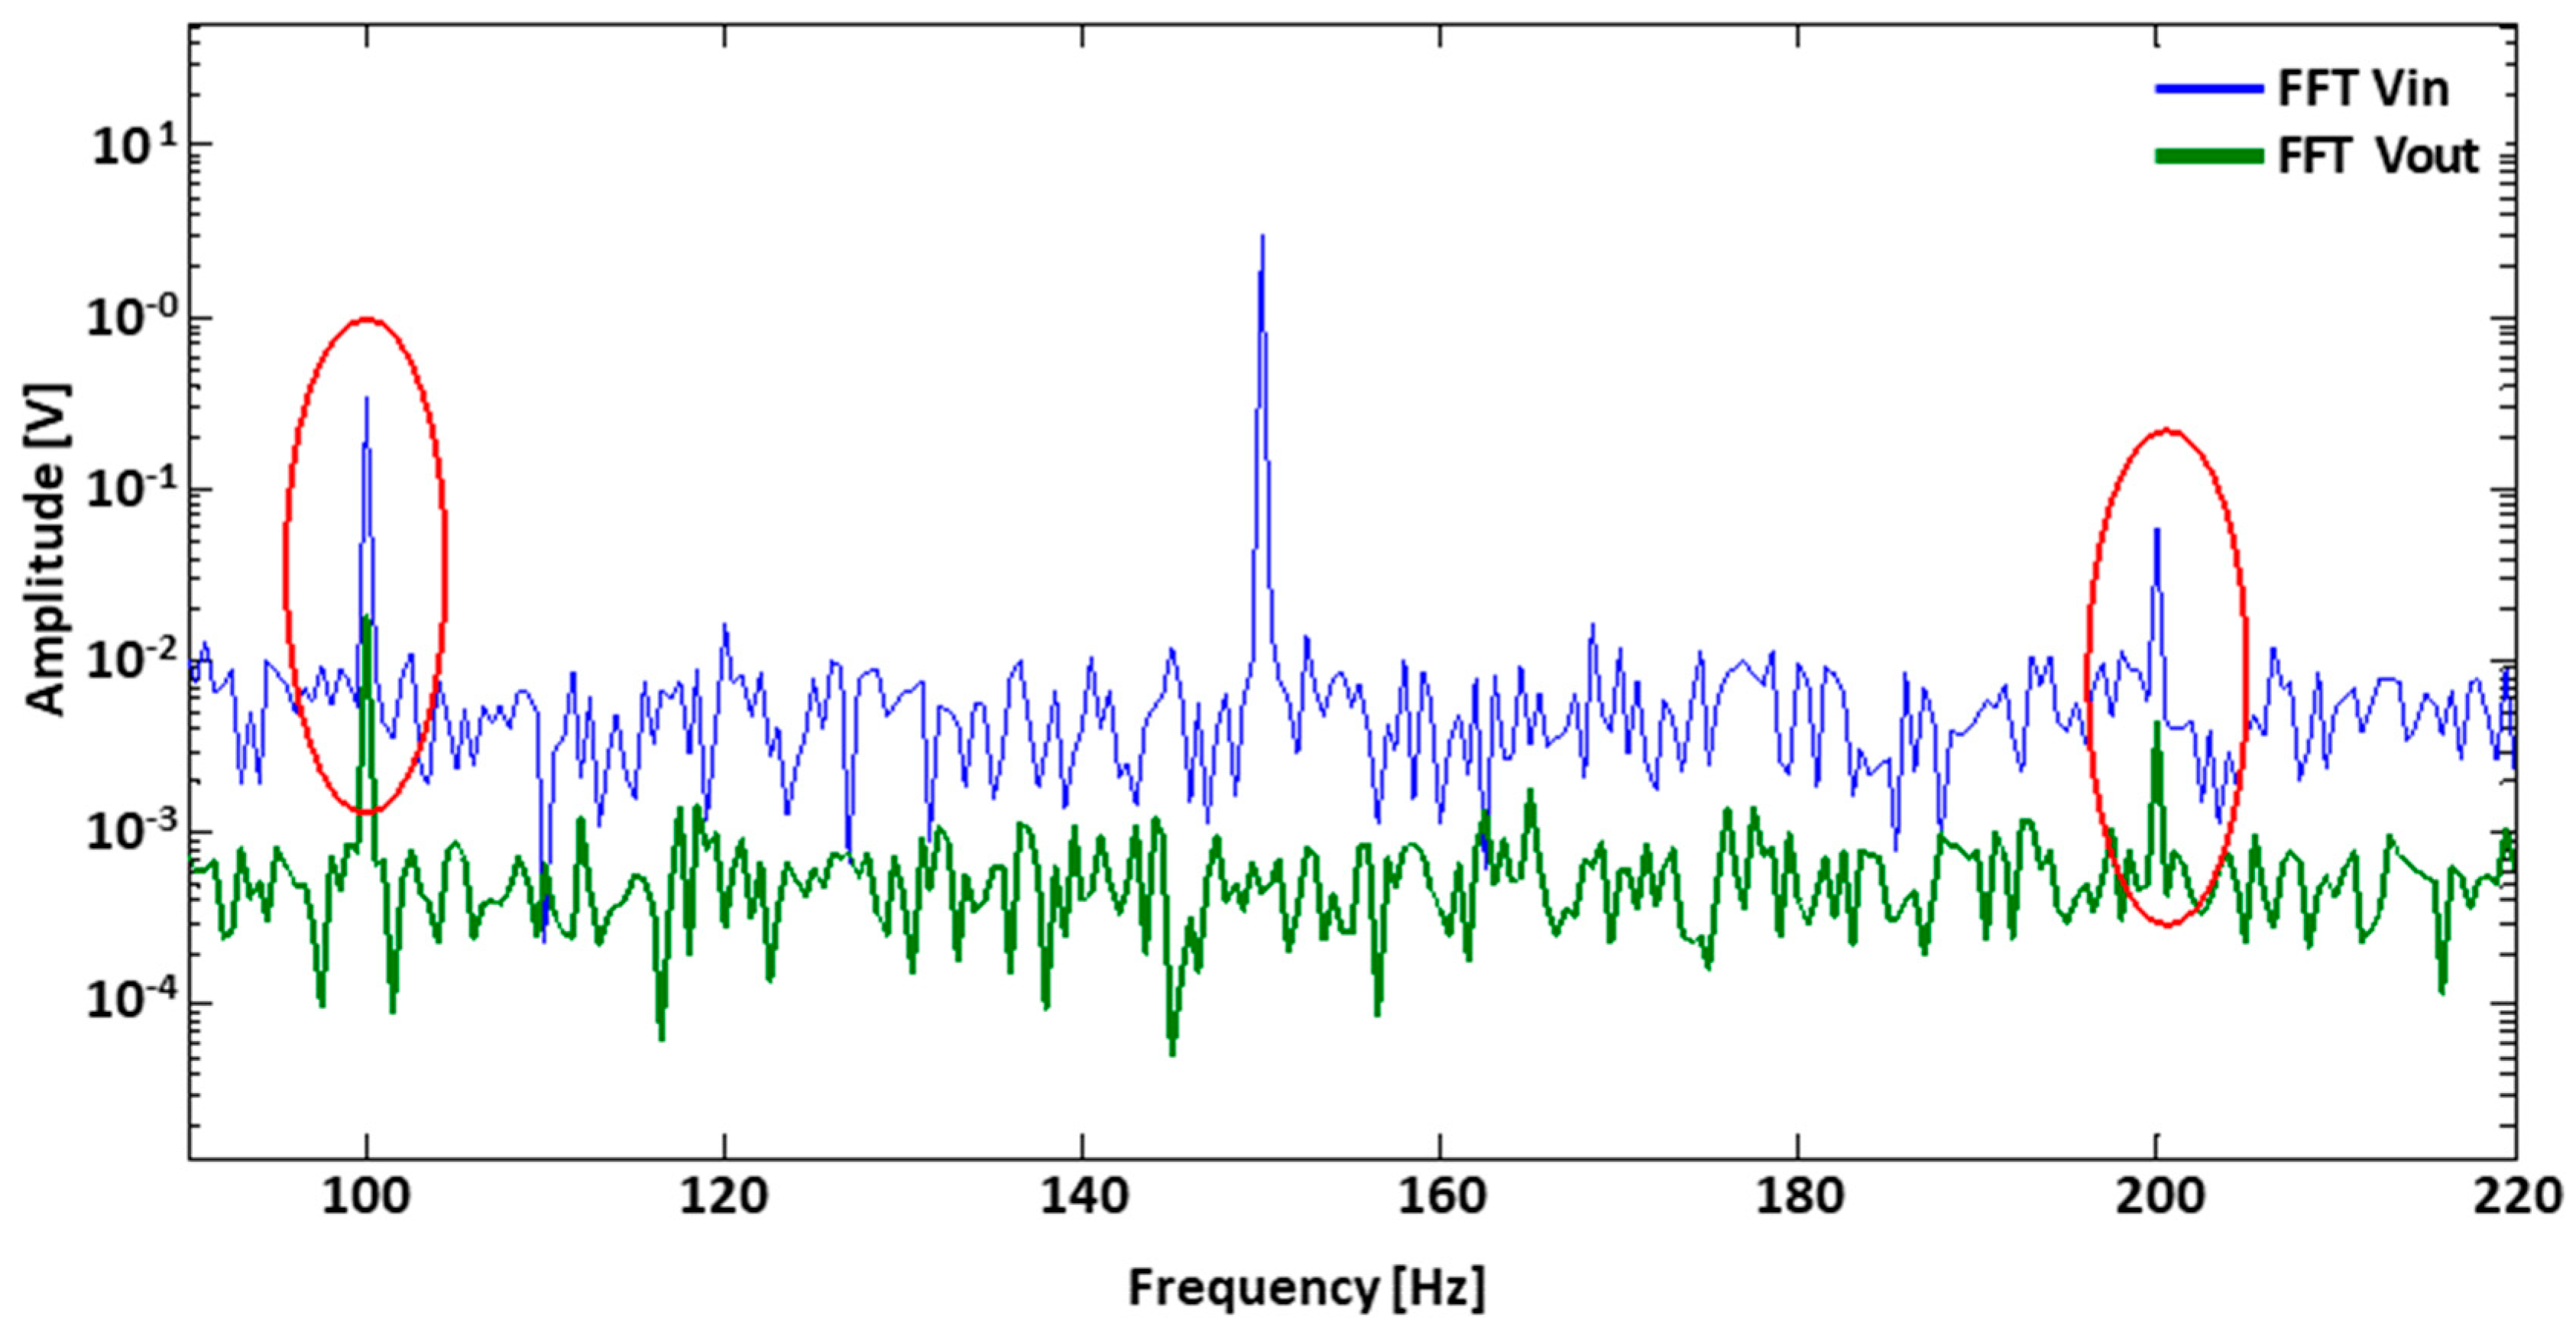
Moreover, further analysis has been carried out for observing behaviors of typical harmonic distortion indexes against the output current, as also shown in
Figure 11 and
Figure 12.
Therefore,
RTHD_I and
RTHD_V have been evaluated and reported in
Table 4 with the normalized standard deviations evaluated applying the following formulas:
4.3. The Proposed FDI/IFDI Scheme
As also recalled in
Section 2, when an FDI/IFDI scheme has to be set up, the quantities measured by the set of transducers are digitized and processed for calculating the residuals, which are software functions whose values in case of fault significantly differ from the values they assume in fault-free conditions [
10,
11,
18]. So, from the analysis of residuals, it is possible to identify the eventual presence of a fault on the system under evaluation. To warrant a reliable fault diagnosis, it should be assured that the quantities measured by the transducers be reliable. In other words, the fault diagnosis procedure should include a first processing section devoted to the Instrument Fault Detection and Isolation (IFDI) for providing information on the status (fault-free or faulty) of the transducers employed. Subsequently, the FDI procedure can run and provide reliable results.
Further general aspects of FDI deal with the tradeoff between sensitivity and promptness to detect faults. In most of the applications, the promptness has to be preserved for assuring the real-time management of a fault [
24,
29]. In such cases, the sensitivity to small or incipient faults is relatively low, and the faults detected and correctly isolated are the only ones causing clear symptoms (i.e., residuals that clearly overcome thresholds), whereas faults characterized by weak symptoms (i.e., incipient faults) become more difficult to detect or require longer observation time intervals to be recognized if the false alarms percentage has to be kept low. With reference to the incipient faults, they are generally difficult to identify, but they are crucial because they could alert the system manager for actuating a predictive maintenance of the system.
As for the FDI and IFDI, among the techniques available in the literature, an analytical rule-based approach has been adopted [
10,
11]. Then, as it is described in the following, the fault diagnosis is based on either relationships (analytical or soft) or inequalities between quantities of interest, which become inconsistent in case of faults.
Starting from the values reported in
Table 1,
Table 3, and
Table 4, the IFDI/FDI scheme is proposed by considering a rule-based approach, thus by defining some relationship representing the nominal operating of the AC/DC converter according to the values reported in
Table 1,
Table 3, and
Table 4. In particular, the following twelve relationships have been identified:
where:
- -
is the minimum value of
Vout according to the value reported in
Table 1;
- -
is the minimum value of
Vout according to the value reported in
Table 3;
- -
is the maximum value of
Vout according to the value reported in
Table 1;
- -
is the maximum value of
Vout according to the value reported in
Table 3;
- -
is the minimum value of
Iout according to the value reported in
Table 1;
- -
is the minimum value of
Iout according to the value reported in
Table 3;
- -
is the maximum value of
Iout according to the value reported in
Table 1;
- -
is the maximum value of
Iout according to the value reported in
Table 3;
- -
RVout%
MIN is the minimum value of
RVout% according to the value reported in
Table 3;
- -
RVout%
MAX is the maximum value of
RVout% according to the value reported in
Table 3;
- -
RIout%
MIN is the minimum value of
RIout% according to the value reported in
Table 3;
- -
RIout%
MAX is the maximum value of
RIout% according to the value reported in
Table 3;
- -
is the minimum value of
f_out according to the value reported in
Table 1;
- -
is the maximum value of
f_out according to the value reported in
Table 1;
- -
is the minimum RMS value of
Vin according to the value reported in
Table 1;
- -
is the minimum RMS value of
Iin according to the value reported in
Table 1;
- -
η is the efficiency of the AC/DC converter, which was equal to 90% for the considered device;
- -
g1(
Iout) and
g2(
Iout) are functional links that map the values of
RTHD_I and
RTHD_V according to the values reported in
Table 4.
As a consequence, based on both the nominal values (
Table 1) and the experimental analyses (
Table 3 and
Table 4), the threshold values reported in
Table 5 have been considered.
The continuous check of the consistency of all relationships allows identifying possible faults that could occur on the main components of the AC/DC converter or on the measurement systems involved for monitoring the system itself.
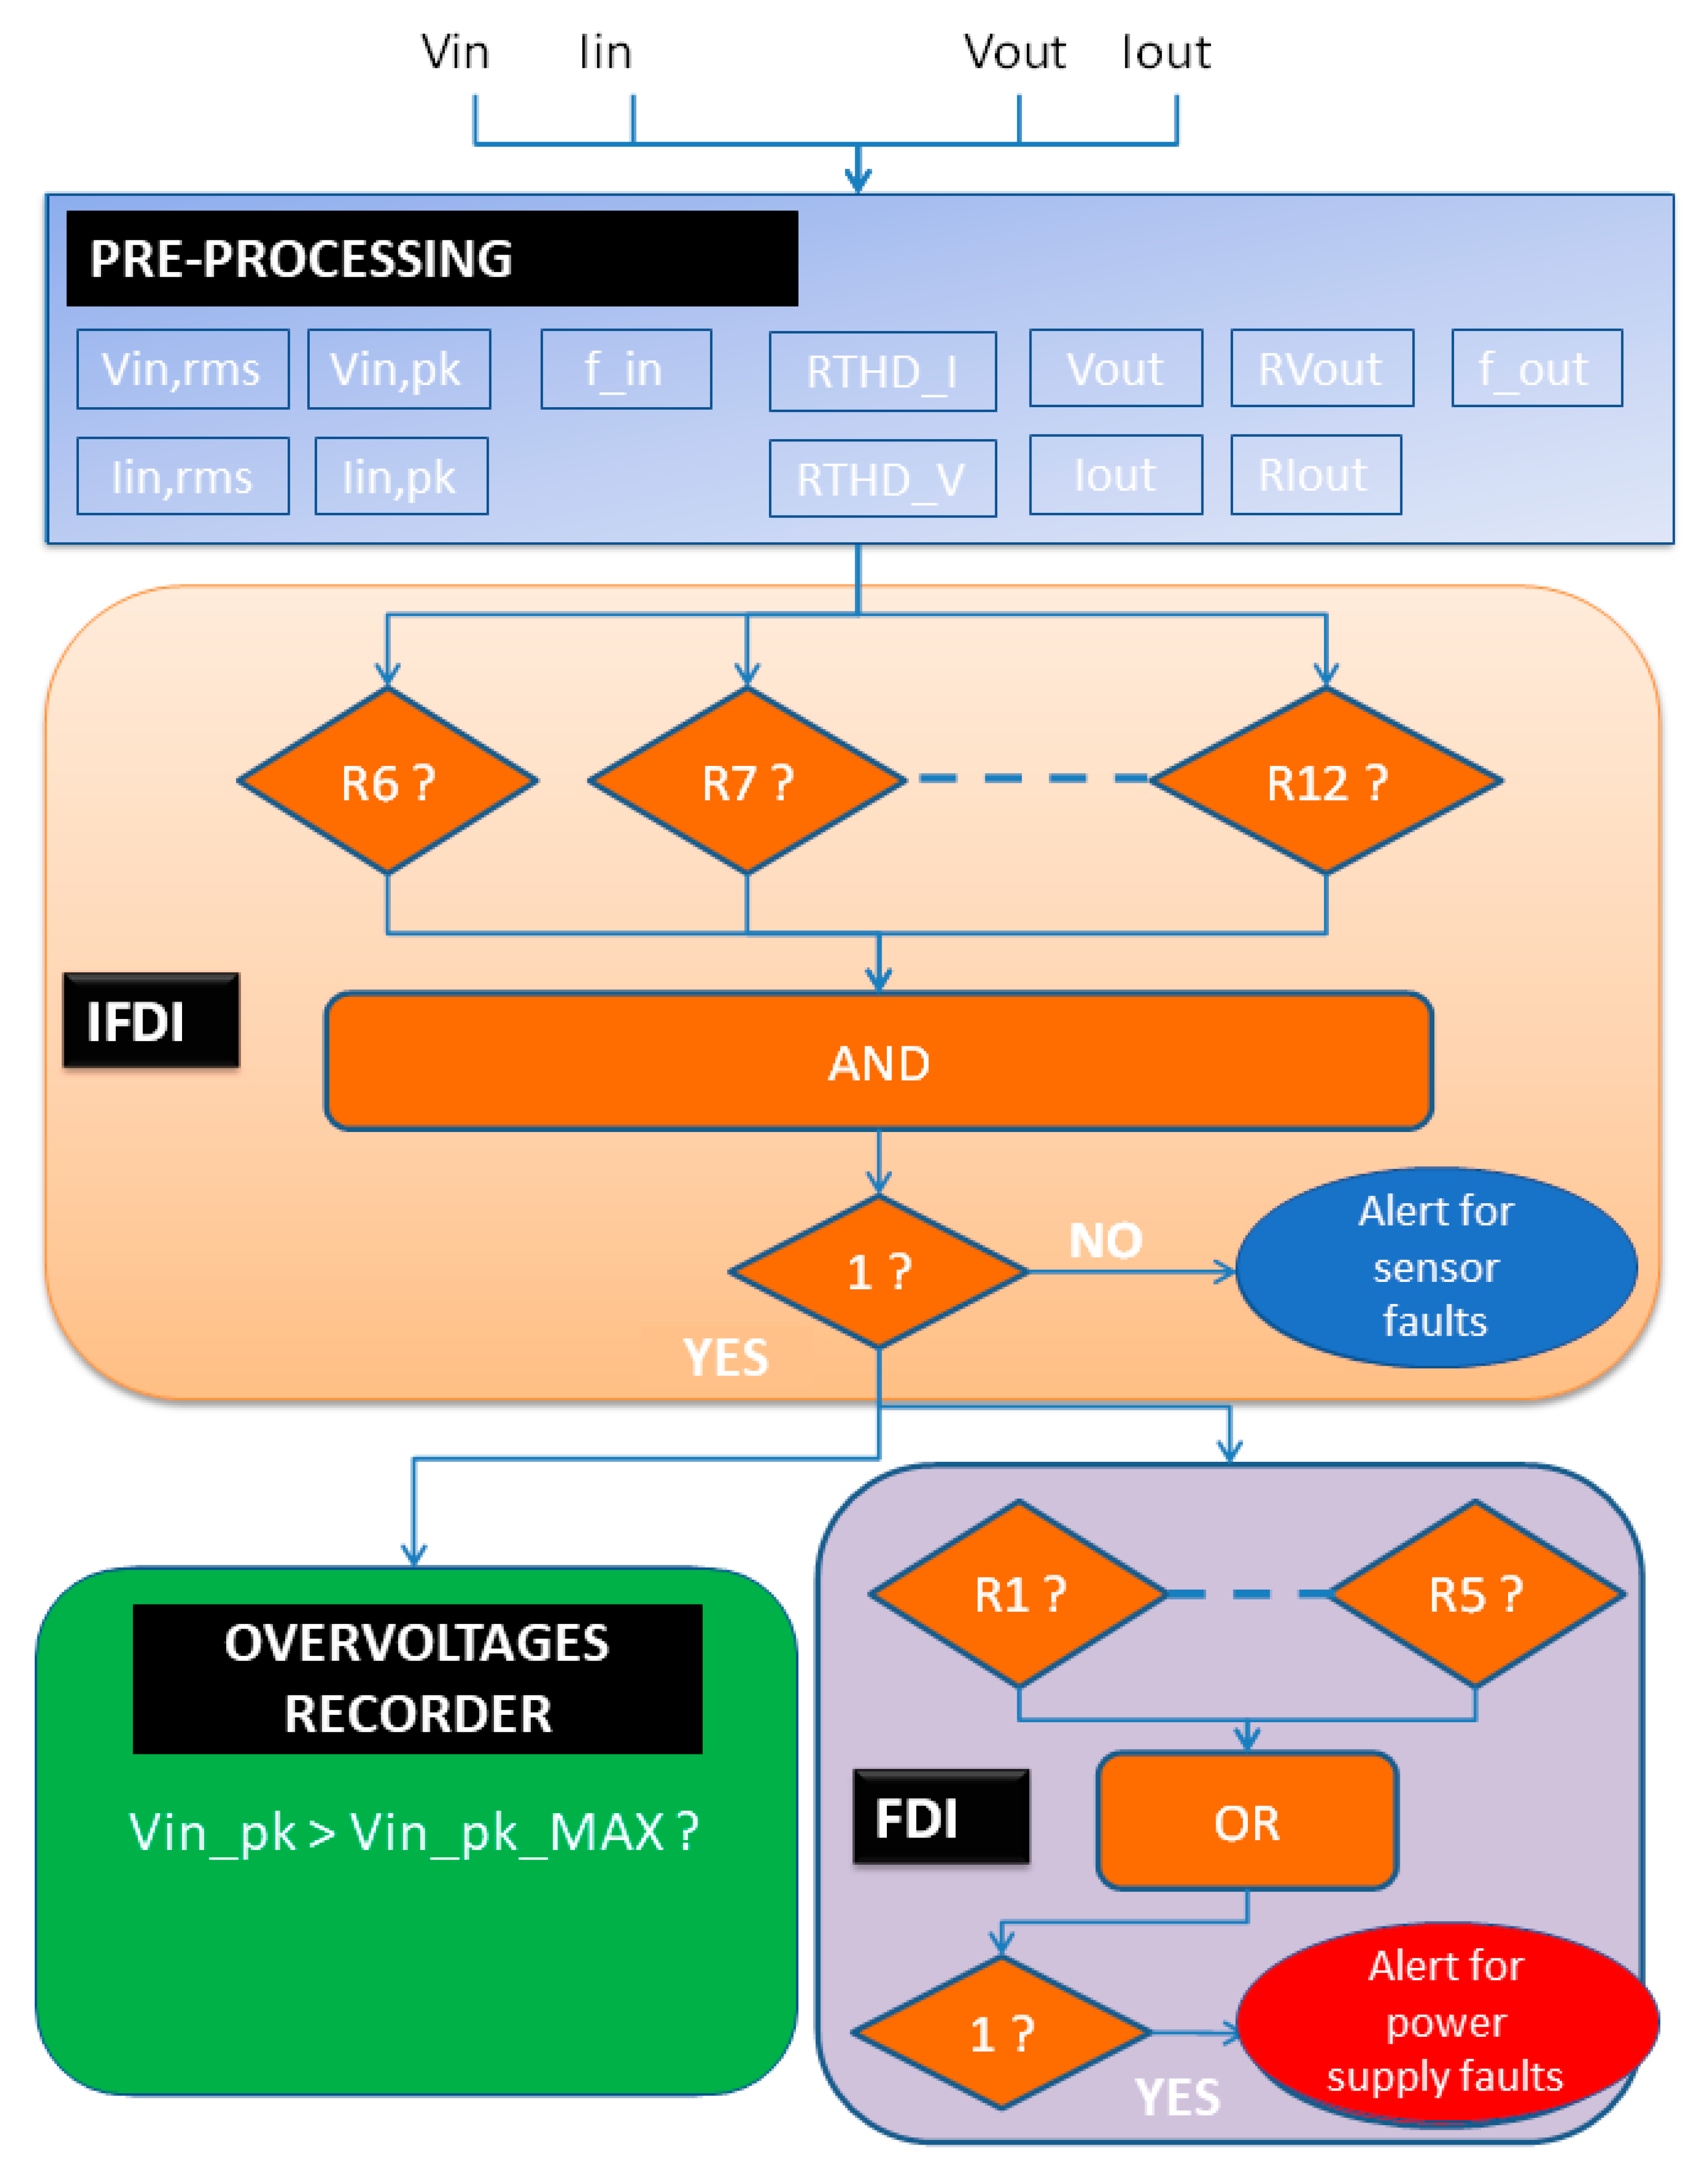
However, in order to record some transitory overvoltages that could occur on the AC side and that could speed up the aging of all components, a further value check has been identified as reported in the following:
where
Vin_pk is the peak value of the measured
Vin and
Vin_pk_MAX = 500 V. This last value has been selected according to the common rules and values of disturbance levels typical of the electromagnetic compatibility immunity tests [
30].
In this way, the whole diagnostic scheme is reported in
Figure 13.
4.4. Experimental Campaign
As for the performance analysis, several faults have been emulated on both the AC and DC side of the converter under controlled conditions.
To evaluate the FDI and IFDI capabilities, the following performance parameters were calculated:
Percentage of Correct Detection: percentage of the number of faults detected with respect to the total number of emulated faults;
Percentage of Missed Detection: percentage of the number of undetected faults out of the total number of emulated faults;
Percentage of Correct Isolation: percentage of the number of faults correctly isolated with respect to the total number of faults detected;
Percentage of Missed Isolation: percentage of the number of non-isolated faults compared to the total number of faults detected;
Percentage of Incorrect Isolation: percentage of the number of faults not correctly isolated out of the total number of faults detected.
As for the kind of faults, they have been either simulated or emulated (whenever possible) according to the scheme reported in
Table 6.
The faults described in
Table 6 have been randomly applied during the experimental campaign in order to analyze the diagnostic performance of the proposed procedure.
Table 7 and
Table 8 report the achieved results.
It is possible to highlight that the proposed IFDI and FDI schemes show very attractive performance.
In particular, as for the IFDI capabilities, all faults considered are correctly detected and isolated, but the “hold on fault” is not always correctly isolated, although it is correctly detected. However, this kind of sensor’s fault is generally less frequent concerning the other ones.
As for the FDI capabilities, only faults whose symptom correspond to a variation of the DC current are not always correctly detected, whereas the other kind of faults are always correctly detected and isolated.
Finally, all transient overvoltage on the AC side has been correctly identified in all cases.
5. Discussion
An innovative distributed system for monitoring and performing the fault diagnosis of AC/DC converters in MV/LV substations has been proposed.
It has been designed and built to be scalable and cost-effective.
The main novelty of the proposal regards the implementation of a novel Fault Detection and Isolation (FDI) scheme especially designed for AC/DC converter fault diagnosis.
Furthermore, the reliability of the proposal improved by the implementation in the proposed architecture of an Instrument Fault Detection and Isolation (IFDI) section for identifying faults that could occur on the instruments and sensors involved in the monitoring process of the AC/DC converter. As for the approach followed for the development of the diagnostic scheme, the analytical redundancy has been considered, and a rule-based technique has been set up on the basis of both theoretical links among the quantities of interest and empirical trends observed with a large experimental campaign.
The performance of the proposed FDI/IFDI scheme has been experimentally evaluated by emulating several faults on both the AC and DC side of the converter under controlled conditions.
The obtained results have demonstrated the IFDI capability of correctly detecting all faults and very good isolation performance that in the worst case is equal to 94.74%.
As FDI capabilities regard, the proposal has correctly isolated all the considered faults with a detecting performance which, in the worst case, is equal to 95%. Then, having chosen a simple rule-based technique for the FDI–IFDI schemes, the proposal can be easily developed on low powerful microcontroller architectures, thus assuring a cost-effective solution even for large-scale deployment.
As further future development, the realized system can be considered the first step toward a more powerful system that aims to develop a prognostic platform for predictive fault diagnosis and predictive maintenance. In detail, according to the requirement of the Industry 4.0 paradigm, the future system will predict the possible faults of these systems to minimize the plant shutdown. In detail, the authors are considering the suitability of two solutions.
The former is based on the adoption of an approach very similar to the one used in the statistical control of production processes. In particular, the Control charts, also known as Shewhart charts (after Walter A. Shewhart) or process–behavior charts, in statistical process control are tools used to determine if a manufacturing or business process is in a state of statistical control [
8]. A set of rules are used to predict the future performance of the system under evaluation [
9]. If the chart indicates that the monitored system is not “in control”, analysis of the chart can help determine the sources of variation, as this will result in degraded system performance. Such concepts can be adopted for identifying an incipient fault occurring on the AC/DC converter, thus enabling the ability to actuate a predictive maintenance policy.
The latter is based on the adoption of the digital twin paradigm. In detail, the acquisition, for a long time, of the considered data allows developing a state model of the device (Hidden Markov Model—HMM). The HMM is characterized by a number of states (nodes) and a number of transitions among states (arches). Each transition has a certain statistical probability. Then, a fault could produce effects on the born of new states or in terms of changes in the probability of some transition. The early estimation of these effects could give information about possible future faults.


 ,
, 


