
Characterization of Microschist Rocks under High Temperature at Najran Area of Saudi Arabia


Abstract
:1. Introduction
2. Materials and Methods
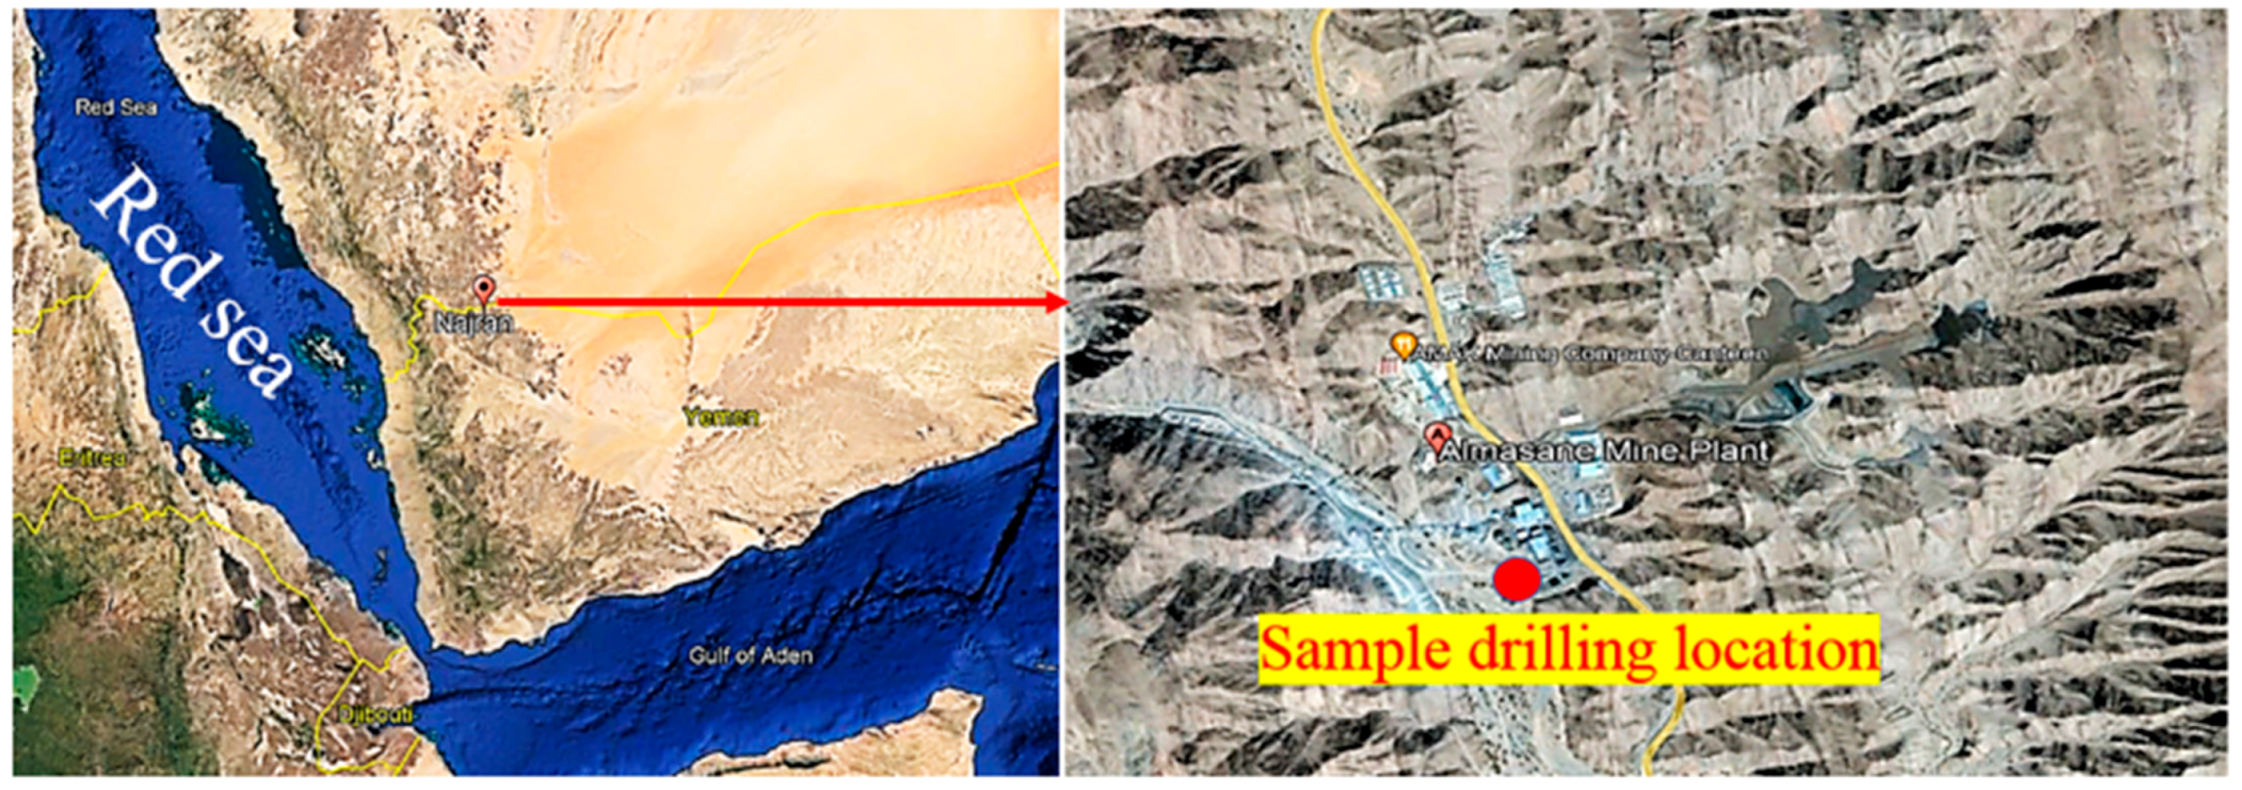
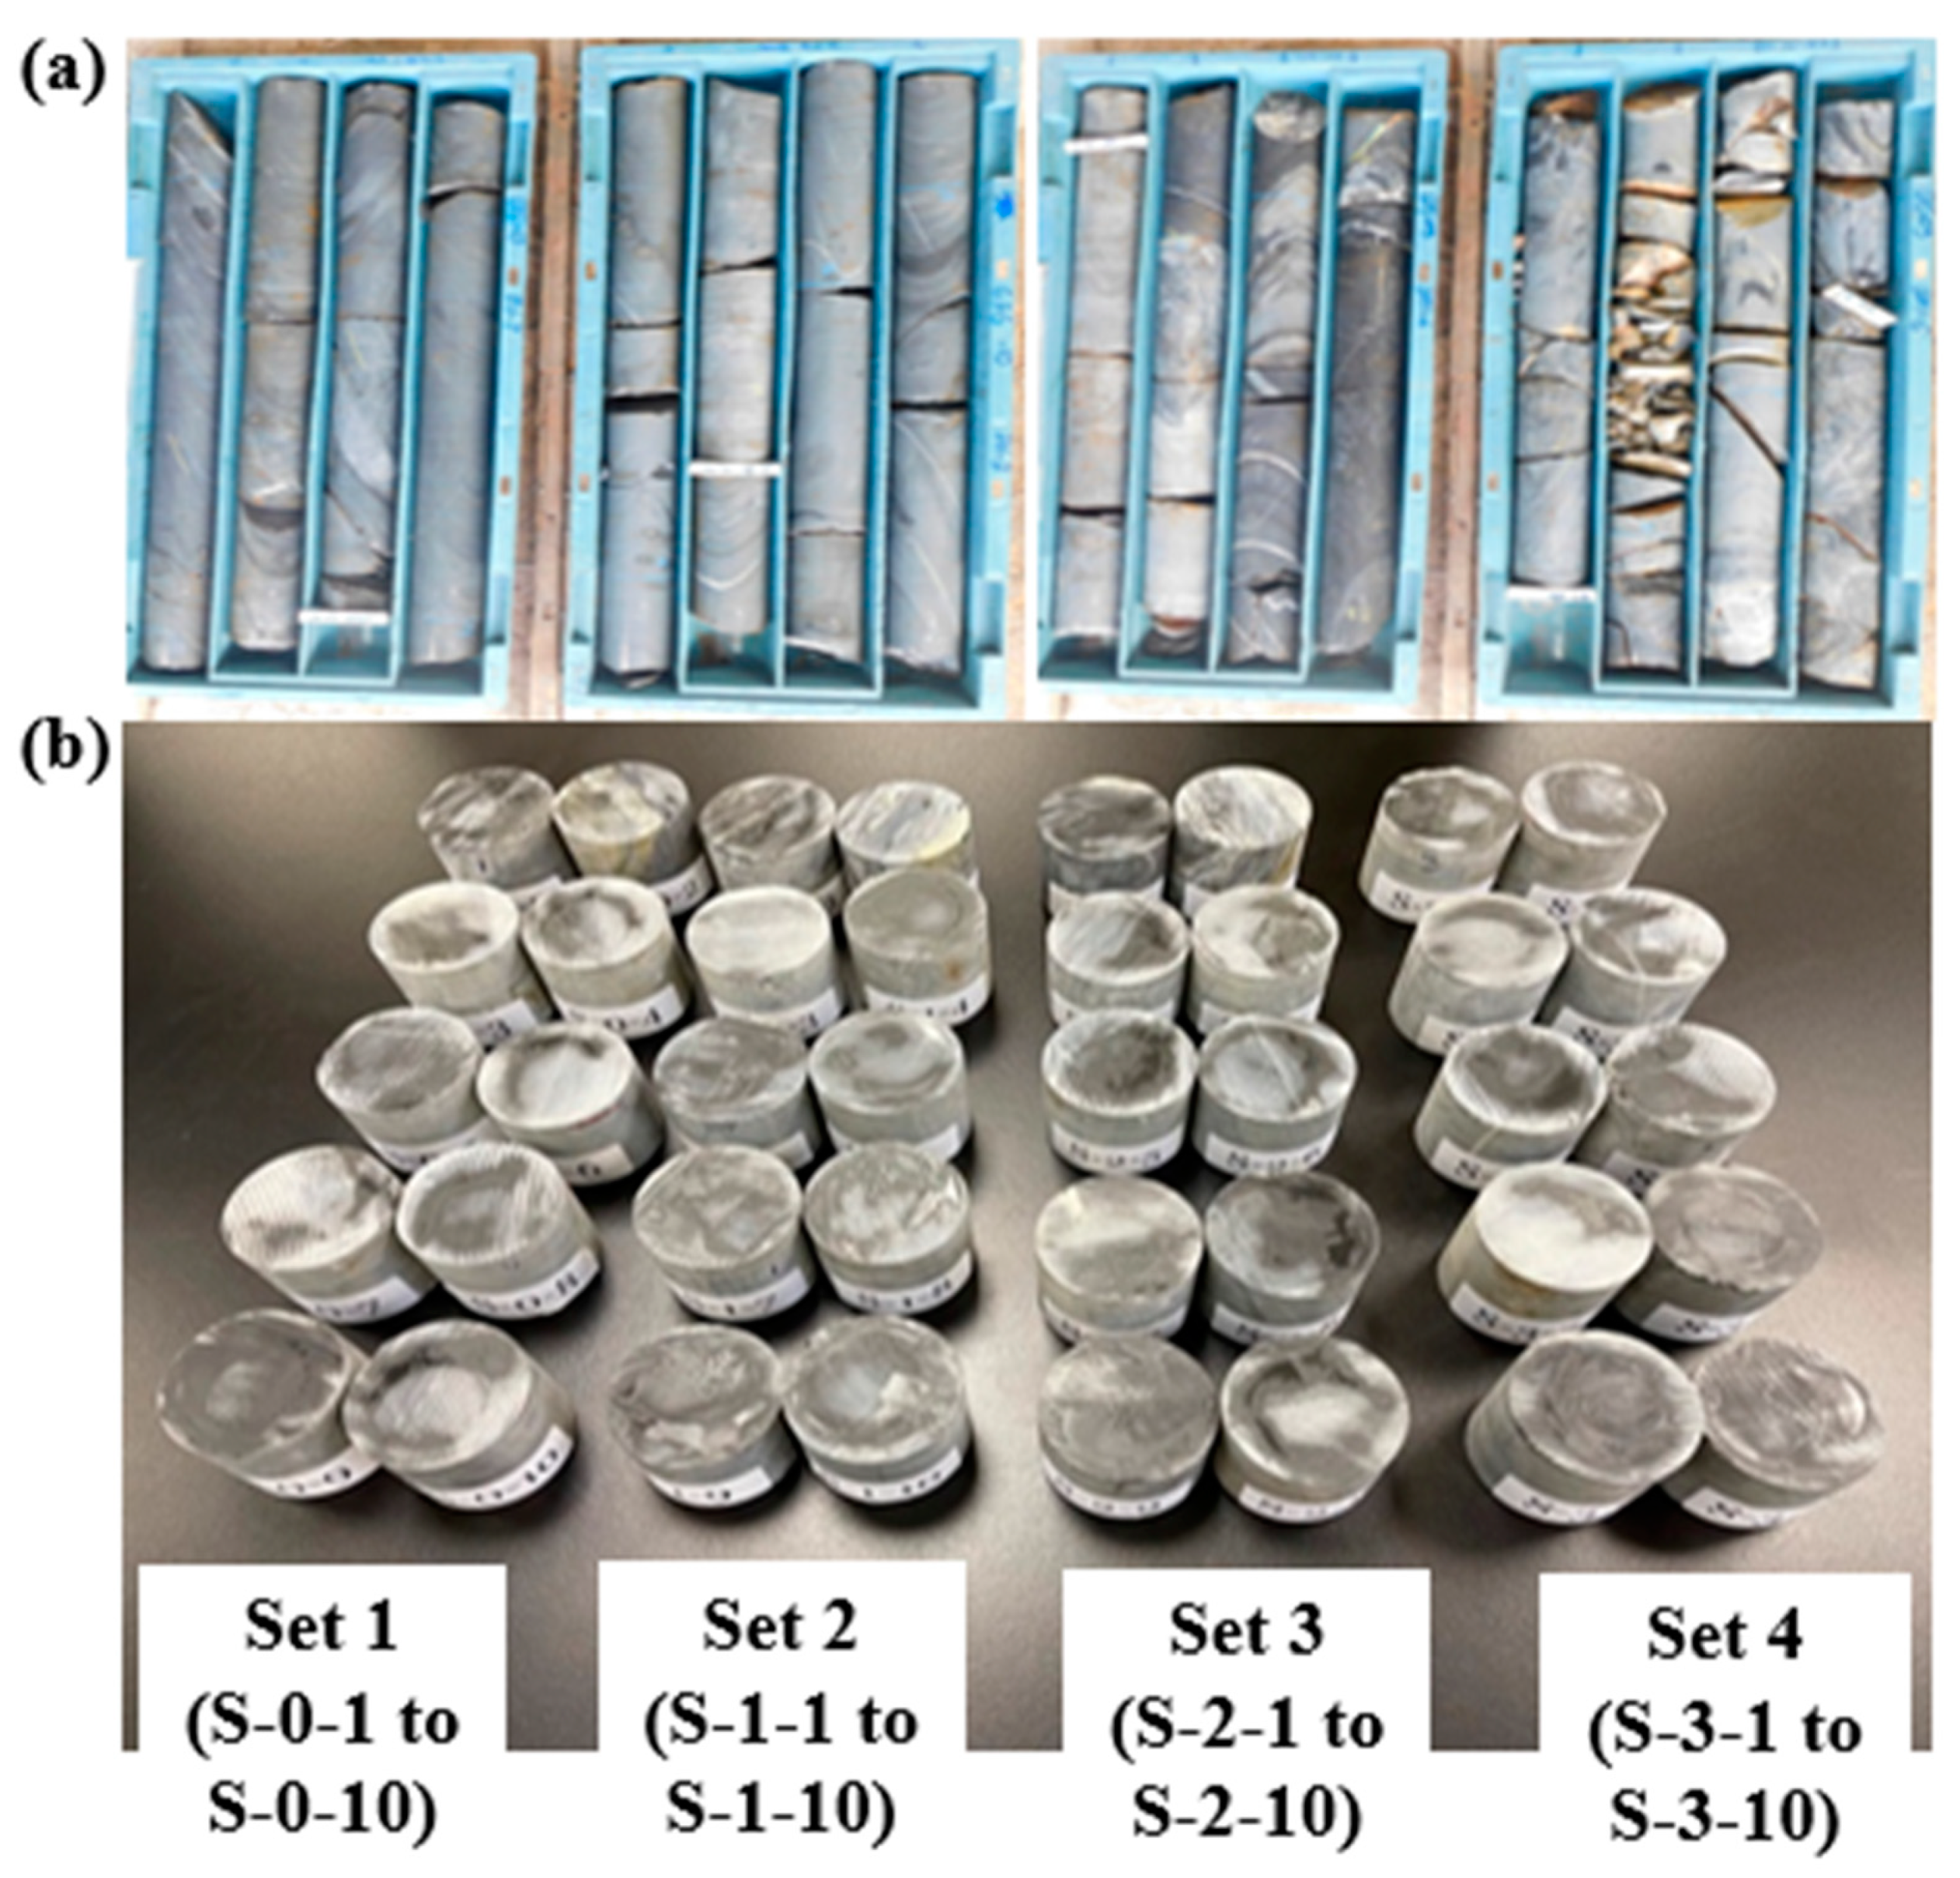
2.1. Sample Collection and Preparation
2.2. Sample Characterizations
2.3. Density and P-Wave Velocity
2.4. Heating Experiments
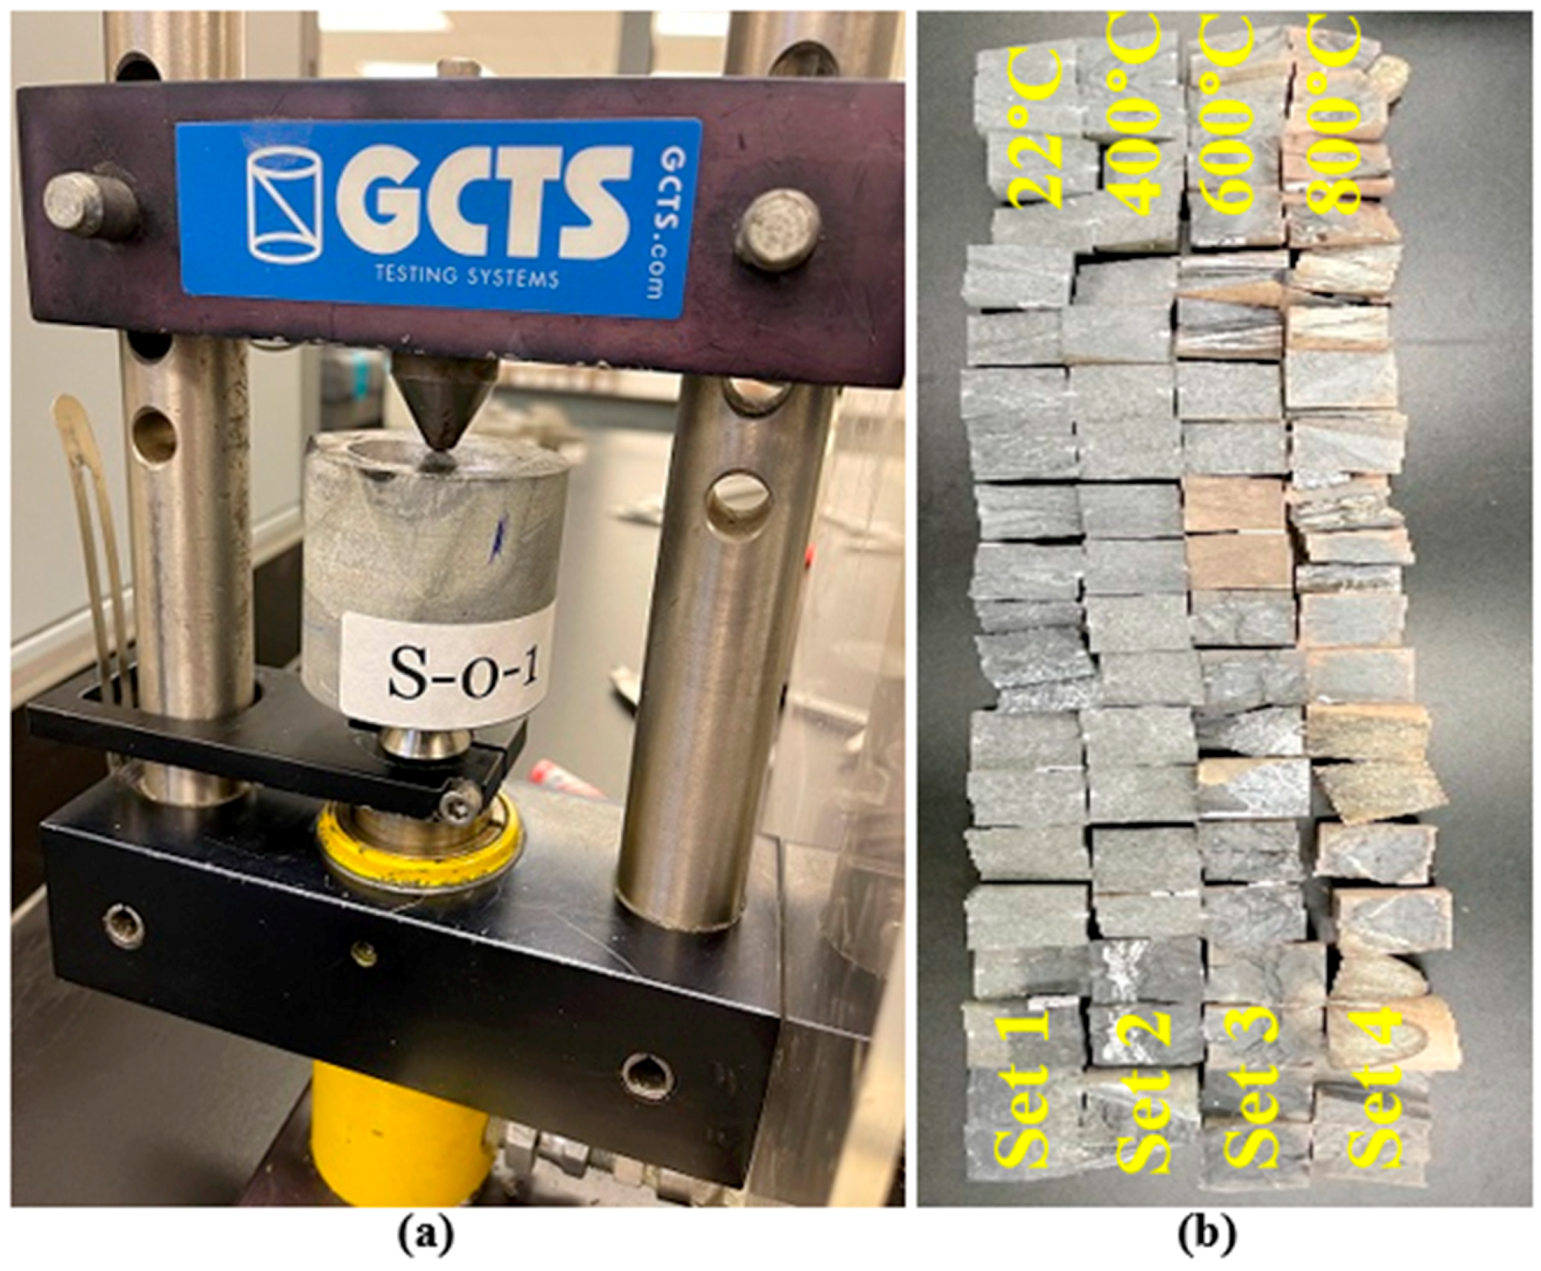
2.5. Estimation of UCS Using the Point Load Test
3. Results and Discussions
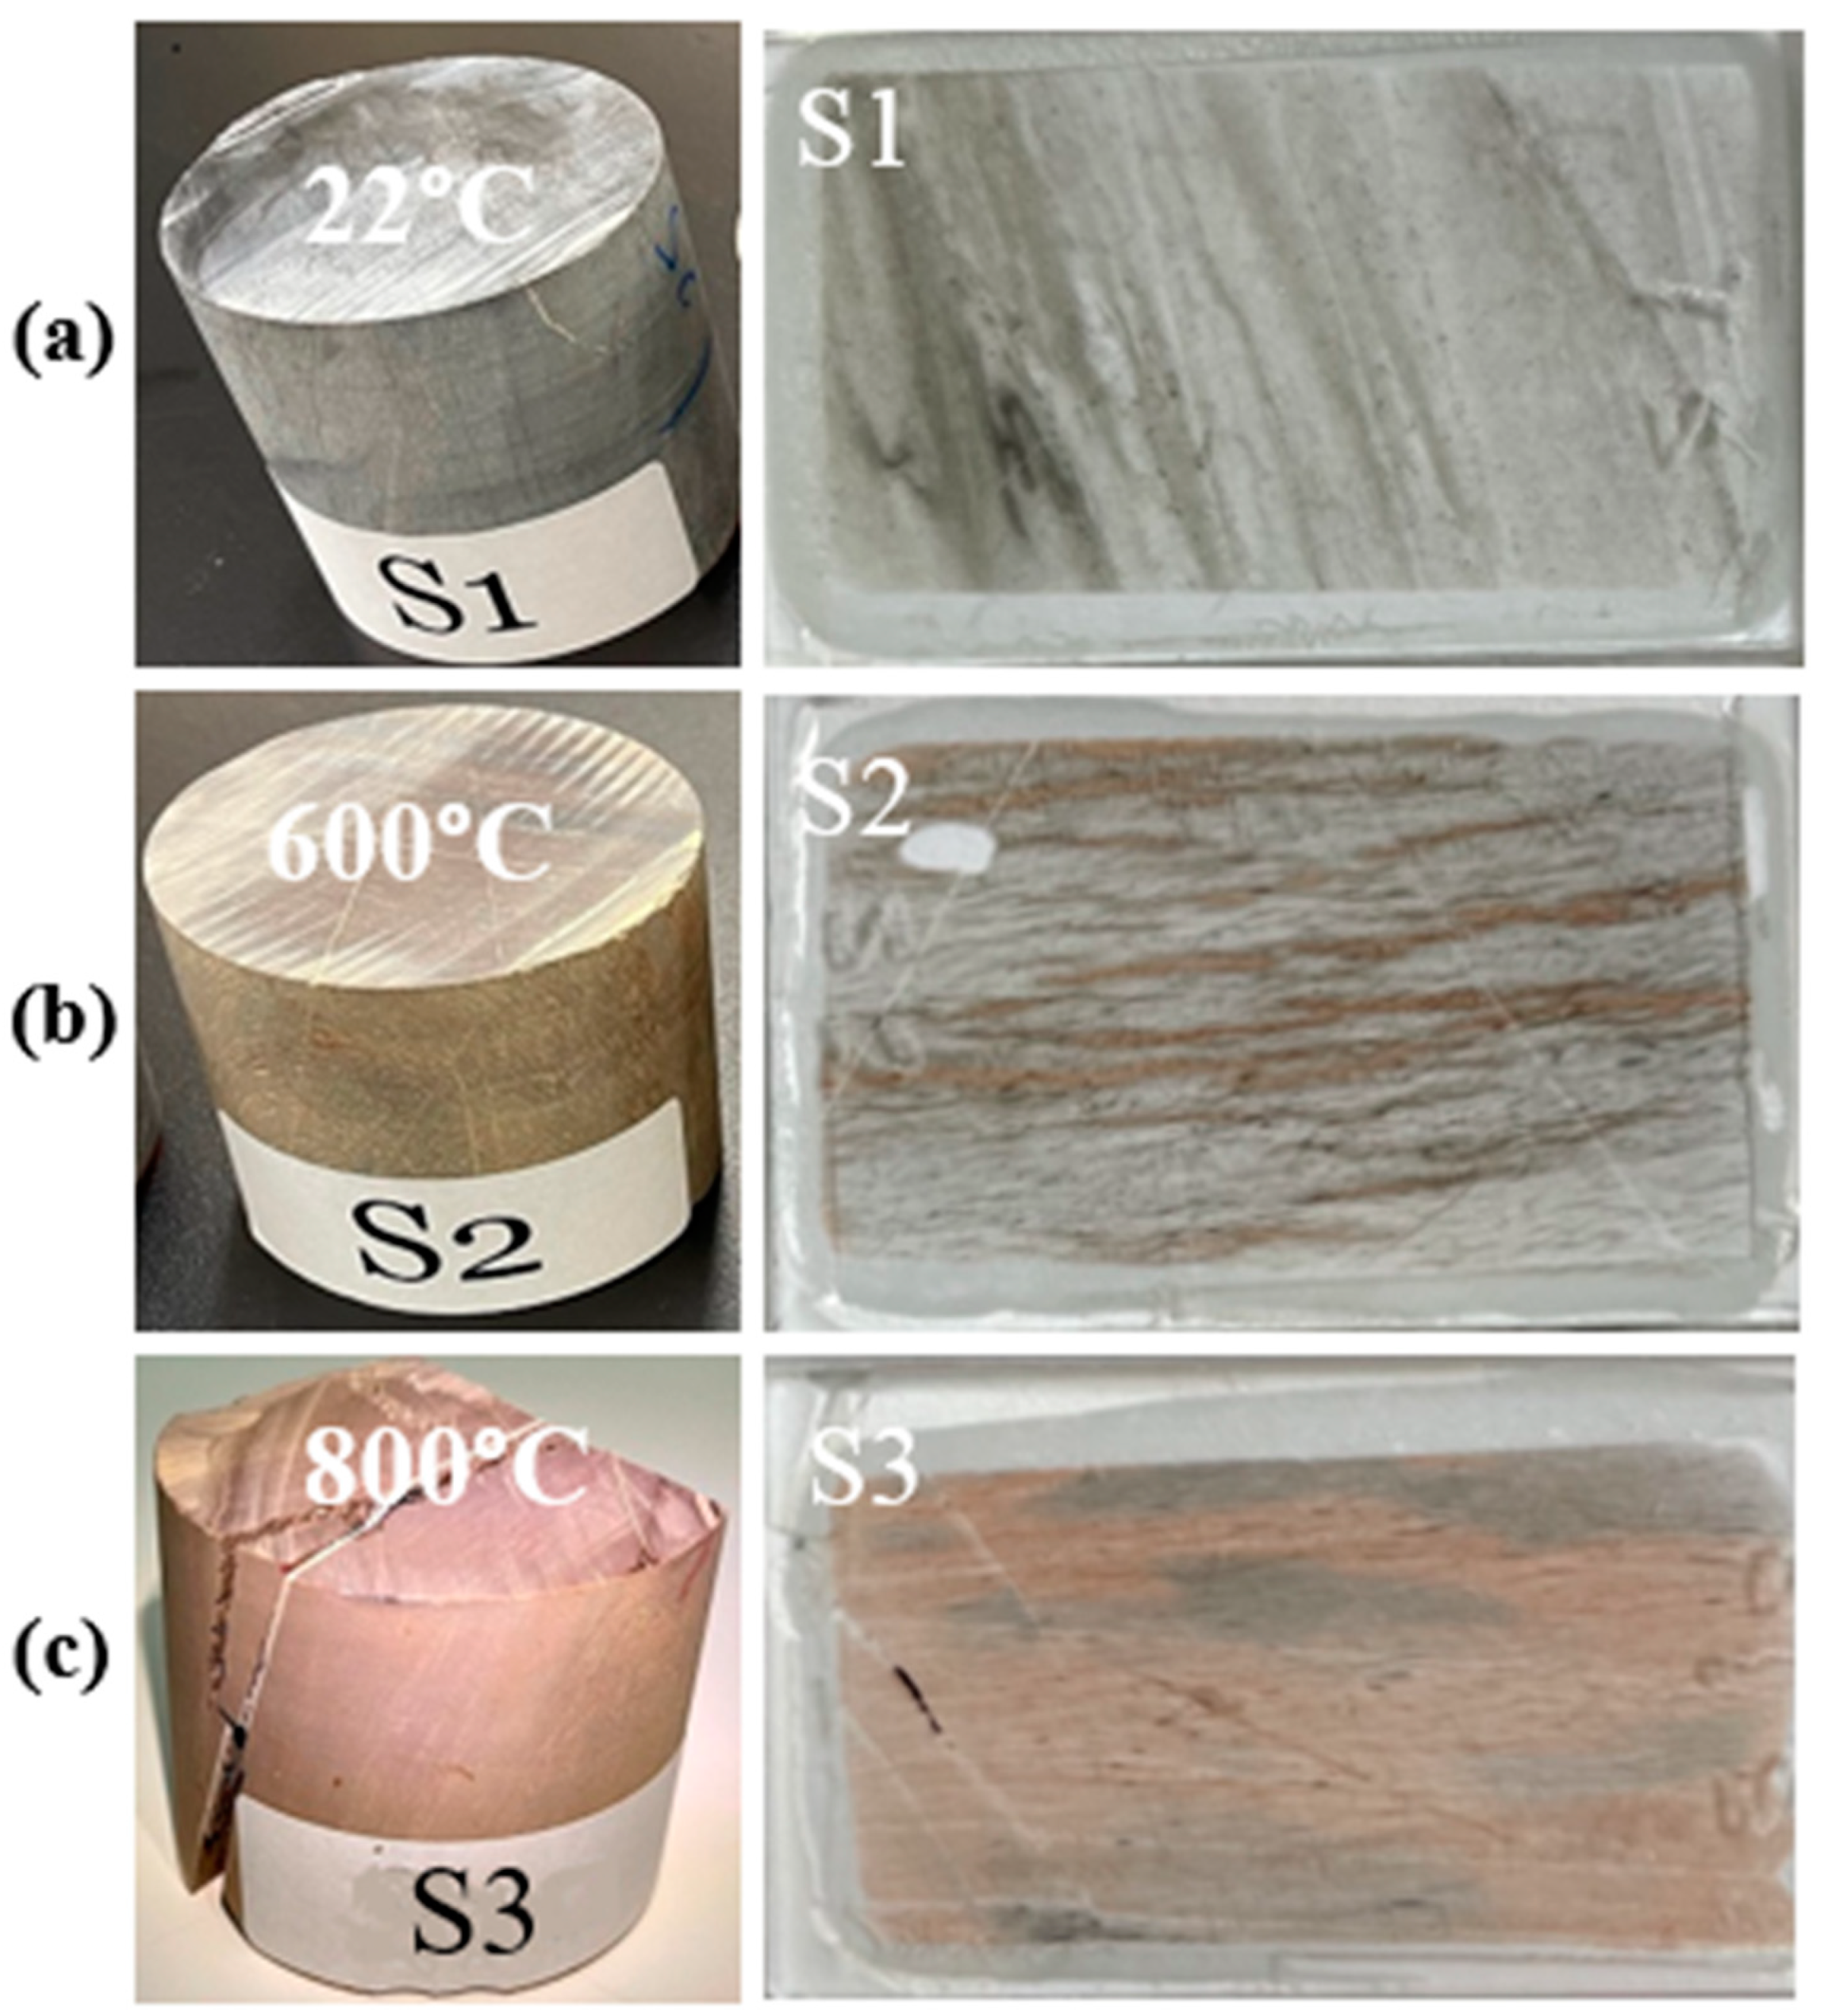
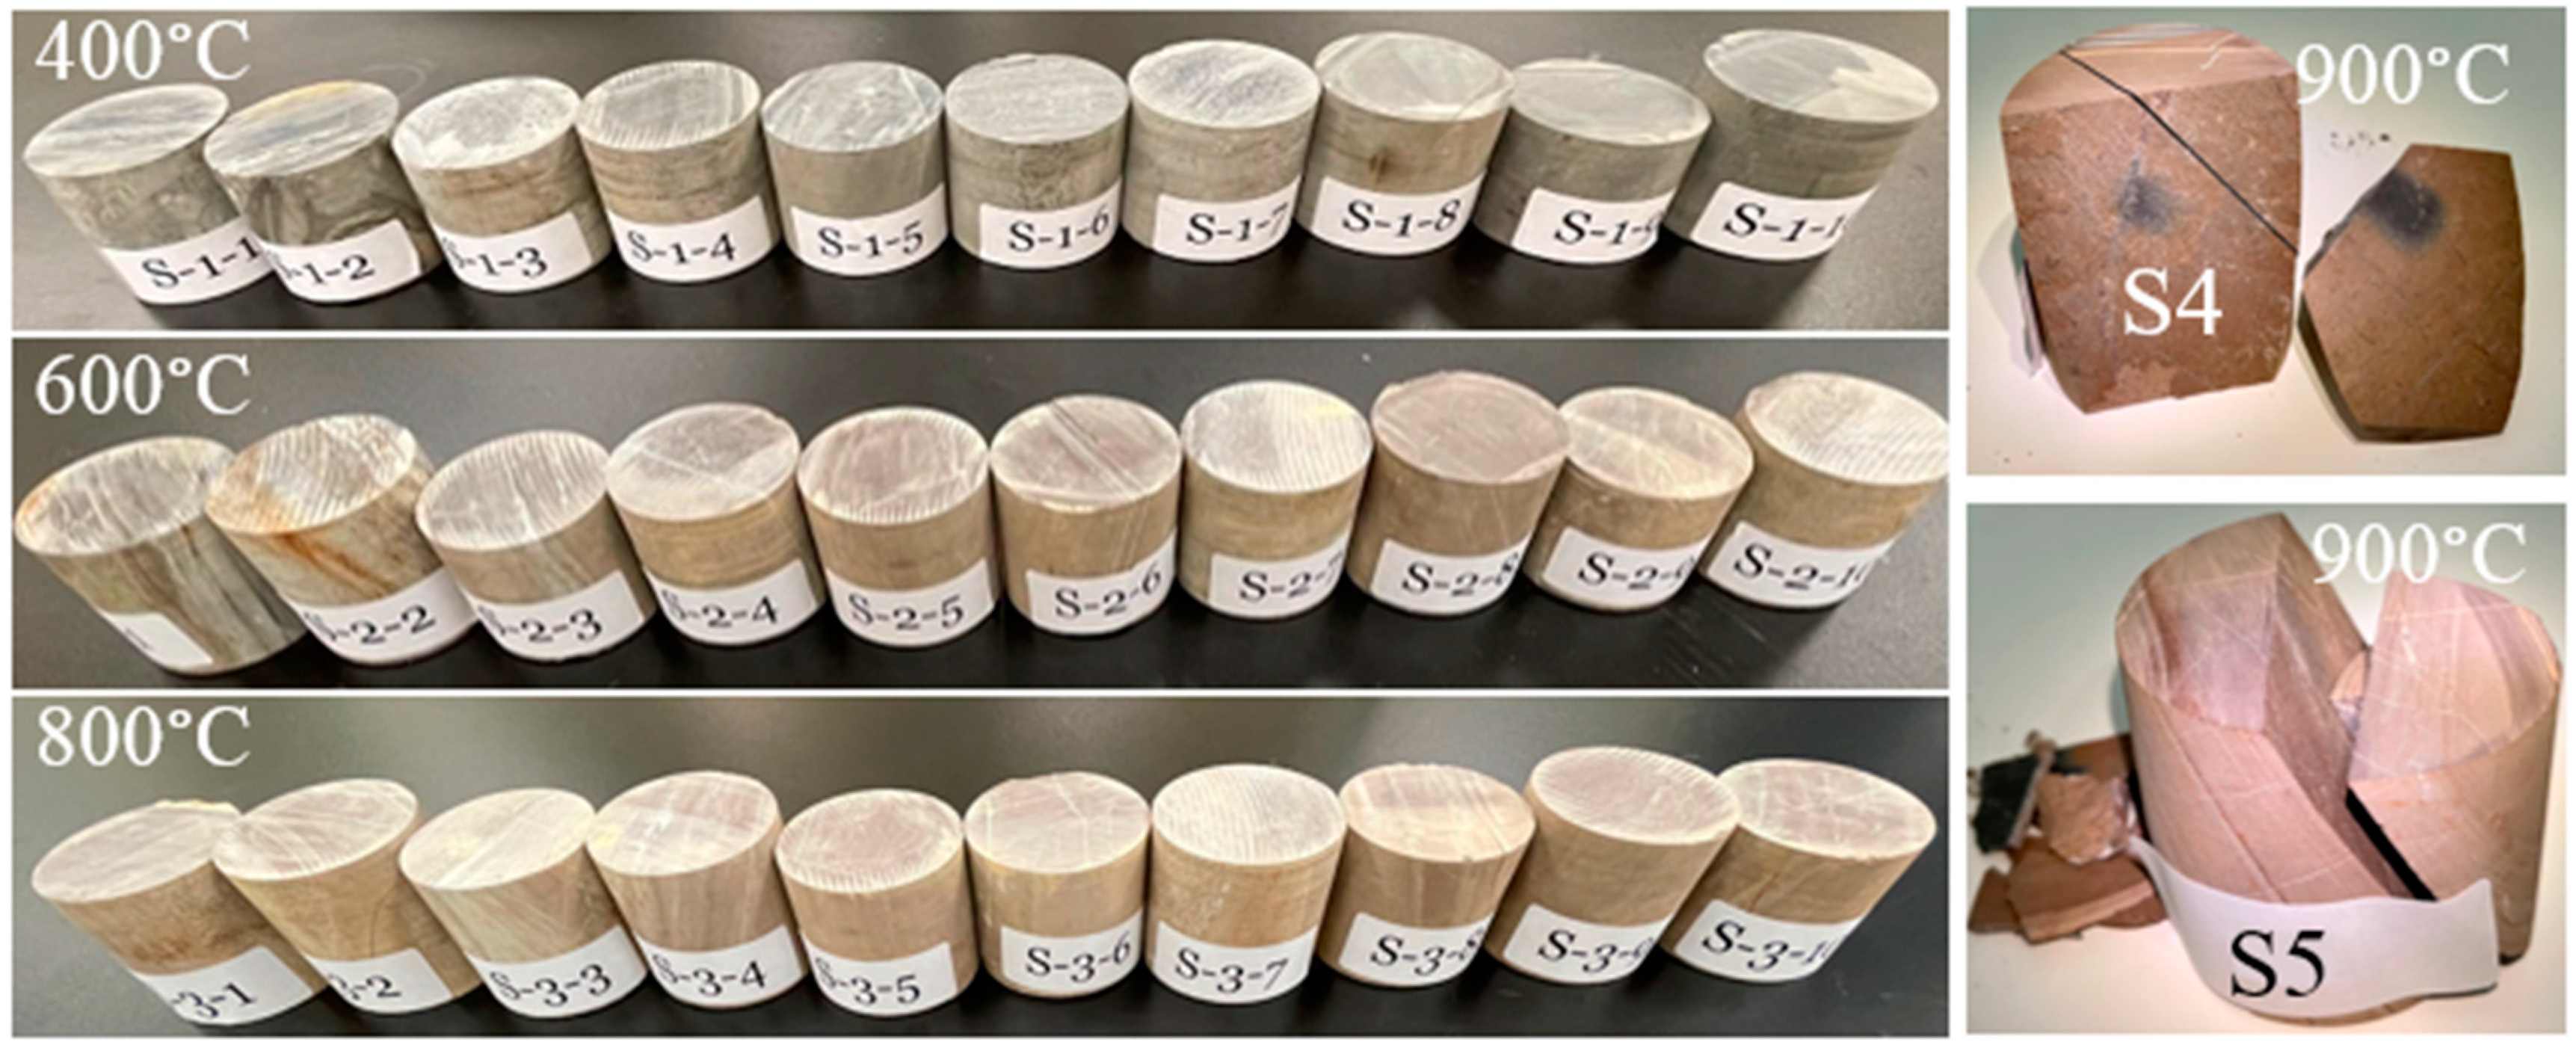
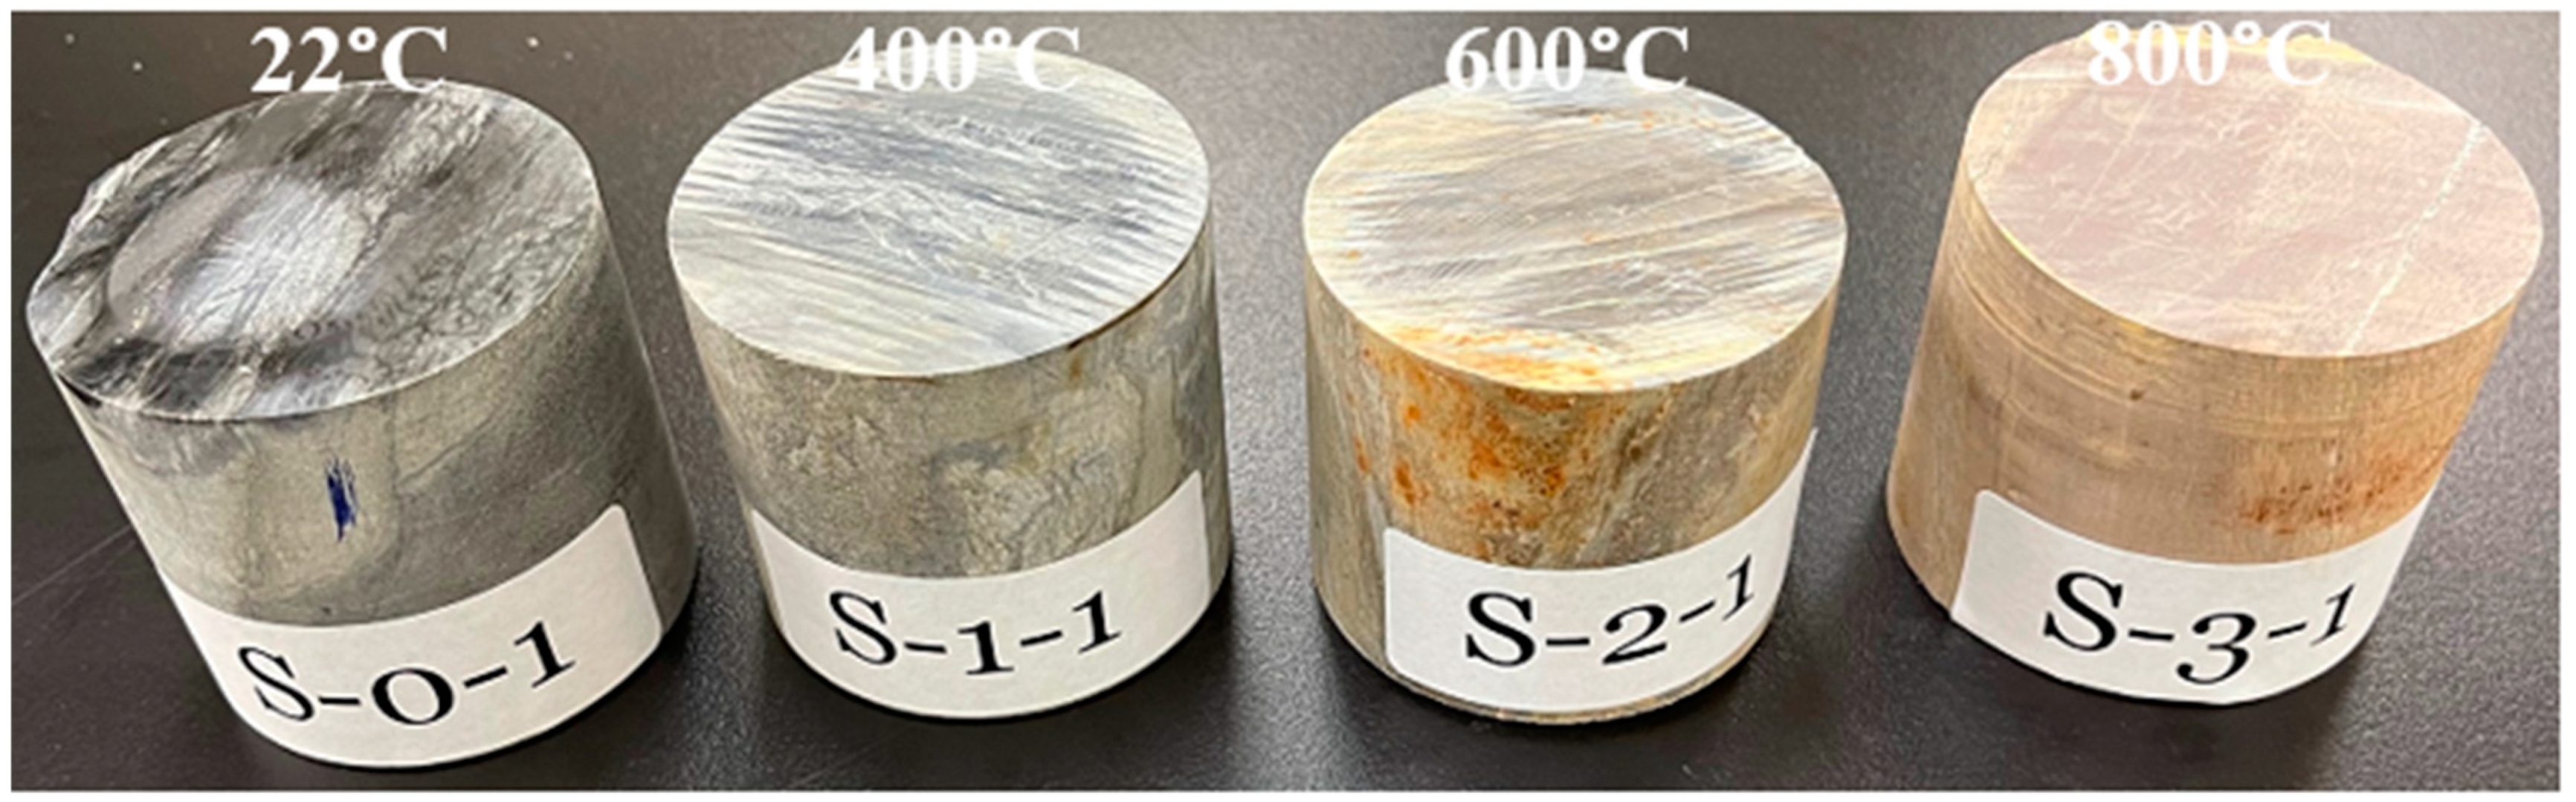
3.1. Color
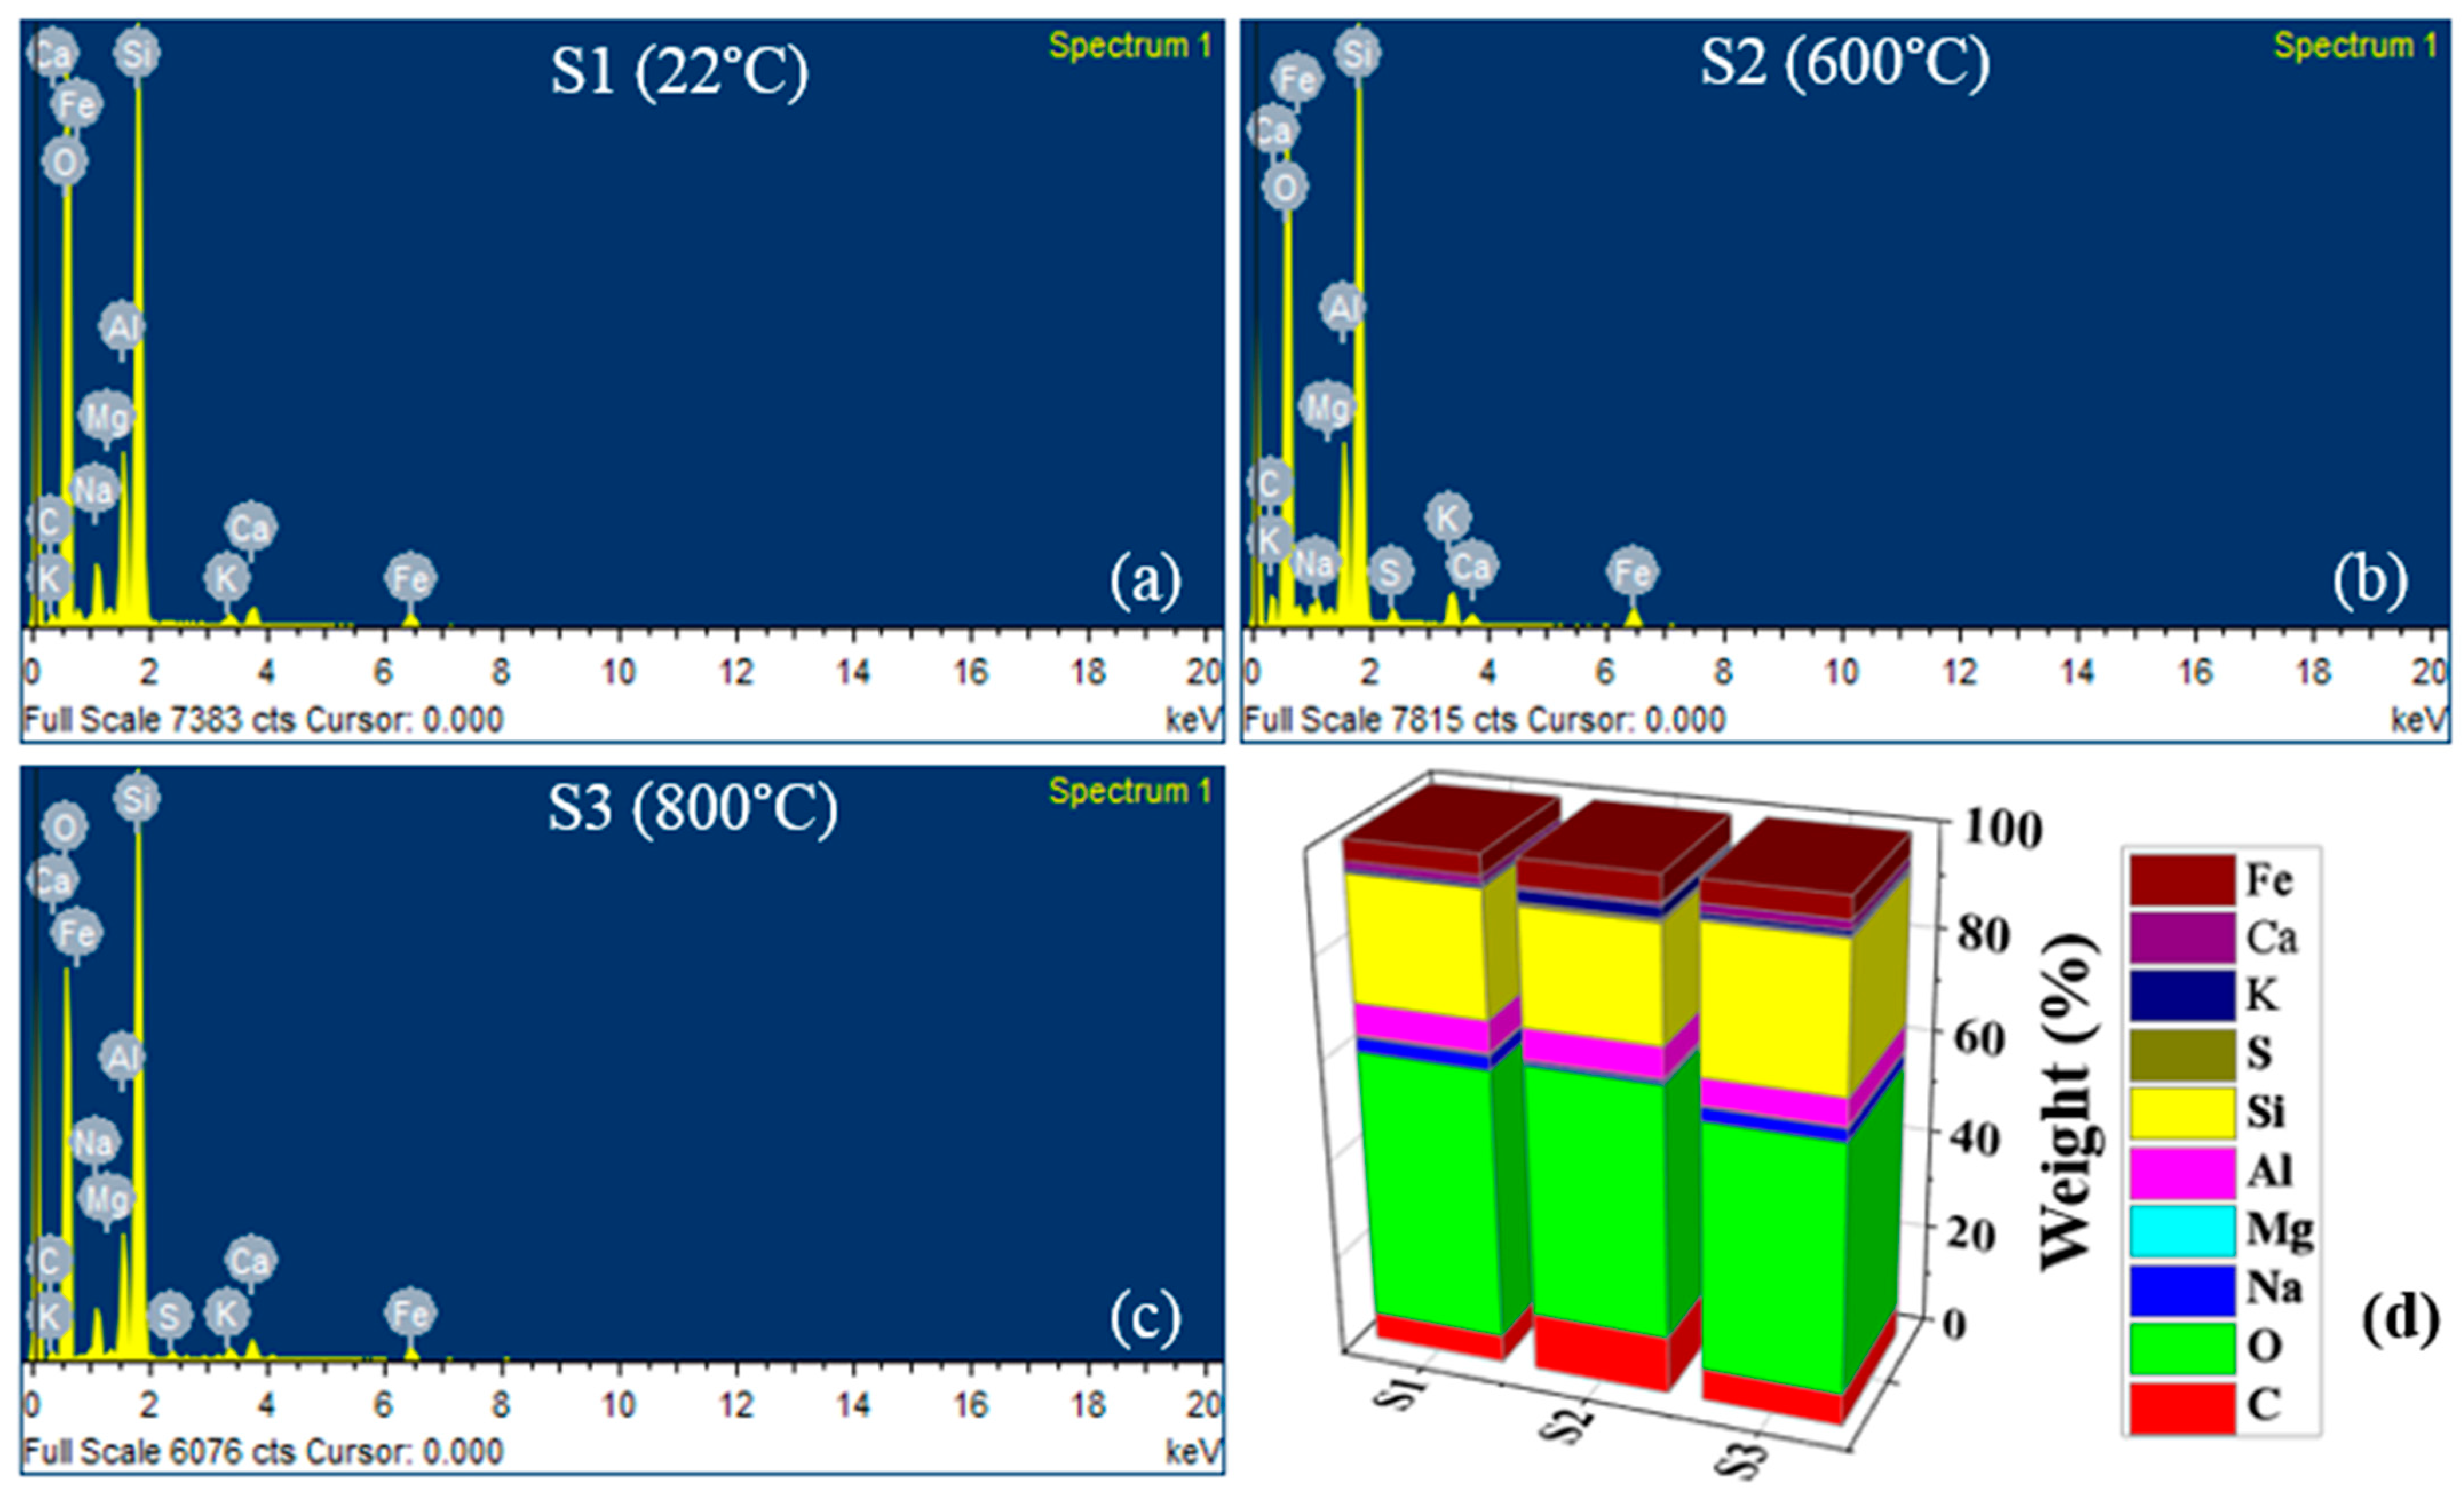
3.2. SEM-EDX Analysis
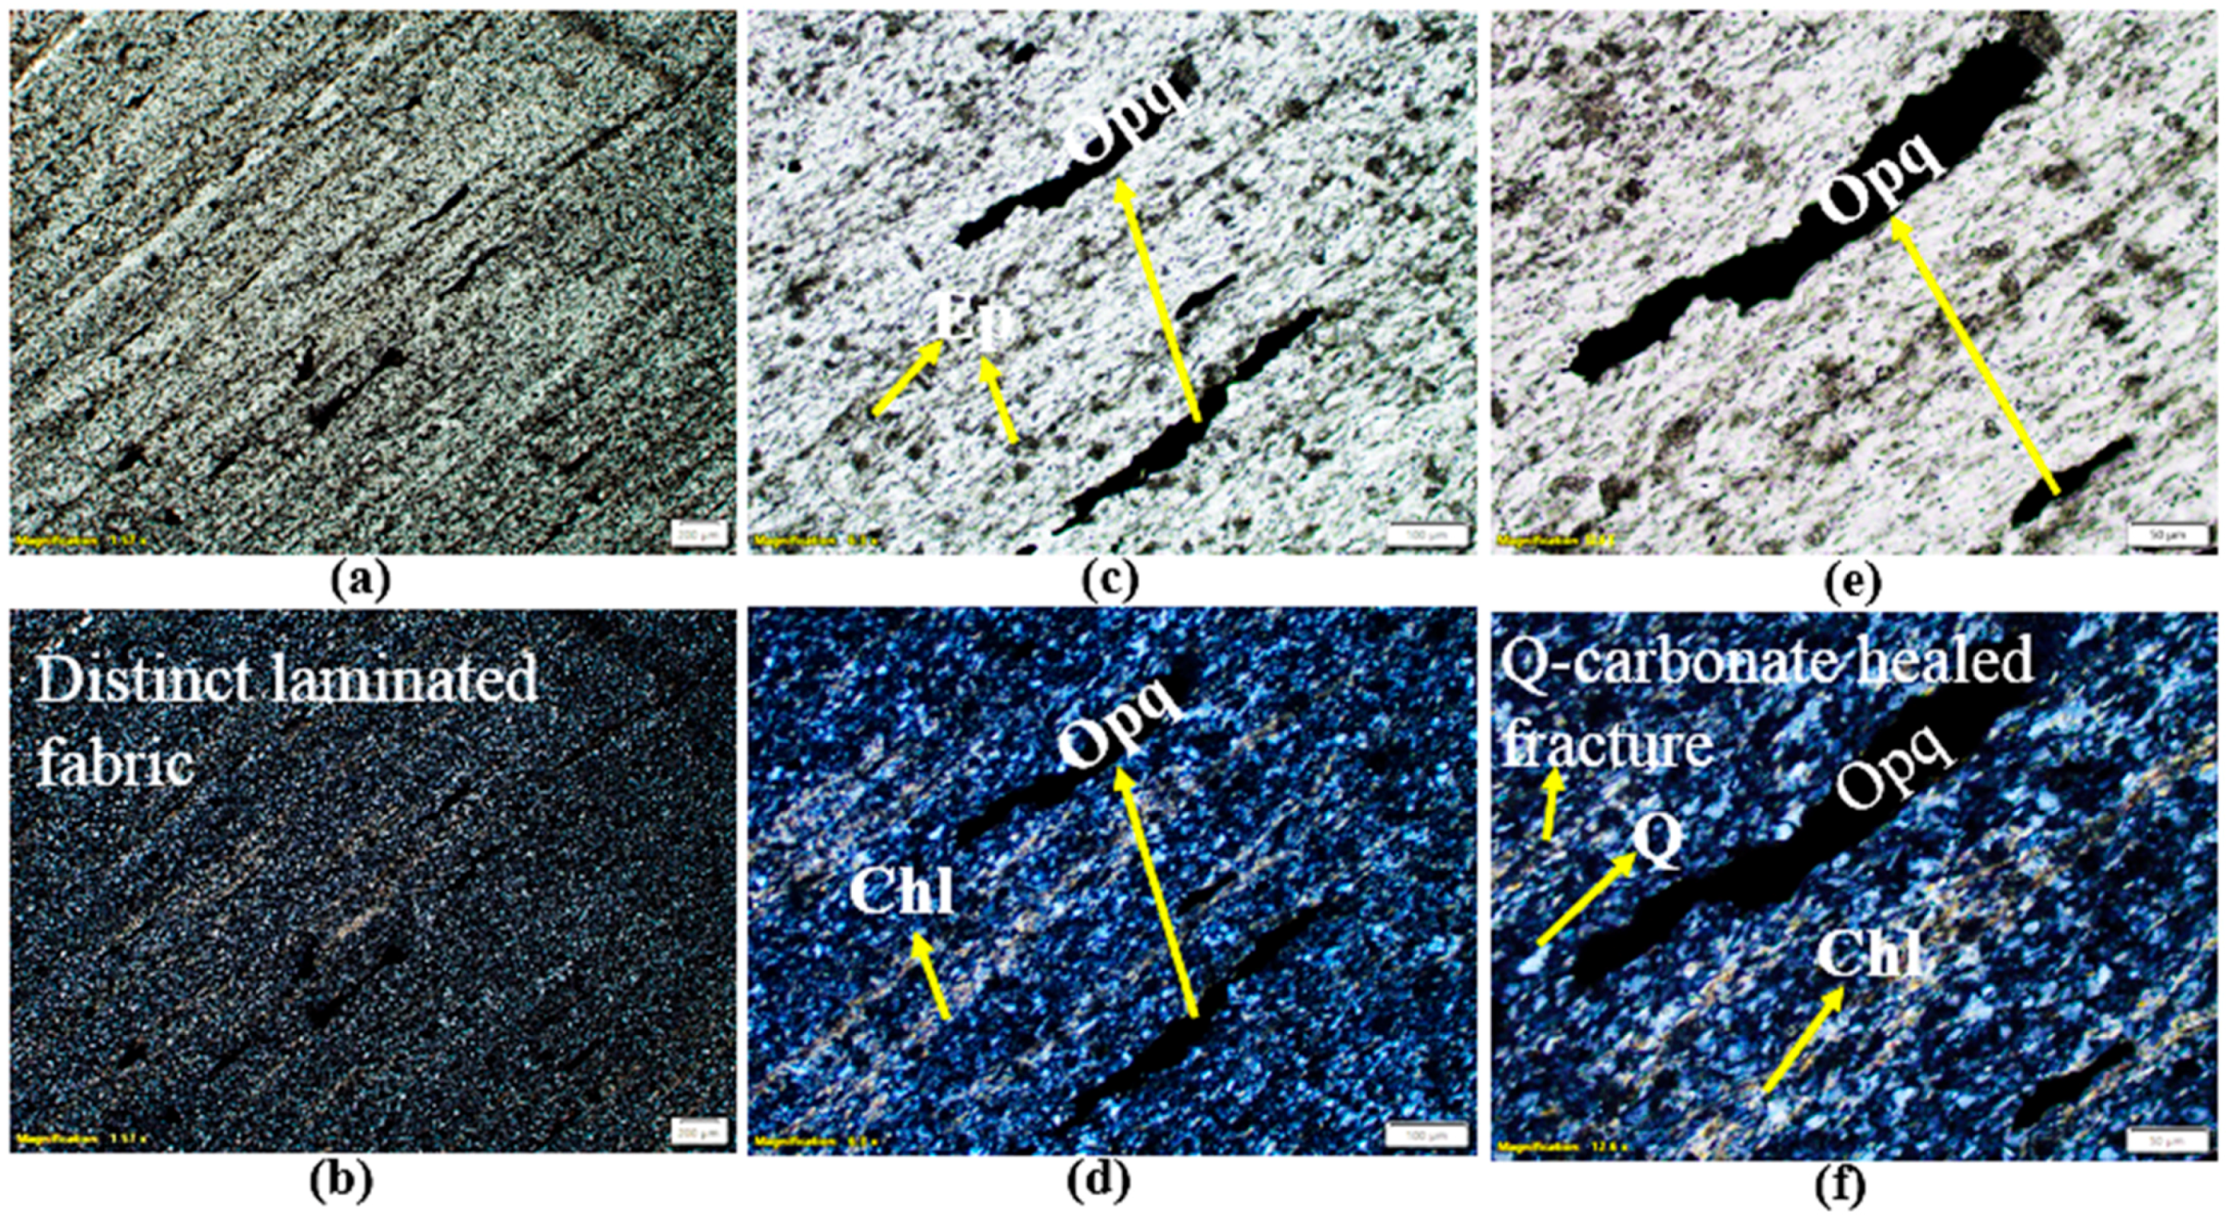
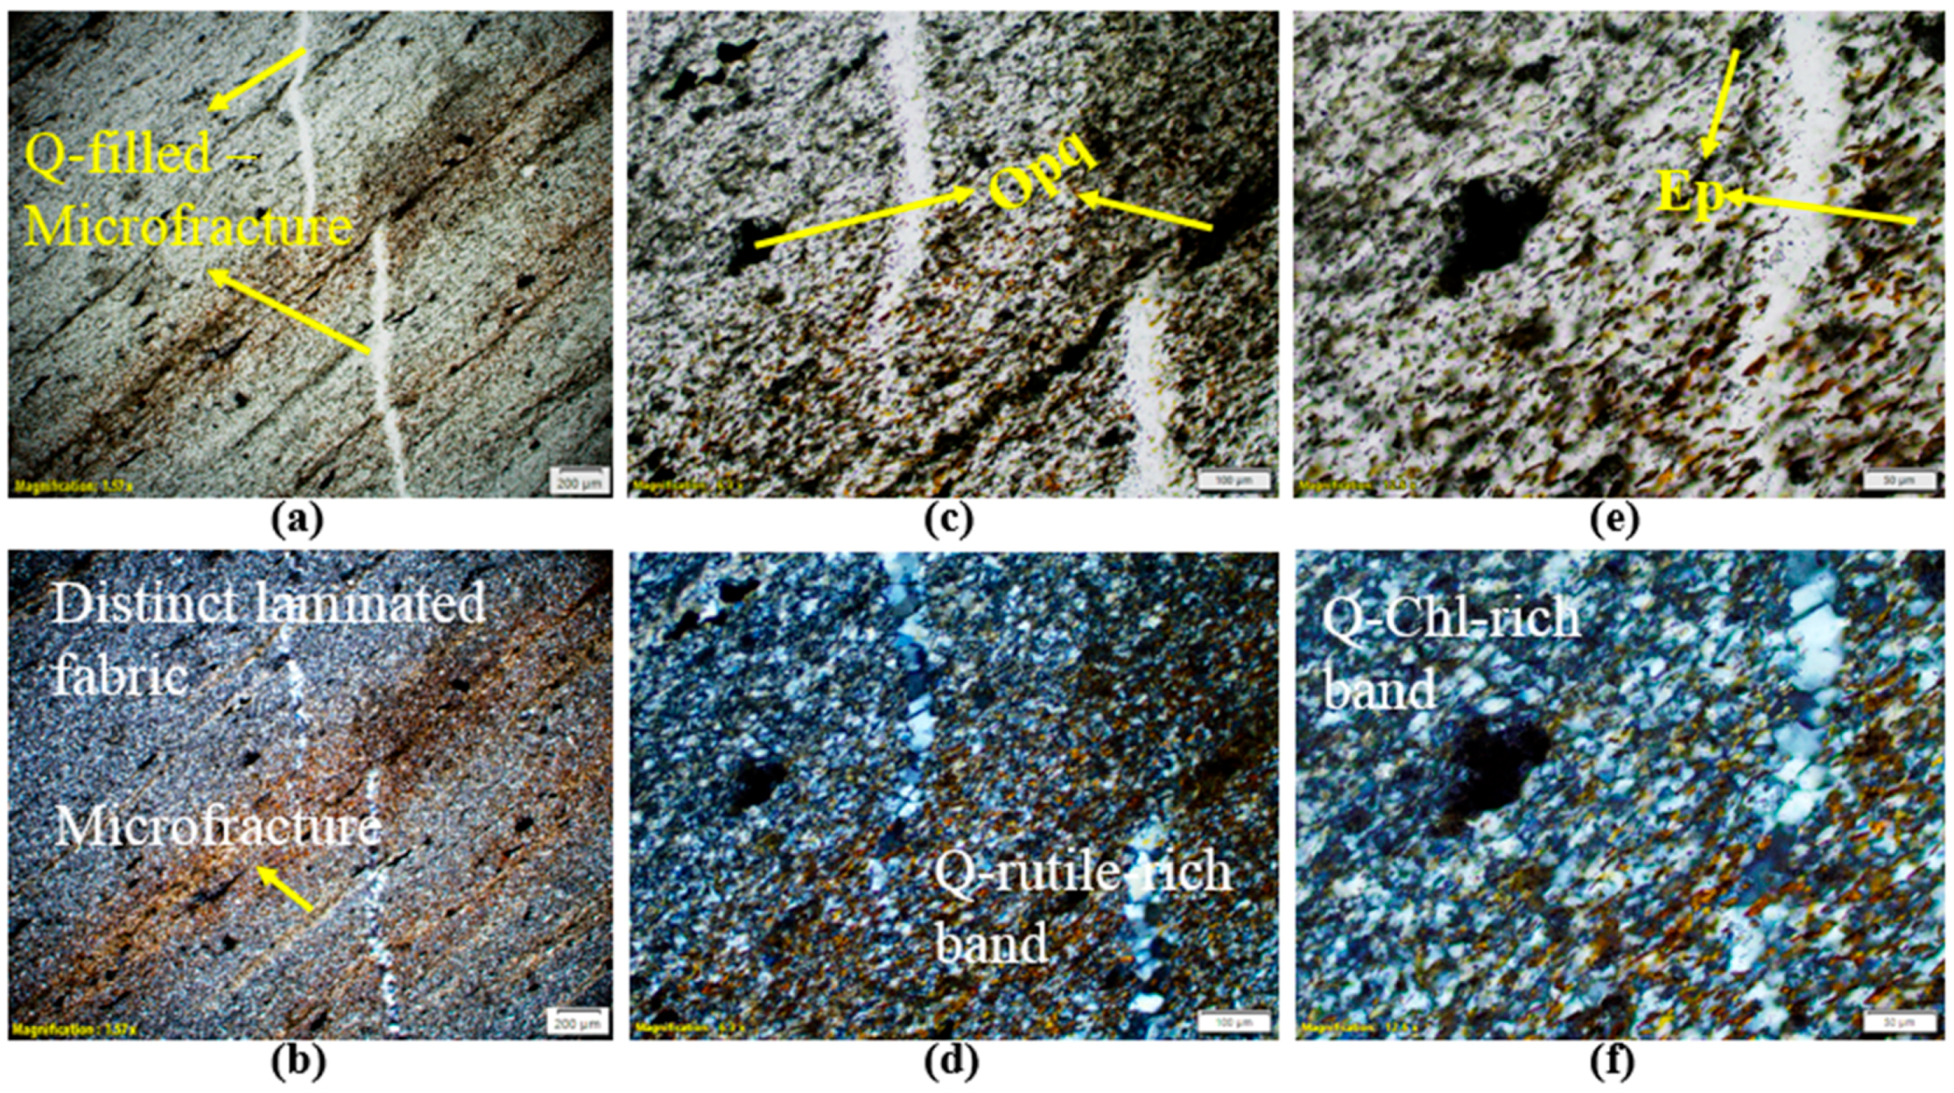
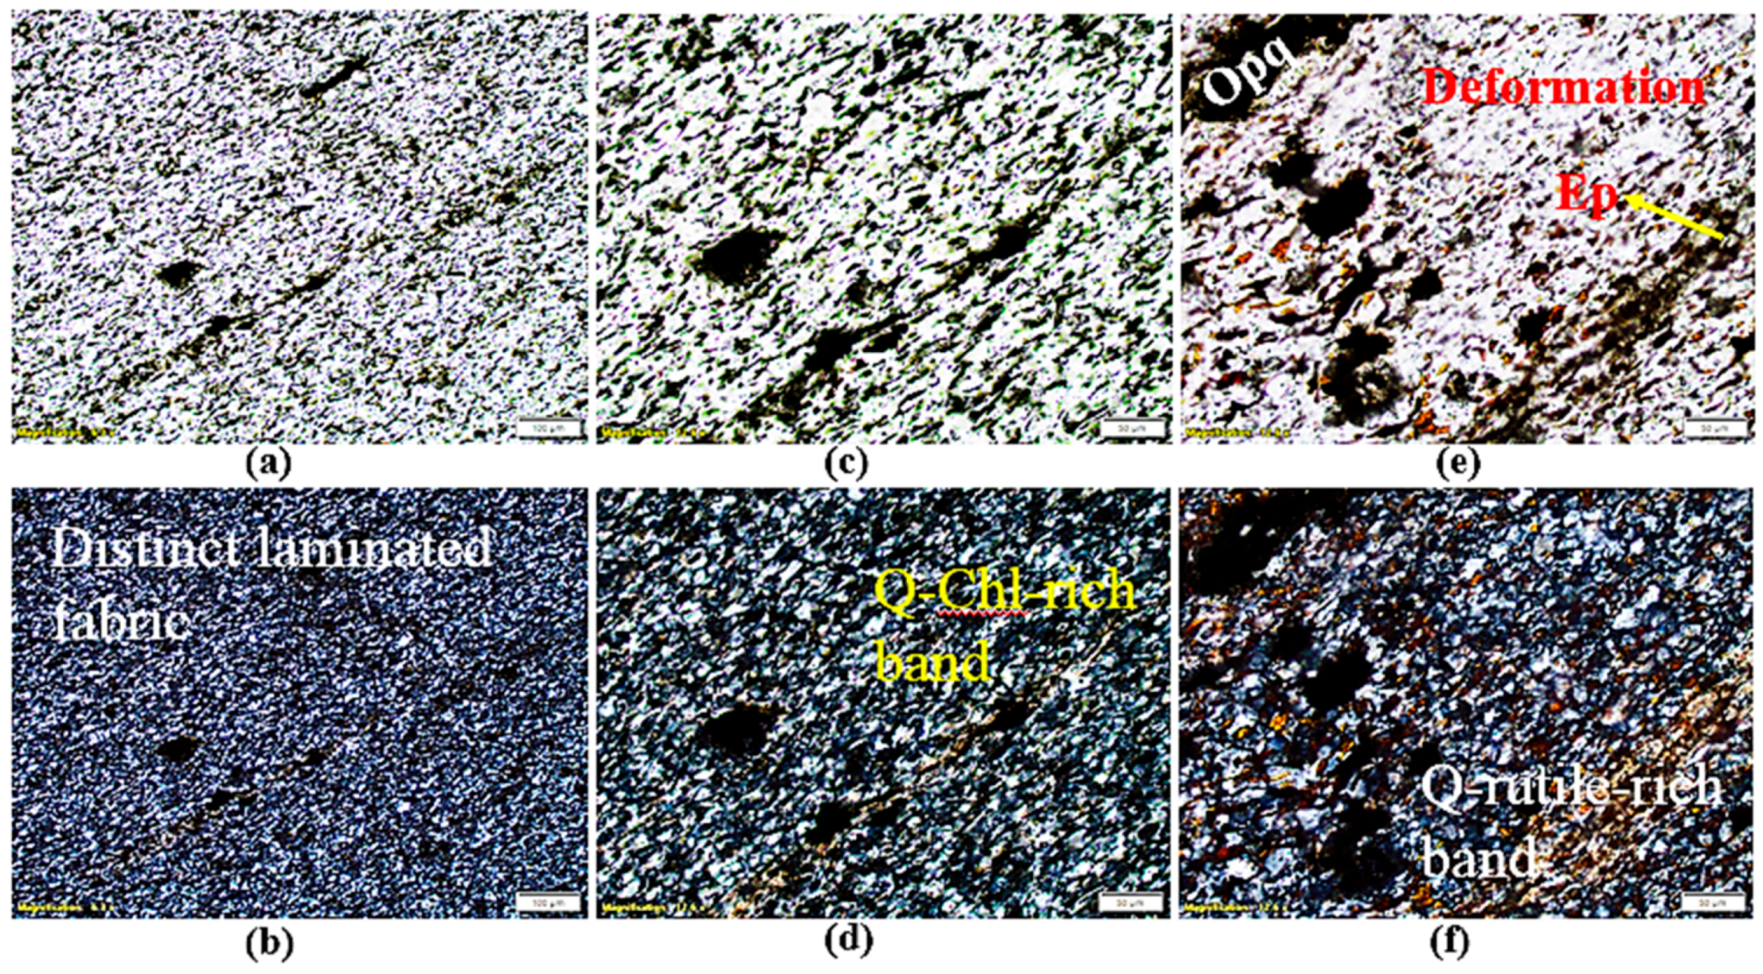
3.3. Petrographic Analysis
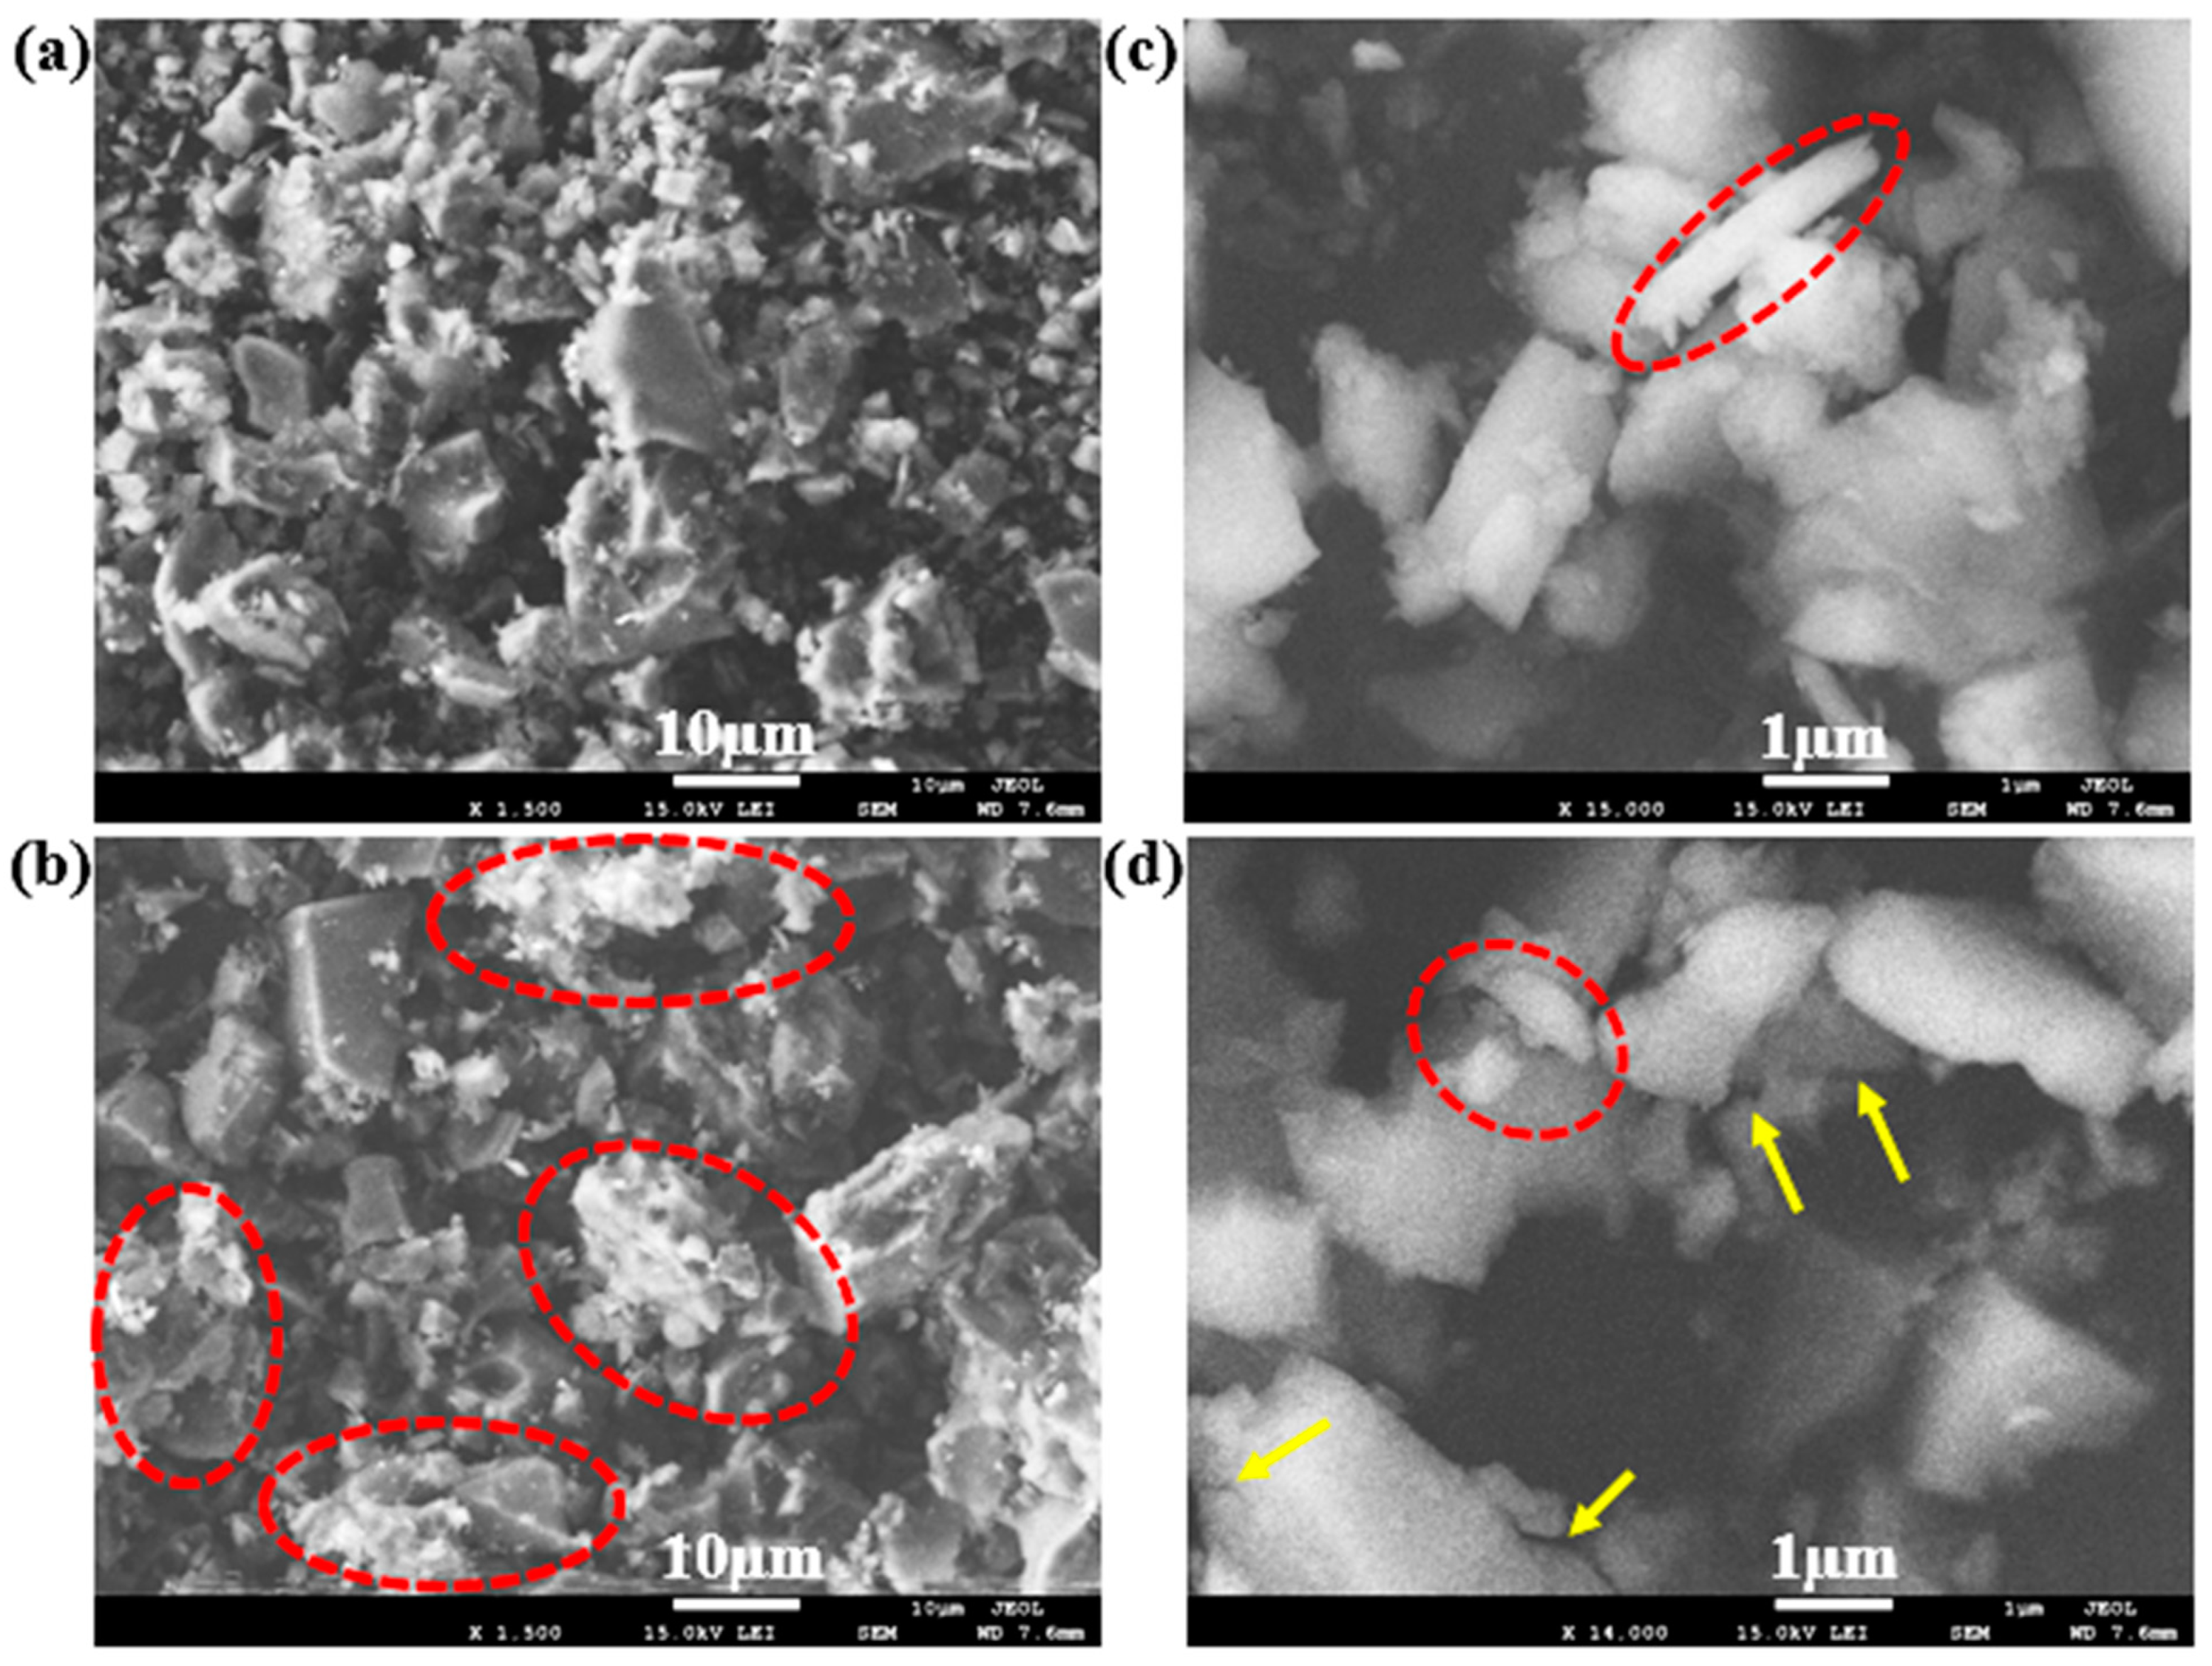
3.4. SEM Analysis
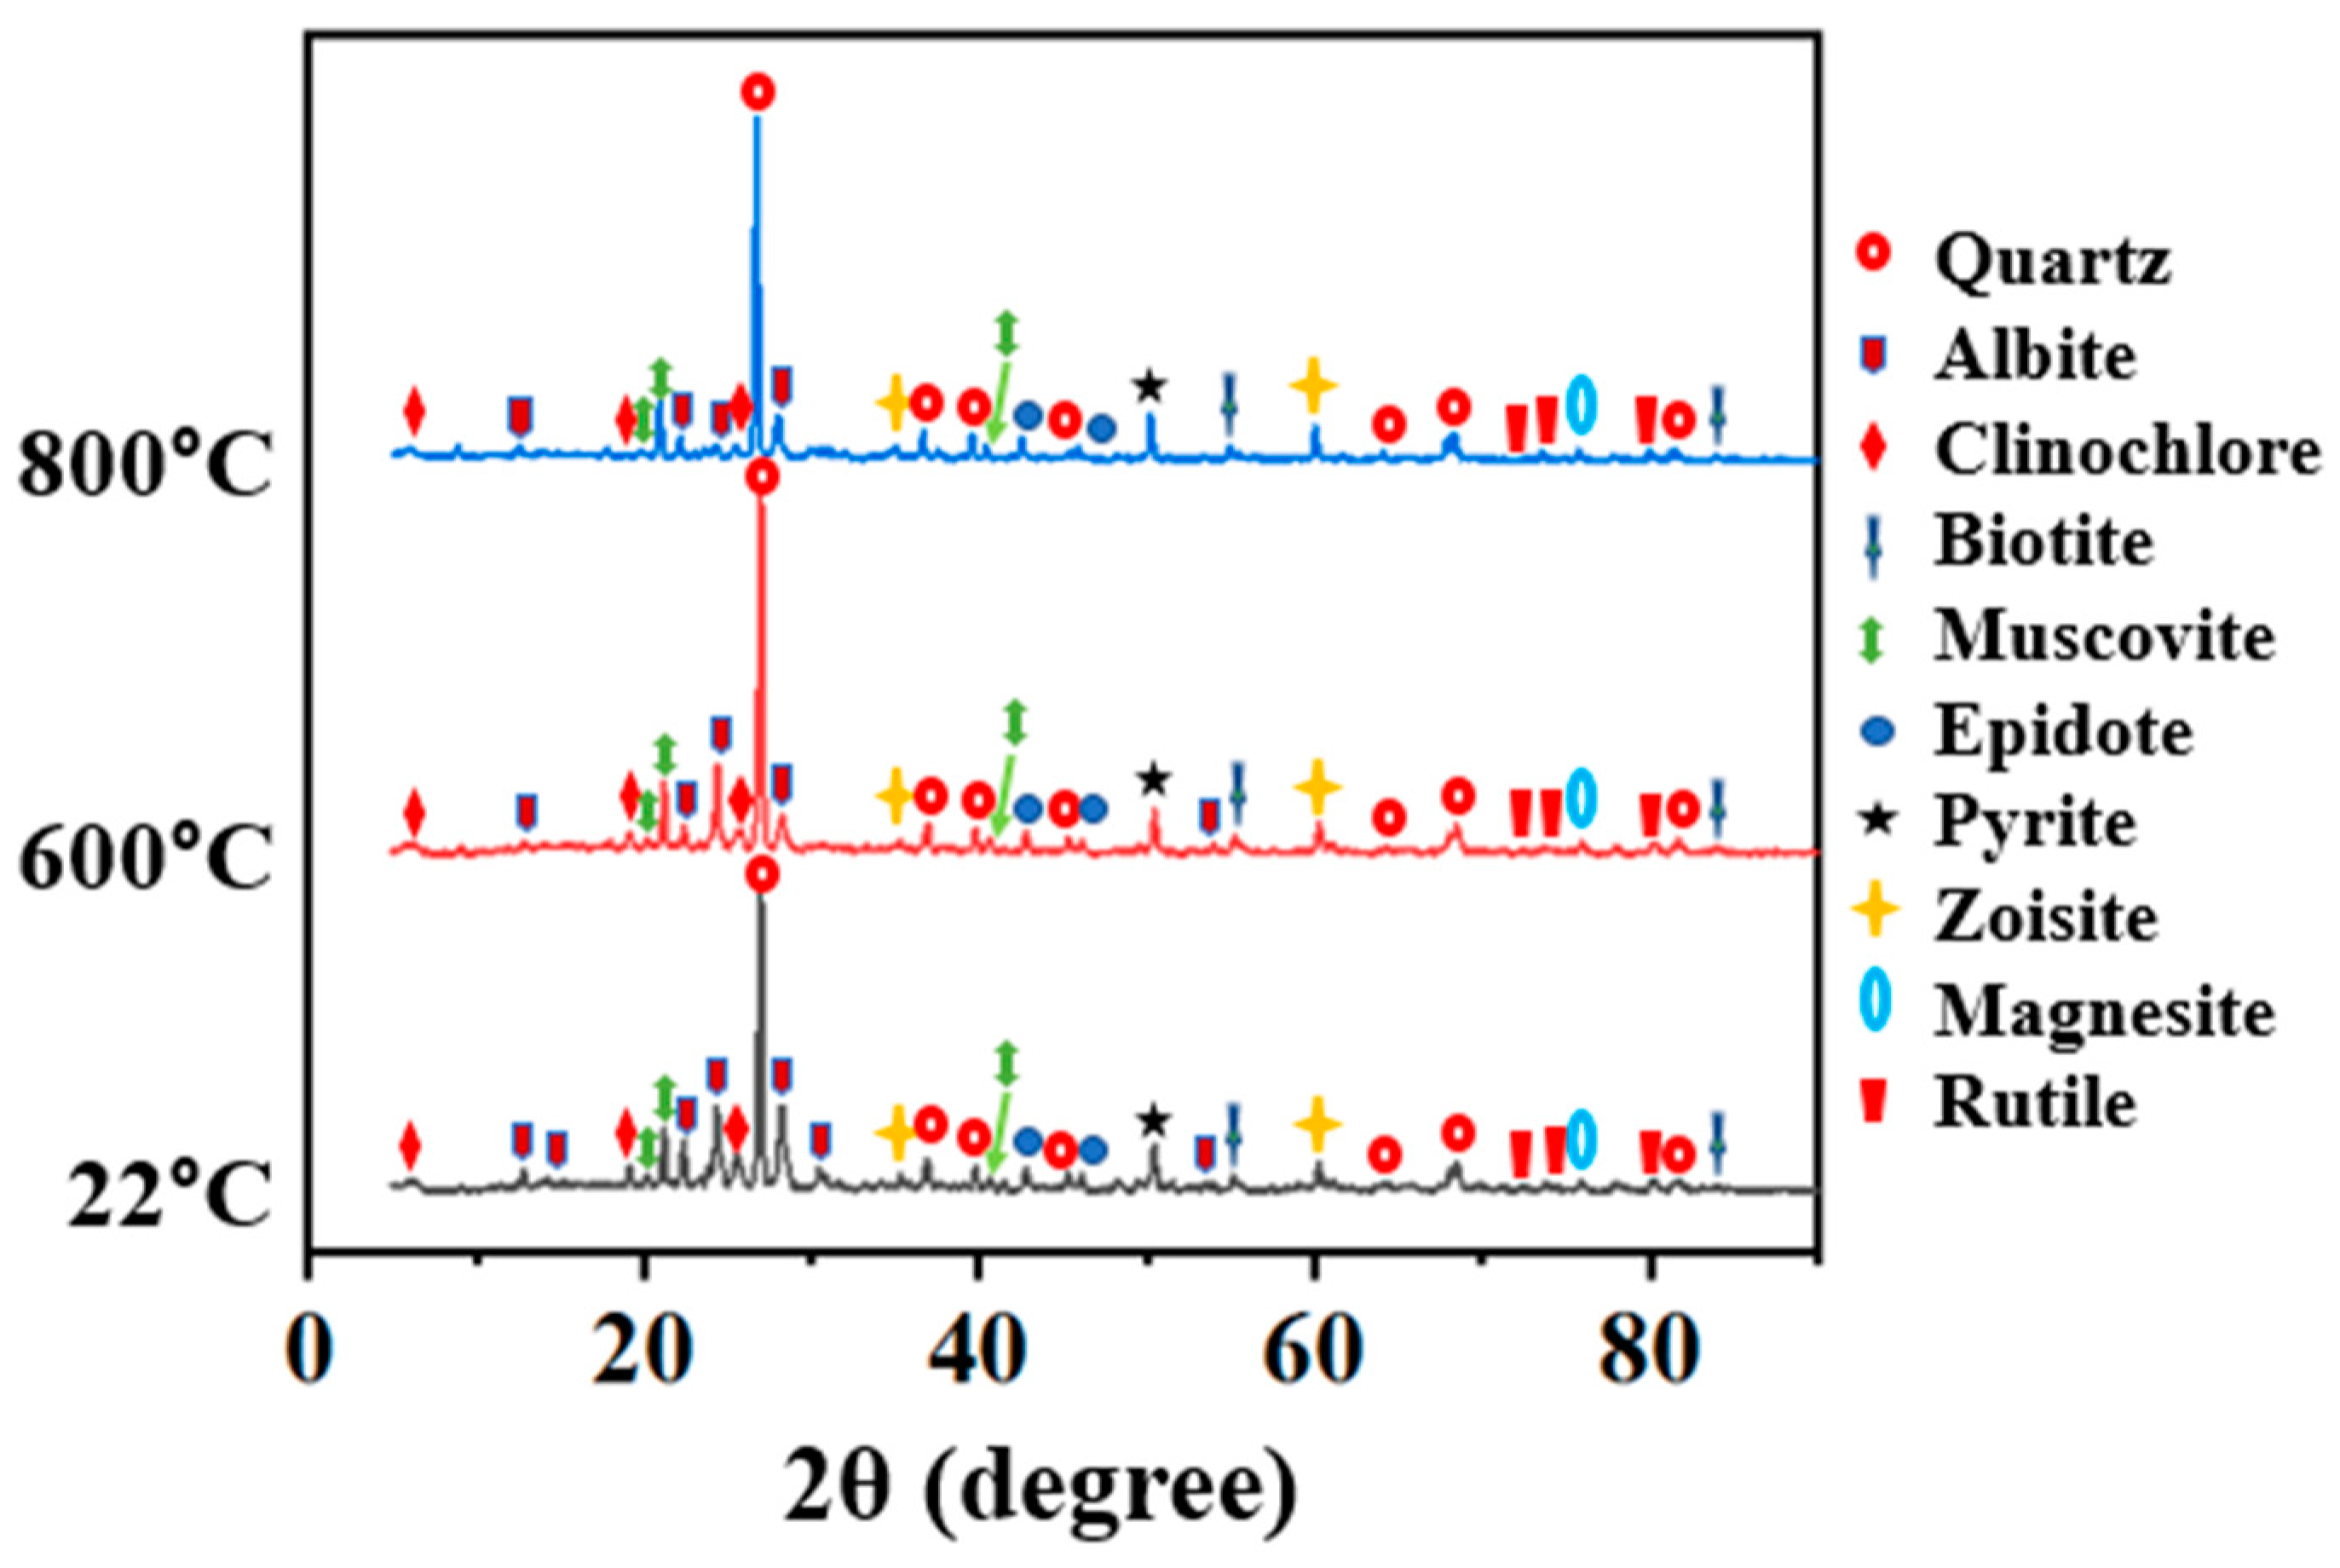
3.5. XRD Analysis
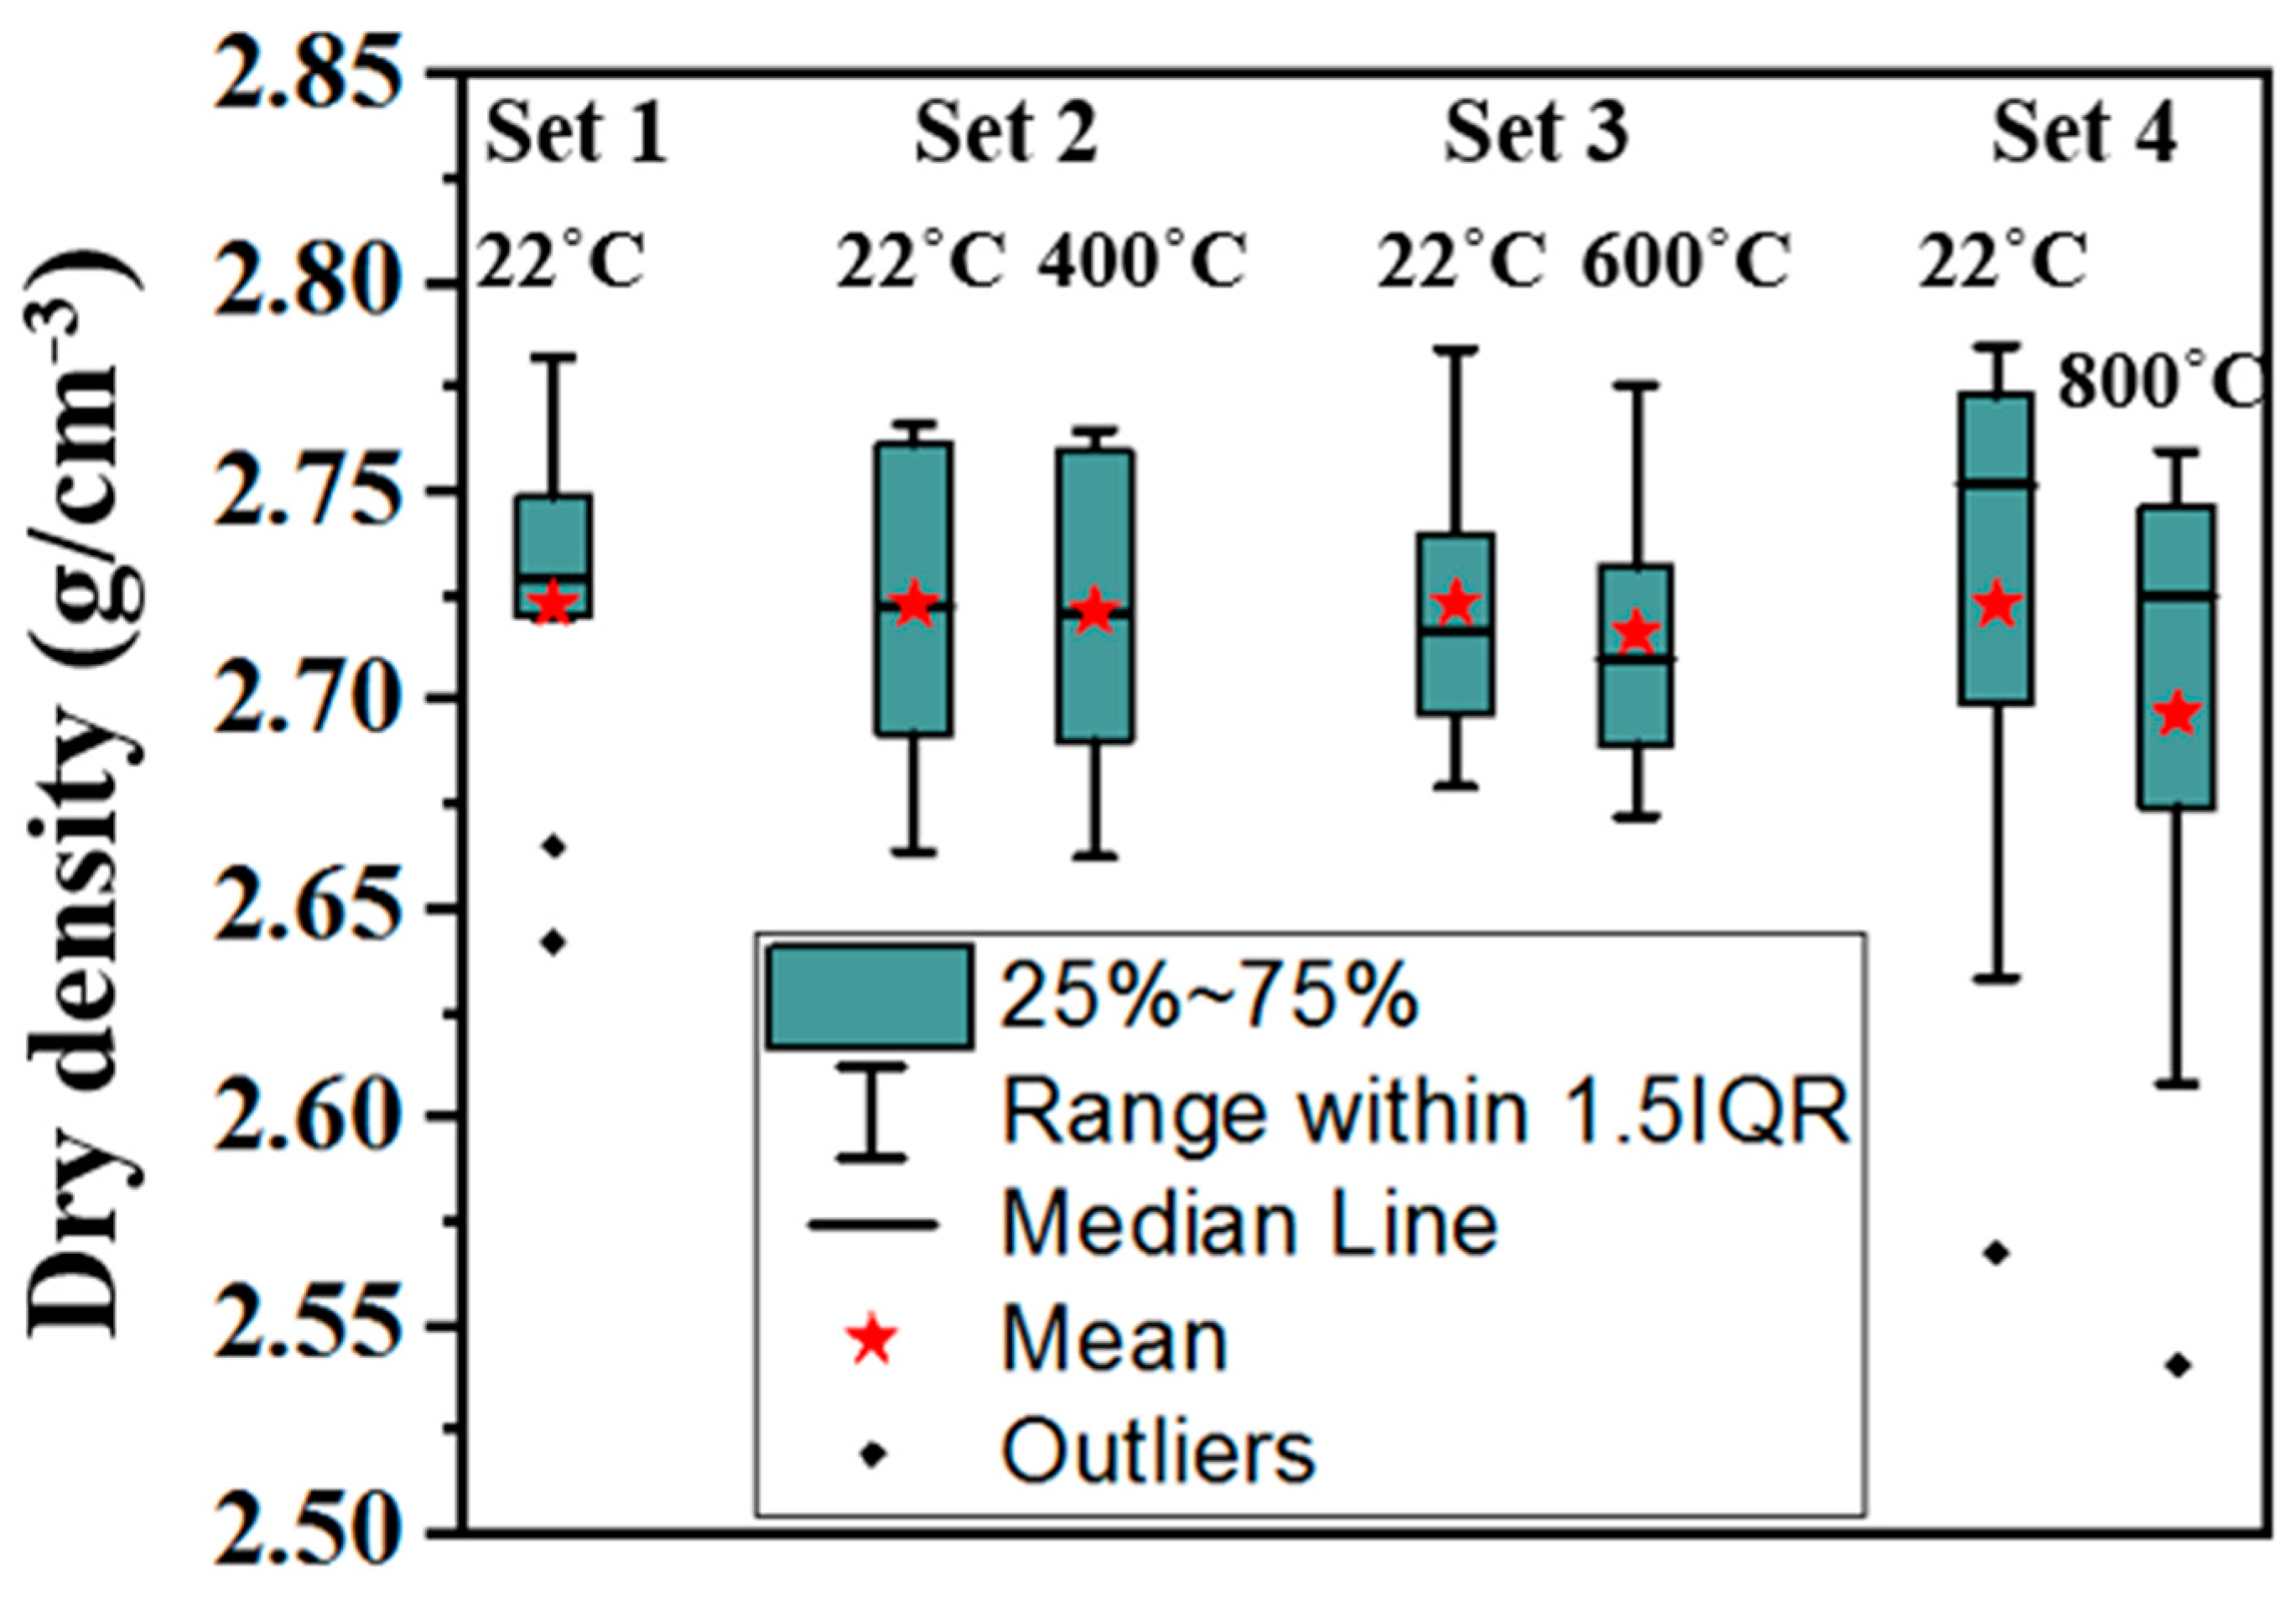
3.6. Dry Density
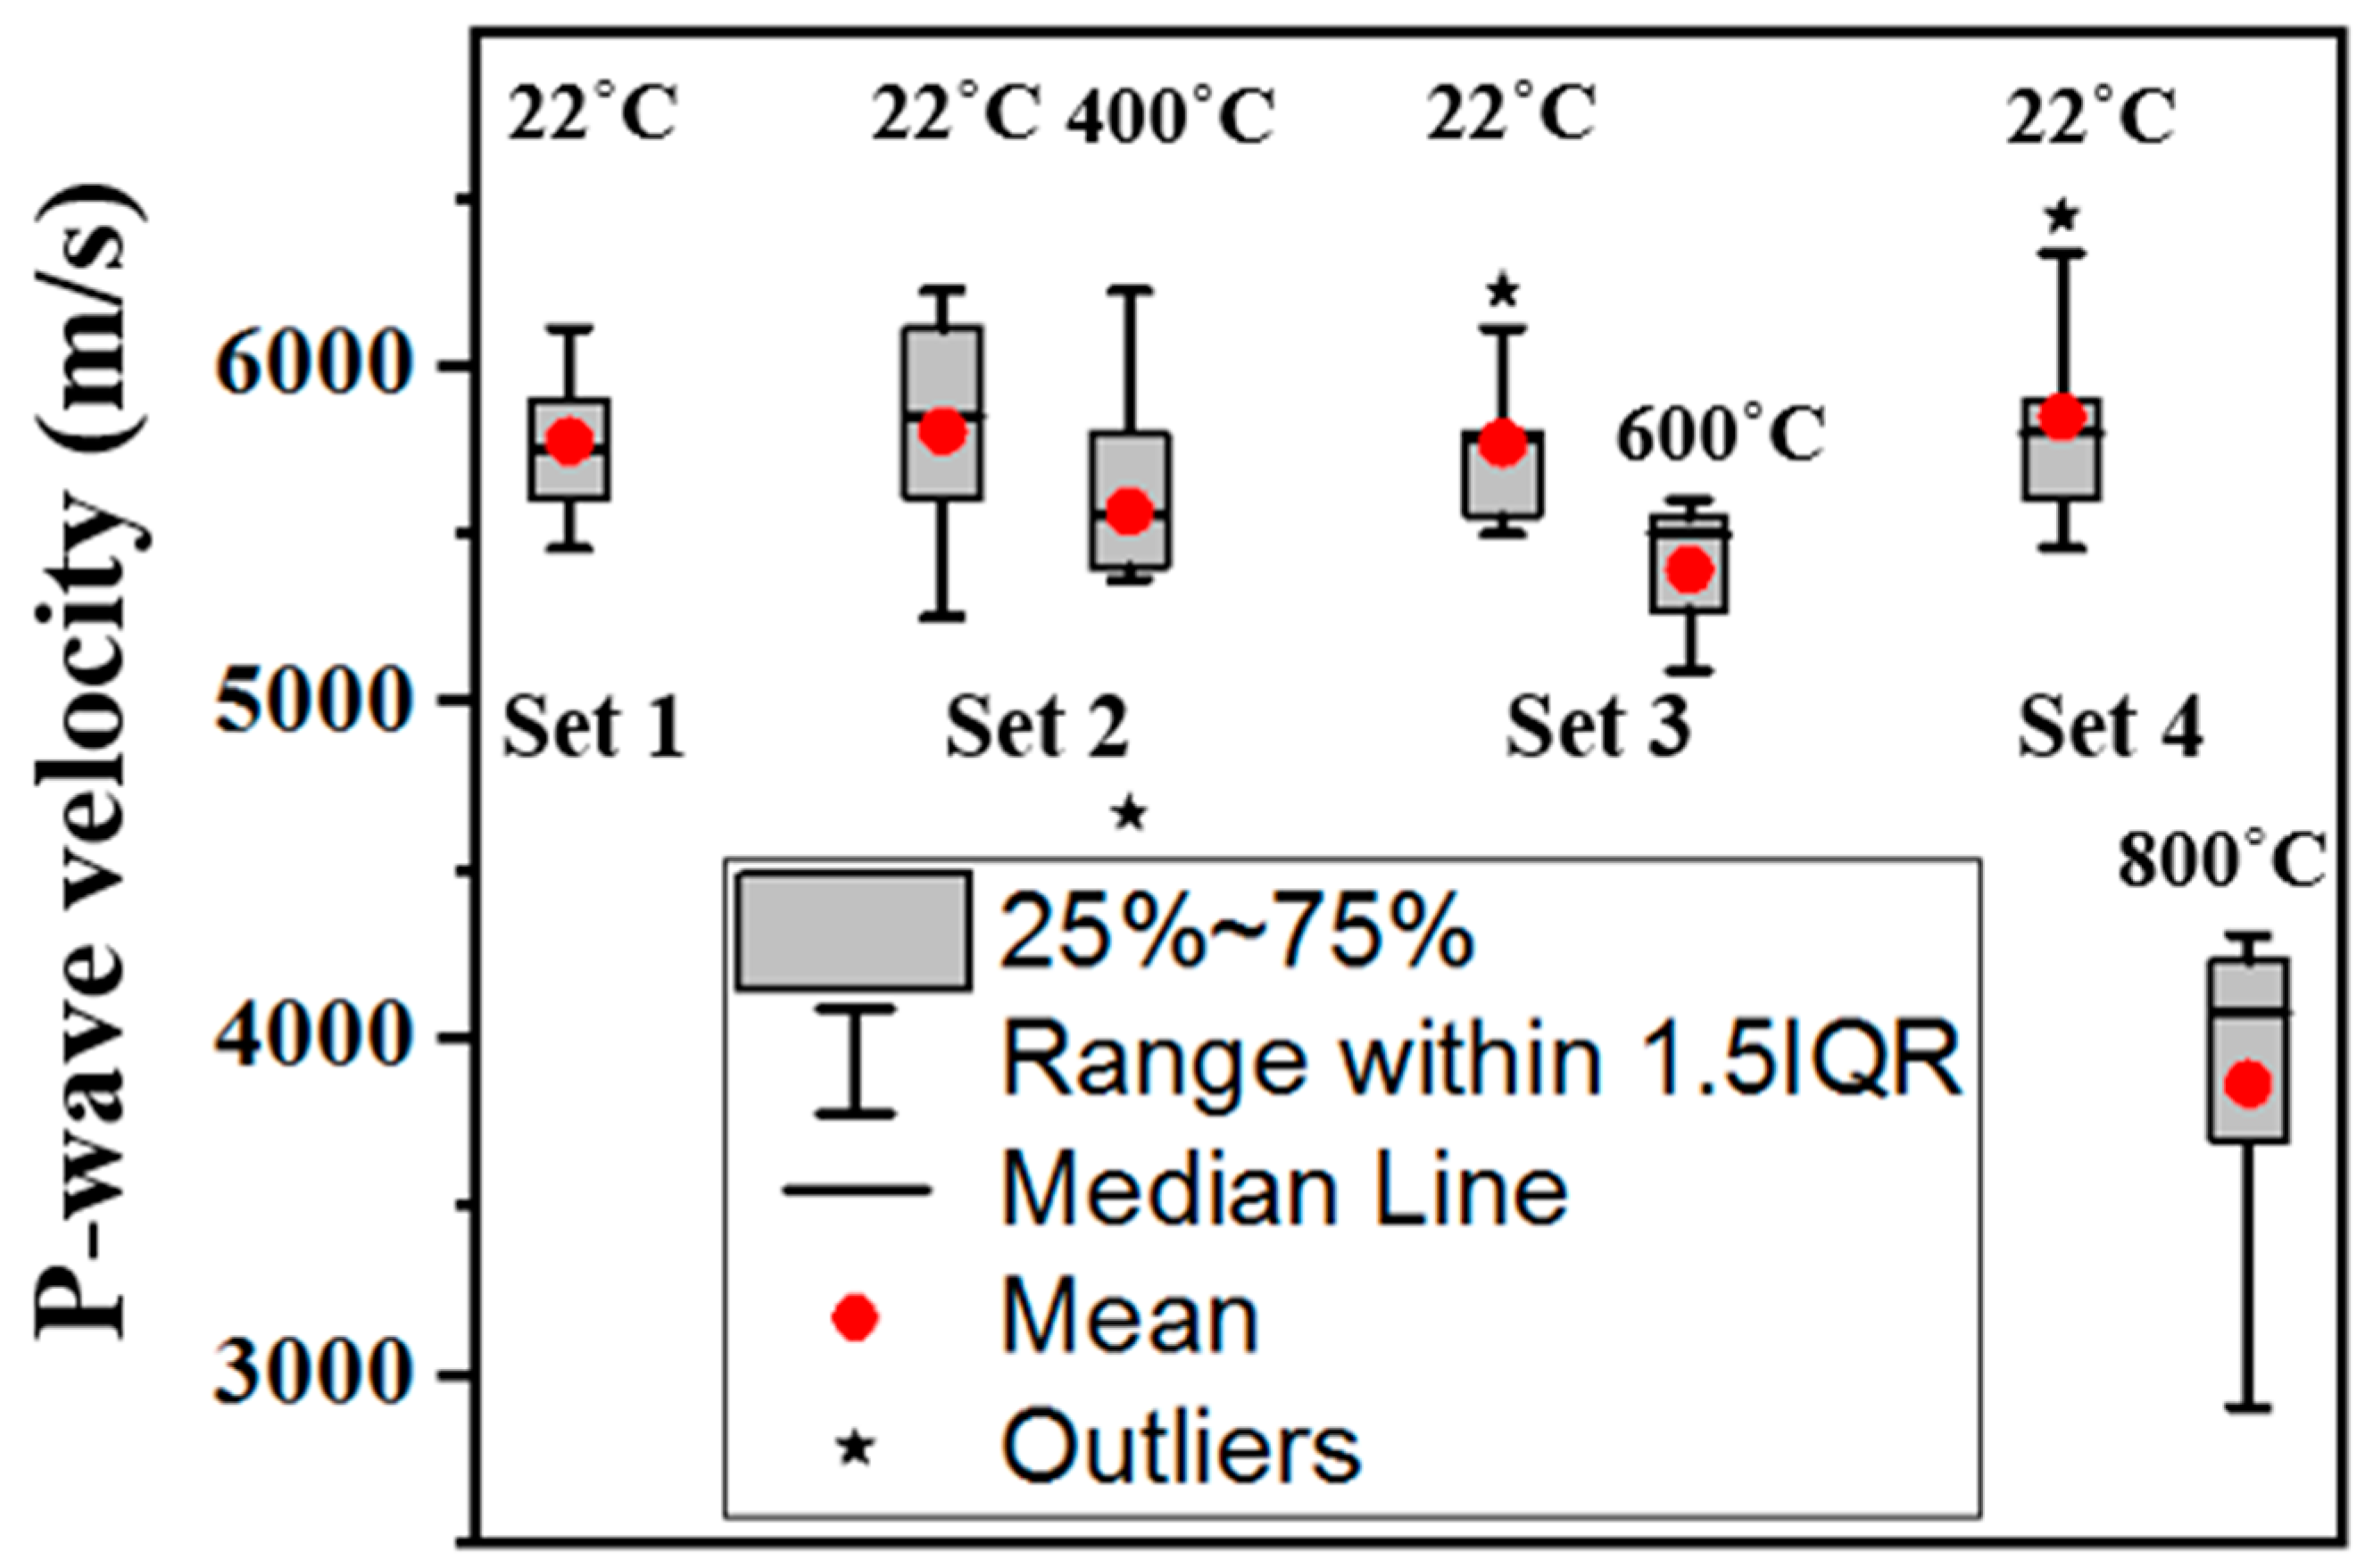
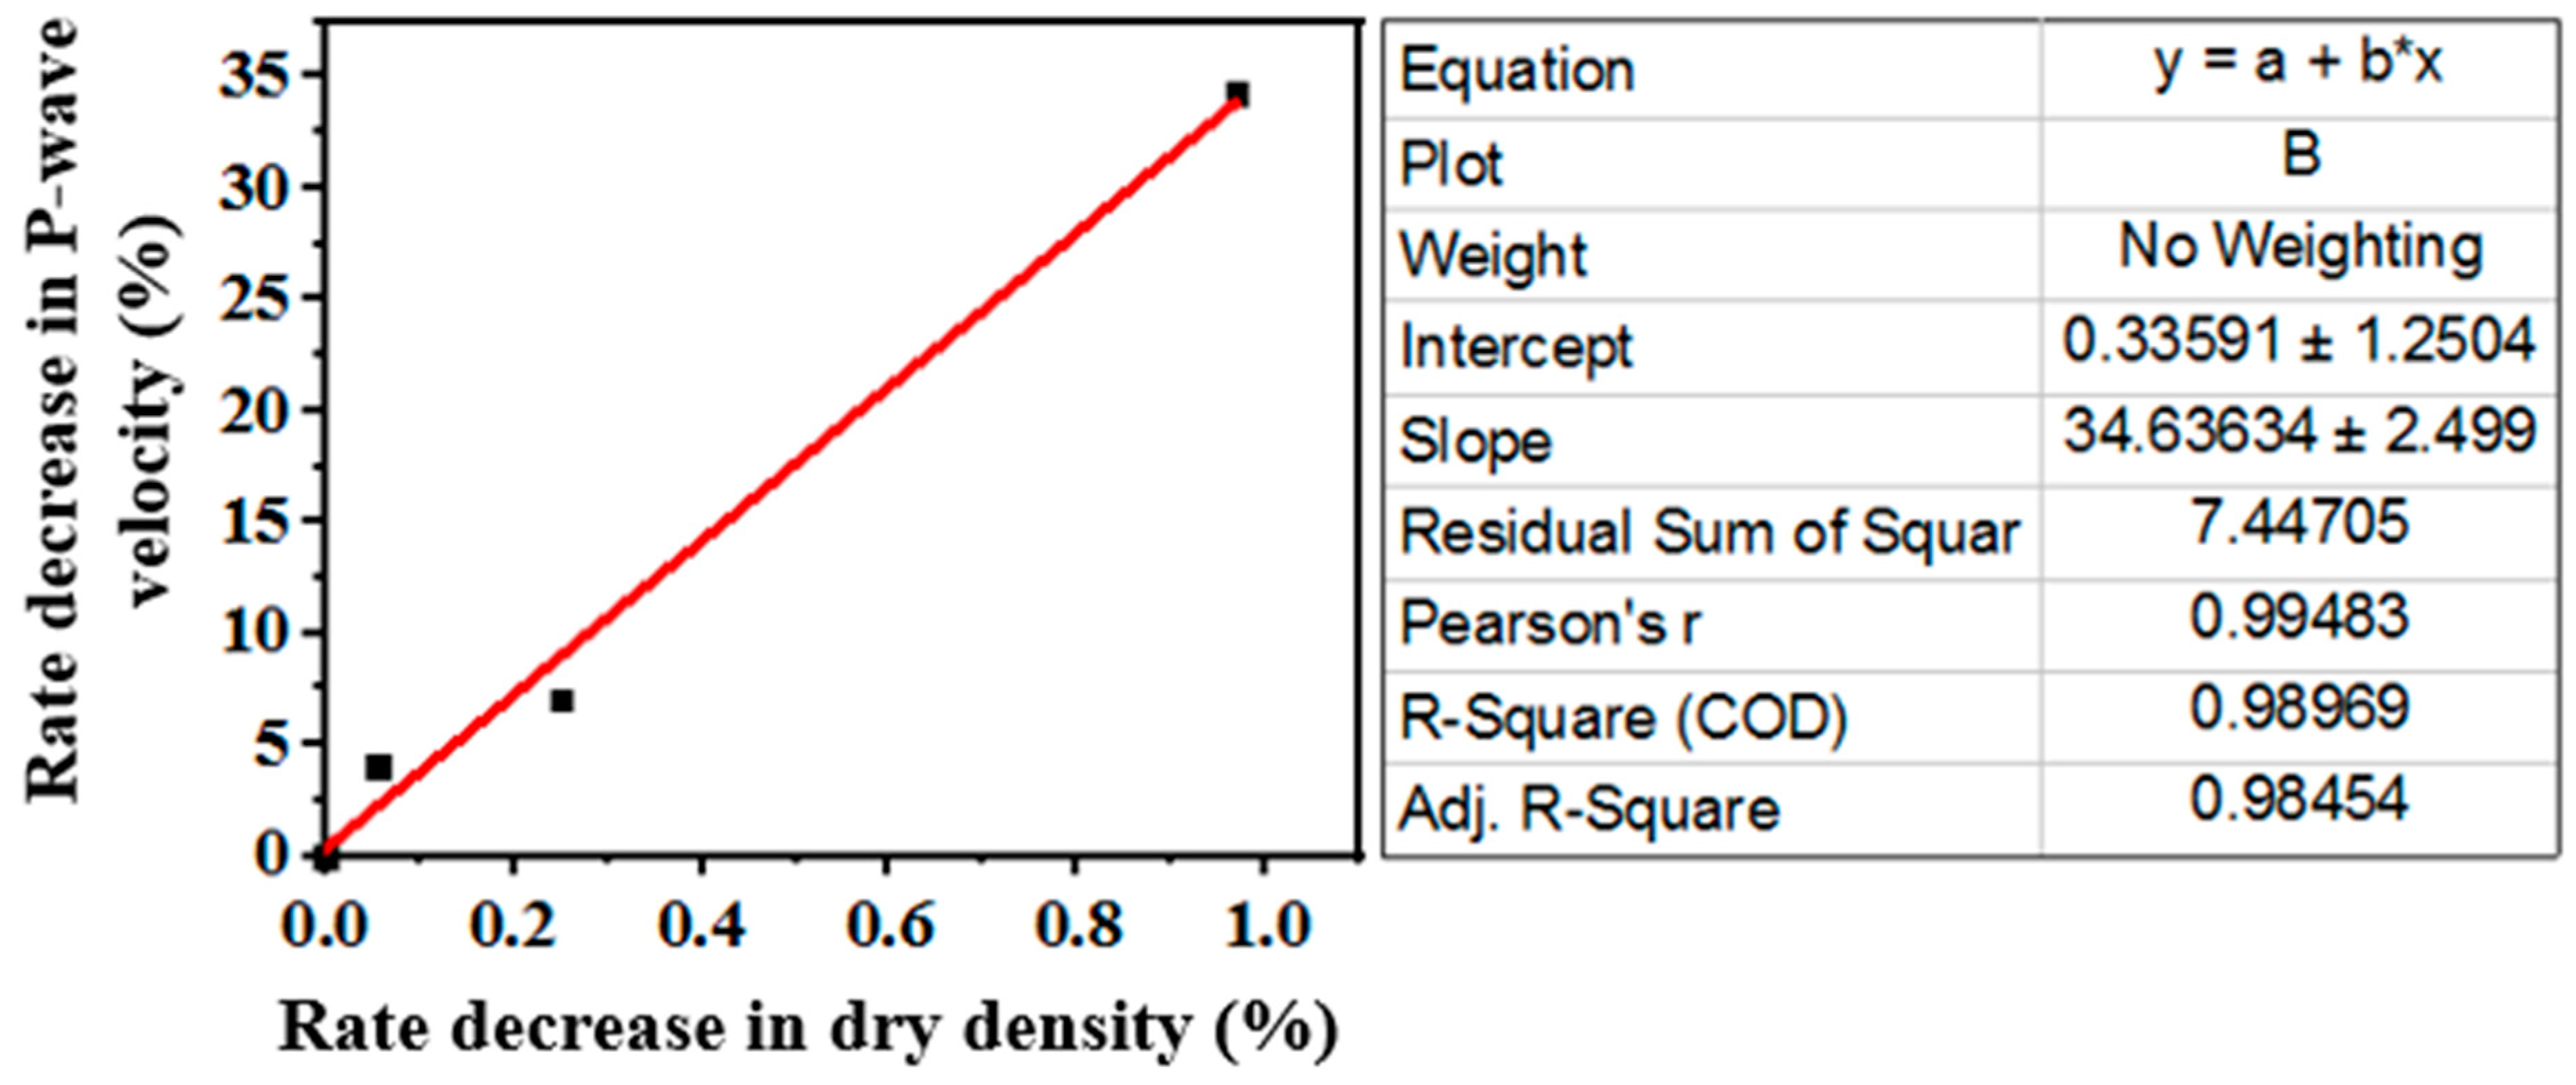
3.7. P-Wave Velocity
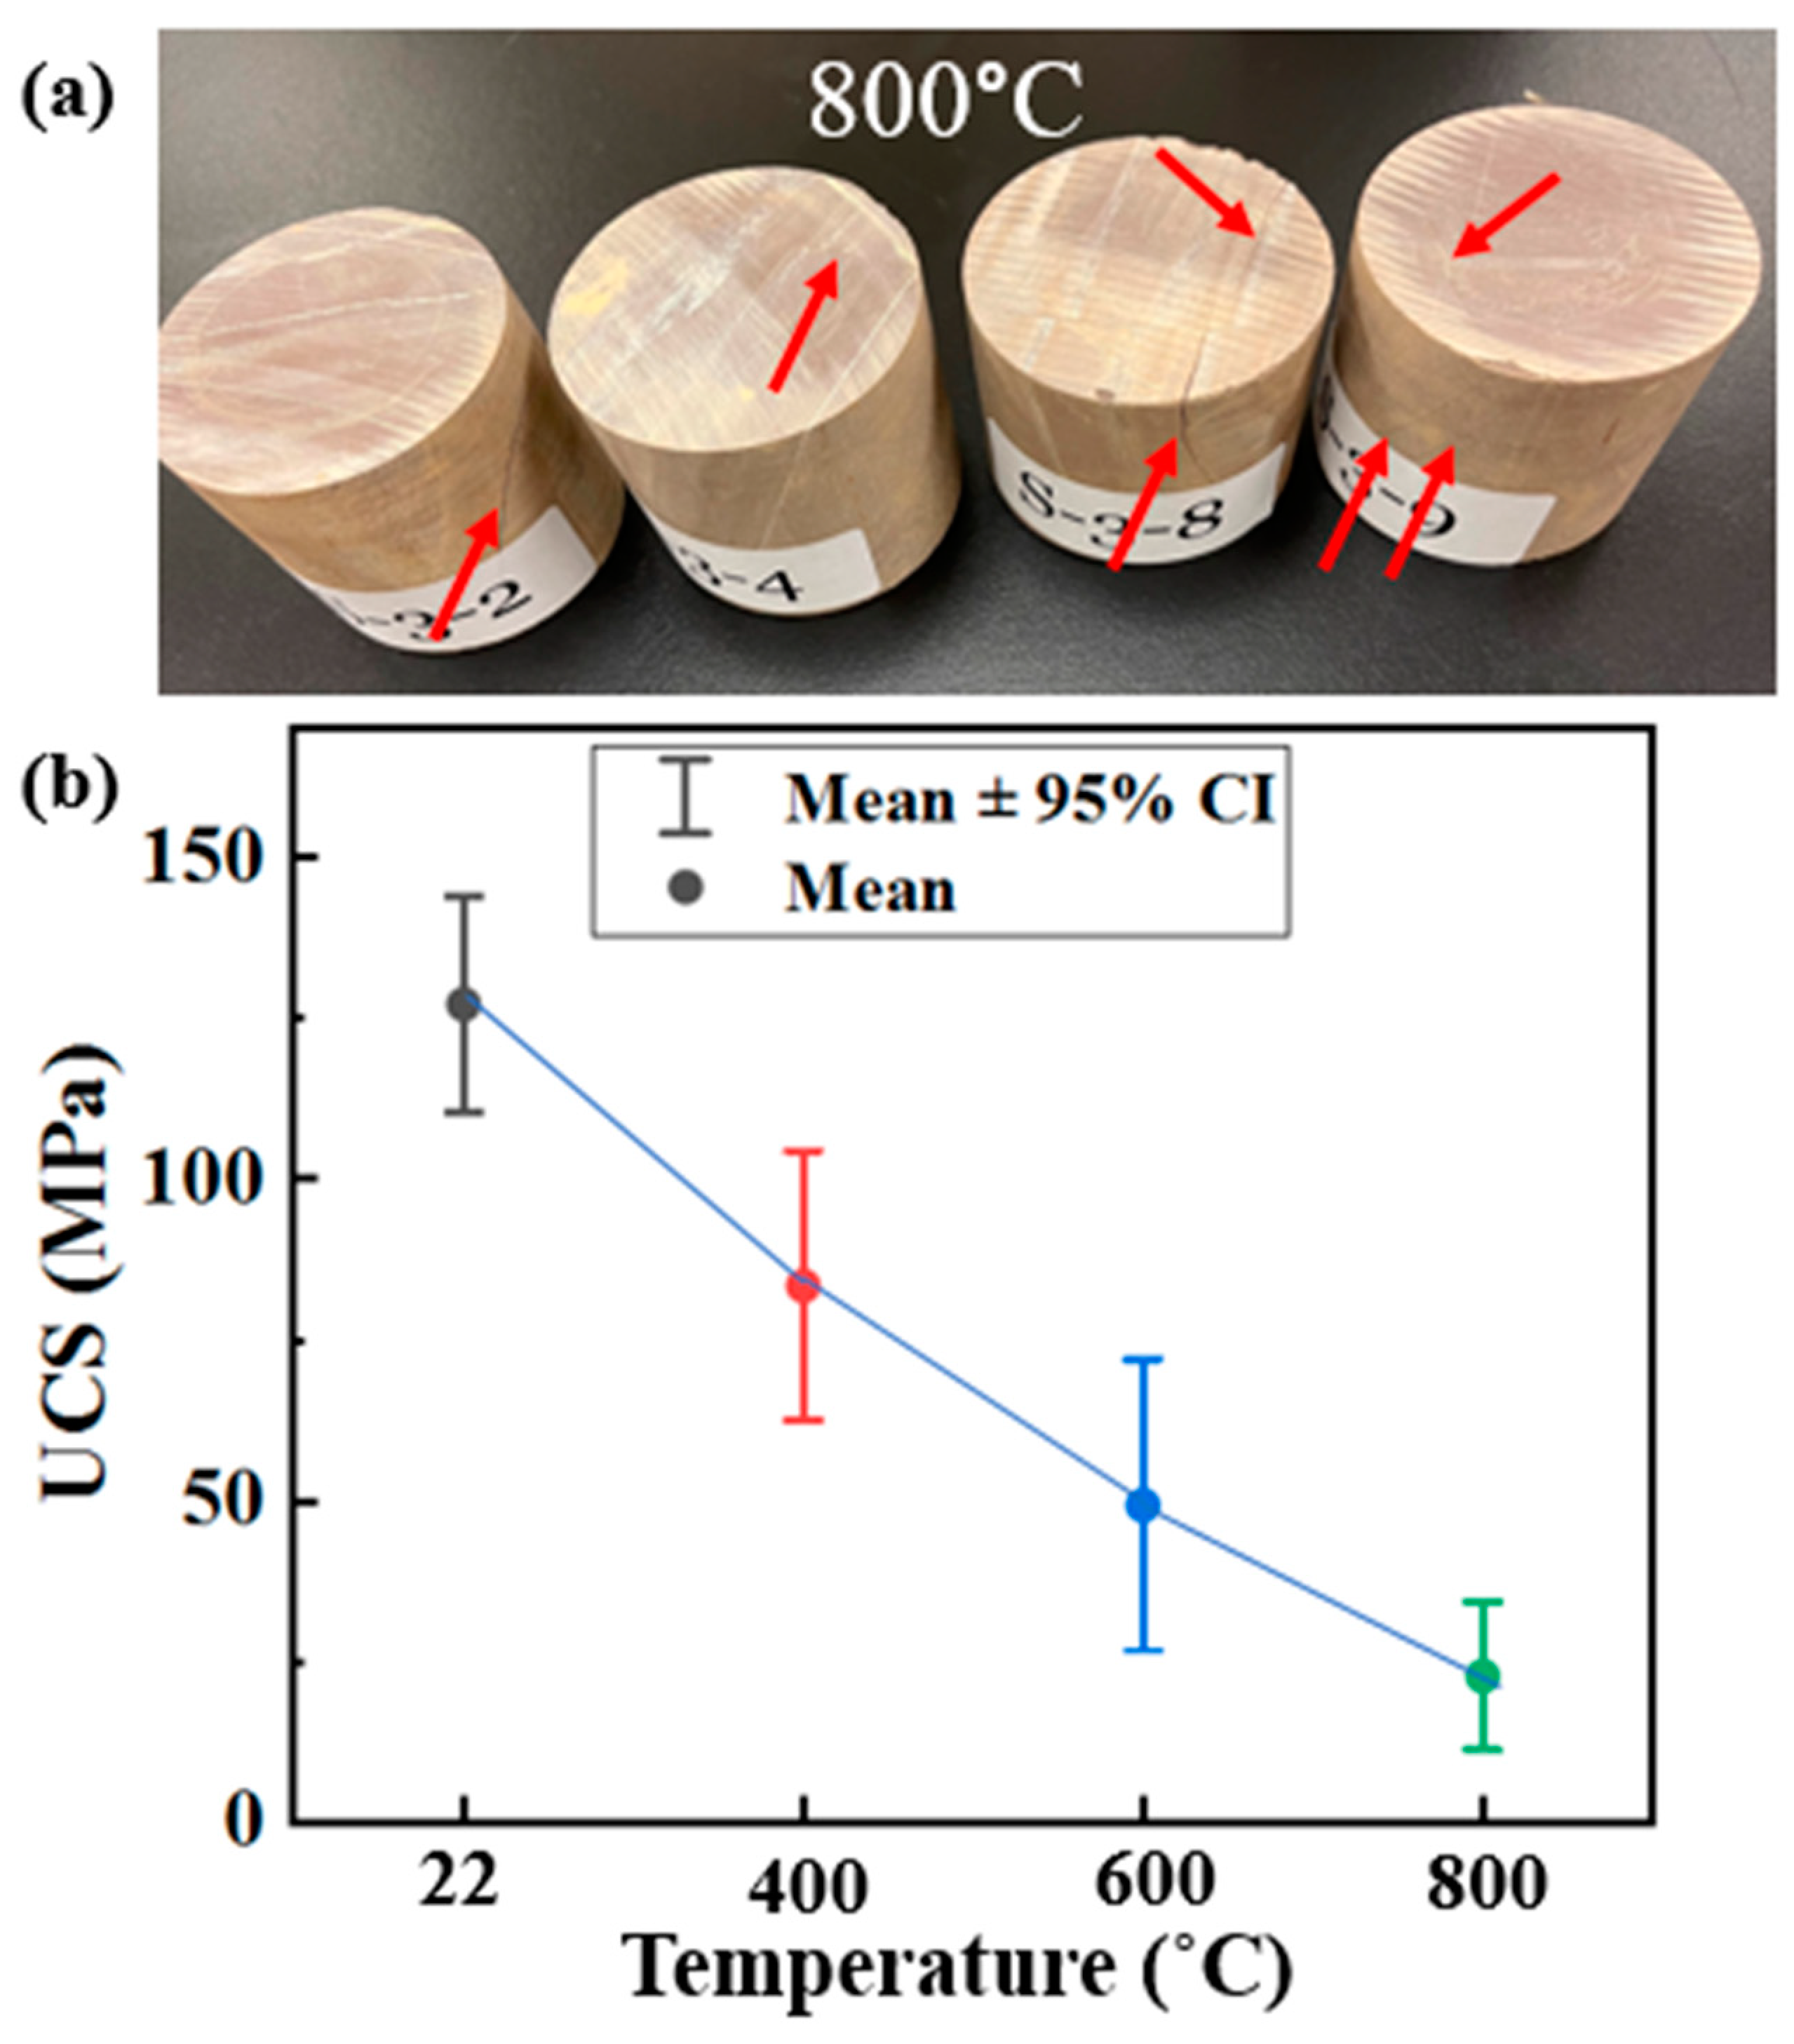
3.8. UCS
4. Practical Applications
5. Conclusions
Author Contributions
Funding
Institutional Review Board Statement
Informed Consent Statement
Data Availability Statement
Conflicts of Interest
References
- Zhu, Z.; Kempka, T.; Gamage, P.; Tian, H.; Jiang, G.; Dou, B.; Mei, G. Changes in thermomechanical properties due to air and water cooling of hot dry granite rocks under unconfined compression. Renew. Energy 2021, 170, 562–573. [Google Scholar] [CrossRef]
- Liu, X.; Yuan, S.; Sieffert, Y.; Fityus, S.; Buzzi, O. Changes in Mineralogy, Microstructure, Compressive Strength and Intrinsic Permeability of Two Sedimentary Rocks Subjected to High-Temperature Heating. Rock Mech. Rock Eng. 2016, 49, 2985–2998. [Google Scholar] [CrossRef]
- Luo, J.; Wang, L. High-Temperature Mechanical Properties of Mudstone in the Process of Underground Coal Gasification. Rock Mech. Rock Eng. 2011, 44, 749–754. [Google Scholar] [CrossRef]
- Gautam, P.K.; Verma, A.K.; Singh, T.N.; Hu, W.; Singh, K.H. Experimental investigations on the thermal properties of Jalore granitic rocks for nuclear waste repository. Thermochim. Acta 2019, 681, 1–13. [Google Scholar] [CrossRef]
- Huang, X.; Tang, S.B.; Tang, C.A.; Xie, L.M.; Tao, Z.Y. Numerical simulation of cracking behavior in artificially designed rock models subjected to heating from a central borehole. Int. J. Rock Mech. Min. Sci. 2017, 98, 191–202. [Google Scholar] [CrossRef]
- Moník, M.; Nerudová, Z.; Schnabl, P. Investigation of heat-treated artefacts from Pleistocene sites. J. Archaeol. Sci. Rep. 2021, 37, 1–13. [Google Scholar] [CrossRef]
- Delagnes, A.; Schmidt, P.; Douze, K.; Wurz, S.; Bellot-Gurlet, L.; Conard, J.N.; Nickel, G.K.; van Niekerk, L.K.; Henshilwood, S.C. Early Evidence for the Extensive Heat Treatment of Silcrete in the Howiesons Poort at Klipdrift Shelter (Layer PBD, 65 ka), South Africa. PLoS ONE 2016, 11, e0163874. [Google Scholar] [CrossRef]
- Hu, J.; Sun, Q.; Chen, S.; Zhang, W. The thermodynamic properties variation of cemented clay after treatment at high temperatures. Constr. Build. Mater. 2018, 182, 523–529. [Google Scholar] [CrossRef]
- Ozguven, A.; Ozcelik, Y. Investigation of some property changes of natural building stones exposed to fire and high heat. Constr. Build. Mater. 2013, 38, 813–821. [Google Scholar] [CrossRef]
- Wasantha, P.L.P.; Guerrieri, M.; Xu, T. Effects of tunnel fires on the mechanical behaviour of rocks in the vicinity—A review. Tunn. Undergr. Space Technol. 2021, 108, 1–17. [Google Scholar] [CrossRef]
- Jemmal, Y.; Zari, N.; Asbik, M.; Maaroufi, M. Experimental characterization and thermal performance comparison of six Moroccan rocks used as filler materials in a packed bed storage system. J. Energy Storage 2020, 30, 1–16. [Google Scholar] [CrossRef]
- Tiskatine, R.; Oaddi, R.; Ait El Cadi, R.; Bazgaou, A.; Bouirden, L.; Aharoune, A.; Ihlal, A. Suitability and characteristics of rocks for sensible heat storage in CSP plants. Sol. Energy Mater. Sol. Cells 2017, 169, 245–257. [Google Scholar] [CrossRef]
- El Alami, K.; Asbik, M.; Agalit, H. Identification of natural rocks as storage materials in thermal energy storage (TES) system of concentrated solar power (CSP) plants—A review. Sol. Energy Mater. Sol. Cells 2020, 217, 1–22. [Google Scholar] [CrossRef]
- Nahhas, T.; Py, X.; Sadiki, N. Experimental investigation of basalt rocks as storage material for high- temperature concentrated solar power plants. Renew. Sustain. Energy Rev. 2019, 110, 226–235. [Google Scholar] [CrossRef]
- Gautam, P.K.; Verma, A.K.; Jha, M.K.; Sharma, P.; Singh, T.N. Effect of high temperature on physical and mechanical properties of Jalore granite. J. Appl. Geophys. 2018, 159, 460–474. [Google Scholar] [CrossRef]
- Vázquez, P.; Shushakova, V.; Gómez-heras, M. Influence of mineralogy on granite decay induced by temperature increase: Experimental observations and stress simulation. Eng. Geol. 2015, 189, 58–67. [Google Scholar] [CrossRef]
- Lianying, Z.; Xianbiao, M.A.O.; Aihong, L.U. Experimental study on the mechanical properties of rocks at high temperature. Sci. China Ser. E Technol. Sci. 2009, 52, 641–646. [Google Scholar] [CrossRef]
- Lü, C.; Sun, Q.; Zhang, W.; Geng, J.; Qi, Y.; Lu, L. The effect of high temperature on tensile strength of sandstone. Appl. Therm. Eng. 2017, 111, 573–579. [Google Scholar] [CrossRef] [Green Version]
- Liu, S.; Xu, J. An experimental study on the physico-mechanical properties of two post-high-temperature rocks. Eng. Geol. 2015, 185, 63–70. [Google Scholar] [CrossRef]
- Mahanta, B.; Vishal, V.; Ranjith, P.G.; Singh, T.N. An insight into pore-network models of high-temperature heat-treated sandstones using computed tomography. J. Nat. Gas Sci. Eng. 2020, 77, 1–21. [Google Scholar] [CrossRef]
- Shen, Y.; Zhang, Y.-L.; Gao, F.; Yang, G.-S.; Lai, X.-P. Influence of Temperature on the Microstructure Deterioration of Sandstone. Energies 2018, 11, 1753. [Google Scholar] [CrossRef] [Green Version]
- Wei, S.; Yang, Y.; Su, C.; Cardosh, S.R.; Wang, H. Experimental Study of the E ff ect of High Temperature on the Mechanical Properties of Coarse Sandstone. Appl. Sci. 2019, 9, 2424. [Google Scholar] [CrossRef] [Green Version]
- Chen, Y.; Ni, J.; Shao, W.; Azzam, R. Experimental study on the influence of temperature on the mechanical properties of granite under uni-axial compression and fatigue loading. Int. J. Rock Mech. Min. Sci. 2012, 56, 62–66. [Google Scholar] [CrossRef]
- Xiao-li, X.; Zong-xin, K.; Ming, J.; Wen-xuan, G.; Jing, C. Research of microcosmic mechanism of brittle-plastic transition for granite under high temperature. Procedia Earth Planet. Sci. 2009, 1, 432–437. [Google Scholar] [CrossRef] [Green Version]
- Yang, J.; Fu, L.; Zhang, W.; Wang, Z. Mechanical property and thermal damage factor of limestone at high temperature. Int. J. Rock Mech. Min. Sci. 2019, 117, 11–19. [Google Scholar] [CrossRef]
- Yavuz, H.; Demirdag, S.; Caran, S. Thermal effect on the physical properties of carbonate rocks. Int. J. Rock Mech. Min. Sci. 2010, 47, 94–103. [Google Scholar] [CrossRef]
- Brotóns, V.; Tomás, R.; Ivorra, S.; Alarcón, J.C. Temperature influence on the physical and mechanical properties of a porous rock: San Julian’s calcarenite. Eng. Geol. 2013, 167, 117–127. [Google Scholar] [CrossRef]
- Peng, J.; Rong, G.; Cai, M.; Yao, M.; Zhou, C. Physical and mechanical behaviors of a thermal-damaged coarse marble under uniaxial compression. Eng. Geol. 2016, 200, 88–93. [Google Scholar] [CrossRef]
- Saiang, C.; Miskovsky, K. Effect of heat on the mechanical properties of selected rock types—A laboratory study. In Harmonising Rock Engineering and the Environment; Qian, Q., Zhou, Y., Eds.; Taylor & Francis Group: London, UK, 2012; pp. 815–820. ISBN 978-0-415-80444-8. [Google Scholar] [CrossRef]
- Walsh, S.D.C.; Lomov, I.N. Micromechanical modeling of thermal spallation in granite rock. Int. J. Heat Mass Transf. 2013, 65, 366–373. [Google Scholar] [CrossRef]
- Hu, J.; Xie, H.; Sun, Q.; Li, C.; Liu, G. Changes in the thermodynamic properties of alkaline granite after cyclic quenching following high temperature action. Int. J. Min. Sci. Technol. 2021, 31, 843–852. [Google Scholar] [CrossRef]
- Takarli, M.; Prince, W.; Siddique, R. Damage in granite under heating/cooling cycles and water freeze-thaw condition. Int. J. Rock Mech. Min. Sci. 2008, 45, 1164–1175. [Google Scholar] [CrossRef]
- Luc Leroy, M.N.; Marius, F.W.; François, N. Experimental and Theoretical Investigations of Hard Rocks at High Temperature: Applications in Civil Engineering. Adv. Civ. Eng. 2021, 2021, 8893944. [Google Scholar] [CrossRef]
- Li, J.; Du, Z.W.; Guo, Z.P. Effect of High Temperature (600 °C) on Mechanical Properties, Mineral Composition, and Microfracture Characteristics of Sandstone. Adv. Mater. Sci. Eng. 2020, 2020, 5072534. [Google Scholar] [CrossRef]
- Rathnaweera, T.D.; Ranjith, P.G.; Gu, X.; Perera, M.S.A.; Kumari, W.G.P.; Wanniarachchi, W.A.M.; Haque, A.; Li, J.C. Experimental investigation of thermomechanical behaviour of clay-rich sandstone at extreme temperatures followed by cooling treatments. Int. J. Rock Mech. Min. Sci. 2018, 107, 208–223. [Google Scholar] [CrossRef]
- González-Gómez, W.S.; Quintana, P.; May-Pat, A.; Avilés, F.; May-Crespo, J.; Alvarado-Gil, J.J. Thermal effects on the physical properties of limestones from the Yucatan Peninsula. Int. J. Rock Mech. Min. Sci. 2015, 75, 182–189. [Google Scholar] [CrossRef]
- Keppert, M.; Fořt, J.; Trník, A.; Koňáková, D.; Vejmelková, E.; Pokorný, J.; Svora, P.; Pavlík, Z.; Černý, R. Behavior of Sandstones Under Heat Treatment. Int. J. Thermophys. 2017, 38, 1–9. [Google Scholar] [CrossRef]
- ASTM. D4543 Standard Practices for Preparing Rock Core as Cylindrical Test Specimens and Verifying Conformance to Dimensional and Shape Tolerances; ASTM: West Conshohocken, PA, USA, 2008. [Google Scholar]
- ASTM. D5731—08, Standard Test Method for Determination of the Point Load Strength Index of Rock and Application to Rock Strength Classifications; ASTM: West Conshohocken, PA, USA, 2008. [Google Scholar]
- Zhang, X.; Ngai, L.W.Y.; Wang, S.; Han, G. Engineering properties of quartz mica schist. Eng. Geol. 2011, 121, 135–149. [Google Scholar] [CrossRef]
- Adewuyi, S.O.; Ahmed, H.A.M. Grinding Behaviour of Microwave-Irradiated Mining Waste. Energies 2021, 14, 3991. [Google Scholar] [CrossRef]
- Mengting, Z.; Kurniawan, T.A.; Yanping, Y.; Dzarfan Othman, M.H.; Avtar, R.; Fu, D.; Hwang, G.H. Fabrication, characterization, and application of ternary magnetic recyclable Bi2WO6/BiOI@Fe3O4 composite for photodegradation of tetracycline in aqueous solutions. J. Environ. Manage. 2020, 270, 1–11. [Google Scholar] [CrossRef]
- Dong, C. PowderX: Windows-95-based program for powder X-ray diffraction data processing. J. Appl. Cryst. 1991, 32, 838. [Google Scholar] [CrossRef]
- Zhu, Z.; Tian, H.; Jiang, G.; Dou, B. Effects of high temperature on rock bulk density. Geomech. Geoengin. 2020, 1–11. [Google Scholar] [CrossRef]
- Gomah, M.E.; Li, G.; Bader, S.; Elkarmoty, M.; Ismael, M. Damage evolution of granodiorite after heating and cooling treatments. Minerals 2021, 11, 779. [Google Scholar] [CrossRef]
- Li, X.; Huang, S.; Yin, T.; Li, X.; Peng, K.; Fan, X.; Dang, W.; Huang, L. Dynamic properties of thermal shock treated sandstone subjected to coupled dynamic and static loads. Minerals 2021, 11, 889. [Google Scholar] [CrossRef]
- Li, Z.; Wong, L.N.Y.; Teh, C.I. Low cost colorimetry for assessment of fire damage in rock. Eng. Geol. 2017, 228, 50–60. [Google Scholar] [CrossRef]
- Saeed, A.; Adewuyi, S.O.; Ahmed, H.A.M.; Alharbi, S.R.; AlGarni, S.E. Electric and Dielectric Properties of the Natural Calcite and Quartz. Silicon 2021, 1–12. [Google Scholar] [CrossRef]
- Vidana Pathiranagei, S.; Gratchev, I.; Kong, R. Engineering properties of four different rocks after heat treatment. Geomech. Geophys. Geo-Energy Geo-Resour. 2021, 7, 1–21. [Google Scholar] [CrossRef]
- Fiquet, G.; Guyot, F.; Kunz, M.; Matas, J.; Andrault, D.; Hanfland, M. Structural refinements of magnesite at very high pressureSample: P = 56.6 GPa. Am. Mineral. 2002, 87, 1261–1265. [Google Scholar] [CrossRef]
- Choi, H.; Seo, J.Y.; Uhm, Y.R.; Sun, G.M.; Kim, C.S. Crystalline structure and magnetic properties of pyrite FeS2. AIP Adv. 2021, 11, 9–14. [Google Scholar] [CrossRef]
- Tang, Z.C.; Sun, M.; Peng, J. Influence of high temperature duration on physical, thermal and mechanical properties of a fine-grained marble. Appl. Therm. Eng. 2019, 156, 34–50. [Google Scholar] [CrossRef]
- Sun, H.; Sun, Q.; Deng, W.; Zhang, W.; Lü, C. Temperature effect on microstructure and P-wave propagation in Linyi sandstone. Appl. Therm. Eng. 2017, 115, 913–922. [Google Scholar] [CrossRef]
- Becattini, V.; Motmans, T.; Zappone, A.; Madonna, C.; Haselbacher, A.; Steinfeld, A. Experimental investigation of the thermal and mechanical stability of rocks for high-temperature thermal-energy storage. Appl. Energy 2017, 203, 373–389. [Google Scholar] [CrossRef]
- Haghighat, A.; Luxbacher, K. Determination of critical parameters in the analysis of road tunnel fires. Int. J. Min. Sci. Technol. 2019, 29, 187–198. [Google Scholar] [CrossRef]
- Wang, Y.; Wu, J.; Huang, Z.; Jiang, J.; Yuan, G.; Zhang, Y. Experimental studies on continuous reinforced concrete slabs under single and multi-compartment fires with cooling phase. Fire Saf. J. 2020, 111, 2–25. [Google Scholar] [CrossRef]
- Zhang, Z.-X. Effect of Temperature on Rock Fracture. In Rock Fracture and Blasting: Theory and Applications; Butterworth-Heinemann: Oxford, UK, 2016; pp. 111–133. [Google Scholar]
- Lee, C.; Nguyen, V. A study on the fire propagation characteristics in large-opening multi-level limestone mines in Korea. Geosyst. Eng. 2016, 19, 317–336. [Google Scholar] [CrossRef]
- Hansen, R. Fire behavior of mining vehicles in underground hard rock mines. Int. J. Min. Sci. Technol. 2017, 27, 627–634. [Google Scholar] [CrossRef]
- Hansen, R.; Ingason, H. Full-Scale Fire Experiments with Mining Vehicles in an Underground Mine; Mälardalen University: Västerås, Sweden, 2013. [Google Scholar]
- UNDP; UN-Environment. Managing Mining for Sustainable Development: A Sourcebook; Quan, A., Ed.; United Nations Development Programme: Bangkok, Thailand, 2018; ISBN 978-974-680-421-9. [Google Scholar]
- Fei, T.; Antonio, B. Effect of temperature on deep lined circular tunnels in transversely anisotropic elastic rock. Undergr. Space 2016, 1, 79–93. [Google Scholar] [CrossRef]
- Sipilä, J.; Auerkari, P.; Heikkilä, A.-M.; Tuominen, R.; Vela, I.; Itkonen, J.; Rinne, M.; Aaltonen, K. Risk and mitigation of self-heating and spontaneous combustion in underground coal storage. J. Loss Prev. Process Ind. 2012, 25, 617–622. [Google Scholar] [CrossRef]


| Sample | Elements (Atomic %) | |||||||||
|---|---|---|---|---|---|---|---|---|---|---|
| C | O | Na | Mg | Al | Si | S | K | Ca | Fe | |
| S1 (22 °C) | 8.58 | 64.88 | 2.40 | 0.34 | 4.43 | 16.91 | - | 0.37 | 0.69 | 1.39 |
| S2 (600 °C) | 17.67 | 58.69 | 0.61 | 0.27 | 4.15 | 15.11 | 0.43 | 1.05 | 0.32 | 1.71 |
| S3 (800 °C) | 10.31 | 60.43 | 2.23 | 0.21 | 3.78 | 19.91 | 0.29 | 0.46 | 0.86 | 1.52 |
| Mineral Phase | Chemical Formula | Crystallite Size (Å) | Weight (%) | Registration Number |
|---|---|---|---|---|
| Quartz (low) | SiO2 | 413.8 | 57.3 | 96-101-1160 |
| Muscovite | H4K2 (Al, Fe)6 Si6O24 | 382.9 | 11.4 | 96-901-6413 |
| Rutile | TiO2 | 527.4 | 7.5 | 96-900-4145 |
| Albite | Na (AlSi3O8) | 670.7 | 6.9 | 96-900-0587 |
| Clinochlore | Mg5Al (Si3Al) O10(OH)8 | 332.6 | 5.9 | 96-900-8043 |
| Zoisite | Ca2 Al3 (SiO4) (Si2O7) O(OH) | 336.7 | 4.8 | 96-901-4730 |
| Biotite | Al Fe k Mg2 O12 Si3 | 320.3 | 3.6 | 96-900-1267 |
| Epidote | Ca2 (Al2Fe) (SiO4) (Si2O7) O(OH) | 311.2 | 1.0 | 96-900-0039 |
| Magnesite | MgCO3 | 316.2 | 0.9 | 96-900-2816 |
| Pyrite | FeS2 | 402.4 | 0.7 | 96-901-5843 |
Publisher’s Note: MDPI stays neutral with regard to jurisdictional claims in published maps and institutional affiliations. |
© 2021 by the authors. Licensee MDPI, Basel, Switzerland. This article is an open access article distributed under the terms and conditions of the Creative Commons Attribution (CC BY) license (https://creativecommons.org/licenses/by/4.0/).
Share and Cite
Ahmed, H.M.; Ahmed, H.A.M.; Adewuyi, S.O. Characterization of Microschist Rocks under High Temperature at Najran Area of Saudi Arabia. Energies 2021, 14, 7612. https://doi.org/10.3390/en14227612
Ahmed HM, Ahmed HAM, Adewuyi SO. Characterization of Microschist Rocks under High Temperature at Najran Area of Saudi Arabia. Energies. 2021; 14(22):7612. https://doi.org/10.3390/en14227612
Chicago/Turabian StyleAhmed, Haitham M., Hussin A. M. Ahmed, and Sefiu O. Adewuyi. 2021. "Characterization of Microschist Rocks under High Temperature at Najran Area of Saudi Arabia" Energies 14, no. 22: 7612. https://doi.org/10.3390/en14227612