Article

Brain Response and Reaction Time in Natural and Comfort Conditions, with Energy-Saving Potential in an Office Environment

by
Wiwik Budiawan
1,2,
Hirotake Sakakibara
3 and
Kazuyo Tsuzuki
1,4,*
1
Department of Architecture and Civil Engineering, Toyohashi University of Technology, Toyohashi 441-8580, Japan
2
Department of Industrial Engineering, Faculty of Engineering, Diponegoro University, Semarang 50275, Indonesia
3
Nippon Jogesuido Sekkei Co., Ltd., Nagoya 460-0022, Japan
4
Department of Architecture, Faculty of Environmental & Urban Engineering, Kansai University, Suita 564-8680, Japan
*
Author to whom correspondence should be addressed.
Energies 2021, 14(22), 7598; https://doi.org/10.3390/en14227598
Submission received: 10 October 2021 / Revised: 8 November 2021 / Accepted: 9 November 2021 / Published: 13 November 2021
(This article belongs to the Special Issue Thermal Comfort and Energy Use in Buildings)

Abstract

:
Psychological adaptation to ambient temperatures is fascinating and critical, both theoretically and practically, for energy efficiency in temperate climates. In this study, we investigated and compared the brain response (event-related potentials with a late positive component and latency ~300 milliseconds; labeled “P300” in the present study) and reaction times of Indonesian participants (n = 11), as tropical natives living in Japan, and Japanese participants (n = 9) in natural (i.e., hot during the summer and cold during the winter) and comfort conditions (with cooling and heating). Thermal comfort under contrasting conditions was studied using both instruments and subjective ratings. P300 potential and reaction time were measured before and after a Uchida–Kraepelin (U–K) test (30 summation lines). The results showed that P300 potential and latency did not change between the pre- and post-U–K test among conditions in any of the groups. Furthermore, Indonesian participants showed lower P300 potential (hot conditions) and slower P300 latency (hot and cooling conditions) than Japanese participants. We also found that the reaction time of the Indonesian group significantly differed between the pre- and post-U–K test in an air-conditioned environment, with either cooling or heating. In this study, Indonesian participants demonstrated a resistance to P300 and worse reaction times during work in a thermally unfamiliar season, specifically indicated by the indifferent performances among contrasting environmental conditions. Indonesian participants also showed similar thermal and comfort sensations to Japanese participants among the conditions. In the winter, when the Indonesian neutral temperature is higher than Japanese’s, the energy consumption may increase.

1. Introduction

In Japan, thermal comfort is one of the important issues in offices, because air conditioning—hot and cold—is essential [1,2]. Although widely researched internationally, the focus of thermal comfort mostly lies on subjective sensations and daily activities. Meanwhile, the study of thermal comfort on cognitive performance is limited. Previous research has established that heat stress might impair cognitive functioning influenced by task complexity or a combination of task complexity and duration [3,4,5,6]. Moreover, cognitive functioning might also be affected by cold exposure [7,8]. Cold stress and the environment can potentially affect cognitive performance, including the reaction time and error rate [8,9,10,11]. However, evaluating cognitive performance in response to heat and cold exposure is contingent on subjective responses, which are influenced by skill level and motivation [6,8]. Additionally, other methodological distinctions (environmental and physiological conditions) are not clearly elaborated on cognitive functioning [6,12].
In a previous study, event-related potentials (ERPs) were used to measure cognitive functions, including attention, expectation, and memory update [13]. The P300 wave (also known as P3) of an ERP is a parietocentral positivity brain response that occurs when a participant detects a relevant stimulus [14]. Its potential peak appears approximately 300 ms after the participant makes a stimulus discrimination (responds to the target stimulus and ignores the non-target stimulus). Previous studies have shown that P300 potential varies by season as a function of the average sunshine, whereas no seasonal variation was observed for P300 latency [15,16]. Currently, there is no convincing scientific evidence that winter impairs cognition [17]. Recent studies on Japanese people have shown shortened P300 latency, reaction time, and reduced P300 potential during severe heat stress [6]. In addition, during severe cold stress, P300 latency was delayed but the P300 potential did not change [8]. However, according to Wijayanto et al. [18], participants from southeast Asia (tropical native) had better resistance to a performance decrease than Japanese participants (native) during heat exposure (i.e., leg immersion in 42 °C water). Moreover, acclimatized individuals with improved physiological function to tolerate heat stress should demonstrate greater resistance to performance losses caused by heat stress than non-acclimatized individuals [19]. Consequently, an objective examination of the effect of various thermal conditions (including natural and occupant-controlled conditions), in different ethnicities is required.
Indonesia, located in the equatorial region, experiences a tropical climate with a rainy and dry season. Indonesia receives approximately 12 h of sunlight. The average maximum and minimum temperatures remain nearly constant at ~24 °C in the highlands and at ~28 °C in the lowlands all year round [20]. Conversely, Japan has a temperate climate with four seasons (summer, autumn, winter, and spring), where extreme thermal conditions may occur during the summer (≥35 °C occasionally in western Japan) and winter (−20 °C is frequently recorded in Hokkaido) [21]. Being a subtropical country, the daylight hours in Japan vary ~285 min between the summer and winter [22]. This seasonal variability may affect human performance [23,24,25]. Furthermore, several previous studies on indoor thermal environments revealed that ambient temperature and thermal comfort are crucial in task performance [18,26,27,28,29].
For students who spent their first 20 years in Indonesia, the summer and winter of Japan may be an unexpected challenge. In contrast, Indonesians might have better performance in hot temperatures, according to previous data [15]. Once relocated to a different climate, such as Japan, considerable effort may be needed to adapt to this new environment [19,30,31]. Occupants can control their indoor environment using an air conditioner (AC) and adapt their clothing to the indoor thermal environment. AC is a main energy consumer in buildings, especially offices. Moreover, according to reports from Indonesia, AC systems account for >50% of the total electricity consumed by buildings [1,32]. Additionally, many office buildings in Indonesia set lower temperatures than the standard 21 °C to 23 °C to be comfortable [32], resulting in an increase in electricity consumption. A previous study in Malaysia found that the amount of energy consumed by AC was also dependent on the type of house and typical occupant behavior [33]. However, in Japanese offices, the Cool Biz campaign promoted a minimum AC setting of 28 °C for cooling while the Warm Biz campaign promoted a maximum AC setting of 20 °C for heating [34]. Meanwhile, previous studies demonstrated that the comfort temperature of Indonesians is 24–29 °C [35,36]. Therefore, the current study aimed to investigate and compare the P300 and reaction time of Indonesians as tropical natives residing in Japan and Japanese individuals as temperate natives at natural and comfort conditions. Accordingly, we hypothesized that participants from Indonesia would be able to maintain their P300 performance and reaction time when exposed to natural conditions (hot during the summer and cold during the winter). However, the difference in neutral temperatures between Indonesian and Japanese participants would result in a different energy consumption.

2. Methods

2.1. Experimental Conditions

The experiments were conducted during the summer (August–September) 2019, winter (January–March) 2020, and summer (July–September) 2020 in Toyohashi, a city located in the southeastern Aichi Prefecture in Japan (34°46′9″ N, 137°23′29.5″ E). The city climate is hot and humid in the summer and cold and dry in the winter. The experiment started at 10:00 Japan Standard Time (JST) and was performed in the experimental room of the Building Energy Laboratory at the Toyohashi University of Technology. The temperature could be controlled by AC. Figure 1 shows the floor plan of the experimental room and sensor positions. The exterior walls of the experimental room are mostly reinforced concrete, while the interior walls are mostly plasterboard with an aluminum frame.
In this study, the participants were subjected to four conditions to assess ERP P300 and reaction time in different days for each condition (see Figure 2 and Table 1). Natural conditions (AC turned off) were referred to as “hot” in the summer and “cold” in the winter, as a natural stimulation. Meanwhile, in comfort conditions (i.e., “cooling” and “heating”), participants could adjust the ambient thermal environment of the experimental room by controlling the AC within a temperature range of 20–26 °C, within the Indonesian comfort standard [37]. During the summer experiments, the participants wore briefs (0.04 clo), T-shirts (0.08 clo), and straight trousers (thin, 0.15 clo), to a total clothing insulation score of 0.27 clo. Conversely, in the winter, the participants wore briefs (0.04 clo), long underwear bottoms (0.15 clo), straight trousers (thick, 0.24 clo), long underwear top (0.20 clo), long-sleeved sweatshirt (0.34 clo), and ankle-length athletic socks (0.02 clo), to a total clothing insulation score of 0.99 clo.

2.2. Experimental Instruments and Protocol

This study used both physical measurements to assess objective parameters (experimental instruments listed in Table 2) and questionnaires to assess subjective sensations. Each participant received a complete explanation of the experimental procedure one day before the experiment. The physical and mental conditions of the participants were assessed by their responses to a questionnaire survey (Swedish occupational fatigue inventory). During the experiment, participants were prohibited from consuming any caffeine, alcohol, or medication. Local skin temperatures were also continuously recorded by thermistor probes (409 J, Nikkiso-YSI, Tokyo, Japan) attached with surgical tape to the subject’s skin, with the probe attached to a data logger (LT 8A, Gram Co., Ltd., Saitama, Japan). The skin temperature was measured with reference to Hardy Dubois’s 7-point method: forehead (T1, °C), chest (T2, °C) and back (T8, °C), upper arm (T3, °C), back of the non-dominant hand (T4, °C), thigh (T5, °C), lower leg (T6, °C), and foot of non-dominant side (T7, °C) [38]. Skin temperatures were monitored every 30 s. The following formula was used to calculate the average skin temperature (Tsk, °C).
T s k = 0.07 T 1 + ( 0.175 T 2 + 0.175 T 8 ) + 0.14 T 3 + 0.05 T 4 + 0.19 T 5 + 0.13 T 6 + 0.07 T 7
Body weight (W, kg) and height (H, cm) were measured using a GP 100K weight scale (A&D Corporation, Tokyo, Japan) and a GL1955BL tape measure (TJM design, Tokyo, Japan). The following equations were used to calculate body mass index (BMI) and body surface area (BSA):
BMI = 10,000 × W / H 2  
BSA = 71.84 × W 0.425 × H 0.725 × 10 4
The temperature and relative humidity of the experimental room were measured using an illuminance UV recorder (TR-74Ui, T&D Corp., Matsumoto, Japan). The air velocity and mean radiant temperature (MRT) in the experimental room were measured using a 6332D air flow transducer (Kanomax Japan Inc., Tokyo, Japan) and a globe temperature probe, respectively, all recorded on a GL840 data logger (Graphtec Corp., Yokohama, Japan). Probes were placed at the center of the room (see Figure 1). Physical environment loggers (TR-74Ui and GL840) were activated prior to the beginning of the experimental procedure (Figure 2). The skin temperature logger was activated immediately upon the participants’ entry into the experimental room and turned off after the experiment was finished. To investigate the data during experiment, the skin temperature and physical environment data were selected according to range of experimental times as depicted in Figure 2 (0 when the experiment started and 75 when the experiment finished). We also calculated the predicted mean vote (PMV) by combining the data from physical factors, including air temperature, radiant temperature, air velocity, relative humidity, and human factors, including the amount of clothing insulation and metabolic rate [39]. PMV is represented on a numeric scale from −3 to +3 (−3, cold; −2, cool; −1, slightly cool; 0, neutral; 1, slightly warm; 2, warm; and 3, hot).
Brain responses were examined by an electroencephalogram (EEG) to identify P300. The P300 wave is an ERP generated by the EEG. During ERP, the brain potential changes over time owing to external or internal events, and the EEG change during P300 occurs about 300 ms following target stimulus [14]. The potential is defined as the difference between the average pre-stimulus baseline voltage and the largest positive peak on the ERP waveform within a time window [14,40]. The time interval between stimulus onset and the peak of positive potential within a time window is referred to as latency (ms) [14,40]. Participants completed the performance measurements pre- and post-Uchida–Kraepelin (U–K) test. The EEG of the ERP was measured using a microdata acquisition terminal (Intercross 413, Intercross Corp., Tokyo, Japan) at three scalp locations (frontal zero, Fz; central zero, Cz; and parietal zero, Pz) according to the International 10–20 system method [41]. The sampling frequency for EEG measurements was 1000 Hz. The brain wave was recorded with the filter set to 0.5 Hz, and the low-pass filter set to 40 Hz. A sound stimulus generator (Intercross 511, Intercross Corp., Tokyo, Japan) was used to measure the P300, during which participants listened to the sound through earphones connected to the sound stimulus generator.
In this study, we performed an oddball paradigm task using a sound stimulus to induce the P300. The non-target stimulus was 1 kHz, and the target stimulus was 2 kHz. The appearance frequency for non-target and target stimuli was set to 70% and 30%, respectively. The appearance interval of the sound stimulus was 1.5 s, and the task was terminated when the sound stimulus appeared 100 times. Each participant was instructed to press the button on the sound stimulus generator immediately upon hearing the target, and then focus on the task. During this assignment, participants were also instructed to stare at a cross point on the wall to minimize noise in the EEG due to eye movement (see Figure 3a).
The PVT is a preferred measure of behavioral alertness as it not only allows for studying sleep deprivation, but also has psychometric advantages over other cognitive tests [42]. It measures the simple reaction time (RT) on a stimulus that appears at random interstimulus intervals (ISI) [43]. RT exhibits significant correlation with awareness in several studies [44]. The stimulus on the PVT-192 Psychomotor Vigilance Task monitor (CWE Inc., Ardmore, PA, USA) is a red number on the screen. In many applications, ISI randomly varies from 2 to 10 s. The standard test time was 10 min, although a 5-min test can also be used with the same performance results [45]. In our test, the participants were asked to immediately respond to the stimulus. If the button was pressed when the counter was not displayed on the screen, it was counted as a false start (see Figure 3b).
In the main task, each participant took a 30-row (1 min per row) U–K test with a 1-min break after 15 rows (Figure 4). The U–K tests are simple summation tests for mathematical problems that indicate the participant’s personality [46,47]. The objective results of the U–K test represent speed, correct answering rate, accuracy, and consistency and are strongly influenced by sensory perception and motor response [48]. Speed is calculated as the average number of correct sums per line (in 1 min), whereas the correct rate is the mean correct rate (number of correct answers divided by the number of answers) for each row.
Before and after the U–K test, participants were asked to complete the thermal sensation questionnaire. The thermal sensation questionnaire was used to collect data related to thermal comfort and sensation vote. Thermal sensation was rated on a nine-point scale standard from the Society of Heating, Air Conditioning, and Sanitary Engineers of Japan, and thermal comfort was rated on a seven-point scale from −3 to +3 (Table 3). Thermal comfort was investigated in detail with respect to thermal parameters and seasons.

2.3. Statistical Methods

We tested the data for normality using the Anderson–Darling test [49]. The test verifies the normality hypothesis when p > 0.05, and if the normality hypothesis is rejected, a nonparametric test is recommended. Subsequently, data were analyzed using Minitab version 19 (Minitab, LLC, PA, USA). We compared two or paired sets of samples, and the effects of controlled conditions were analyzed using a paired-sample t-test and analysis of variance (ANOVA). Two-way ANOVA for repeated measures was used to statistically test differences among the P300 potential, the P300 latency, the RT and U–K test score: group (Indonesian and Japanese): df, 1; condition (hot, cooling, cold, and heating): df, 3; combination group and condition: df, 1, 3. Two-sample t-tests were conducted to compare sleep quality between the two seasons. A p-value less than 0.05 was considered as statistically significant.

3. Results

3.1. Participants’ Profiles

Twenty healthy males, all undergraduate and graduate students (11 males from Indonesia: IDN; 9 males from Japan: JPN) participated in this study. They had the following demographic characteristics (mean ± standard deviation): IDN (29 ± 4 years of age, 72.02 ± 13.7 kg of body weight, 169 ± 5 cm of height, 24.4 ± 4.7 of body mass index, and 1.78 ± 0.13 m2 of body surface area) and JPN (23 ± 1 years of age, 59.90 ± 8.1 kg of body weight, 170 ± 6 cm of height, 20.7 ± 2.1 of body mass index, and 1.69 ± 0.13 m2 of body surface area). In this study, Indonesian participants were born and had lived a minimum of 20 years in Indonesia. All participants had normal or corrected to normal sharp-sightedness. In the summer, sleep duration was significantly different between the groups (IDN: 361.9 ± 62.1 min, JPN: 442.2 ± 60.5 min, p < 0.05). However, it was not during the winter (IDN: 406.1 ± 89.7 min, JPN: 429.8 ± 102.3 min, p > 0.05).

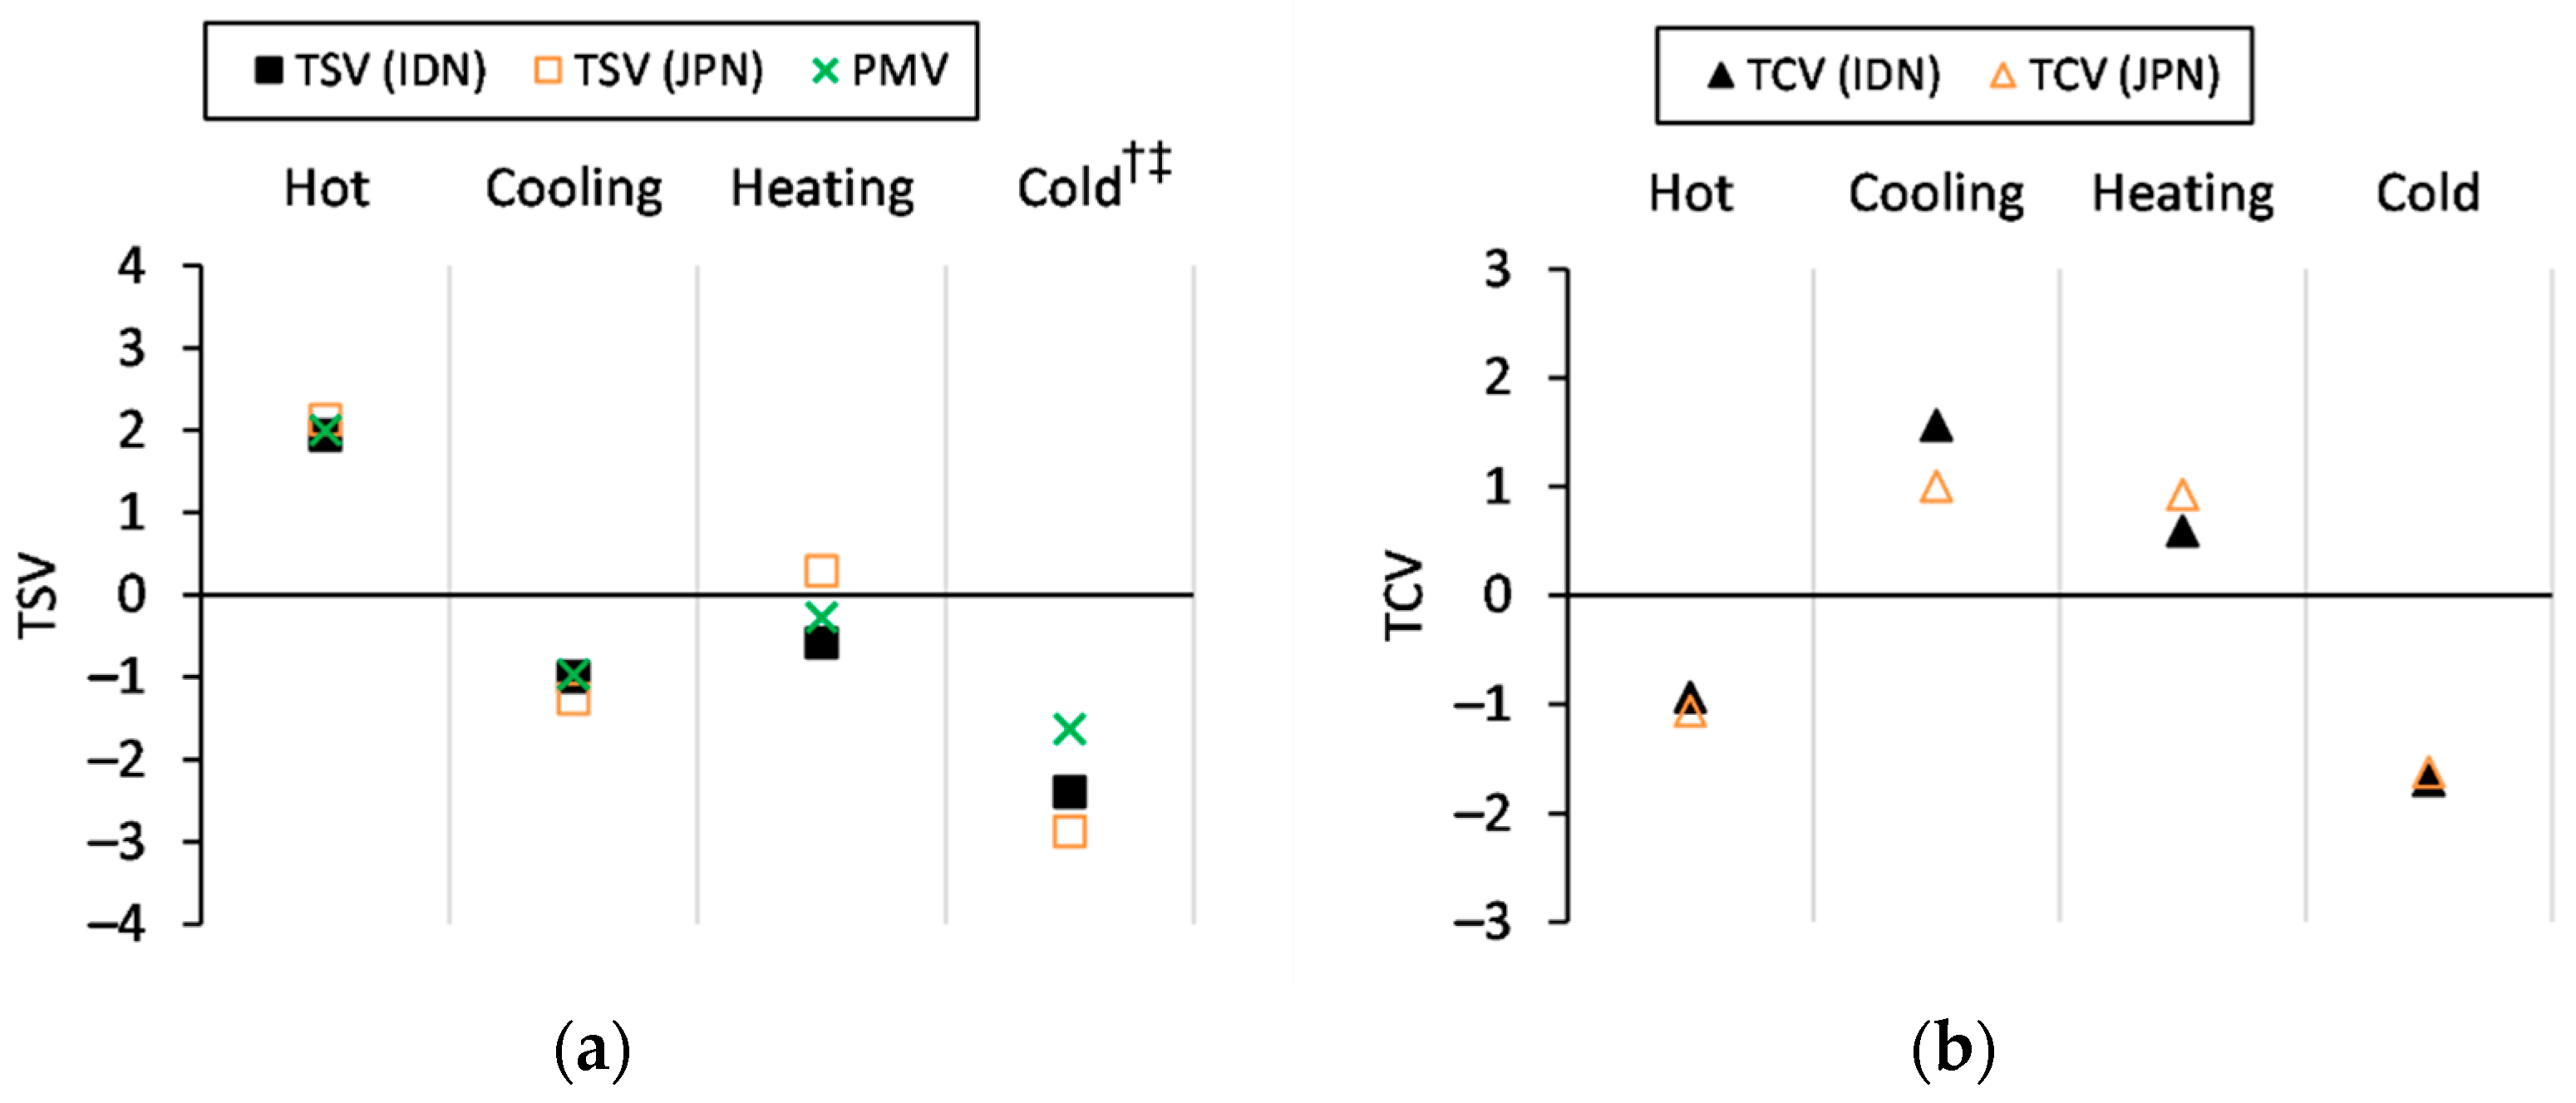
3.2. Thermal Sensation

In comfort conditions (cooling and heating condition), the participants adjusted the ambient thermal environment of the experimental room by controlling the AC within a temperature range of 20–26 °C (cooling during the summer and heating during the winter) and wore clothing with different insulation (0.27 clo. during the summer and 0.99 clo. during the winter). The descriptive statistics of the physiological parameters in the four controlled conditions (hot, cooling, cold, and heating) during the summer and winter are presented in Table 4. The room air temperature (Ta) and relative humidity (RH) in the hot condition were significantly higher than those in the cooling condition (p < 0.05). Similarly, Ta and RH for the cold condition were significantly different from those in heating condition (p < 0.05).
To confirm thermal comfort sensation, summaries of thermal sensation votes (TSV), thermal comfort votes (TCV), and PMVs during the summer and winter experiments for each condition are shown in Figure 5. TSV did not significantly differ between the IDN and JPN group nor was significant the interaction between nationalities and conditions. However, the TSV was significantly different (p < 0.05; df = 3; F = 61.77) among conditions. Moreover, TCV was also not significantly different between nationalities and interaction between nationalities and conditions. Similar to TSV, TCV significantly differed among conditions (p < 0.01; df = 3; F = 33.07).
Figure 6a,b, depict the correlation between indoor air temperature and TSV of the IDN and JPN groups during the summer and winter. Furthermore, Figure 6c shows the correlation between TSV for raw data and binned data. Interestingly, the slopes and constants of both (raw data and binned data) are similar. Comparable with the previous studies, this linear trend indicates that respondents staying in colder air temperatures preferred warmer indoor environmental conditions, and vice versa [50,51].
We also observed the mean Ta (with TSV neutral = 0) of the IDN (summer: 26.9 °C; winter: 23.9 °C) and JPN groups (summer: 26.5 °C; winter: 21.6 °C). Furthermore, according to Rijal, H.B. [52], the linear regression model is ineffective in predicting the comfort temperature. To predict the thermal comfort temperature for each participant based on TSV votes, we used the Griffiths method with the following equation [53].
T c = T a + 0 TSV α
where, Tc is Griffiths comfort temperature (°C); Ta is indoor air temperature (°C); 0 is neutral condition; TSV is the thermal sensation vote; and α indicates the regression coefficient. In a previous study, α = 0.5 was applied with the seven-point TSV [54]. However, two more α (0.25 and 0.33) were added as an adjustment for the possibility of measurement errors to explore Tc [52]. In Table 5, the comfort temperature was determined by utilizing three regression coefficients for the nine-point thermal sensation (0.33, 0.44, and 0.67) [55]. Furthermore, the p-values for the comparison between IDN and JPN for each regression coefficient and the average indicated that there was no difference between IDN and JPN.

3.3. P300

Figure 7a depicts the P300 potential of IDN and JPN groups in the pre- and post-U–K tests in all conditions. Statistical analysis revealed that the P300 potential of both groups did not change after the U–K test in all conditions (all ps > 0.05).
In the ANOVA, the P300 potential did not differ between groups or among conditions. However, it was different in the interaction between group and condition (p < 0.05; df = 1, 3; F = 6.93). Moreover, the P300 potential showed differences during the hot condition compared with cold condition in both groups (Figure 7b). Furthermore, the P300 potential of the IDN group was lower (p < 0.05) in the hot condition than in the cold condition. Meanwhile, for the JPN group the results were the opposite. Comparing the IDN and JPN groups, the P300 potential of the IDN group was lower (p < 0.05) than that of the JPN group during the hot condition.
The P300 latency in pre-/post-U–K test during all conditions is illustrated in Figure 8a. The P300 latency of both groups did not change after the U–K test in any conditions (all ps > 0.05).
In ANOVA, the P300 latency did not differ among conditions. However, it was different between groups (p < 0.05; df = 1; F = 35.27) and in the interaction between nationality and condition (p < 0.05; df = 1, 3; F = 7.55). Moreover, in comparison among conditions, the IDN group did not show any difference in P300 latency between the hot and cold conditions. Meanwhile, the JPN group showed a shorter P300 latency (p < 0.05) when performing in hot conditions than in cold conditions. Comparing the IDN and JPN groups, the P300 latency of the IDN group was lower (p < 0.05) than that of the JPN group in both hot and cooling conditions (Figure 8b).

3.4. Reaction Time

Figure 9a shows the RT in the pre-/post-U–K test in all conditions. The RT of the IDN group was delayed after the U–K test in the cooling and heating conditions (all ps < 0.05). Meanwhile, the RT of the JPN group did not change after the U–K test in all conditions (all ps > 0.05).
In ANOVA, the RT was different between groups (p < 0.05; df = 1; F = 6.32) and in the interaction between group and condition (p < 0.05; df = 1, 3; F = 3.01). However, it did not differ among conditions. Moreover, in comparison among conditions, none of the groups shows any difference in RT between hot and cold conditions. Comparing the IDN and JPN group, the RT of the IDN group was longer (p < 0.05) than that of the JPN group during the heating condition (Figure 9b).

3.5. Uchida–Kraepelin Test

The U–K test speed was different between groups (p < 0.05; df = 1; F = 31.61). Moreover, Figure 10a shows that the U–K test speed differed between hot and heating conditions. However, it was not different among all conditions and in the interaction between nationality and condition. With respect to the correct rate of the U–K test, as shown in Figure 10b, we also found differences between IDN and JPN (p < 0.05; df = 1; F = 11.27). However, it did not differ among conditions and in the interaction between nationality and condition.

4. Discussion

The current study investigated the effect of natural (hot during the summer and cold during the winter) and comfort conditions on brain responses (P300 potential and latency) and RT. The main results of the current study showed no differences in P300 potential, P300 latency, and RT of IDN and JPN participants between comfort and natural conditions in the summer and/or winter. Moreover, after performing the U–K test at comfort conditions (cooling during the summer and heating during the winter), the RT of IDN group showed a significant delay.
The responses in the thermal sensation and comfort evaluation performed in four conditions did not differ between the IDN and JPN group in any conditions. Moreover, in a neutral temperature analysis, the current study observed that the neutral temperature of the IDN group was higher than that of the JPN group during the winter. This was similar to recent studies revealing differences between Japanese and non-Japanese individuals [56,57,58]. To cope with the higher neutral temperature of IDN people, energy consumption might increase. Moreover, previous studies in Japan have shown that lowering the indoor temperature setting by 1 °C for heating can result in a 10% reduction in energy consumption [59,60]. According to Nakano et al. [56], three factors cause differences in neutral temperature: clothing insulation, activity, and expectation. Therefore, it is unsurprising that there were no differences in neutral temperature during the summer, as participants wore identical clothing insulation, engaged in similar activities, and were experienced in a warm environment.
P300 is defined as a measure of the brain’s active potential (potential) and the time required to evaluate a stimulus (latency) [6,61]. The lack of changes in the P300 potential, latency, and RT between hot and cooling differed from a previous study that reported significant changes in the P300 potential, latency, and RT between pre-heat (Tsk = 33.6 °C) and heat stress conditions (Tsk = 39.4 °C) [6]. Further, indifference in the P300 potential, latency, and reaction time between cold and heating was different to a previous study that reported significant changes in the P300 latency between pre (Tsk = 35.0 °C) and cold stress conditions (Tsk = 30.4 °C) [8]. These differences might indicate that the hot–cooling (Tsk = 34.3–32.9 °C) and cold–heating (Tsk = 29.5–32.2 °C) conditions in the present study were not as severe as in previous research (hot condition: Tsk = 33.6–39.4 °C; cold condition: Tsk = 35.0–30.4 °C).
Moreover, in the cooling and heating conditions, the ambient temperatures were similar to the comfort temperature range (20.5–28.2 °C) reported by Yang et al. [62]. We consider that the IDN group in our study had adapted to a hot environment (as they resided in IDN for > 20 years). As tropical natives, IDN participants might have been accustomed to performing cognitive tasks in a hot environment. In general, the higher the ambient temperature, the more difficult the task [14,63,64,65]. Under specific conditions, heat stress (Ta = 24 to 32 °C) has harmful effects on cognitive functioning in older adults [66]. Moreover, previous studies have reported increased P300 latencies and decreased potentials due to “equivocation” or information loss [67] and difficulty in maintaining sustained attention [68].
Meanwhile, attention is influenced by task difficulty. A task that requires greater attention, shows a smaller P300 potential and longer latency as more processing resources are needed for task performance [69,70]. However, in this study, performing the U–K test with 30 rows (1 min break after 15 rows) did not decrease P300 performance in all conditions. Furthermore, in mental stress measurement, a previous study reported no significant change in any mental stress parameter during or after the U–K test [47]. It might indicate that performing the U–K test with 30 rows did not require much attention (monotonous simple task).
RT is correlated with daytime sleepiness levels during subjective measurements [71] and the time interval between stimulus onset and response measurement [6]. However, in this study, the contrasting physical environment conditions did not lead to any differences in each group. However, we observed a significant difference between the pre- and post-U–K test. In the IDN group, RT was significantly delayed in the cooling and heating condition. In winter, the average outdoor air temperature in the current research was 7.7 ± 3.0 °C [22], which means that participants, particularly those from IDN, may feel more discomfort due to the cold air. As a result, the IDN group began to relax in the heated environment, resulting in a delayed RT. Teichner and Kobrick [72] found a reduced final limit for visuomotor performance after prolonged exposure to cold. Hancock [73] claimed that vigilance performance is impaired only when the deep body temperature deviates from a normal steady state. However, when participants returned to warm conditions, they demonstrated a rapid return to their expected performance [72,74]. Moreover, according to Romeijn et al. [75] and Kulve et al. [76], the level of alertness and sleepiness is related to the skin temperature in response to ambient temperature. Romeijn et al. [75] predicted that the sleep-promoting maximum temperature capacity peaks at approximately Tsk = 34 °C and that the vigilance-promoting capacity is greatest at approximately Tsk = 30 °C.
When comparing the IDN and JPN group, the P300 potential of the IDN group was lower in the hot condition in the summer and the P300 latency longer in hot and cooling conditions in the summer compared with the JPN group. With respect to thermal experienced, the IDN group was familiar with warm temperatures and inexperienced with Japan’s winter conditions (mild). As tropical natives, IDN participants were adapted to a new climate in the long-term (i.e., more than 20 years) [77]. In our study, participants were staying in Japan for about 6 months. Furthermore, the P300 potential was significantly smaller and P300 latency significantly longer after sleep deprivation or a bad night’s sleep [78,79,80]. Differences in sleep duration in the IDN group in the summer (361.9 ± 62.1 min) and winter (406.1 ± 89.7 min) might account for these findings. Regarding the effect of sleep on the next day’s performance, studies on the impact of sleep on athletes’ sports performance and student performance are being conducted. Insufficient sleep time, sleep disturbances due to external factors, and sleep deprivation has reduced performance [81,82,83,84], depressed mood, and poor memory or concentration [85].

5. Conclusions

We investigated P300 and the RT of Indonesian and Japanese individuals in natural (hot in the summer and cold in the winter) and comfort conditions (cooling and heating), and found that the temperature under contrasting conditions (hot, cooling, cold, and heating) did not influence either P300 potential or latency in Indonesian and Japanese people, as the ambient temperature was not severe in the present study. Moreover, the U–K test did not require great attention. However, the effect of the comfort condition (cooling and heating) on RT was more pronounced than the natural condition, particularly in the Indonesian group. With a shorter sleep duration during the summer, the P300 potential of Indonesians was lower in hot conditions (summer), and their P300 latency longer in hot and cooling conditions (summer) than the Japanese group. Moreover, in everyday life during the winter, the Indonesian group might experience more discomfort due to cold air. Consequently, the Indonesian group began to relax in the heating condition, promoting a delayed RT, and a lower correct rate in the U–K test is lower. Moreover, it is possible that energy consumption will increase in order to cope with a higher neutral temperature of the Indonesian group during the winter. According to the findings presented here, brain response (P300) is related to cognitive response (U–K test and RT of PVT). Additionally, skin temperature and thermal sensation influence the cognitive response. P300, on the other hand, is influenced by a previous night’s sleep, fatigue, and physical condition (present environment).
These findings are useful in terms of the methodology used to investigate brain response and RT in natural and comfortable environments. However, there are limitations due to the small number of participants and the temperature differences between natural and comfortable conditions. Despite its limitations, this research adds to the body of knowledge regarding brain response, RT, and thermal comfort, particularly for tropical natives living or working in Japan. A larger-scale study, including more participants, more extreme temperatures, and other reliable measures, is warranted to prove or disprove our findings.

Author Contributions

W.B. and K.T. designed the study and contributed to the results interpretation. W.B. and H.S. collected and analyzed the data. W.B. wrote the manuscript. K.T. provided resources and funding support, reviewed, edited the manuscript, and supervised the research. All authors have read and agreed to the published version of the manuscript.

Funding

This research received no external funding.

Institutional Review Board Statement

The study was conducted according to the guidelines of the Declaration of Helsinki, and approved by the research ethics committee of Toyohashi University of Technology (TUT), Toyohashi, Japan, issued approvals R1-11 and R2-09/2020.6.23.

Informed Consent Statement

Informed consent was obtained from all participants involved in the study. All participants agreed to the experimental procedures and the publication of data.

Data Availability Statement

The authors confirm that the data supporting the findings of this study are available within the article. Permission to reproduce material from other sources was not applicable.

Acknowledgments

This field survey was approved and facilitated by Toyohashi University of Technology (TUT), Toyohashi, Japan. We appreciate the help and cooperation of the participants who volunteered for this survey and experiment. We thank the laboratory students for their assistance during the experiment.

Conflicts of Interest

The authors declare no conflict of interest.

References

  1. Damiati, S.A.; Zaki, S.A.; Rijal, H.B.; Wonorahardjo, S. Field study on adaptive thermal comfort in office buildings in Malaysia, Indonesia, Singapore, and Japan during hot and humid season. Build. Environ. 2016, 109, 208–223. [Google Scholar] [CrossRef]
  2. Mustapa, M.S.; Zaki, S.A.; Rijal, H.B.; Hagishima, A.; Ali, M.S.M. Thermal comfort and occupant adaptive behaviour in Japanese university buildings with free running and cooling mode offices during summer. Build. Environ. 2016, 105, 332–342. [Google Scholar] [CrossRef]
  3. Hancock, P.A.; Vasmatzidis, I. Effects of heat stress on cognitive performance: The current state of knowledge. Int. J. Hyperth. 2003, 19, 355–372. [Google Scholar] [CrossRef]
  4. Hocking, C.; Silberstein, R.B.; Lau, W.M.; Stough, C.; Roberts, W. Evaluation of cognitive performance in the heat by functional brain imaging and psychometric testing. Comp. Biochem. Physiol. A Mol. Integr. Physiol. 2001, 128, 719–734. [Google Scholar] [CrossRef]
  5. Kazama, A.; Takatsu, S.; Hasegawa, H. Effect of increase in body temperature on cognitive function during prolonged exercise. Jpn. J. Phys. Fit. Sport. Med. 2012, 61, 459–467. [Google Scholar] [CrossRef]
  6. Shibasaki, M.; Namba, M.; Oshiro, M.; Crandall, C.G.; Nakata, H. The effect of elevations in internal temperature on event-related potentials during a simple cognitive task in humans. Am. J. Physiol. Regul. Integr. Comp. Physiol. 2016, 311, R33–R38. [Google Scholar] [CrossRef] [Green Version]
  7. Castellani, J.W.; Tipton, M.J. Cold stress effects on exposure tolerance and exercise performance. Compr. Physiol. 2016, 6, 443–469. [Google Scholar] [CrossRef]
  8. Nakata, H.; Kobayashi, F.; Lawley, J.S.; Kakigi, R.; Shibasaki, M. Effects of whole body skin cooling on human cognitive processing: A study using SEPs and ERPs. Am. J. Physiol. Regul. Integr. Comp. Physiol. 2019, 317, R432–R441. [Google Scholar] [CrossRef]
  9. Muller, M.D.; Gunstad, J.; Alosco, M.L.; Miller, L.A.; Updegraff, J.; Spitznagel, M.B.; Glickman, E. Acute Cold Exposure and Cognitive Function: Evidence for Sustained Impairment. Ergonomics 2012, 55, 792–798. [Google Scholar] [CrossRef]
  10. Taylor, L.; Watkins, S.L.; Marshall, H.; Dascombe, B.J.; Foster, J. The impact of different environmental conditions on cognitive function: A focused review. Front. Physiol. 2016, 6, 1–12. [Google Scholar] [CrossRef] [Green Version]
  11. Watkins, S.L.; Castle, P.; Mauger, A.R.; Sculthorpe, N.; Fitch, N.; Aldous, J.; Brewer, J.; Midgley, A.W.; Taylor, L. The effect of different environmental conditions on the decision-making performance of soccer goal line officials. Res. Sport. Med. 2014, 22, 425–437. [Google Scholar] [CrossRef]
  12. Gaoua, N. Cognitive function in hot environments: A question of methodology. Scand. J. Med. Sci. Sport. 2010, 20, 60–70. [Google Scholar] [CrossRef]
  13. Duncan, C.C.; Barry, R.J.; Connolly, J.F.; Fischer, C.; Michie, P.T.; Näätänen, R.; Polich, J.; Reinvang, I.; Van Petten, C. Event-related potentials in clinical research: Guidelines for eliciting, recording, and quantifying mismatch negativity, P300, and N400. Clin. Neurophysiol. 2009, 120, 1883–1908. [Google Scholar] [CrossRef]
  14. Picton, T.W. The P300 wave of the human event-related potential. J. Clin. Neurophysiol. 1992, 9, 456–479. [Google Scholar] [CrossRef]
  15. Polich, J.; Geisler, M.W. P300 seasonal variation. Biol. Psychol. 1991, 32, 173–179. [Google Scholar] [CrossRef]
  16. Deldin, P.J.; Duncan, C.C.; Miller, G.A. Season, gender, and P300. Biol. Psychol. 1994, 39, 15–28. [Google Scholar] [CrossRef]
  17. Brennen, T. New Ideas in Psychology Is cognition seasonal ? New Ideas Psychol. 2021, 61, 100852. [Google Scholar] [CrossRef]
  18. Wijayanto, T.; Toramoto, S.; Maeda, Y.; Son, S.Y.; Umezaki, S.; Tochihara, Y. Cognitive performance during passive heat exposure in Japanese males and tropical Asian males from Southeast Asian living in Japan. J. Physiol. Anthropol. 2017, 36, 1–11. [Google Scholar] [CrossRef] [Green Version]
  19. Ramsey, J.D. Task performance in heat: A review. Ergonomics 1995, 38, 154–165. [Google Scholar] [CrossRef]
  20. BMKG Climate Change Extreem in Indonesia. Available online: https://www.bmkg.go.id/iklim/?p=ekstrem-perubahan-iklim&lang=ID (accessed on 20 January 2021).
  21. Japan Meteorology Agency General Information on Climate of Japan. Available online: https://www.data.jma.go.jp/gmd/cpd/longfcst/en/tourist.html (accessed on 5 March 2021).
  22. Japan Meteorology Agency Tables of Monthly Climate Statistics. Available online: http://www.data.jma.go.jp/obd/stats/data/en/smp/index.html (accessed on 20 January 2020).
  23. Ohayon, M.M.; Partinen, M. Insomnia and global sleep dissatisfaction in Finland. J. Sleep Res. 2002, 11, 339–346. [Google Scholar] [CrossRef]
  24. González-Hidalgo, G.; Sánchez-Flores, H.; López-Castellanos, G. Prueba de esfuerzo a 44 °C y 80% de humedad. (Spanish). Rev. Medica IMSS 2011, 49, 487–492. [Google Scholar]
  25. Fujii, H.; Fukuda, S.; Narumi, D.; Ihara, T.; Watanabe, Y. Fatigue and sleep under large summer temperature differences. Environ. Res. 2015, 138, 17–21. [Google Scholar] [CrossRef]
  26. Cui, W.; Cao, G.; Park, J.H.; Ouyang, Q.; Zhu, Y. Influence of indoor air temperature on human thermal comfort, motivation and performance. Build. Environ. 2013, 68, 114–122. [Google Scholar] [CrossRef]
  27. Roelofsen, P. The impact of office environments on employee performance: The design of the workplace as a strategy for productivity enhancement. J. Facil. Manag. 2002, 1, 247–264. [Google Scholar] [CrossRef]
  28. Lan, L.; Wargocki, P.; Lian, Z. Quantitative measurement of productivity loss due to thermal discomfort. Energy Build. 2011, 43, 1057–1062. [Google Scholar] [CrossRef]
  29. Kaida, K.; Takeda, Y.; Tsuzuki, K. The Relationship between Flow, Sleepiness and Cognitive Performance: The Effects of Short Afternoon Nap and Bright Light Exposure. Ind. Health 2012, 50, 189–196. [Google Scholar] [CrossRef] [Green Version]
  30. Pepler, R.D. Warmth and performance: An investigation in the tropics. Ergonomics 1958, 2, 63–88. [Google Scholar] [CrossRef]
  31. Radakovic, S.S.; Maric, J.; Surbatovic, M.; Radjen, S.; Stefanova, E.; Stankovic, N.; Filipovic, N. Effects of acclimation on cognitive performance in soldiers during exertional heat stress. Mil. Med. 2007, 172, 133–136. [Google Scholar] [CrossRef] [Green Version]
  32. Karyono, T.H.; Bahri, G. Energy efficient strategies for JSX building in Jakarta, Indonesia. In Proceedings of the International Conference “Passive and Low Energy Cooling 207 for the Built Environment”, Santorini, Greece, 19–21 May 2005. [Google Scholar]
  33. Aqilah, N.; Zaki, S.A.; Hagishima, A.; Rijal, H.B.; Yakub, F. Analysis on electricity use and indoor thermal environment for typical air-conditioning residential buildings in Malaysia. Urban Clim. 2021, 37, 100830. [Google Scholar] [CrossRef]
  34. Nakashima, Y. Climate Change Policies in Japan/What Are COOL BIZ and WARM BIZ. Available online: https://www.env.go.jp/en/focus/jeq/issue/vol03/feature.html (accessed on 7 October 2021).
  35. Karyono, T.H. Report on thermal comfort and building energy studies in Jakarta—Indonesia. Build. Environ. 2000, 35, 77–90. [Google Scholar] [CrossRef]
  36. Alfata, M.N.F.; Sujatmiko, W.; Widyahantari, R. Thermal Comfort Study in the Office Buildings in Medan, Jakarta, Surabaya and Makassar, Final Report of Innovation Research: The Effect of Air Movement on Thermal Comfort in Some Office Buildings in Some Big Cities in Indonesia (Unpublished annual report); Indonesian Ministry of Public Works: Jakarta, Indonesia, 2012. [Google Scholar]
  37. Badan Standardisasi Nasional (BSN). Standar Nasional Indonesia (The Indonesian National Standard)-SNI 6390:2011 Konservasi Energi Sistem Tata Udara Bangunan Gedung; BSN: Jakarta, Indonesia, 2011. [Google Scholar]
  38. Ramanathan, N.L. A New Weighting System for Mean Surface Temperature of the Human Body. J. Appl. Physiol. 1964, 19, 531–533. [Google Scholar] [CrossRef] [Green Version]
  39. Fanger, P.O. Thermal Comfort. Analysis and Applications in Environmental Engineering; Danish Technical Press: Copenhagen, Danmark, 1970. [Google Scholar]
  40. Polich, J. Updating P300: An integrative theory of P3a and P3b. Clin. Neurophysiol. 2007, 118, 2128–2148. [Google Scholar] [CrossRef] [Green Version]
  41. Böcker, K.B.E.; van Avermaete, J.A.G.; van den Berg-Lenssen, M.M.C. The international 10-20 system revisited: Cartesian and spherical co-ordinates. Brain Topogr. 1994, 6, 231–235. [Google Scholar] [CrossRef]
  42. Lim, J.; Dinges, D.F. Sleep deprivation and vigilant attention. Ann. N. Y. Acad. Sci. 2008, 1129, 305–322. [Google Scholar] [CrossRef]
  43. Kay, M.; Rector, K.; Consolvo, S.; Greenstein, B.; Wobbrock, J.O.; Watson, N.F.; Kientz, J.A. PVT-touch: Adapting a reaction time test for touchscreen devices. In Proceedings of the 7th International Conference on Pervasive Computing Technologies for Healthcare, Venice, Italy, 5–8 May 2013; pp. 248–251. [Google Scholar] [CrossRef]
  44. Basner, M.; Dinges, D.F. Maximizing sensitivity of PVT to Sleep Loss (Basner, Dinges). Sleep 2011, 34, 581–591. [Google Scholar] [CrossRef]
  45. Loh, S.; Lamond, N.; Dorrian, J.; Roach, G.; Dawson, D. The validity of psychomotor vigilance tasks of less than 10-minute duration. Behav. Res. Methods Instrum. Comput. 2004, 36, 339–346. [Google Scholar] [CrossRef] [Green Version]
  46. Kashiwagi, S.; Yanai, H.; Aoki, T.; Tamai, H.; Tanaka, Y.; Hokugoh, K. A factor analytic study of the items for the personality description based on the principle of the three traits theory for the work curve of addition of the Uchida-Kraepelin psychodiagnostic test. Psychol. Res. 1985, 56, 1985–1986. [Google Scholar] [CrossRef] [Green Version]
  47. Sugimoto, K.; Kanai, A.; Shoji, N. The effectiveness of the Uchida-Kraepelin test for psychological stress: An analysis of plasma and salivary stress substances. Biopsychosoc. Med. 2009, 3, 5. [Google Scholar] [CrossRef] [Green Version]
  48. Freeman, F.S. Theory and Practice of Psychological Testing; Henry Holt: Oxford, UK, 1950. [Google Scholar]
  49. Ghasemi, A.; Zahediasl, S. Normality tests for statistical analysis: A guide for non-statisticians. Int. J. Endocrinol. Metab. 2012, 10, 486–489. [Google Scholar] [CrossRef] [Green Version]
  50. Gautam, B.; Rijal, H.B.; Shukuya, M.; Imagawa, H. A field investigation on the wintry thermal comfort and clothing adjustment of residents in traditional Nepalese houses. J. Build. Eng. 2019, 26, 100886. [Google Scholar] [CrossRef]
  51. Jowkar, M.; Rijal, H.B.; Brusey, J.; Montazami, A.; Carlucci, S.; Lansdown, T.C. Energy & Buildings Comfort temperature and preferred adaptive behaviour in various classroom types in the UK higher learning environments. Energy Build. 2020, 211, 109814. [Google Scholar] [CrossRef]
  52. Rijal, H.B. Investigation of Comfort Temperature and Occupant Behavior in Japanese Houses during the Hot and Humid Season. Buildings 2014, 4, 437–452. [Google Scholar] [CrossRef]
  53. Griffiths, I.D. Solar Energy Applications to Buildings and Solar Radiation Data; Steemers, T.C., Ed.; Kluwer Academic Publisher: Dordrecht, The Netherlands, 1988; Volume 40. [Google Scholar]
  54. Humphreys, M.A.; Rijal, H.B.; Nicol, J.F. Updating the adaptive relation between climate and comfort indoors; new insights and an extended database. Build. Environ. 2013, 63, 40–55. [Google Scholar] [CrossRef]
  55. Rijal, H.B.; Honjo, M.; Kobayashi, R.; Nakaya, T. Investigation of comfort temperature, adaptive model and the window-opening behaviour in Japanese houses. Archit. Sci. Rev. 2013, 56, 54–69. [Google Scholar] [CrossRef]
  56. Nakano, J.; Tanabe, S.I.; Kimura, K.I. Differences in perception of indoor environment between Japanese and non-Japanese workers. Energy Build. 2002, 34, 615–621. [Google Scholar] [CrossRef]
  57. Draganova, V.; Tsuzuki, K.; Nabeshima, Y. Field Study on Nationality Differences in Thermal Comfort of University Students in Dormitories during Winter in Japan. Buildings 2019, 9, 213. [Google Scholar] [CrossRef] [Green Version]
  58. Budiawan, W.; Tsuzuki, K. Thermal Comfort and Sleep Quality of Indonesian Students Living in Japan during Summer and Winter. Buildings 2021, 11, 326. [Google Scholar] [CrossRef]
  59. Rijal, H.B.; Yoshida, K.; Humphreys, M.A.; Nicol, J.F. Development of an adaptive thermal comfort model for energy-saving building design in Japan. Archit. Sci. Rev. 2021, 64, 109–122. [Google Scholar] [CrossRef]
  60. Ministry of The Environment of Japan Energy Saving Actions in Office. Available online: https://ondankataisaku.env.go.jp/coolchoice/setsuden/office/saving01.html (accessed on 7 October 2021).
  61. Kutas, M.; McCarthy, G.; Donchin, E. Augmenting Mental Chronometry: The P300 as a Measure of Stimulus Evaluation Time Science is currently published by American Association for the Advancement of Science. JSTOR’s Terms and Conditions of Use provide. Science (80-) 1977, 197, 792–795. Available online: http://www.jstor.org/about/terms.html (accessed on 23 September 2021). [CrossRef]
  62. Yang, L.; Gao, S.; Zhao, S.; Zhang, H.; Arens, E.; Zhai, Y. Thermal comfort and physiological responses with standing and treadmill workstations in summer. Build. Environ. 2020, 185, 107238. [Google Scholar] [CrossRef]
  63. Bell, P.A. Effects of Noise and Heat Stress on Primary and Subsidiary Task Performance. Hum. Factors J. Hum. Factors Ergon. Soc. 1978, 20, 749–752. [Google Scholar] [CrossRef]
  64. Bell, P.A.; Loomis, R.J.; Cervone, J.C. Effects of heat, social facilitation, sex differences, and task difficulty on reaction time. Hum. Factors 1982, 24, 19–24. [Google Scholar] [CrossRef]
  65. Kosmidis, M.H.; Duncan, C.C.; Mirsky, A.F. Sex differences in seasonal variations in P300. Biol. Psychol. 1998, 49, 249–268. [Google Scholar] [CrossRef]
  66. Trezza, B.M.; Apolinario, D.; de Oliveira, R.S.; Busse, A.L.; Gonçalves, F.L.T.; Saldiva, P.H.N.; Jacob-Filho, W. Environmental heat exposure and cognitive performance in older adults: A controlled trial. Age 2015, 37, 9783. [Google Scholar] [CrossRef]
  67. Kim, K.H.; Kim, J.H.; Yoon, J.; Jung, K.Y. Influence of task difficulty on the features of event-related potential during visual oddball task. Neurosci. Lett. 2008, 445, 179–183. [Google Scholar] [CrossRef] [PubMed]
  68. Choi, J.W.; Jung, K.Y.; Kim, C.H.; Kim, K.H. Changes in gamma- and theta-band phase synchronization patterns due to the difficulty of auditory oddball task. Neurosci. Lett. 2010, 468, 156–160. [Google Scholar] [CrossRef]
  69. Kok, A. On the utility of P3 amplitude as a measure of processing capacity. Psychophysiology 2001, 38, 557–577. [Google Scholar] [CrossRef] [Green Version]
  70. Polich, J. Task difficulty, probability, and inter-stimulus interval as determinants of P300 from auditory stimuli. Electroencephalogr. Clin. Neurophysiol. Evoked Potentials 1987, 68, 311–320. [Google Scholar] [CrossRef]
  71. Li, Y.; Vgontzas, A.; Kritikou, I.; Fernandez-Mendoza, J.; Basta, M.; Pejovic, S.; Gaines, J.; Bixler, E.O. Psychomotor vigilance test and its association with daytime sleepiness and inflammation in sleep apnea: Clinical implications. J. Clin. Sleep Med. 2017, 13, 1049–1056. [Google Scholar] [CrossRef] [Green Version]
  72. Teichner, W.H.; Kobrick, J.L. Effects of Prolonged Exposure To Low Temperature on Visual-Motor Performance. J. Exp. Psychol. 1955, 49, 122–126. [Google Scholar] [CrossRef]
  73. Hancock, P.A. Sustained Attention Under Thermal Stress. Psychol. Bull. 1986, 99, 263–281. [Google Scholar] [CrossRef] [PubMed]
  74. Enander, A.E.; Hygge, S. Thermal stress and human performance. Scand. J. Work Environ. Health 1990, 16, 44–50. Available online: http://www.jstor.org/stable/40965843 (accessed on 23 September 2021).
  75. Romeijn, N.; Raymann, R.J.E.M.; Møst, E.; Te Lindert, B.; Van Der Meijden, W.P.; Fronczek, R.; Gomez-Herrero, G.; Van Someren, E.J.W. Sleep, vigilance, and thermosensitivity. Pflugers Arch. Eur. J. Physiol. 2012, 463, 169–176. [Google Scholar] [CrossRef] [Green Version]
  76. Kulve, M.T.; Schlangen, L.J.M.; Schellen, L.; Frijns, A.J.H.; van Marken Lichtenbelt, W.D. The impact of morning light intensity and environmental temperature on body temperatures and alertness. Physiol. Behav. 2017, 175, 72–81. [Google Scholar] [CrossRef]
  77. Katsuura, T.; Tachibana, M.E.; Lee, C.; Okada, A.; Kikuchi, Y. Comparative studies on thermoregulatory responses to heat between Japanese Brazilians and Japanese. Physiol. Anthropol. 1992, 11, 105–111. [Google Scholar] [CrossRef]
  78. Takeshi, K.; Yoshiaki, N.; Arihiro, H.; Masahiro, S.; Masaki, F.; Takashi, T. Effects of 24-Hours Sleep Deprivation Using on Central Processing Event-Related Potentials. Jpn. J. Phys. Fit. Sports Med. 1999, 48, 477–487. [Google Scholar]
  79. Aseem, A.; Hussain, M.E. Sleep quality and its effect on event related potential P300 in adolescents with and without sleep disturbances. Int. J. Adolesc. Med. Health 2019. [Google Scholar] [CrossRef]
  80. Devoto, A.; Manganelli, S.; Lucidi, F.; Lombardo, C.; Russo, P.M.; Violani, C. Quality of sleep and P300 amplitude in primary insomnia: A preliminary study. Sleep 2005, 28, 859–863. [Google Scholar] [CrossRef] [Green Version]
  81. Cusick, C.N.; Isaacson, P.A.; Langberg, J.M.; Becker, S.P. Last Night’s Sleep in Relation to Academic Achievement and Neurocognitive Testing Performance in Adolescents with and without ADHD. Sleep Med. 2018, 75–79. [Google Scholar] [CrossRef]
  82. Charest, J.; Grandner, M.A. Sleep and Athletic Performance: Impacts on Physical Performance, Mental Performance, Injury Risk and Recovery, and Mental Health. Sleep Med. Clin. 2020, 15, 41–57. [Google Scholar] [CrossRef] [PubMed]
  83. Okamoto-Mizuno, K.; Tsuzuki, K. Effects of season on sleep and skin temperature in the elderly. Int. J. Biometeorol. 2010, 54, 401–409. [Google Scholar] [CrossRef]
  84. Tsuzuki, K.; Mori, I.; Sakoi, T.; Kurokawa, Y. Effects of seasonal illumination and thermal environments on sleep in elderly men. Build. Environ. 2015, 88, 82–88. [Google Scholar] [CrossRef]
  85. Dinges, D.F.; Rogers, N. Baynard Chronic sleep deprivation. In Principles and Practice of Sleep Medicine; Kryger, M., Roth, T., Dement, W., Eds.; Elsevier/Saunders: Philadelphia, PA, USA, 2005; pp. 67–76. [Google Scholar]
Figure 1. Experimental setup. Abbreviations: h, instrument height (m); Note: all room layout dimensions in m.
Energies 14 07598 g001
Figure 2. Experimental protocol. Abbreviations: P300, brainwave response at approximately 300 ms; PVT, psychomotor vigilance task.
Energies 14 07598 g002
Figure 3. (a) P300 test and (b) PVT. Abbreviations: P300, brainwave response at approximately 300 ms; PVT, psychomotor vigilance task.
Energies 14 07598 g003
Figure 4. Uchida–Kraepelin test simulation.
Energies 14 07598 g004
Figure 5. The average of (a) TSVs, and (b) TCVs, during the summer and winter for each experimental condition. Significantly different between TSV (IDN) and PMV at p < 0.05. Significantly different between TSV (JPN) and PMV at p < 0.05.
Energies 14 07598 g005
Figure 6. Correlation between room air temperature (Ta) and thermal sensation vote (TSV) during (a) summer, (b) winter, and (c) summer and winter.
Energies 14 07598 g006
Figure 7. Average P300 potential in (a) pre-/post-U–K test and (b) each condition. Abbreviation: IDN, Indonesian; JPN, Japanese. * Significantly different between IDN and JPN at p < 0.05. a Significantly different P300 potential of IDN between hot and cold condition at p < 0.05. b Significantly different P300 potential of JPN between hot and cold condition at p < 0.05.
Energies 14 07598 g007
Figure 8. Average P300 latency in (a) pre-/post-U–K test and (b) each condition. Abbreviation: IDN, Indonesian; JPN, Japanese. * Significantly different between IDN and JPN at p < 0.05. b Significantly different P300 latency of JPN between hot and cold condition at p < 0.05.
Energies 14 07598 g008
Figure 9. Average of reaction time in (a) pre-/post-U–K test and (b) each condition. Abbreviation: IDN, Indonesian; JPN, Japanese. Significantly different between pre- and post-U–K test of IDN at p < 0.05. * Significantly different between IDN and JPN at p < 0.05.
Energies 14 07598 g009
Figure 10. Average (a) speed and (b) correct rate in the Uchida Kraepelin test. * Significantly different between IDN and JPN at p < 0.05.
Energies 14 07598 g010
Table 1. Controlled conditions during the summer and winter experiments.
SeasonCond.ACModeT (°C)MR (met)Clo (clo)
SummerHot---10.27
CoolingACCooling20–2610.27
WinterCold---10.99
HeatingACHeating20–2610.99
Abbreviations: Cond., condition; AC, air conditioner; T, setting temperature; MR, metabolic rate; Clo, clothing insulation.
Table 2. Experimental instruments.
ParameterInstrument NameInstrument ModelCompanyAccuracy
Air temperature and relative humidityIlluminance UV RecorderTR-74Ui (logger), and THA-3151 (sensor)T&D Corp.0–55 °C (±0.5 °C)
±5%
Wall temperatureThermocouple cableT-type thermocouple cableGraphtec Corp.
Radiant temperatureGlobe thermometerSibata 080340-150Sibata
Air velocityAir Flow Transducer6332D (Sensor)Kanomax Inc.±3%
LoggerMini logger GL800Graphtec Corp.
Body massWeight scaleGP 100KA & D Corp.±1 g
Skin temperatureSkin temperature loggerLT-8 Series (skin temperature logger)Gram Corp.±0.1 °C
409 J (thermistor probe)Nikkiso-YSI Corp.
Reaction timePsychomotor Vigilance TaskPVT-192Ambulatory Monitoring Inc.±1 ms
P300 of ERPElectroencephalogram (EEG)Intercross 415 (micro data acquisition), and Intercross 511 (stimulus generator)Intercross Corp./
Table 3. Scale of thermal sensation (TSV) and thermal comfort (TCV).
ScaleThermal SensationThermal Comfort
4Very hot
3HotVery comfortable
2WarmComfortable
1Slightly warmSlightly comfortable
0NeutralNeutral
−1Slightly coolSlightly uncomfortable
−2CoolUncomfortable
−3ColdVery uncomfortable
−4Very cold
Table 4. Descriptive physiological statistics of study participants in the two controlled conditions during the summer and winter.
Cond.Ta (°C)RH (%)MRT (°C)AV (m/s)MST (°C)
Hot31.0 (1.6)64 (12)31.4 (1.8)0.02 (0.01)34.3 (0.7)
Cooling24.5 (1.8) 49 (10) 25.4 (2.2) 0.17 (0.26) 32.9 (0.8)
Heating21.9 (1.3)37 (10)22.3 (1.2)0.15 (0.02)32.2 (0.8)
Cold13.9 (2.3) 53 (12) 14.5 (2.0) 0.04 (0.01) 29.5 (1.6)
Data are presented as mean (standard deviation). Abbreviations: Ta, room air temperature; RH, relative humidity; MRT, mean radiant temperature; AV, air velocity; MST, mean skin temperature. Significantly different between cooling and hot at p < 0.05. Significantly different between cold and heating at p < 0.05.
Table 5. Average comfort temperature calculated using the Griffiths method.
αIDN (°C)JPN (°C)Sig.
0.3324.724.4p = 0.72
0.4424.524.3p = 0.88
0.6724.224.3p = 0.92
avg.24.524.3p = 0.88
Abbreviations: α, regression coefficient; avg., average; IDN, Indonesian group; JPN, Japanese group; sig., significance.
Publisher’s Note: MDPI stays neutral with regard to jurisdictional claims in published maps and institutional affiliations.

