
Nontargeted vs. Targeted vs. Smart Load Shifting Using Heat Pump Water Heaters


Abstract
:1. Introduction
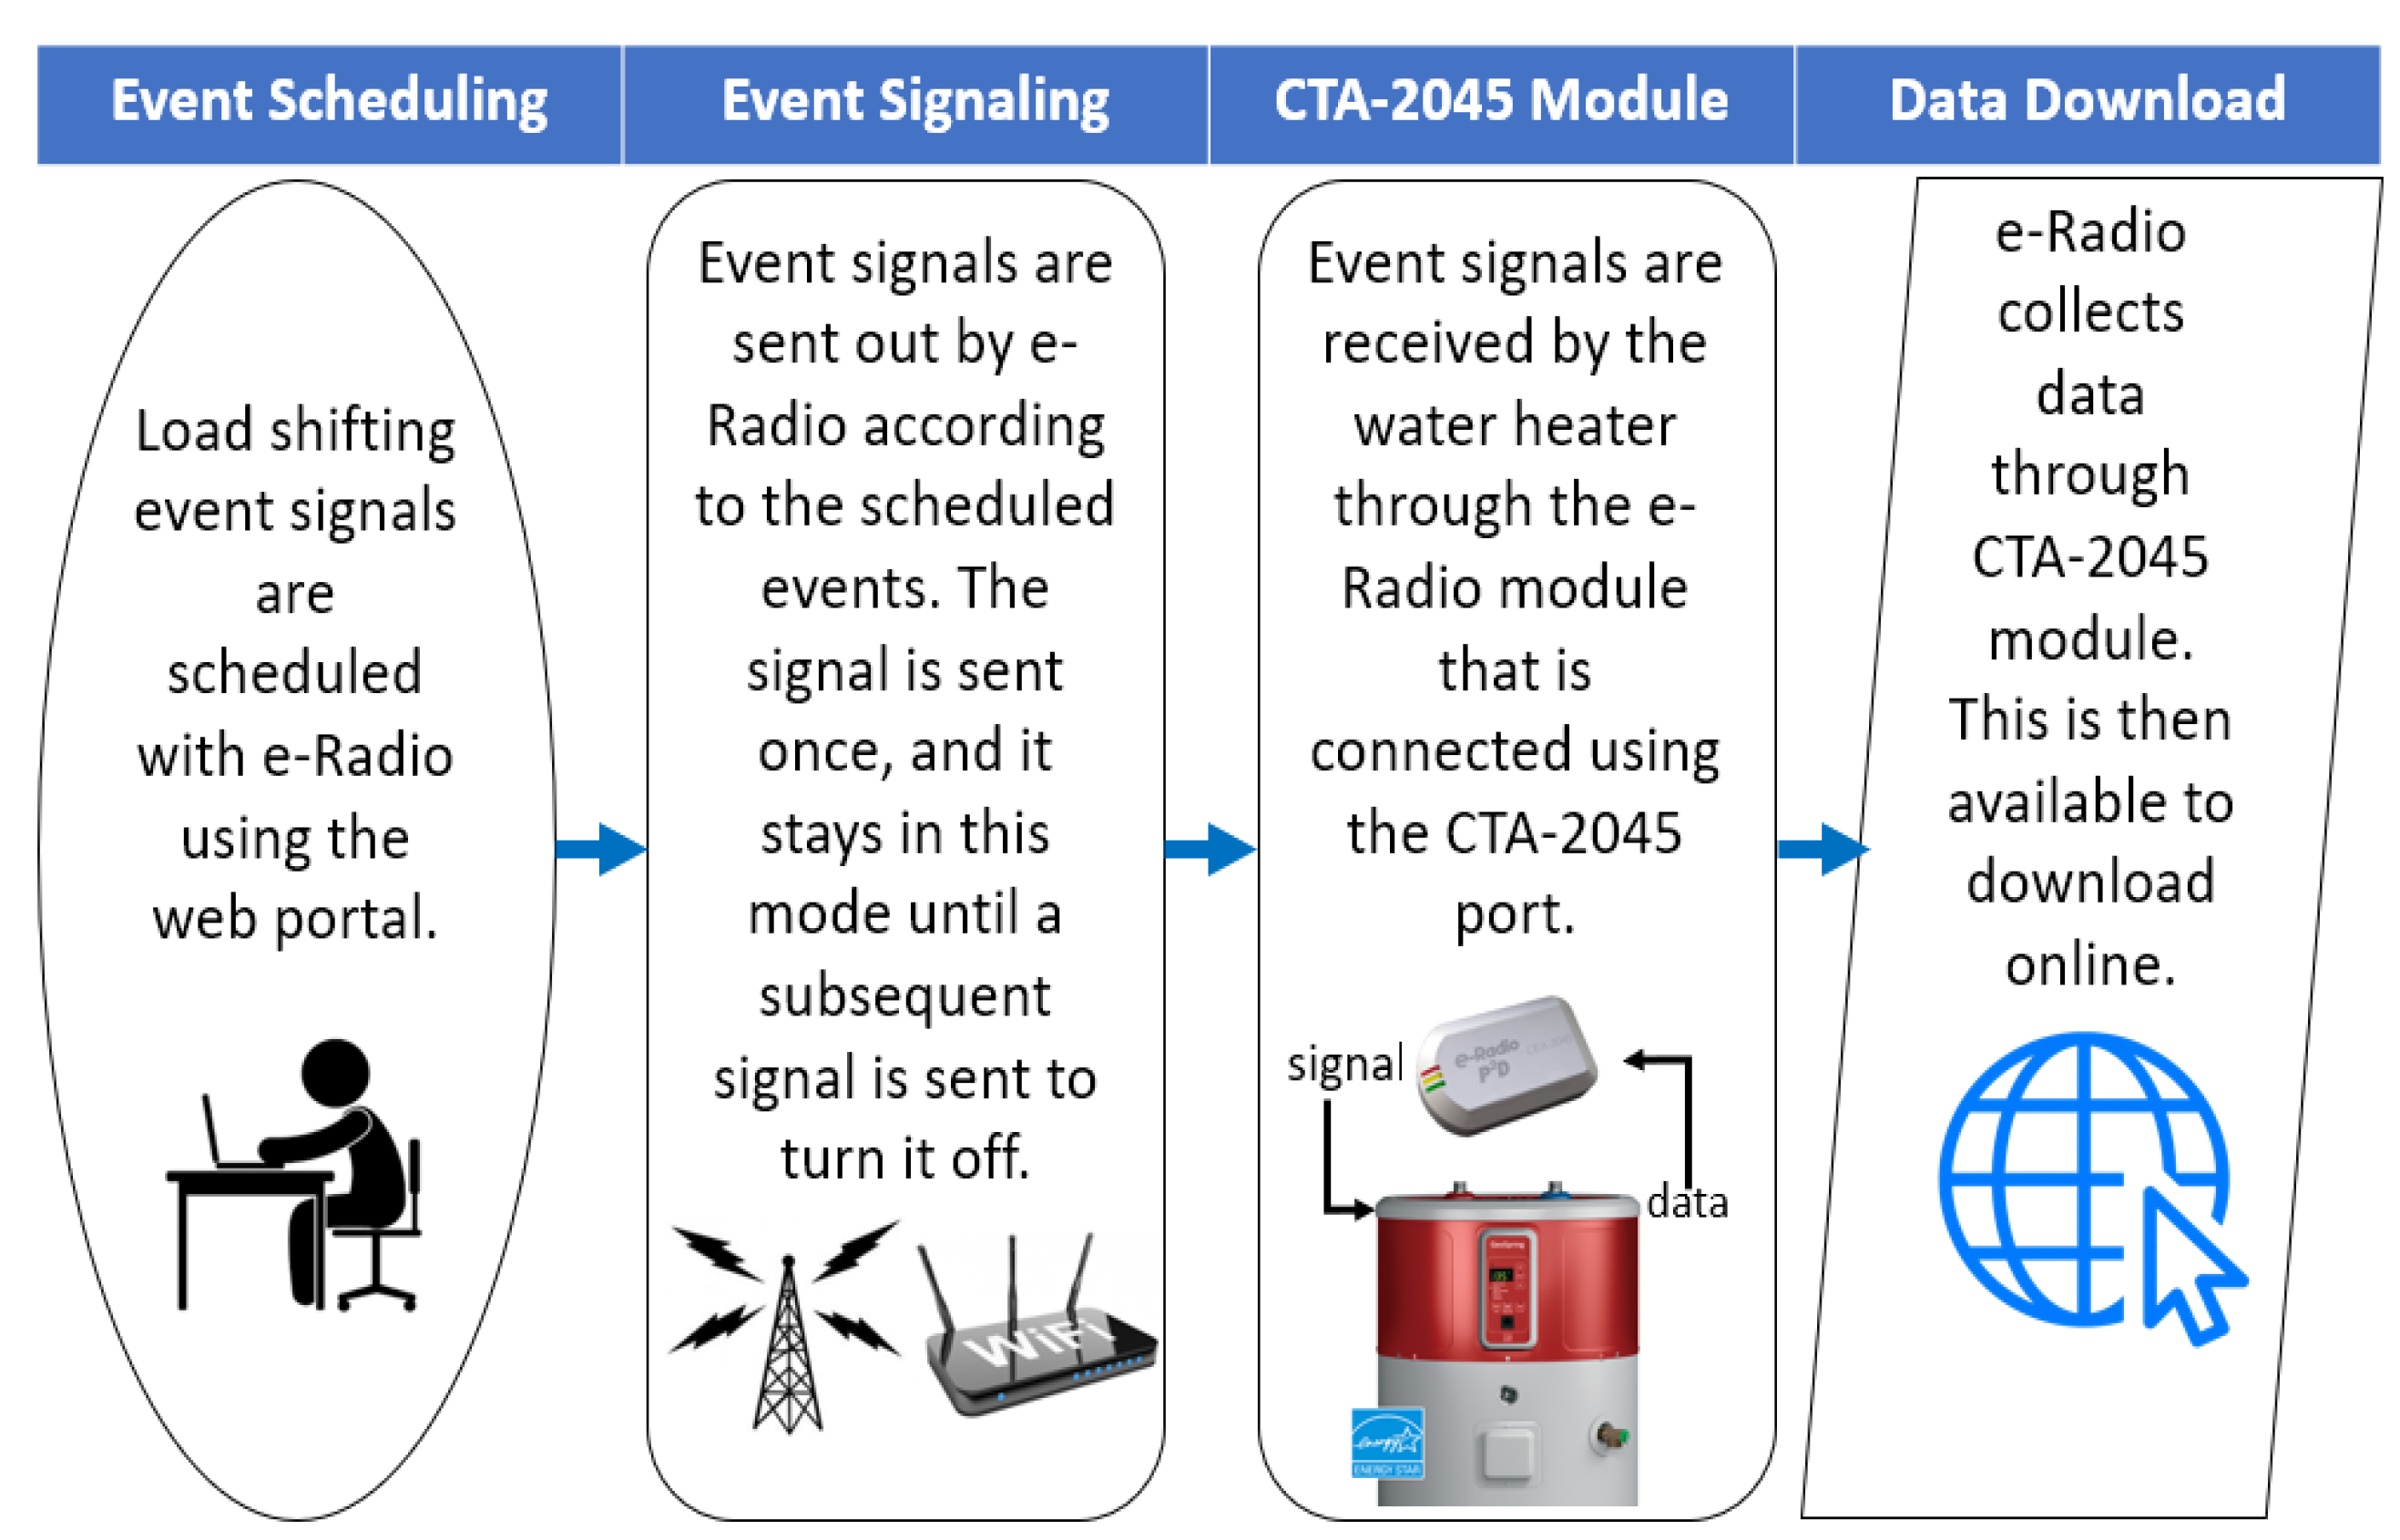
- The original appliance manufacturer must provide the standard CTA-2045 port.
- Any stakeholder (e.g., utilities) can provide the external, additional “connected” hardware (referred to as a Universal Communications Module [UCM]) required to turn an unconnected, CTA-2045–ready appliance into a connected appliance.
- The modular interface must support all developed communication methods at the physical layer (e.g., Wi-Fi, 4G LTE, etc.) and at the command layer (e.g., Smart Energy Profile [SEP], OpenADR, etc.).
- A third party can manufacture the connected hardware.
- Can a targeted shed command strategy yield more total energy shifted for a population of water heaters than a non-targeted strategy with extended event periods?
- Can greater energy shifting be attained by employing a smart learning algorithm and different CTA-2045 control commands (e.g., shed, critical peak and grid emergency) without homeowners noticing?
2. Materials and Method
2.1. Representative Control and Event Weeks
2.2. Metrics
2.3. Non-Targeted Strategy
- total energy use for the week (kWh)
- minutes above 1000 W for the week (a surrogate for minutes in electric resistance mode)
- maximum energy usage (kWh, any day of the week) between 5 a.m. and 9 a.m. This helped to gauge the magnitude of the morning water heating peaks for each home
- maximum energy usage (kWh, any day of the week) between 5 p.m. and 9 p.m. This helped to gauge the magnitude of evening water heating peaks for each home
- minutes opted out of the demand-response events.
2.4. Targeted Strategy
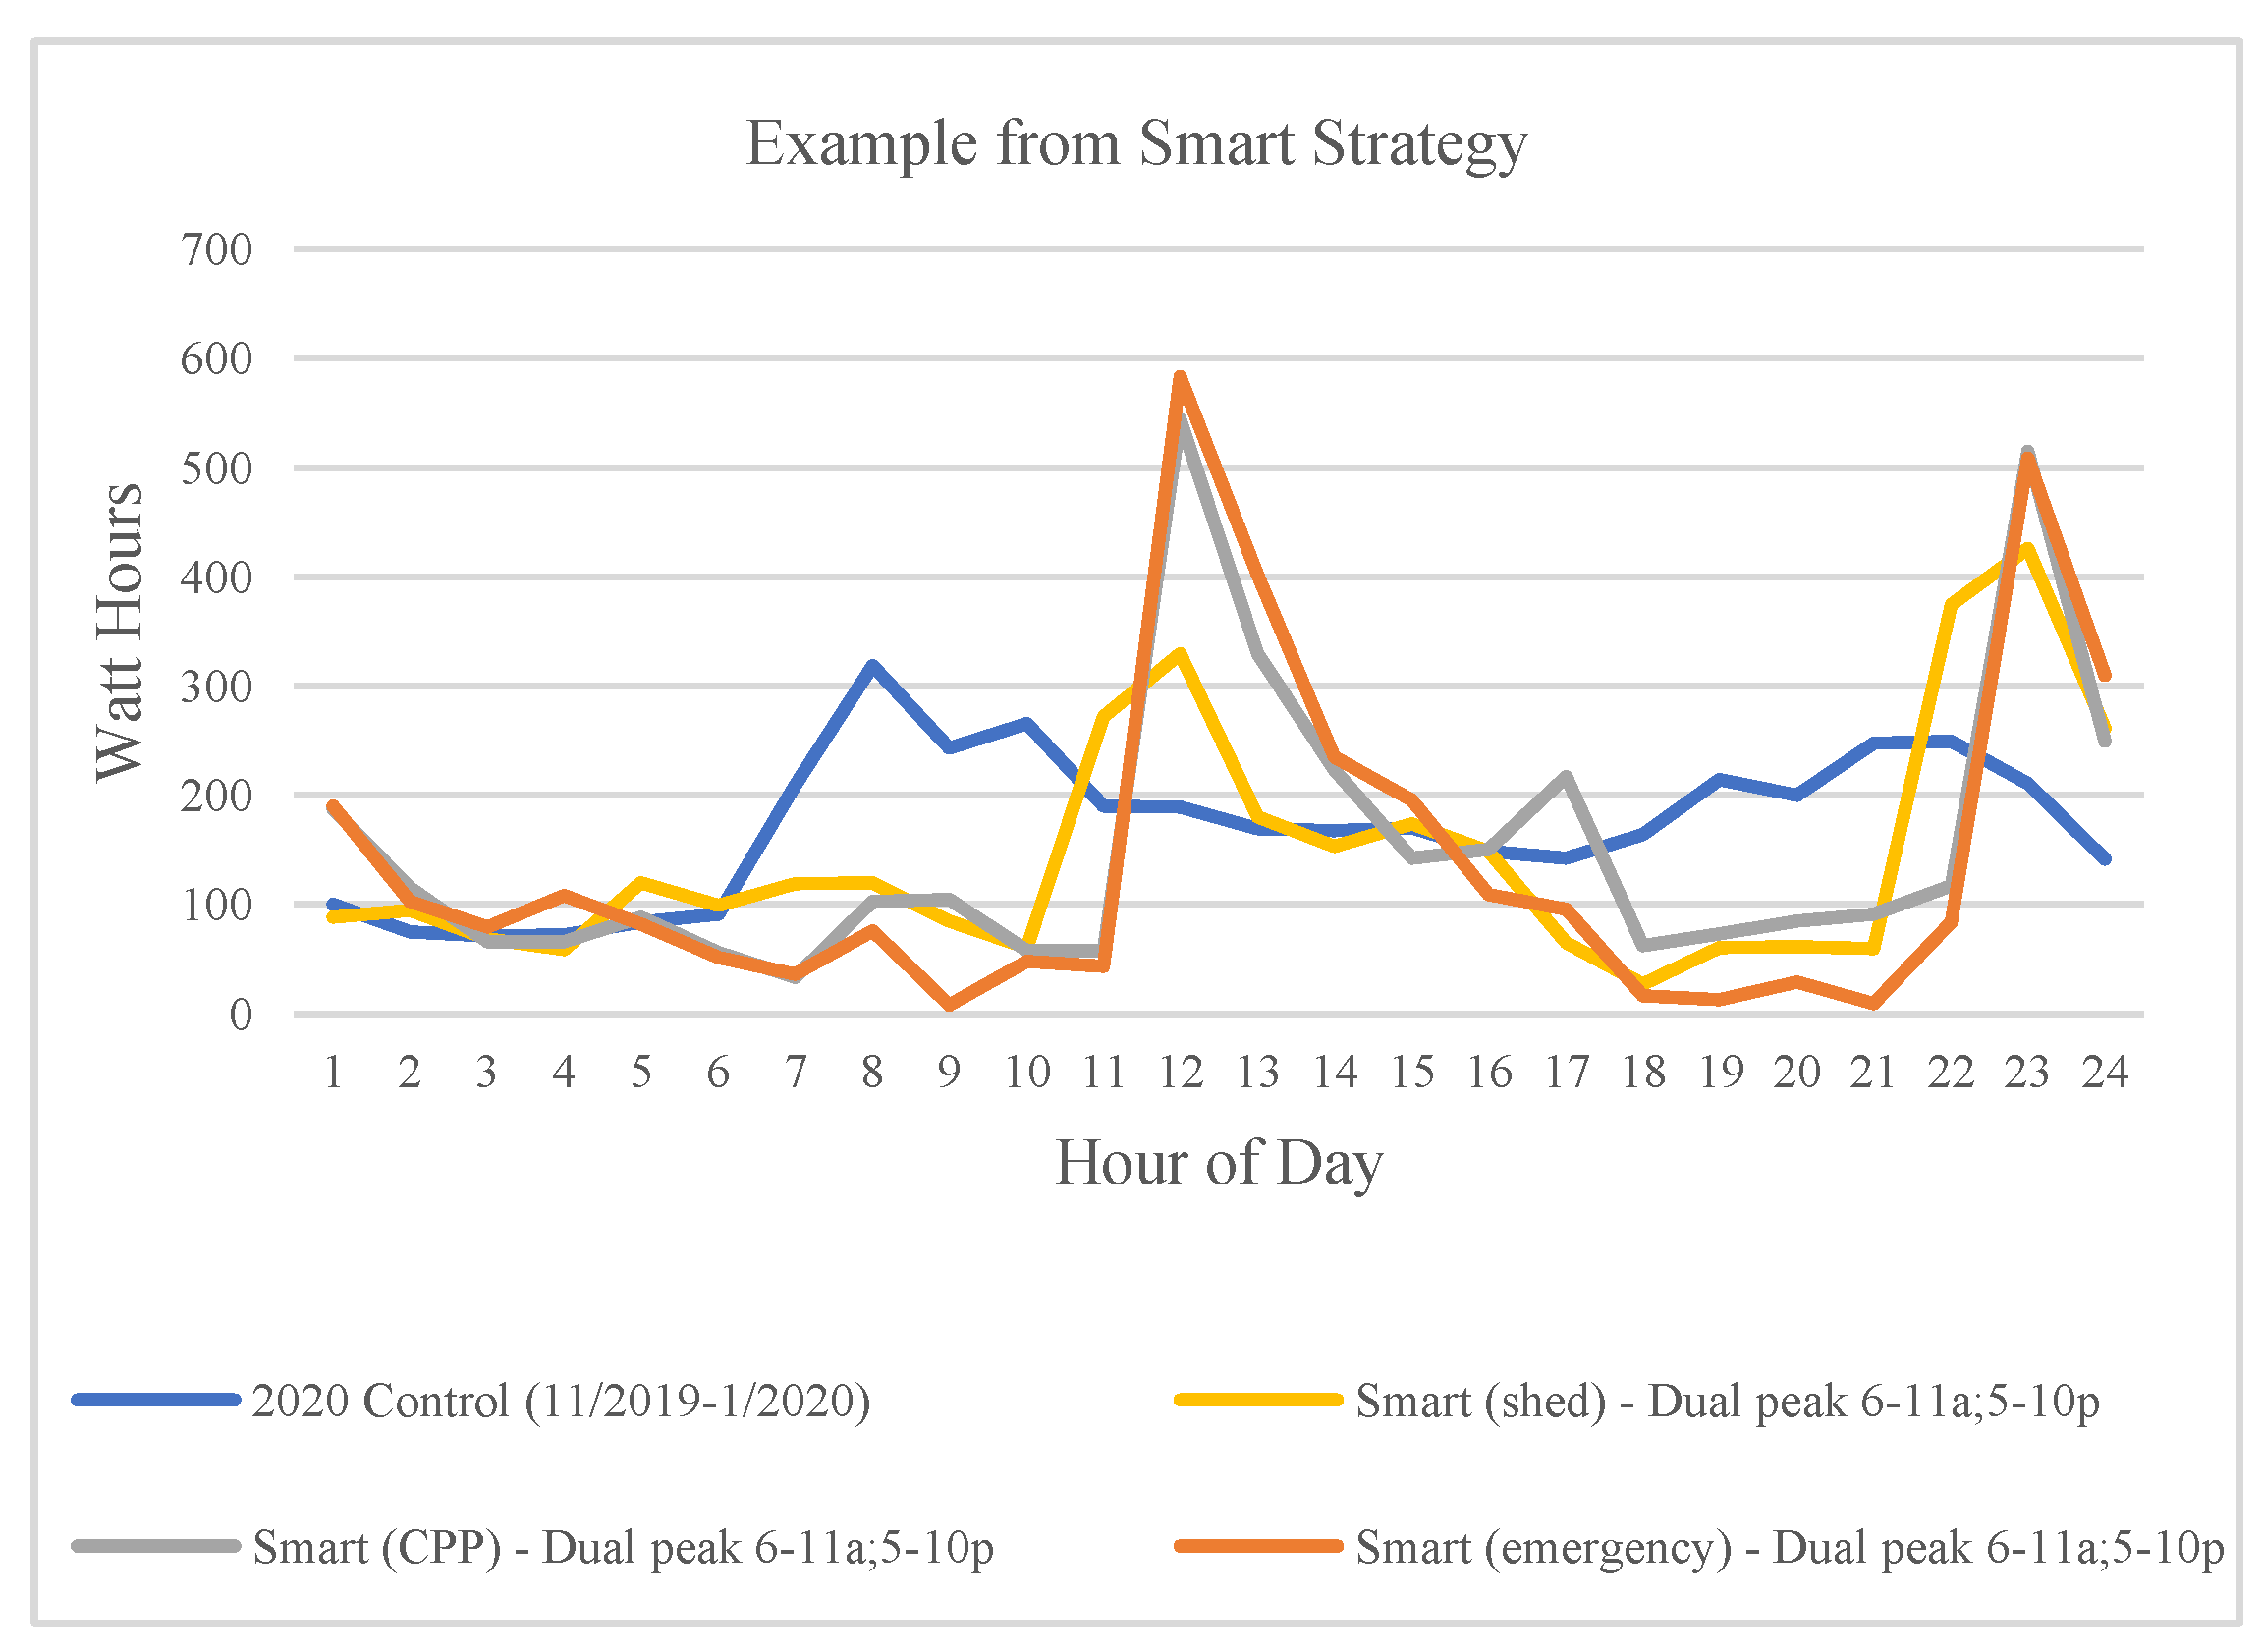
2.5. Smart Strategy
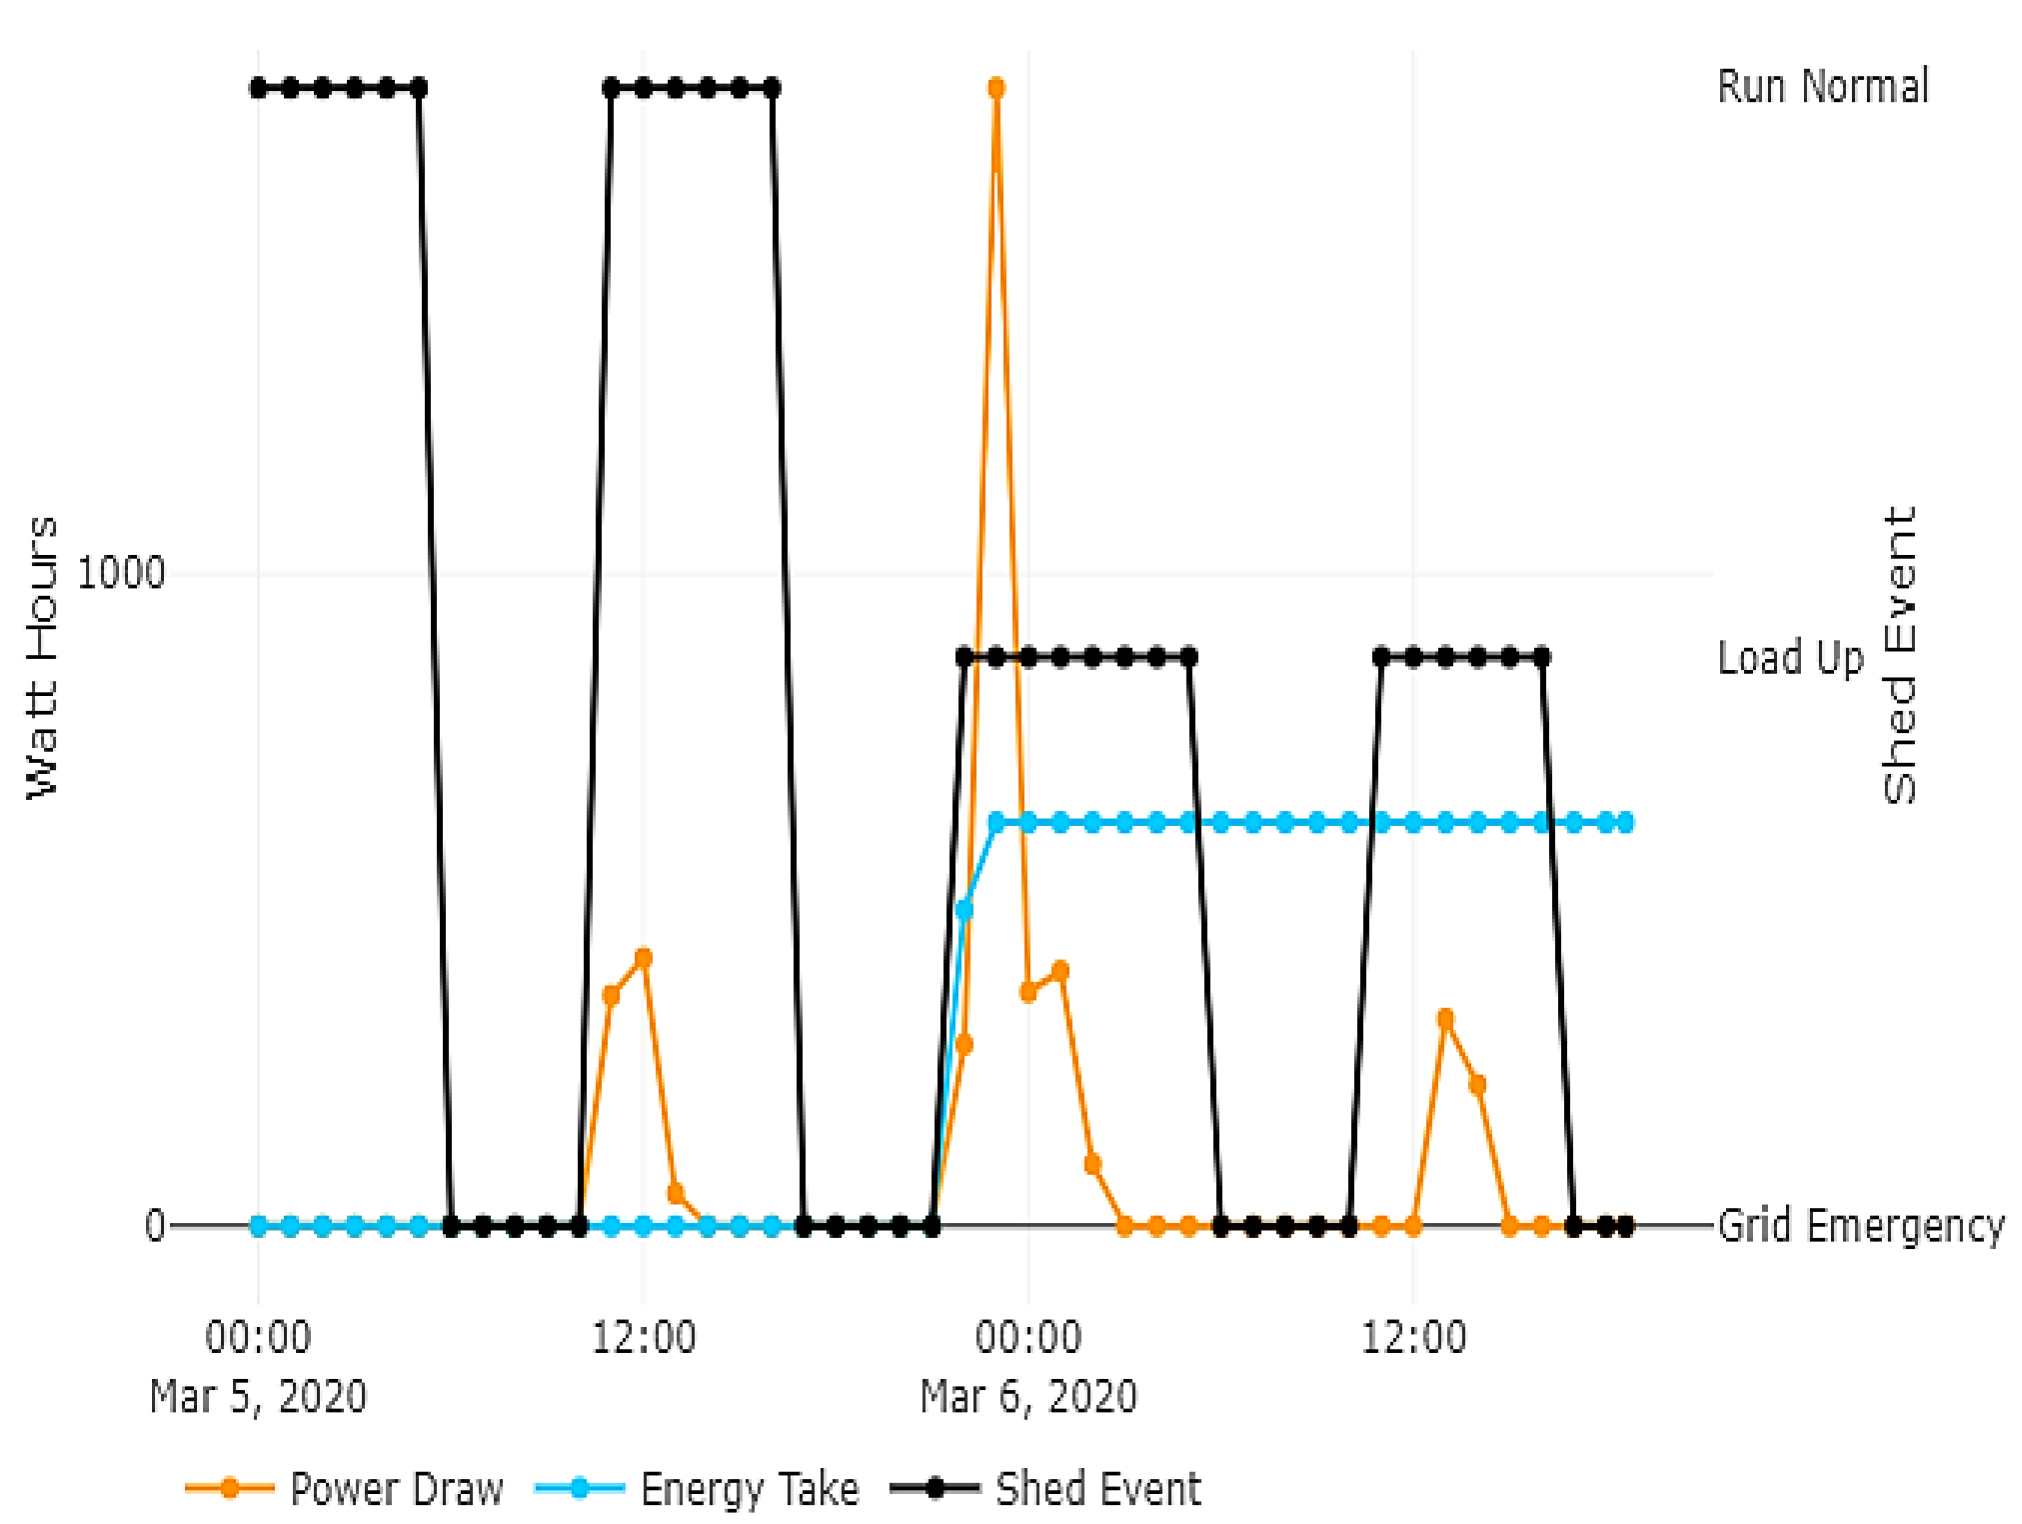
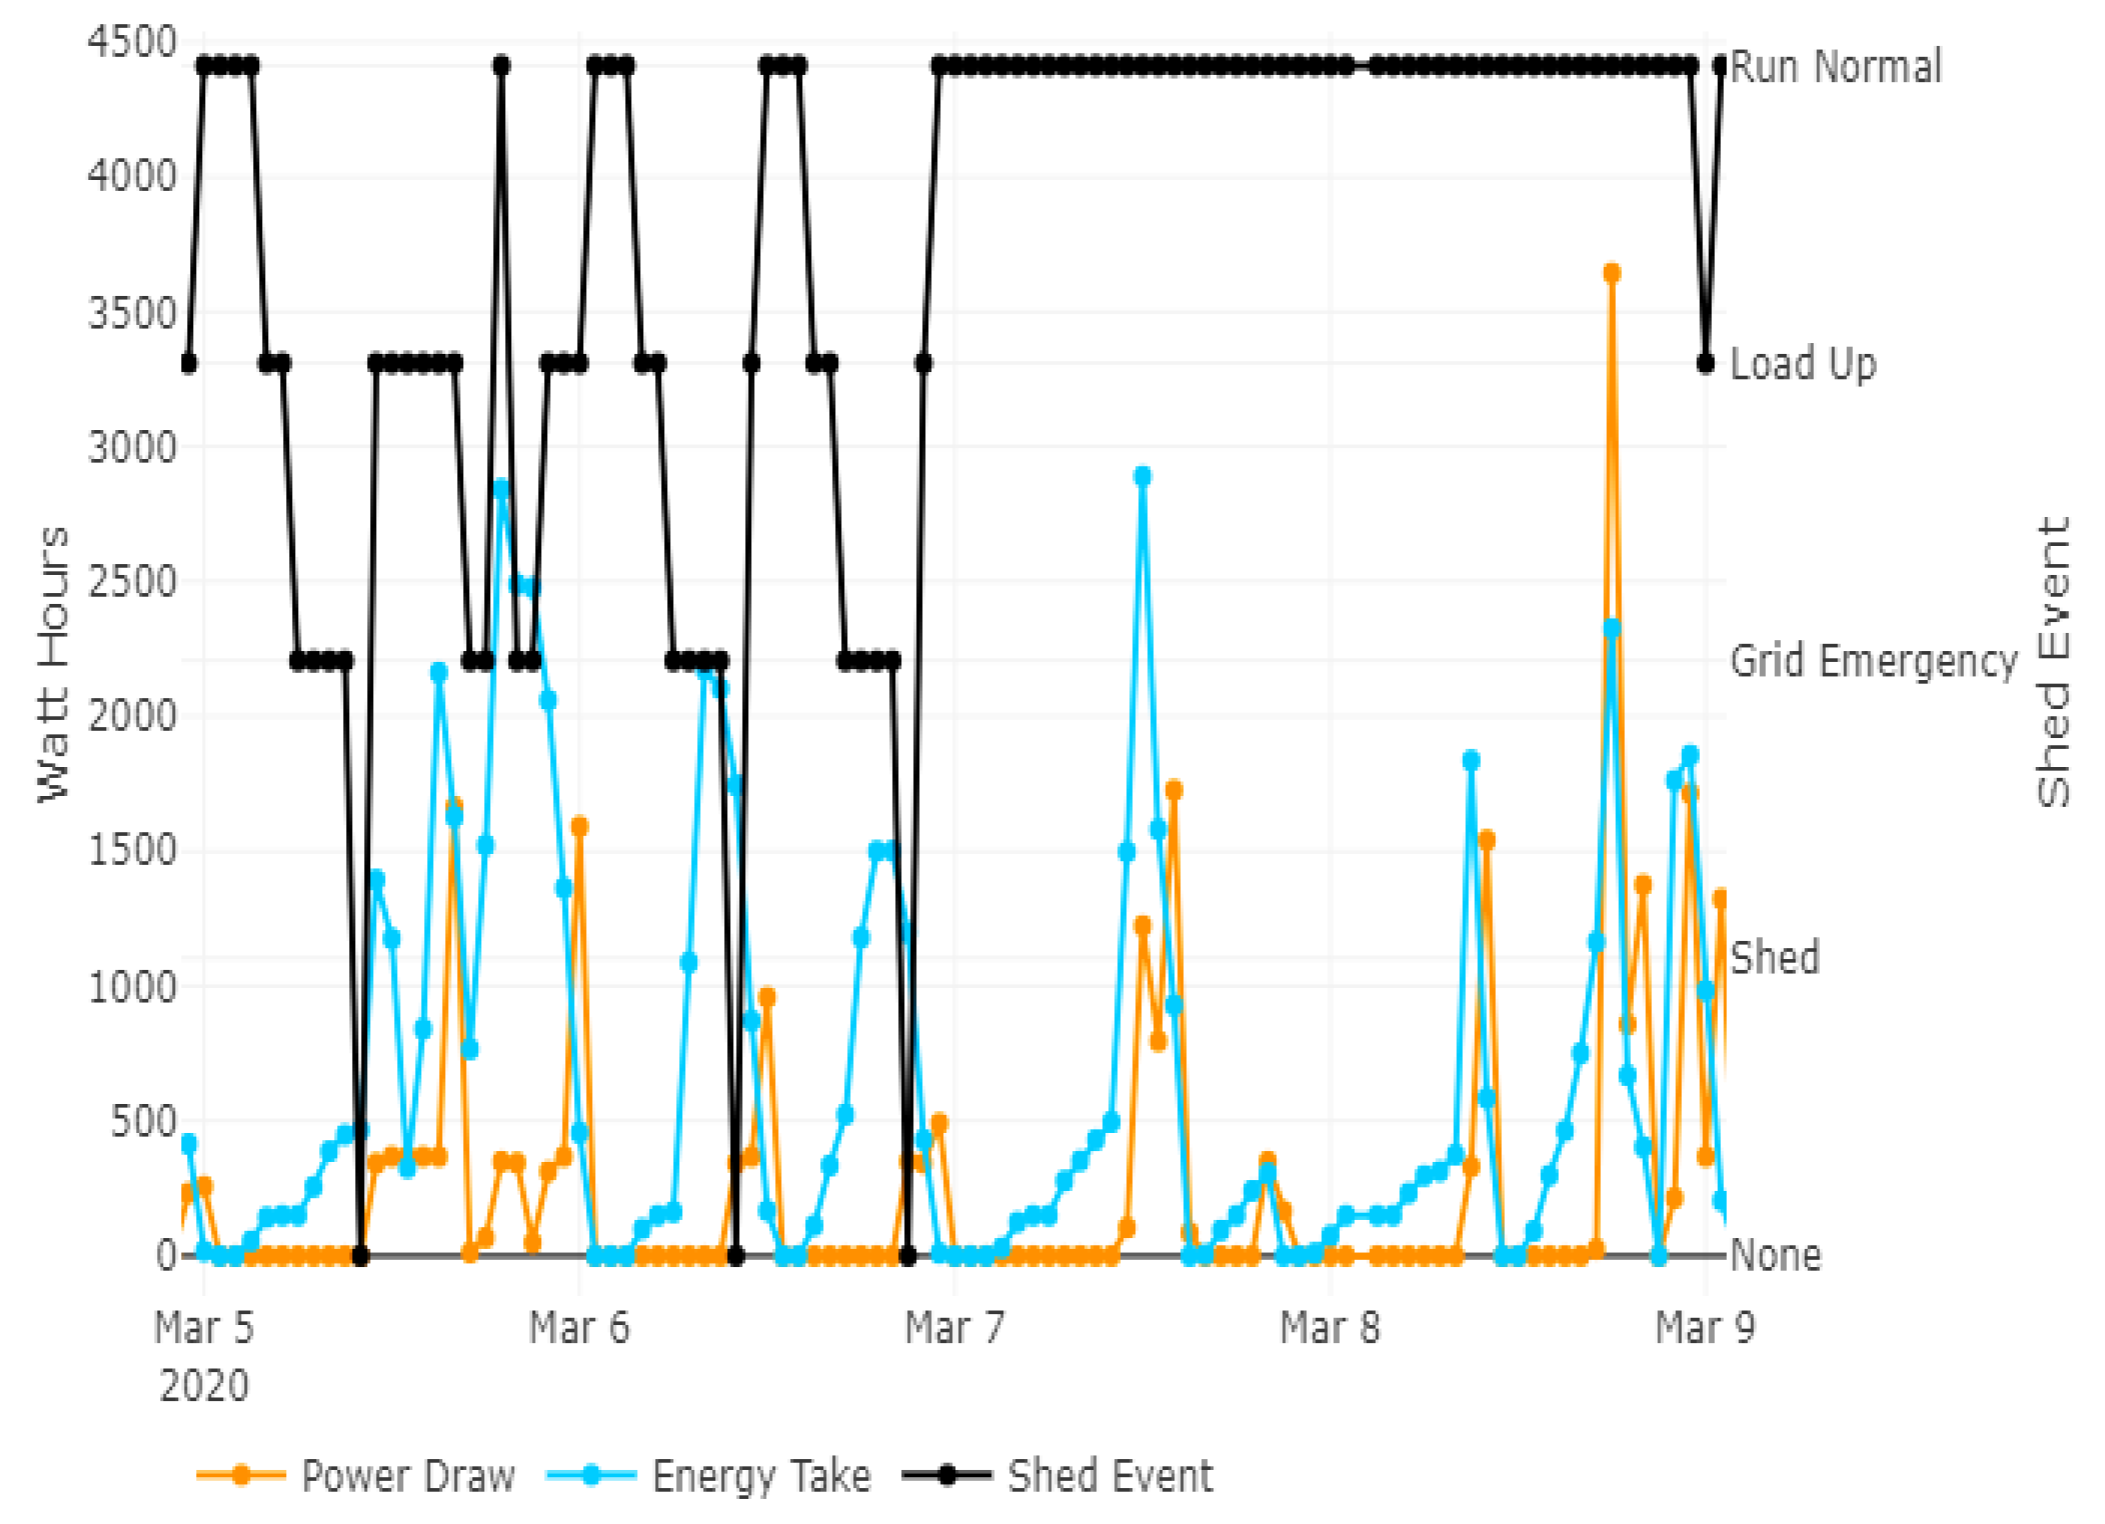
3. Data Analysis
3.1. Data Collection
- curtail type (none, shed, grid emergency, start autonomous cycling, request power level, load up, CTA-2045 error, customer override (opt-out), end shed, terminate autonomous cycling)
- instantaneous power (Watts)
- present energy storage capacity (Watts-hour): current energy required to restore tank to desired temperature.
3.2. Data Adjustments
4. Results
4.1. Consumer Acceptance
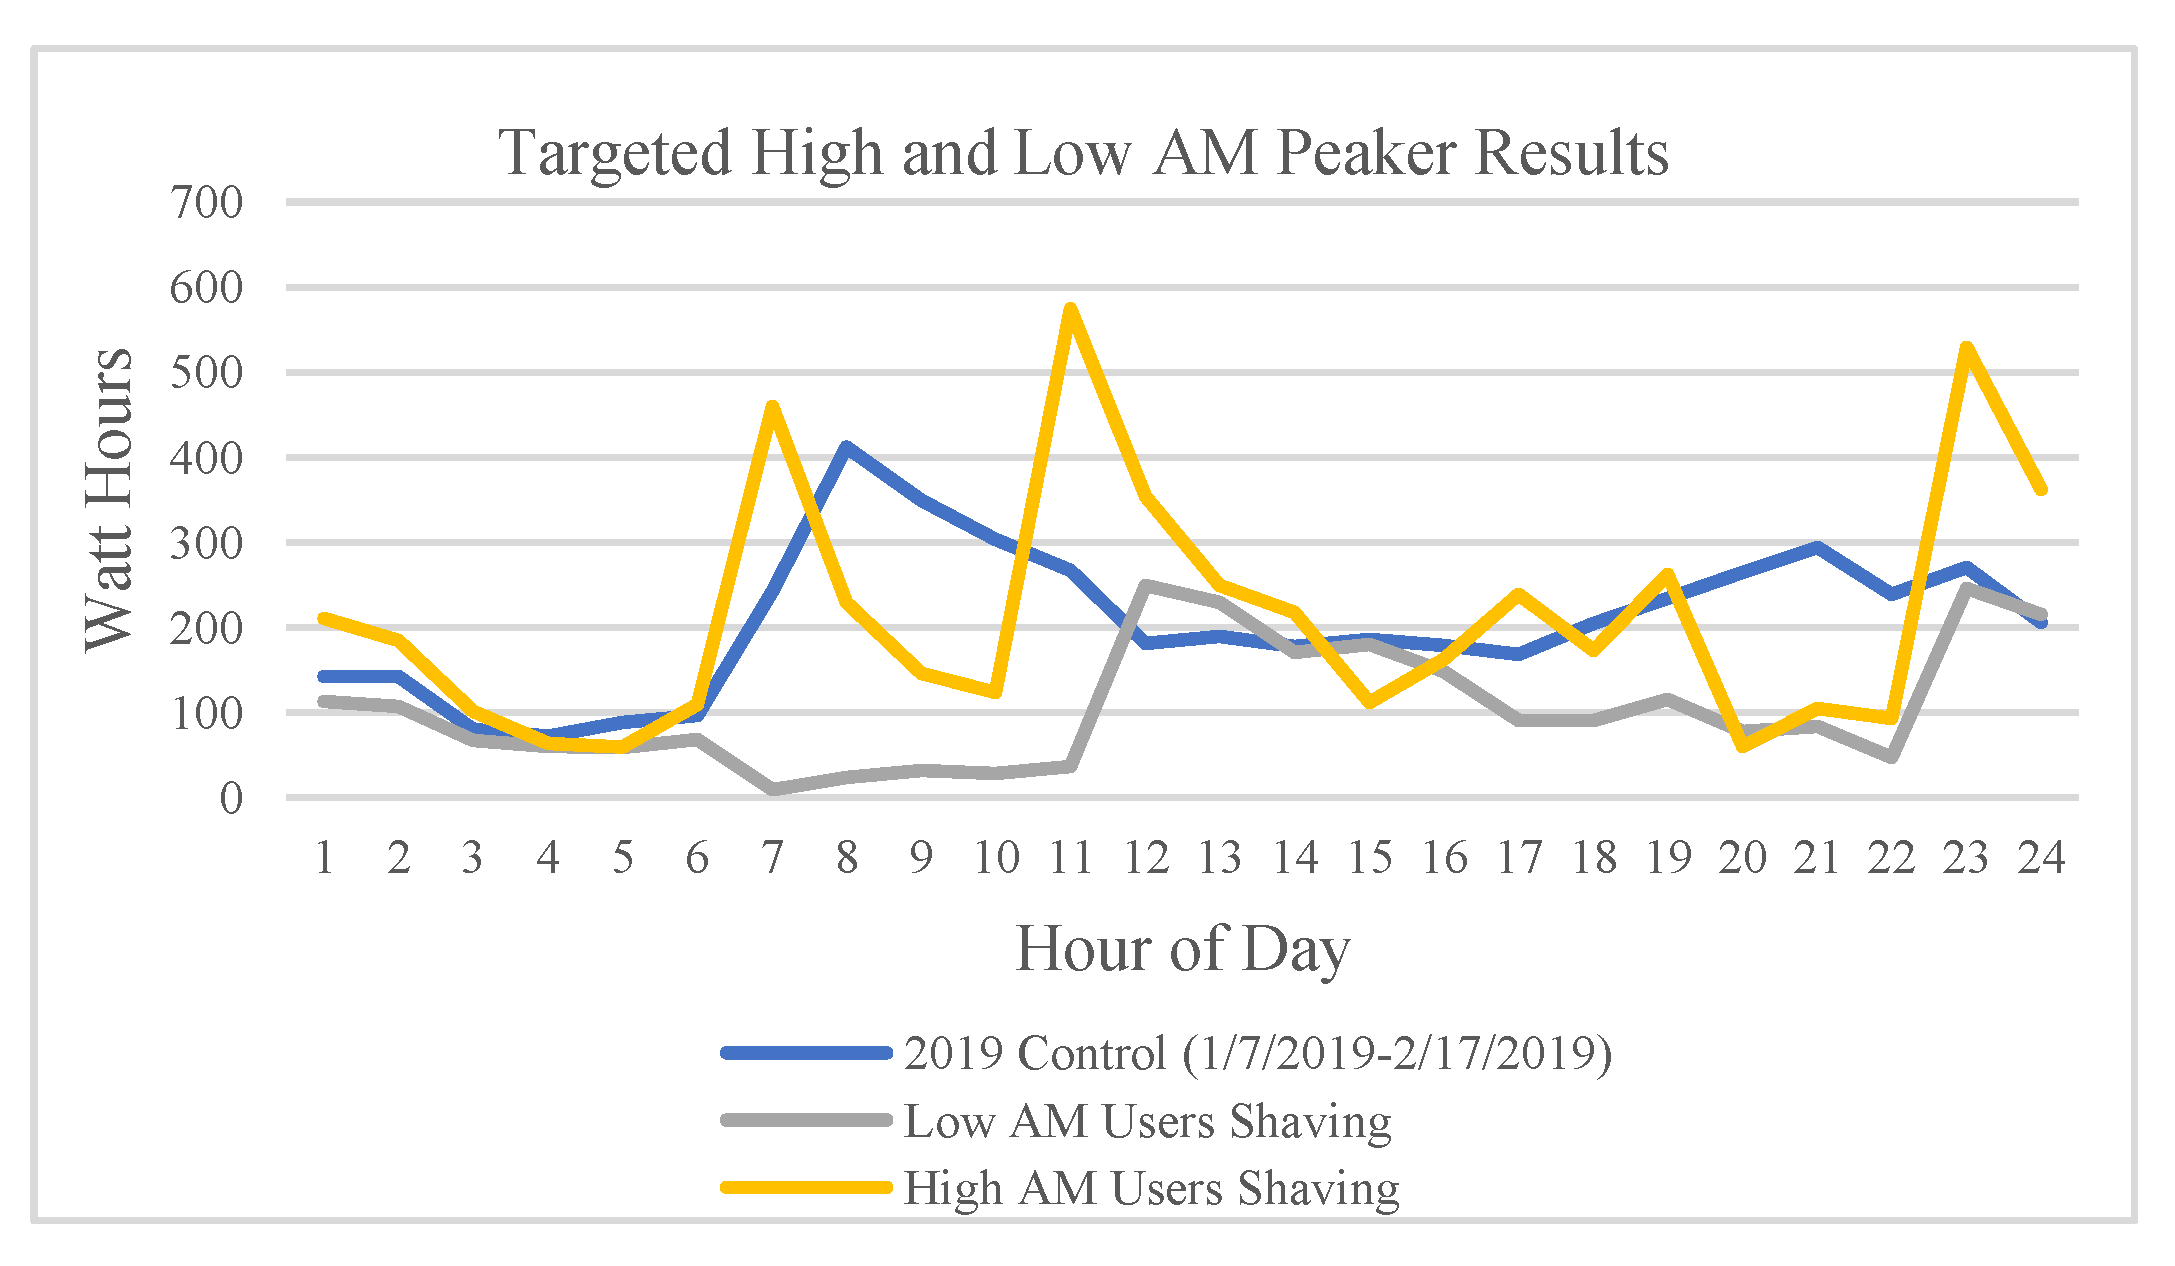
4.2. Peak Load Shifting
5. Discussion
6. Conclusions
7. Industry Recommendations
Author Contributions
Funding
Institutional Review Board Statement
Informed Consent Statement
Data Availability Statement
Conflicts of Interest
References
- National Conference of State Legislatures. State Renewable Portfolio Standards and Goals, National Conference of State Legislatures, 17 April 2020. Available online: https://www.ncsl.org/research/energy/renewable-portfolio-standards.aspx#ca (accessed on 27 August 2020).
- Consumer Technology Association. CTA-2045-A: Modular Communication Interface for Energy Management; Consumer Technology Association, 2018; Available online: https://standards.cta.tech/apps/group_public/project/details.php?project_id=192 (accessed on 1 August 2021).
- Clarke, T.; Slay, T.; Eustis, C.; Bass, R.B. Aggregation of Residential Water Heaters for Peak Shifting and Frequency Response Services. IEEE Open Access J. Power Energy 2020, 7, 22–30. [Google Scholar] [CrossRef]
- U.S. Energy Information Administration. Annual Energy Outlook 2020 with Projections to 2050; EIA: Washington, DC, USA, 2020. Available online: https://www.eia.gov/outlooks/aeo/pdf/aeo2020.pdf (accessed on 30 September 2020).
- Belov, A.; Kartak, V.; Vasenev, A.; Meratnia, N.; Havinga, P.J.M. Load shifting of domestic water heaters under double price tariffs: Bringing together money savings and comfort. In Proceedings of the IEEE PES Innovative Smart Grid Technologies Conference Europe (ISGT-Europe), Ljubljana, Slovenia, 9–12 October 2016; pp. 1–6. Available online: https://ieeexplore.ieee.org/stamp/stamp.jsp?tp=&arnumber=7856302 (accessed on 1 August 2021).
- Pourmousavi, S.A.; Patrick, S.N.; Nehrir, M.H. Real-Time Demand Response Through Aggregate Electric Water Heaters for Load Shifting and Balancing Wind Generation. IEEE Trans. Smart Grid 2014, 5, 769–778. [Google Scholar] [CrossRef]
- Mayhorn, E.T.; Parker, S.A.; Chassin, F.S.; Widder, S.; Pratt, R. Evaluation of the Demand Response Performance of Large Capacity Electric Water Heaters; Pacific Northwest National Laboratory: Washington, DC, USA, 2015. Available online: https://www.pnnl.gov/main/publications/external/technical_reports/PNNL-23527.pdf (accessed on 27 July 2021).
- Delforge, P.; Vukovich, J. Can Heat Pump Water Heaters Teach the California Duck to Fly? Presented at the 2018 Summer Study on Energy Efficiency in Buildings: Making Efficiency Easy and Enticing, Asilomar Conference Grounds, Pacific Grove, CA, USA, 12 August 2018. Available online: https://www.nrdc.org/sites/default/files/hpwh-teach-ca-duck-fly-2018.pdf (accessed on 1 August 2021).
- Abiri-Jahromi, A.; Bouffard, F. Contingency-Type Reserve Leveraged Through Aggregated Thermostatically-Controlled Loads—Part II: Case Studies. IEEE Trans. Power Syst. 2016, 31, 1981–1989. [Google Scholar] [CrossRef]
- Kepplinger, P.; Huber, G.; Petrasch, J. Field testing of demand side management via autonomous optimal control of a domestic hot water heater. Energy Build. 2016, 127, 730–735. [Google Scholar] [CrossRef]
- King, C. Integrating Residential Dynamic Pricing and Load Control: The Literature, 2004. EnergyPulse. 2004. Available online: https://energycentral.com/c/iu/integrating-residential-dynamic-pricing-and-load-control-literature (accessed on 3 July 2021).
- Dutta, G.; Krishnendranath, M. A literature review on dynamic pricing of electricity. J. Oper. Res. Soc. 2017, 68, 1131–1145. [Google Scholar] [CrossRef] [Green Version]
- Crawley, J.; Johnson, C.; Calver, P.; Fell, M. Demand response beyond the numbers: A critical reappraisal of flexibility in two United Kingdom field trials. Energy Res. Soc. Sci. 2021, 75, 102032. [Google Scholar] [CrossRef]
- Fell, M.J.; Shipworth, D.; Huebner, G.M.; Elwell, C.A. Public acceptability of domestic demand-side response in Great Britain: The role of automation and direct load control. Energy Res. Soc. Sci. 2015, 9, 72–84. [Google Scholar] [CrossRef] [Green Version]
- Nair, N.-K.; Nayagam, R.; Francis, R. New Zealand utility experiences with demand side management. In Proceedings of the 2008 IEEE Power and Energy Society General Meeting—Conversion and Delivery of Electrical Energy in the 21st Century, Pittsburgh, PA, USA, 20–24 July 2008; pp. 1–5. [Google Scholar] [CrossRef]
- Teive, R.C.G.; Vilvert, S.H. Demand side management for residential consumers by using direct control on the loads. In Proceedings of the 2002 Fifth International Conference on Power System Management and Control, London, UK, 17–19 April 2002; Institute of Engineering Technology (IET). pp. 233–237. [Google Scholar] [CrossRef]
- Qureshi, J.A.; Gul, M.; Qureshi, W.A. Demand Side Management through innovative load control. In Proceedings of the TENCON 2010–2010 IEEE Region 10 Conference, Fukuoka, Japan, 21–24 November 2010; pp. 580–585. [Google Scholar] [CrossRef]
- Khanna, I. Smart Grid application: Peak demand management trial—the Western Australian experience. In Proceedings of the 2011 IEEE PES Innovative Smart Grid Technologies, Perth, Australia, 13–16 November 2011; pp. 1–6. [Google Scholar] [CrossRef]
- Yagita, Y.; Iwafune, Y. Residential energy use and energy-saving of older adults: A case from Japan, the fastest-aging country. Energy Res. Soc. Sci. 2021, 75, 102022. [Google Scholar] [CrossRef]
- Yilmaz, S.; Cuony, P.; Chanez, C. Prioritize your heat pump or electric vehicle? Analysing design preferences for Direct Load Control programmes in Swiss households. Energy Res. Soc. Sci. 2021, 82, 102319. [Google Scholar]
- Ericson, T. Direct load control of residential water heaters. Energy Policy 2009, 37, 3502–3512. [Google Scholar] [CrossRef] [Green Version]
- Metzger, C.E.; Ashley, T.A.; Bender, S.; Kelsven, P.; Kelly, N.; Eustis, C.; Not Your Father’s Water Heater Demand Response Program: Measuring Impacts from an Innovative Load Shifting Pilot. Presented at the International Energy Program Evaluation Conference, Denver, CO, USA, 19–22 August 2019. Available online: https://www.iepec.org/2019_proceedings/index.html#/paper/event-data/055-pdf (accessed on 1 August 2021).
- Metzger, C.E.; Ashley, T.; Bender, S.; Morris, S.; Kelsven, P.; Urbatsch, E.; Kelly, N.; Eustis, C.; Large Scale Demand Response with Heat Pump Water Heaters. Presented at the 2018 ACEEE Summer Study on Energy Efficiency in Buildings, Asilomar Conference Center, Pacific Grove, CA, USA, 12–17 August 2018. Available online: https://www.aceee.org/files/proceedings/2018/#/paper/event-data/p052 (accessed on 3 August 2021).
- Stitt, J.R. Implementation of a large-scale direct load control system-some critical factors. IEEE Trans. Power Appar. Syst. 1985, 7, 1663–1669. [Google Scholar] [CrossRef]
- McIntyre, J.M.; Ciecior, L.; Kaspar, A.; Castrop, D. Distributed intelligence in load control: Results of an experiment using demand limiting devices for residential load control. IEEE Trans. Power Appar. Syst. 1985, 5, 1140–1146. [Google Scholar] [CrossRef]
- Bischke, R.F.; Sella, R.A. Design and controlled use of water heater load management. IEEE Trans. Power Appar. Syst. 1985, 6, 1290–1293. [Google Scholar] [CrossRef]
- Lee, S.H.; Wilkins, C.L. A practical approach to appliance load control analysis: A water heater case study. IEEE Trans. Power Appar. Syst. 1983, 4, 1007–1013. [Google Scholar] [CrossRef]
- Hledik, R.; Lueken, R.; Chang, J. The hidden battery: Opportunities in electric water heating; The Brattle Group, January 2016. Available online: https://www.electric.coop/wp-content/uploads/2016/07/The-Hidden-Battery-01-25-2016.pdf (accessed on 1 August 2021).
- CTA-2045 Water Heater Demonstration Report Including a Business Case for CTA-2045 Market Transformation; Technology Innovation Project 336; Bonneville Power Administration: Portland, OR, USA, 2018.
- Emerging Codes and Standards for Grid-Interactive Buildings, January 2021, Northeast Energy Efficiency Partnerships. Available online: https://neep.org/sites/default/files/media-files/grid_final_formatted.pdf (accessed on 1 August 2021).


| High-Level Control Strategy | Approximate Count of Controlled Water Heaters | Study Period |
|---|---|---|
| Non-targeted Flip-Flop Groups | ~150 HPWHs | January–mid-February 2019 |
| a.m./p.m. Target Groups | ~150 HPWHs | mid-February–March 2019 |
| Third-Party “Smart” Proprietary Individual Control | ~60 HPWHs | February–March 2020 |
| Week Start Date | Event Group Name | Morning Event Times | Afternoon Event Times | Average Outdoor Temp (°F) | Average Outdoor Temp (°C) |
|---|---|---|---|---|---|
| 7 January 2019 | Group 1 | 7–10 a.m. | 10 p.m.–1 a.m. | 43.8 | 6.6 |
| 14 January 2019 | Group 2 | 7–10 a.m. | 10 p.m.–1 a.m. | 42.6 | 5.9 |
| 21 January 2019 | Group 1 | 6–9 a.m. | 6–9 p.m. | 45.6 | 7.6 |
| 28 January 2019 | Group 2 | 6–9 a.m. | 6–9 p.m. | 42.1 | 5.6 |
| 4 February 2019 | Group 1 | 8–11 a.m. | 10 p.m.–1 a.m. | 32.0 | 0.0 |
| 11 February 2019 | Group 2 | 8–11 a.m. | 10 p.m.–1 a.m. | 40.6 | 4.8 |
| Week Start Date | Event Group Name | Shed Event Times | Average Outdoor Temp (°F) | Average Outdoor Temp (°C) |
|---|---|---|---|---|
| 18 February 2019 | Low a.m. Peakers | 6–11 a.m. | 38.5 | 3.6 |
| High a.m. Peakers | 7–10 a.m. | |||
| 25 February 2019 | Low a.m. Peakers | 6–11 a.m. | 35.4 | 1.9 |
| High a.m. Peakers | 7–10 a.m. | |||
| 4 March 2019 | Low p.m. Peakers | 5–10 p.m. | 35.7 | 2.1 |
| High p.m. Peakers | 7–10 p.m. | |||
| 11 March 2019 | Low p.m. Peakers | 5–10 p.m. | 45.0 | 7.2 |
| High p.m. Peakers | 7–10 p.m. | |||
| 18 March 2019 | Low a.m. Peakers | 6–11 a.m. | 55.6 | 13.1 |
| High a.m. Peakers | 7–10 a.m. | |||
| Low p.m. Peakers | 5–10 p.m. | |||
| High p.m. Peakers | 7–10 p.m. | |||
| 25 March 2019 | Low a.m. Peakers | 6–11 a.m. | 48.7 | 9.3 |
| High a.m. Peakers | 7–10 a.m. | |||
| Low p.m. Peakers | 5–10 p.m. | |||
| High p.m. Peakers | 7–10 p.m. |
| Week Start Date | Curtailment Command | Morning Event Times | Afternoon Event Times | Average Outdoor Temp (°F) | Average Outdoor Temp (°C) |
|---|---|---|---|---|---|
| 3 February 2020 | Shed | 6–11 a.m. | 5–10 p.m. | 45.0 | 7.2 |
| 10 February 2020 | Critical Peak | 6–11 a.m. | 5–10 p.m. | 41.8 | 5.4 |
| 17 February 2020 | Critical Peak | 6–11 a.m. | 5–10 p.m. | 42.9 | 6.1 |
| 24 February 2020 | Grid Emergency | 6–11 a.m. | 5–10 p.m. | 44.1 | 6.7 |
| 2 March2020 | Grid Emergency | 6–11 a.m. | 5–10 p.m. | 48.3 | 9.1 |
| 9 March 2020 | Shed | 6–11 a.m. | 5–10 p.m. | 43.3 | 6.3 |
| 23 March 2020 | Shed | Hourly variable price schedule | 45.0 | 7.2 | |
| Strategy Type | Event Duration | Event Time Range | Command | Weeks | Opt-Outs/Events * | Complaints Reported ** |
|---|---|---|---|---|---|---|
| Non-targeted | 3 h | 6–11 a.m. 5–10 p.m. | Shed | 6 | 4/4200 | 0 |
| Targeted | 3–5 h | 6–11 a.m. 5–10 p.m. | Shed | 5 | 2/4190 | 0 |
| Smart | 5 h | 6–11 a.m. 5–10 p.m. | Shed | 2 | 0/1160 | 0 |
| Smart | 5 h | 6–11 a.m. 5–10 p.m. | CPP | 2 | 0/1220 | 1 |
| Smart | 5 h | 6–11 a.m. 5–10 p.m. | Grid emergency | 2 | 1/1180 | 2 |
| Smart | Hourly | Hourly price schedule | Shed | 1 | 1/165 | 1 |
| Hour of Day | Hour of Week | Average Low A.M. Peaker Shaving (Watts/Hour) | Average High A.M. Peaker Shaving (Watts/Hour) |
|---|---|---|---|
| 4 | 77 | −25 | 73 |
| 5 | 78 | −34 | 48 |
| 6 | 79 | 49 | −50 |
| 7 | 80 | 98 | 461 |
| 8 | 81 | 152 | 401 |
| 9 | 82 | 136 | 340 |
| 10 | 83 | 170 | −229 |
| 11 | 84 | −104 | −113 |
| 12 | 85 | −89 | 14 |
| Hour of Day | Hour of Week | Average Smart Shed Shaving (Watts/Hour) | Average Smart CPP Shaving (Watts/Hour) | Average Smart Emergency Shaving (Watts/Hour) |
|---|---|---|---|---|
| 4 | 77 | −37 | −5 | 2 |
| 5 | 78 | -9 | 35 | 40 |
| 6 | 79 | 90 | 176 | 173 |
| 7 | 80 | 199 | 216 | 243 |
| 8 | 81 | 159 | 139 | 235 |
| 9 | 82 | 205 | 207 | 218 |
| 10 | 83 | −82 | 133 | 147 |
| 11 | 84 | −140 | −355 | −394 |
| 12 | 85 | −11 | −160 | −232 |
| Strategy Type | Event Duration | Event Time Range | Number of Weeks Averaged | Average Energy Shifted per Event (Wh) |
|---|---|---|---|---|
| Non-targeted (Shed) | 3 h | 6–11 1 a.m. | 6 | 620 |
| Targeted (Shed) | High a.m.—3 h Low a.m.—5 h | 7–10 a.m. 6–11 a.m. | 3 | 596 |
| Smart (Shed) | 5 h | 6–11 a.m. | 2 | 608 |
| Smart (CPP) | 5 h | 6–11 a.m. | 2 | 736 |
| Smart (Grid Emergency) | 5 h | 6–11 a.m. | 2 | 863 |
| Strategy Type | Event Duration | Event Time Range | Number of Weeks Averaged | Average Energy Shifted per Event (Wh) |
|---|---|---|---|---|
| Non-targeted (Shed) | 3 h | 6–9 p.m. | 1 | 622 |
| Targeted (Shed) | High p.m.—3 h Low p.m.—5 h | 7–10 p.m. 5–10 p.m. | 4 | 740 |
| Smart (Shed) | 5 h | 5–10 p.m. | 2 | 607 |
| Smart (CPP) | 5 h | 5–10 p.m. | 2 | 731 |
| Smart (Grid Emergency) | 5 h | 5–10 p.m. | 2 | 819 |
Publisher’s Note: MDPI stays neutral with regard to jurisdictional claims in published maps and institutional affiliations. |
© 2021 by the authors. Licensee MDPI, Basel, Switzerland. This article is an open access article distributed under the terms and conditions of the Creative Commons Attribution (CC BY) license (https://creativecommons.org/licenses/by/4.0/).
Share and Cite
Obi, M.; Metzger, C.; Mayhorn, E.; Ashley, T.; Hunt, W. Nontargeted vs. Targeted vs. Smart Load Shifting Using Heat Pump Water Heaters. Energies 2021, 14, 7574. https://doi.org/10.3390/en14227574
Obi M, Metzger C, Mayhorn E, Ashley T, Hunt W. Nontargeted vs. Targeted vs. Smart Load Shifting Using Heat Pump Water Heaters. Energies. 2021; 14(22):7574. https://doi.org/10.3390/en14227574
Chicago/Turabian StyleObi, Manasseh, Cheryn Metzger, Ebony Mayhorn, Travis Ashley, and Walter Hunt. 2021. "Nontargeted vs. Targeted vs. Smart Load Shifting Using Heat Pump Water Heaters" Energies 14, no. 22: 7574. https://doi.org/10.3390/en14227574