
Numerical Simulation of Combustion and Characteristics of Fly Ash and Slag in a “V-type” Waste Incinerator

 ,
,
Abstract
:1. Introduction
2. Materials and Methods
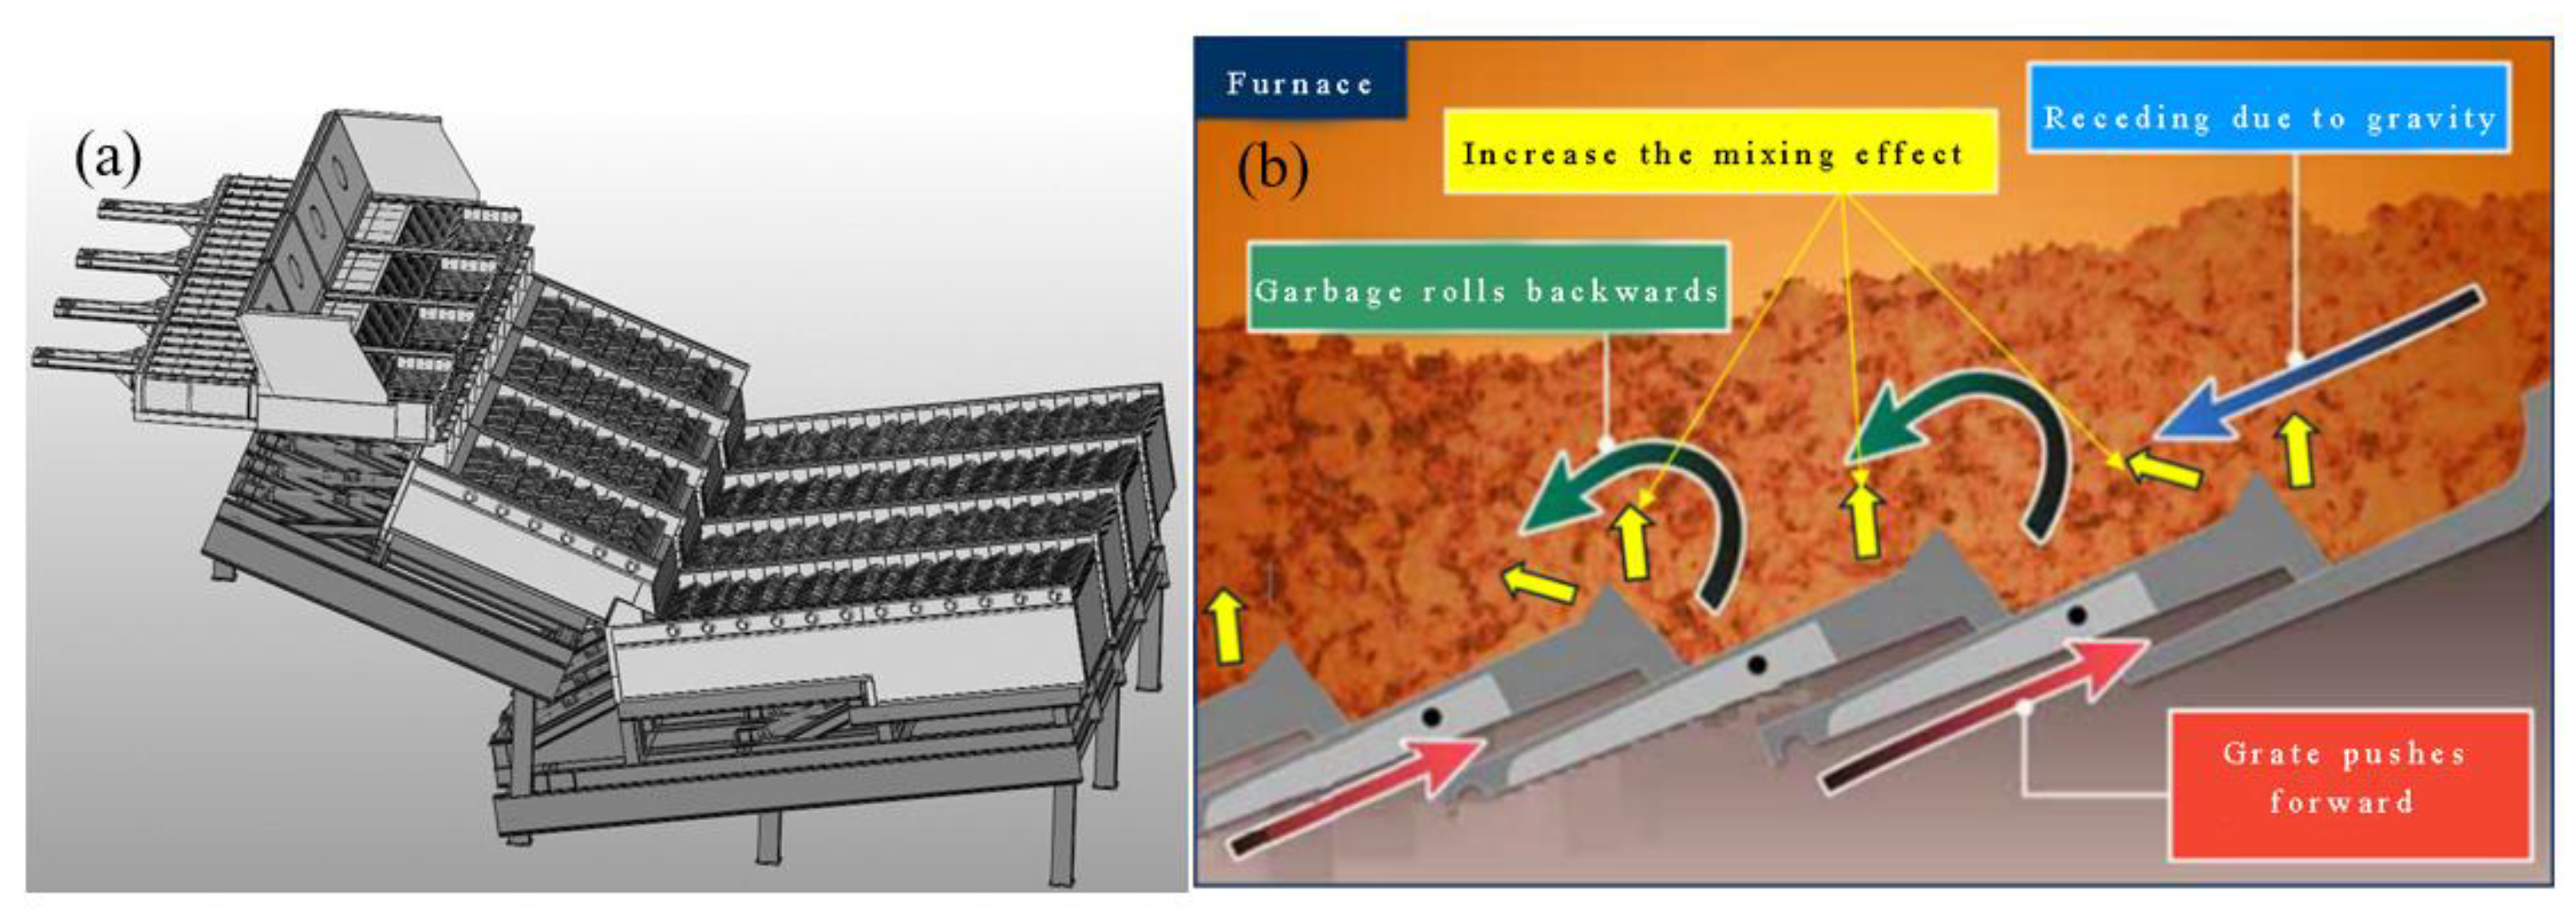
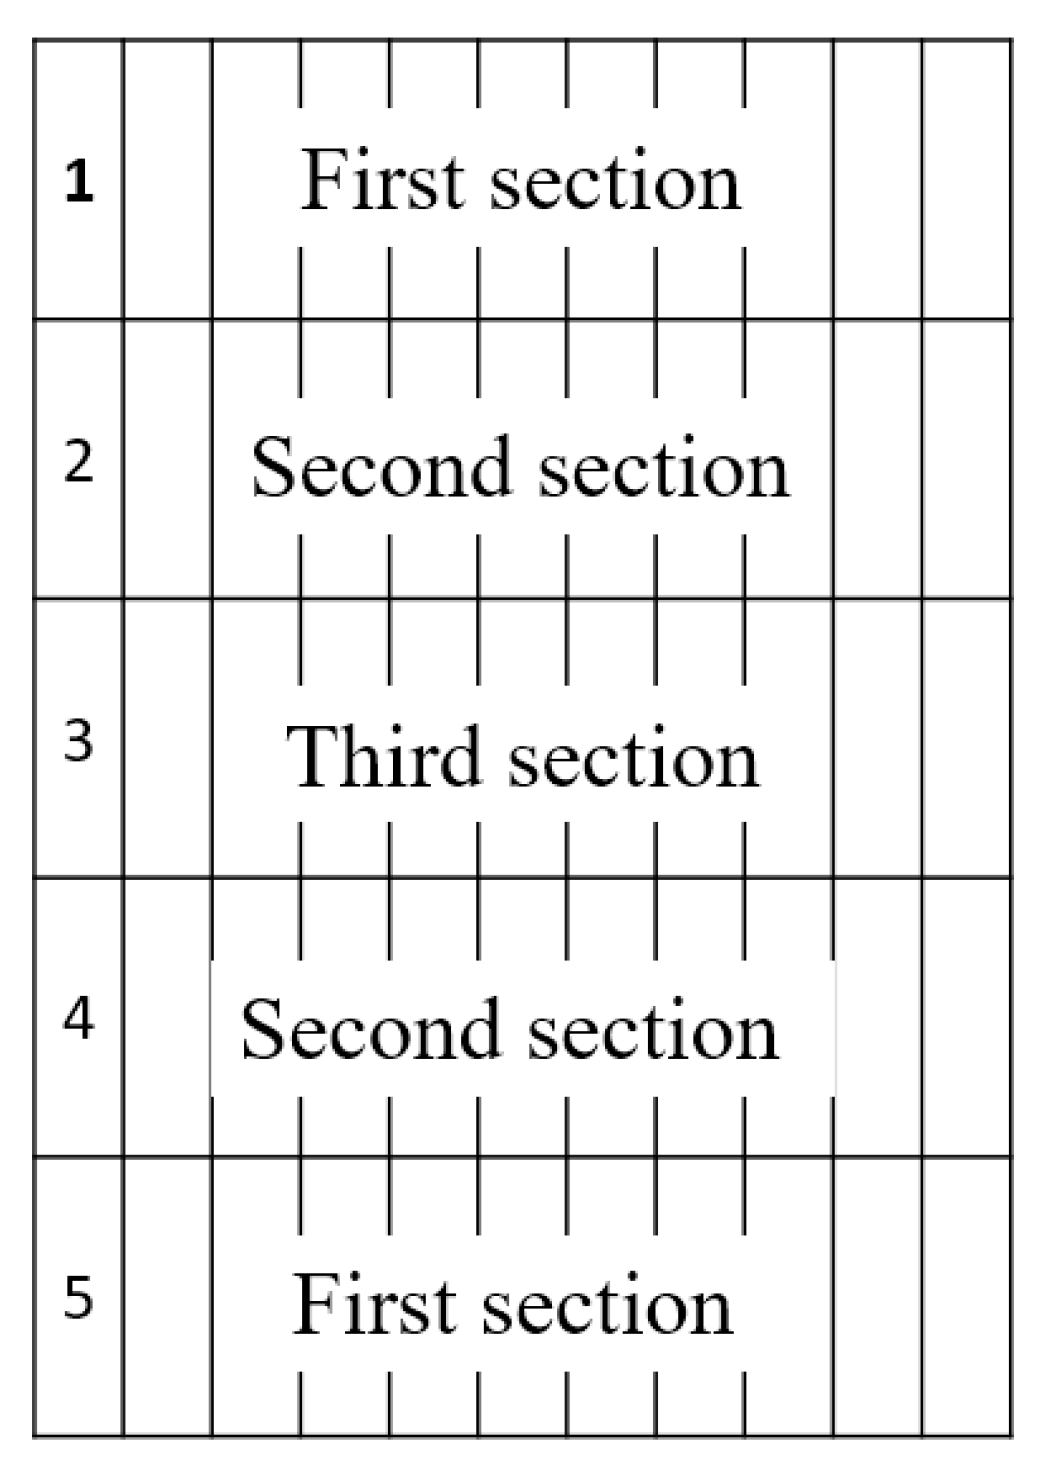
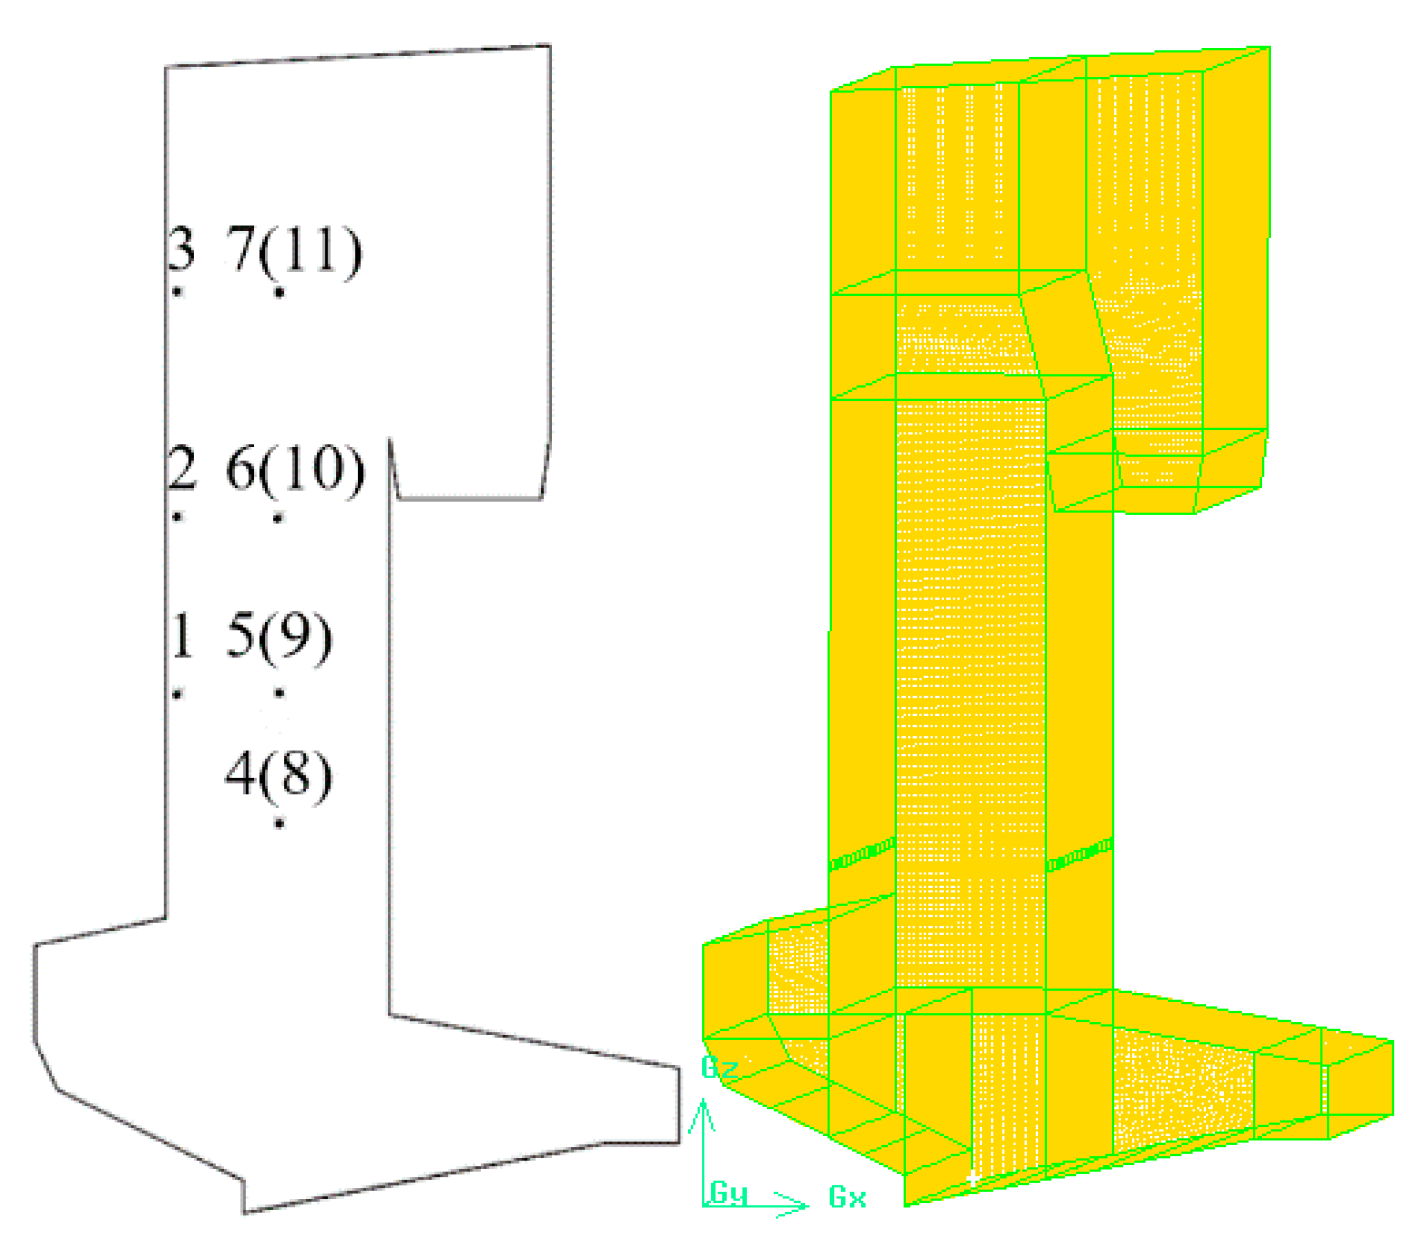
2.1. Numerical Model
2.2. Computational Conditions
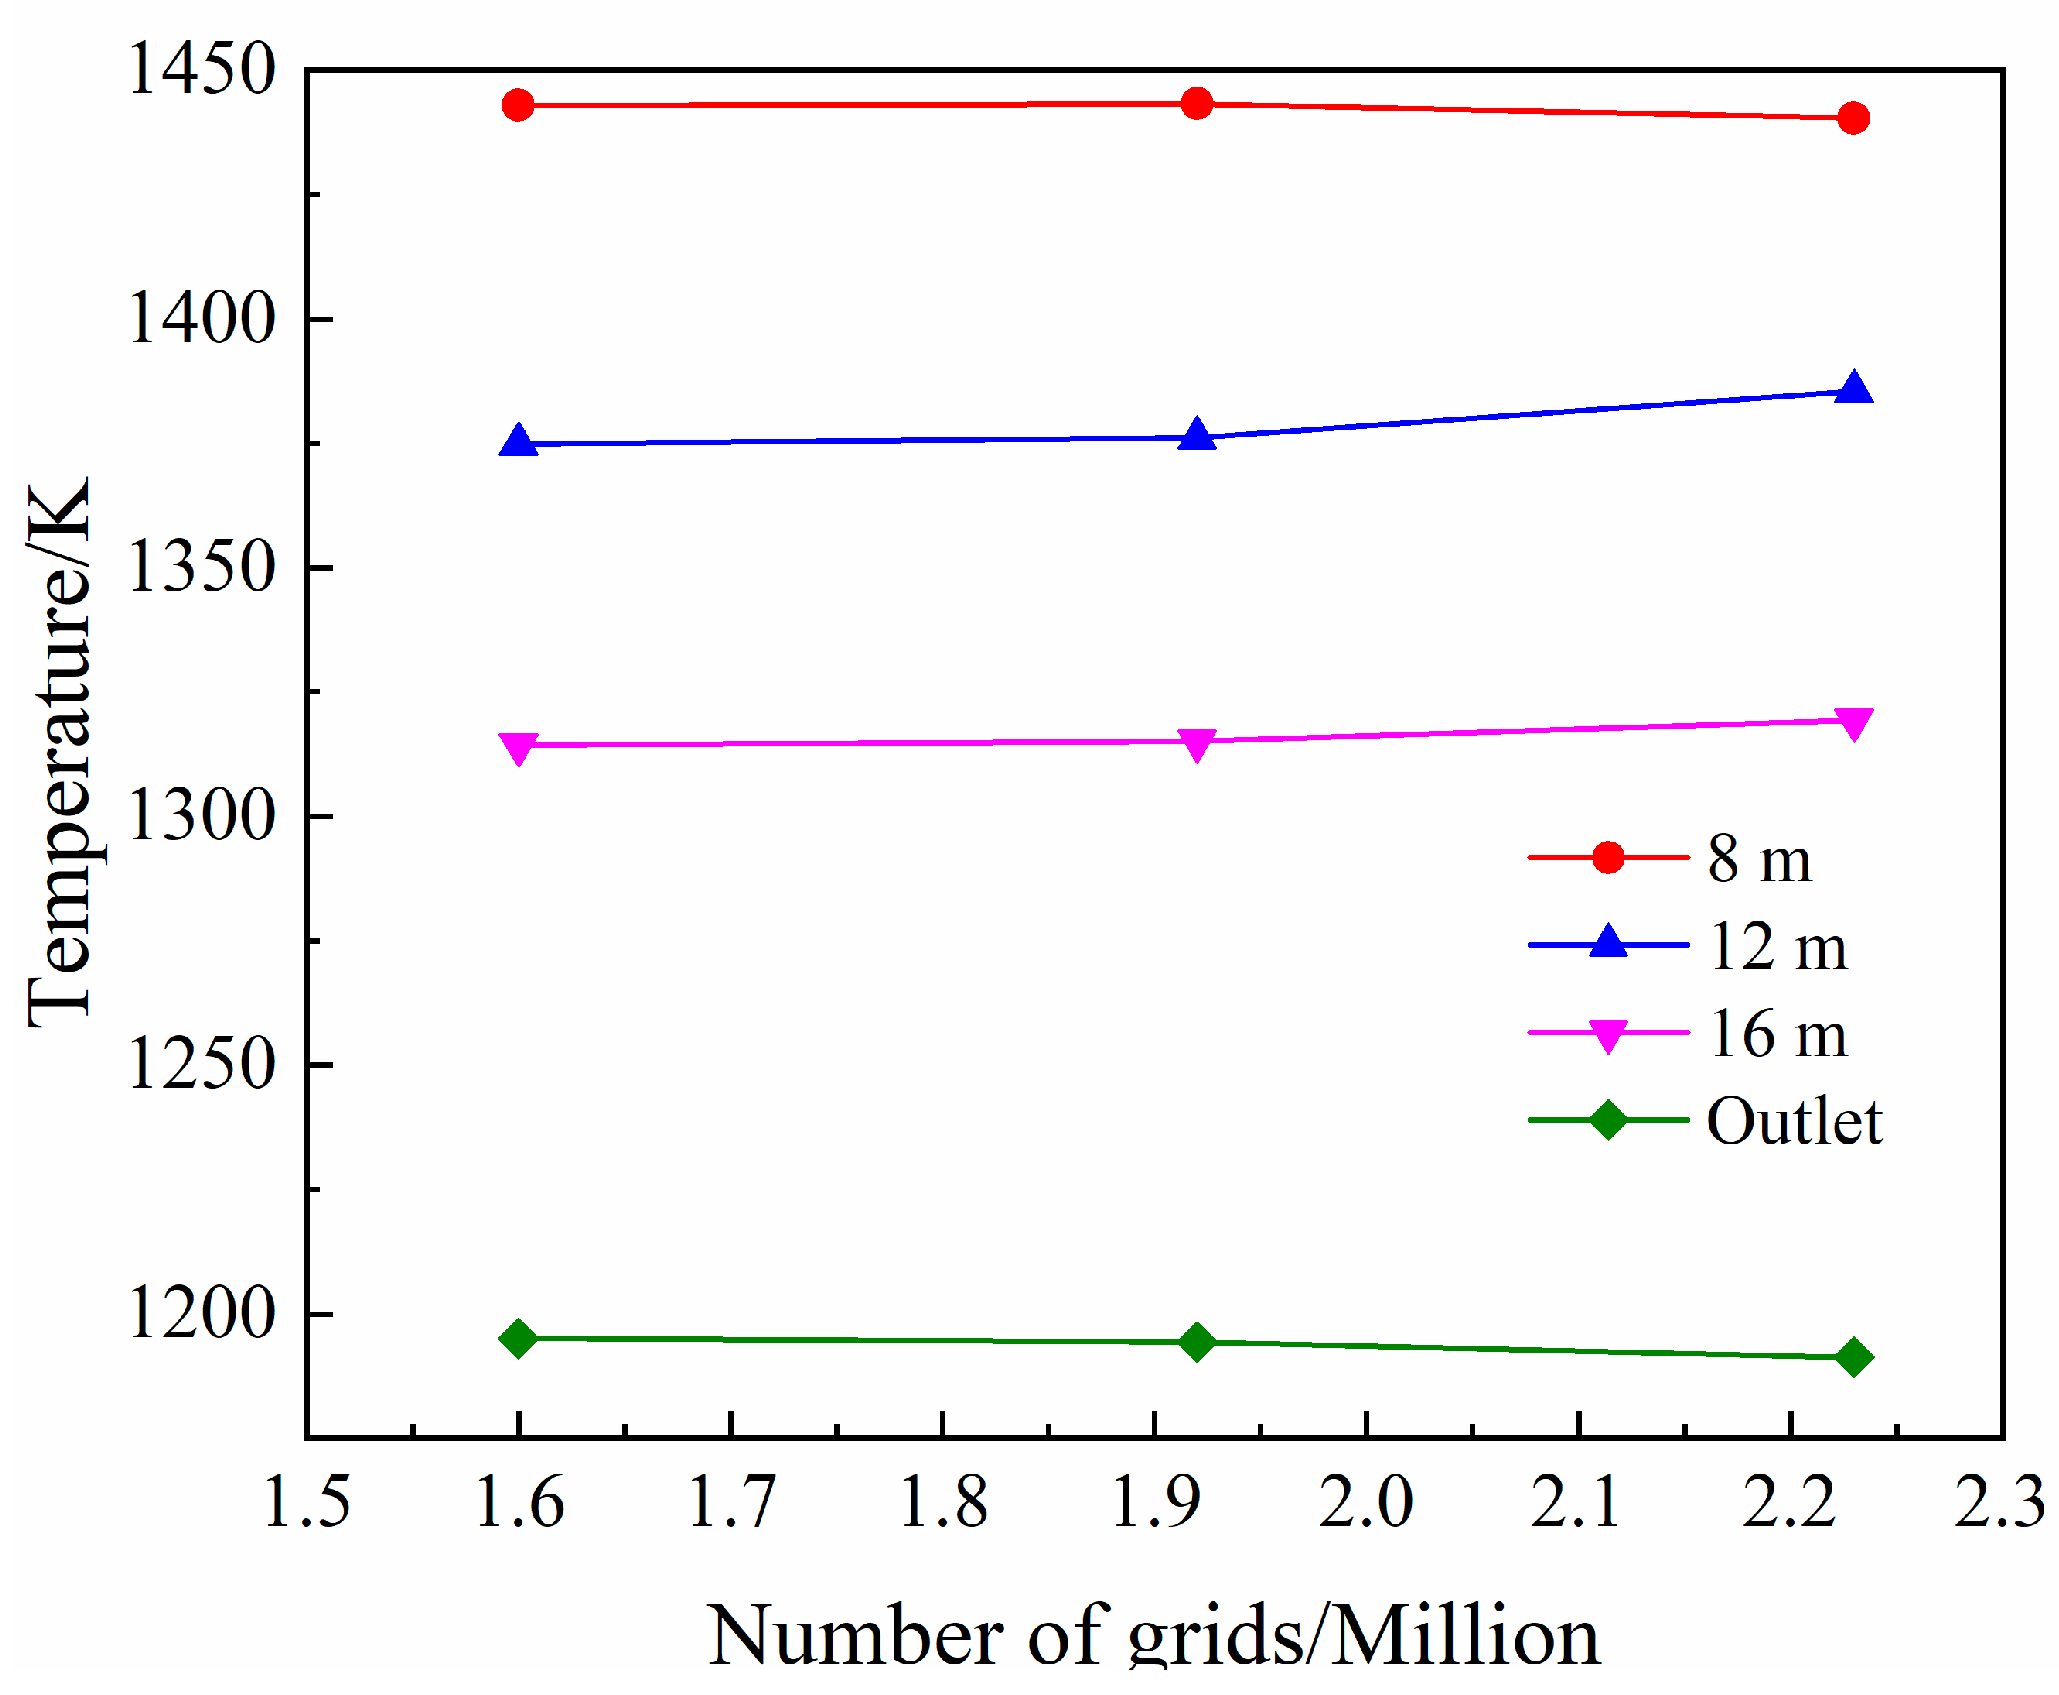
2.3. Grid Independence Verification
2.4. Model Reliability Verification
2.5. Materials
3. Results
3.1. Combustion Simulation Results
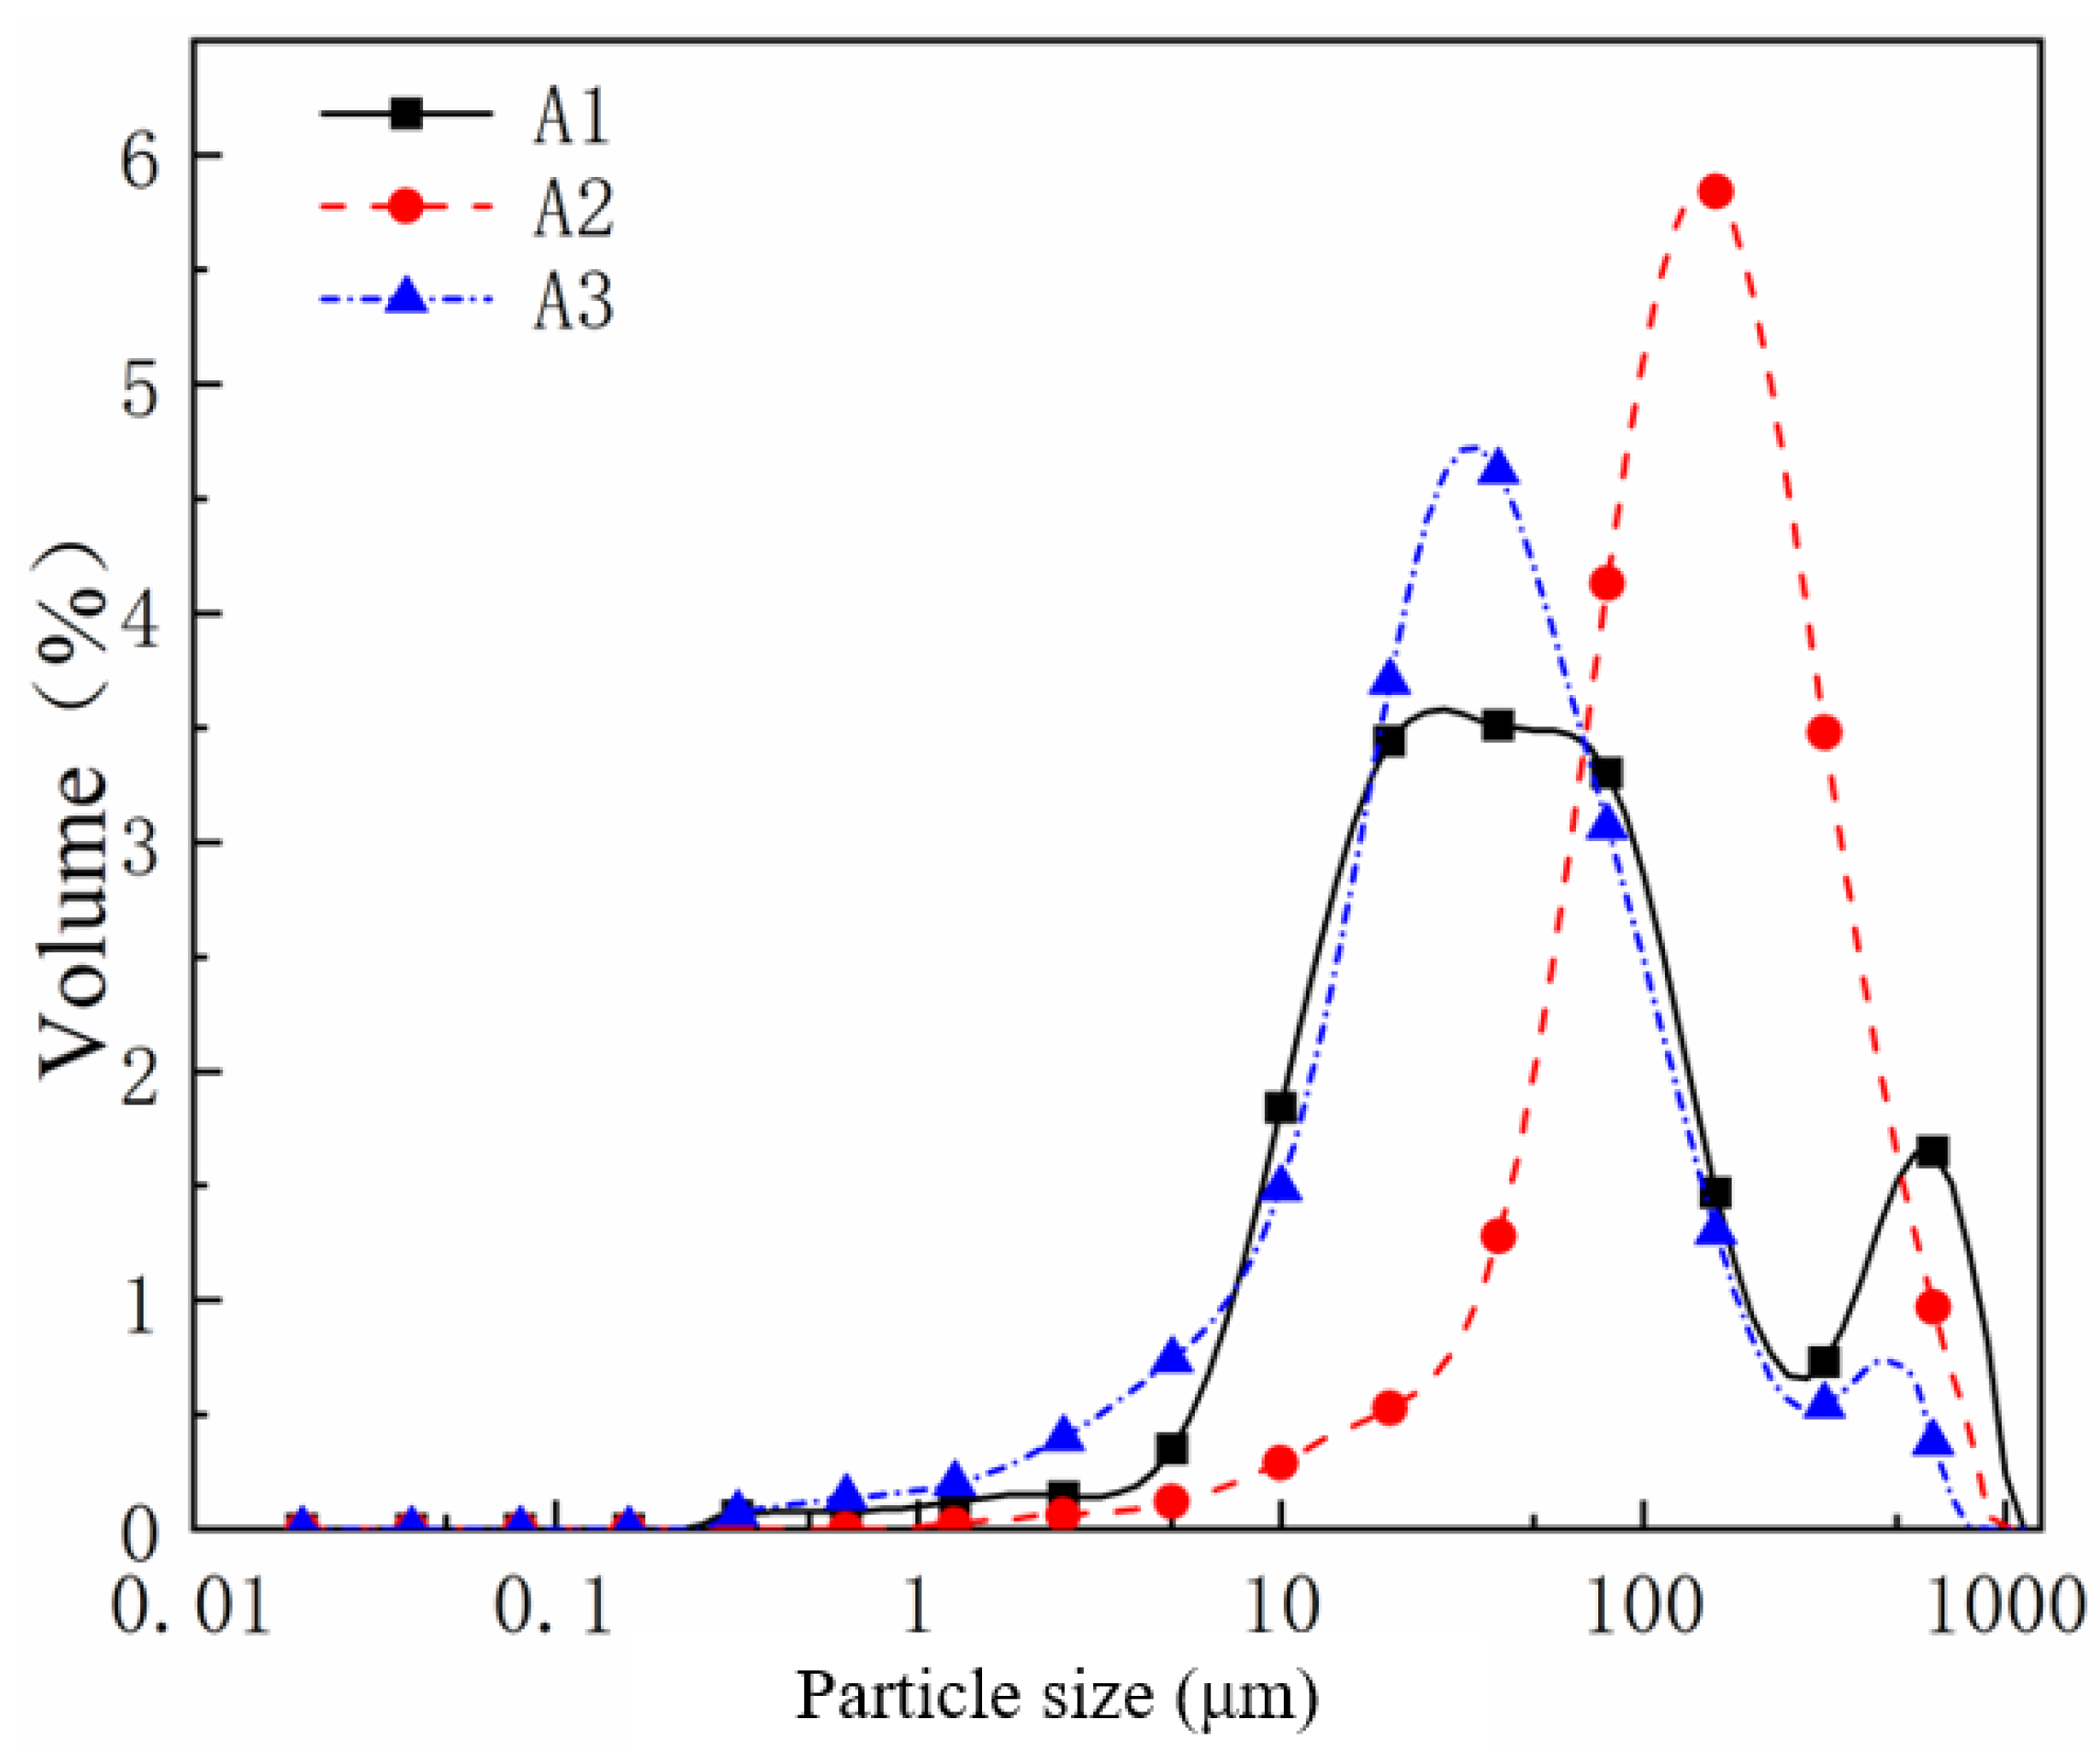
3.2. Particle Size Distribution of Fly Ash
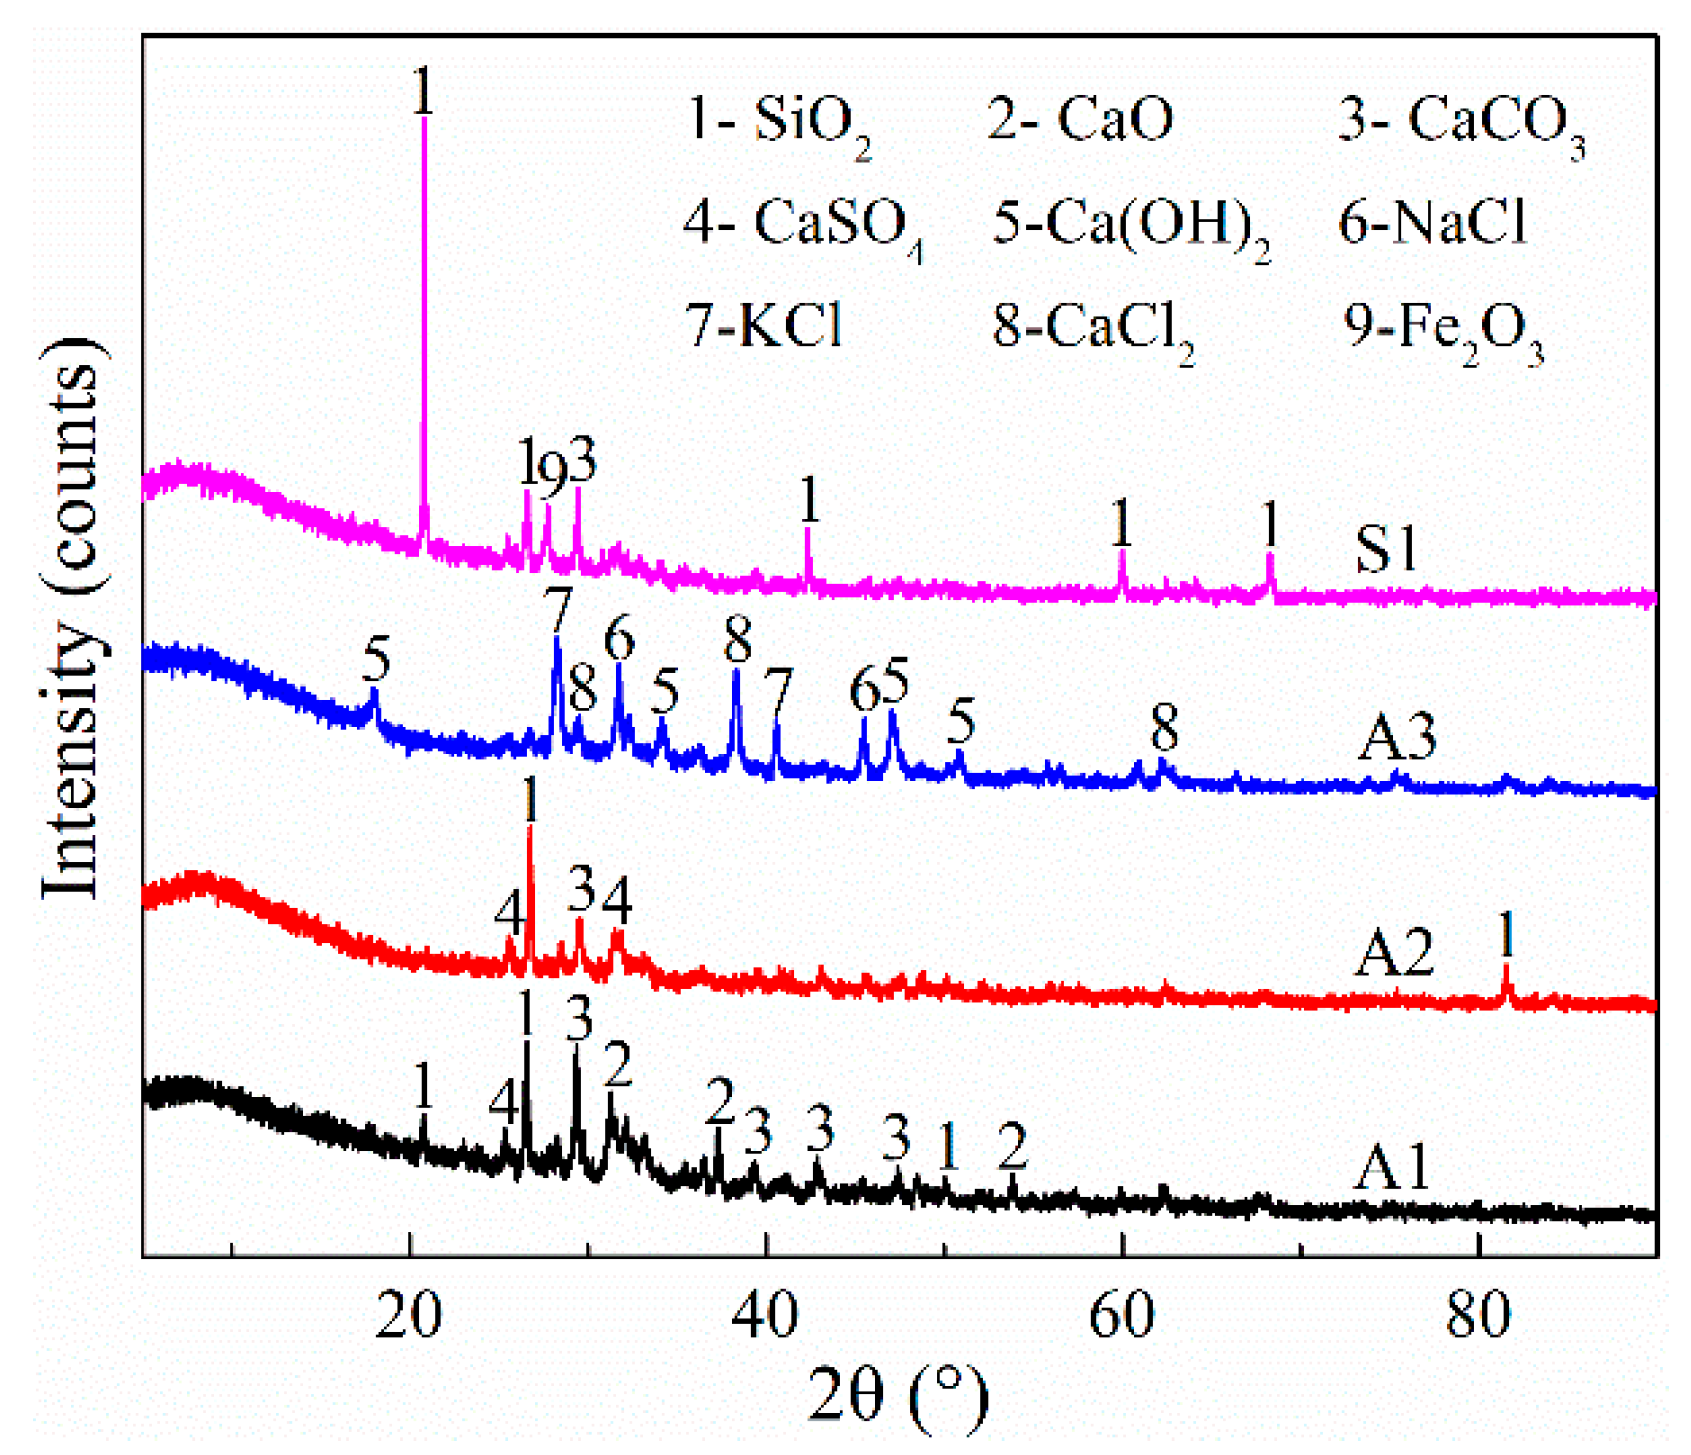
3.3. XRF and XRD Analysis of Fly Ash
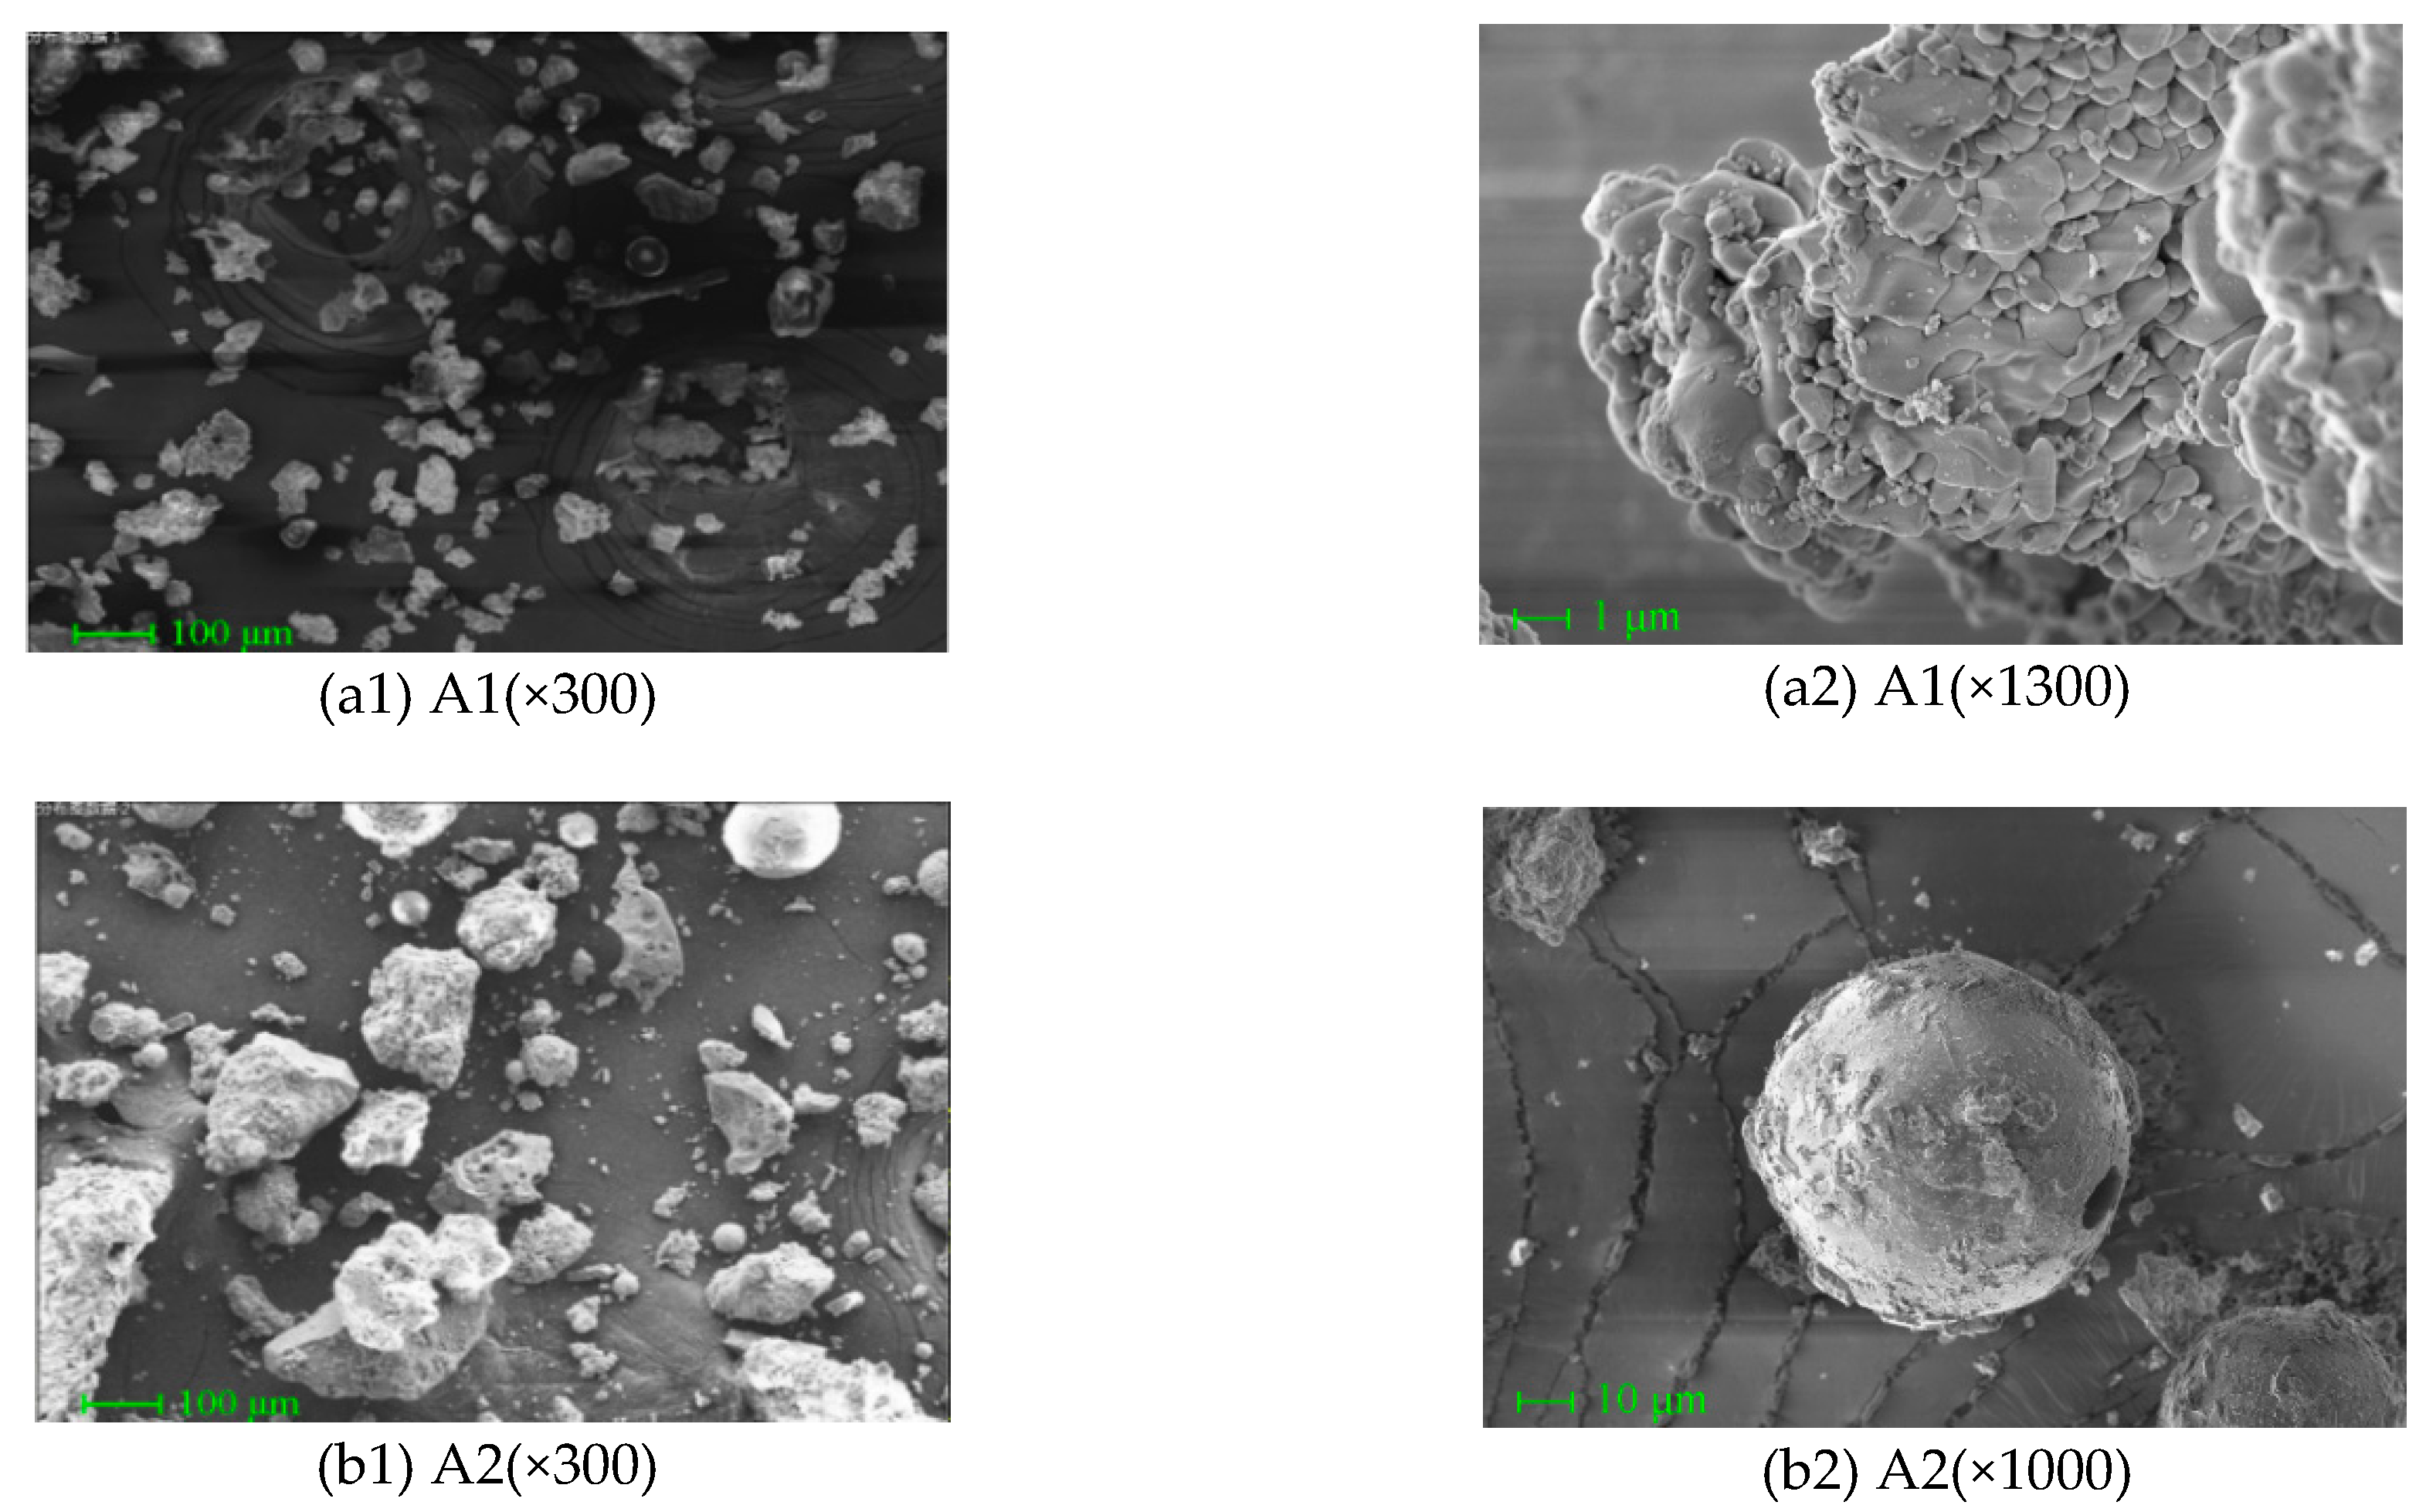
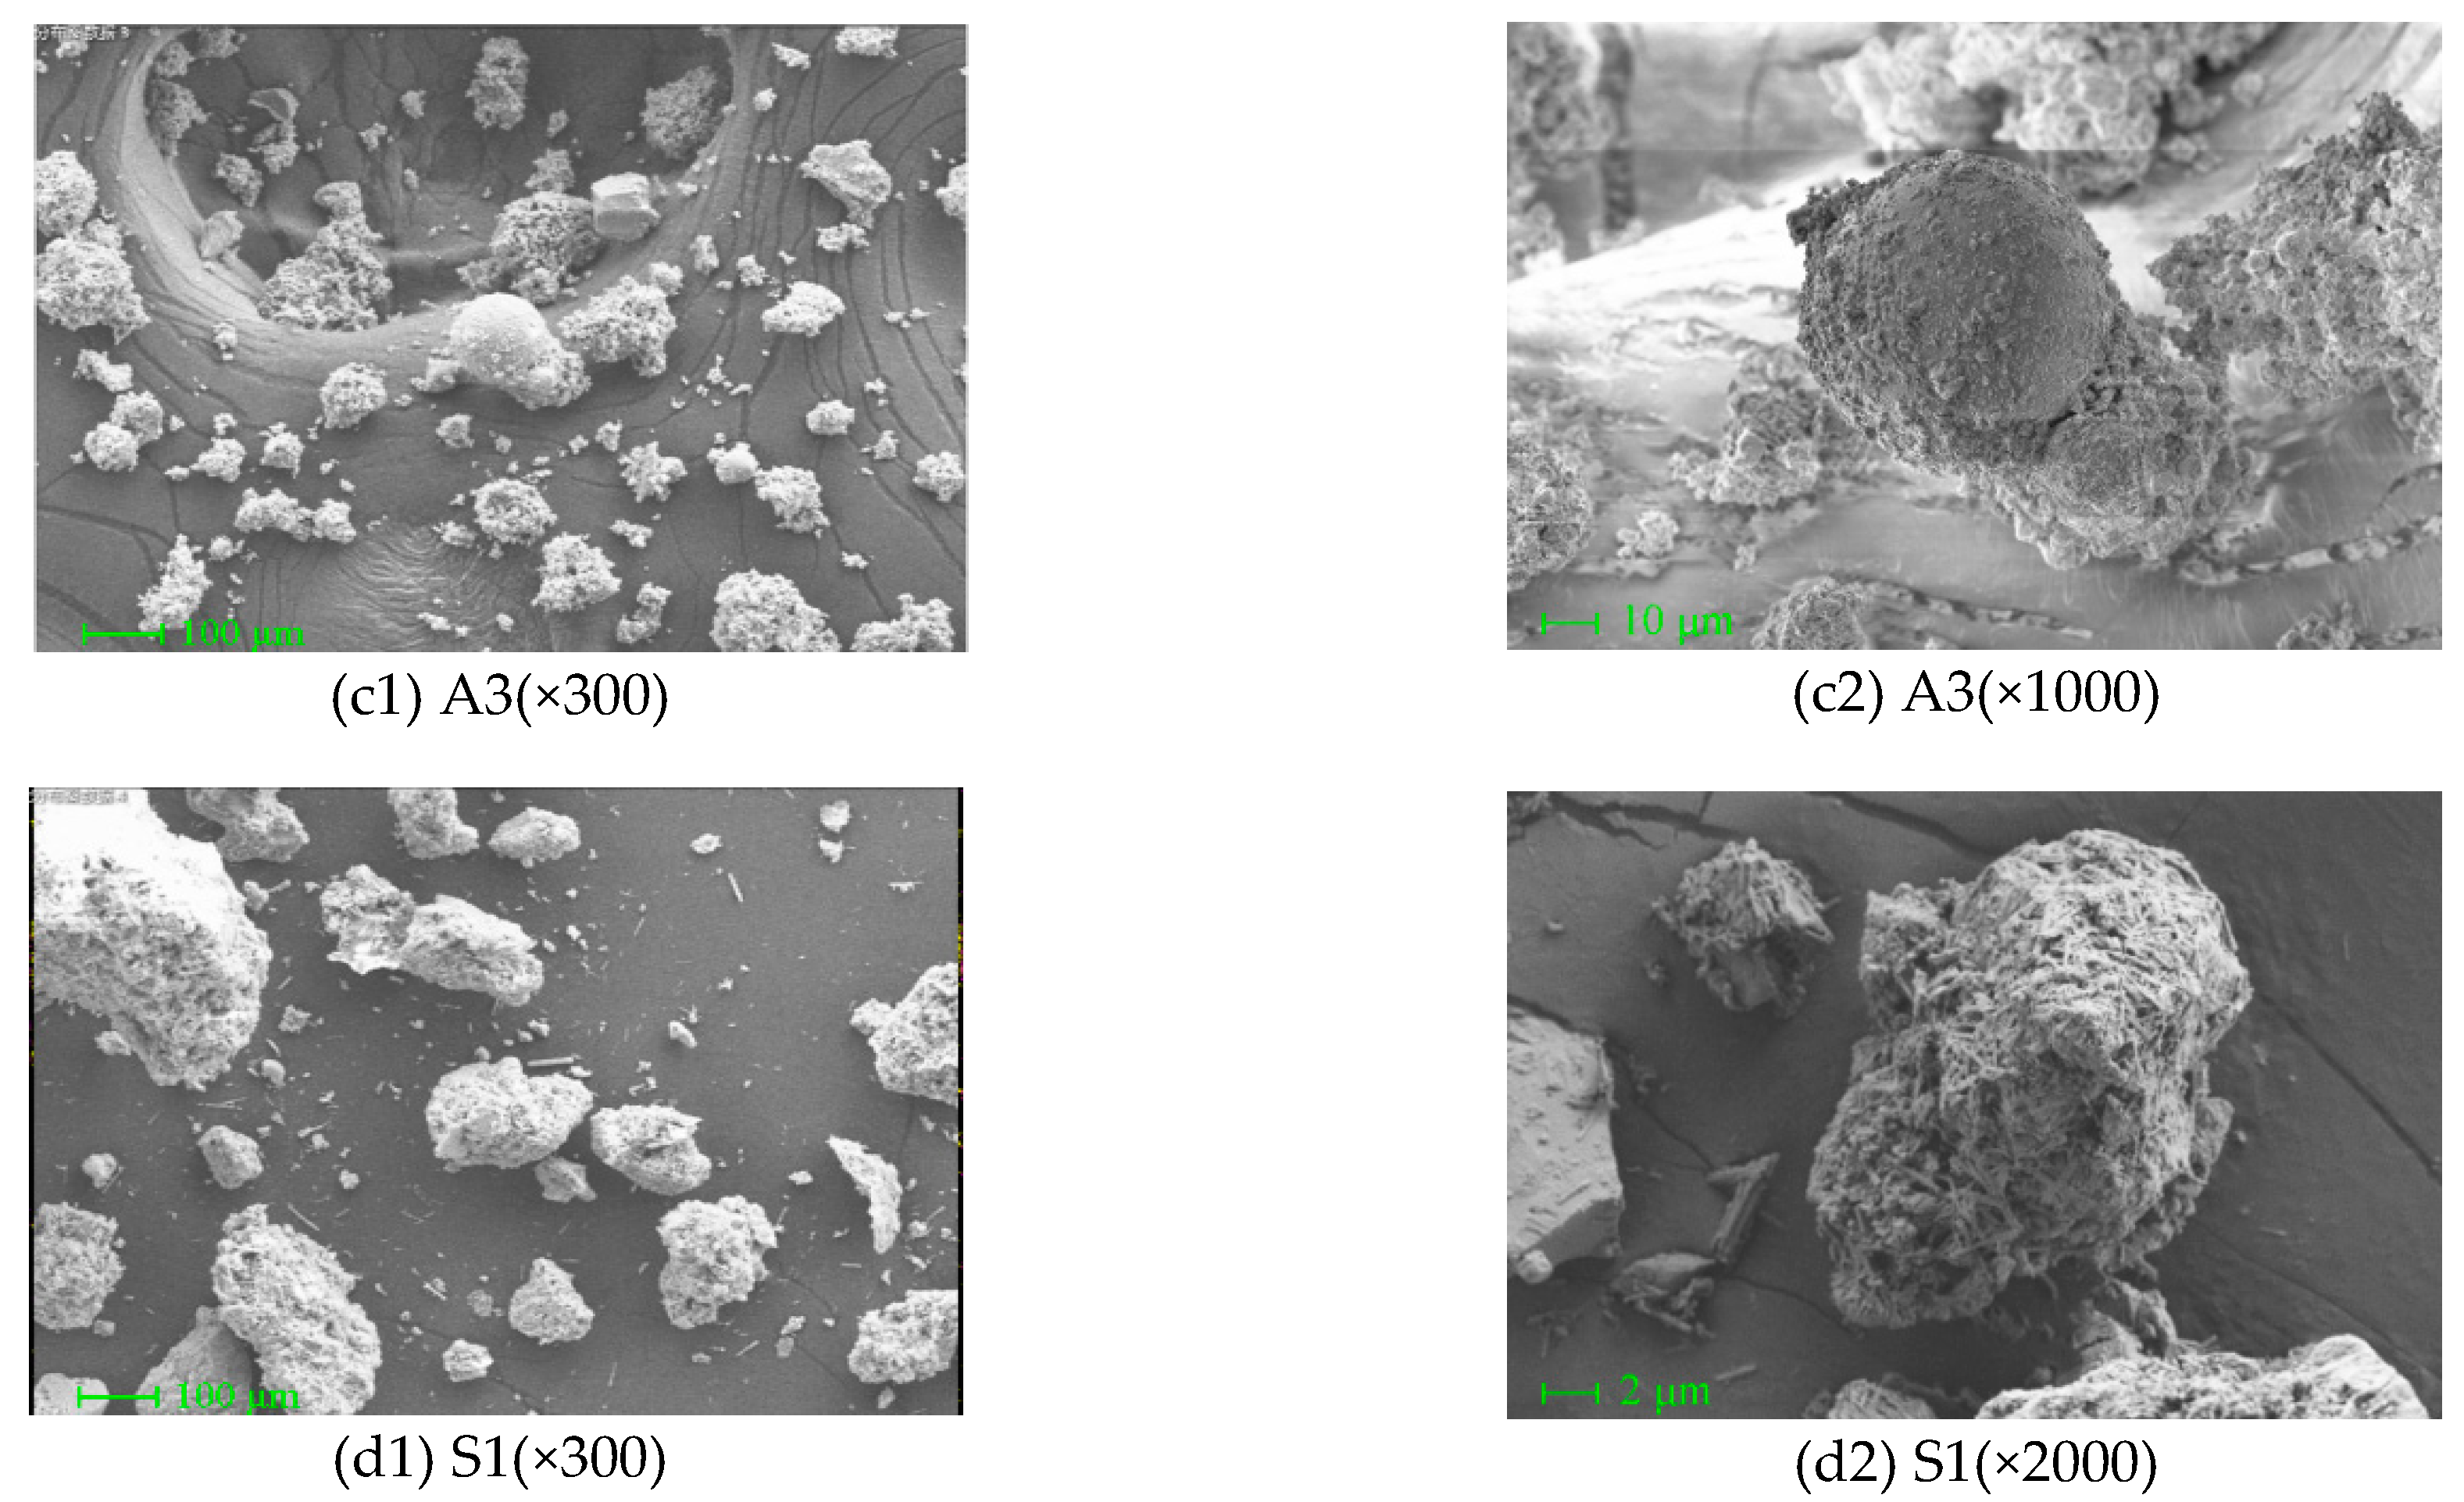
3.4. Incineration Ash and Slag Microscopic Morphology
4. Conclusions
- (1)
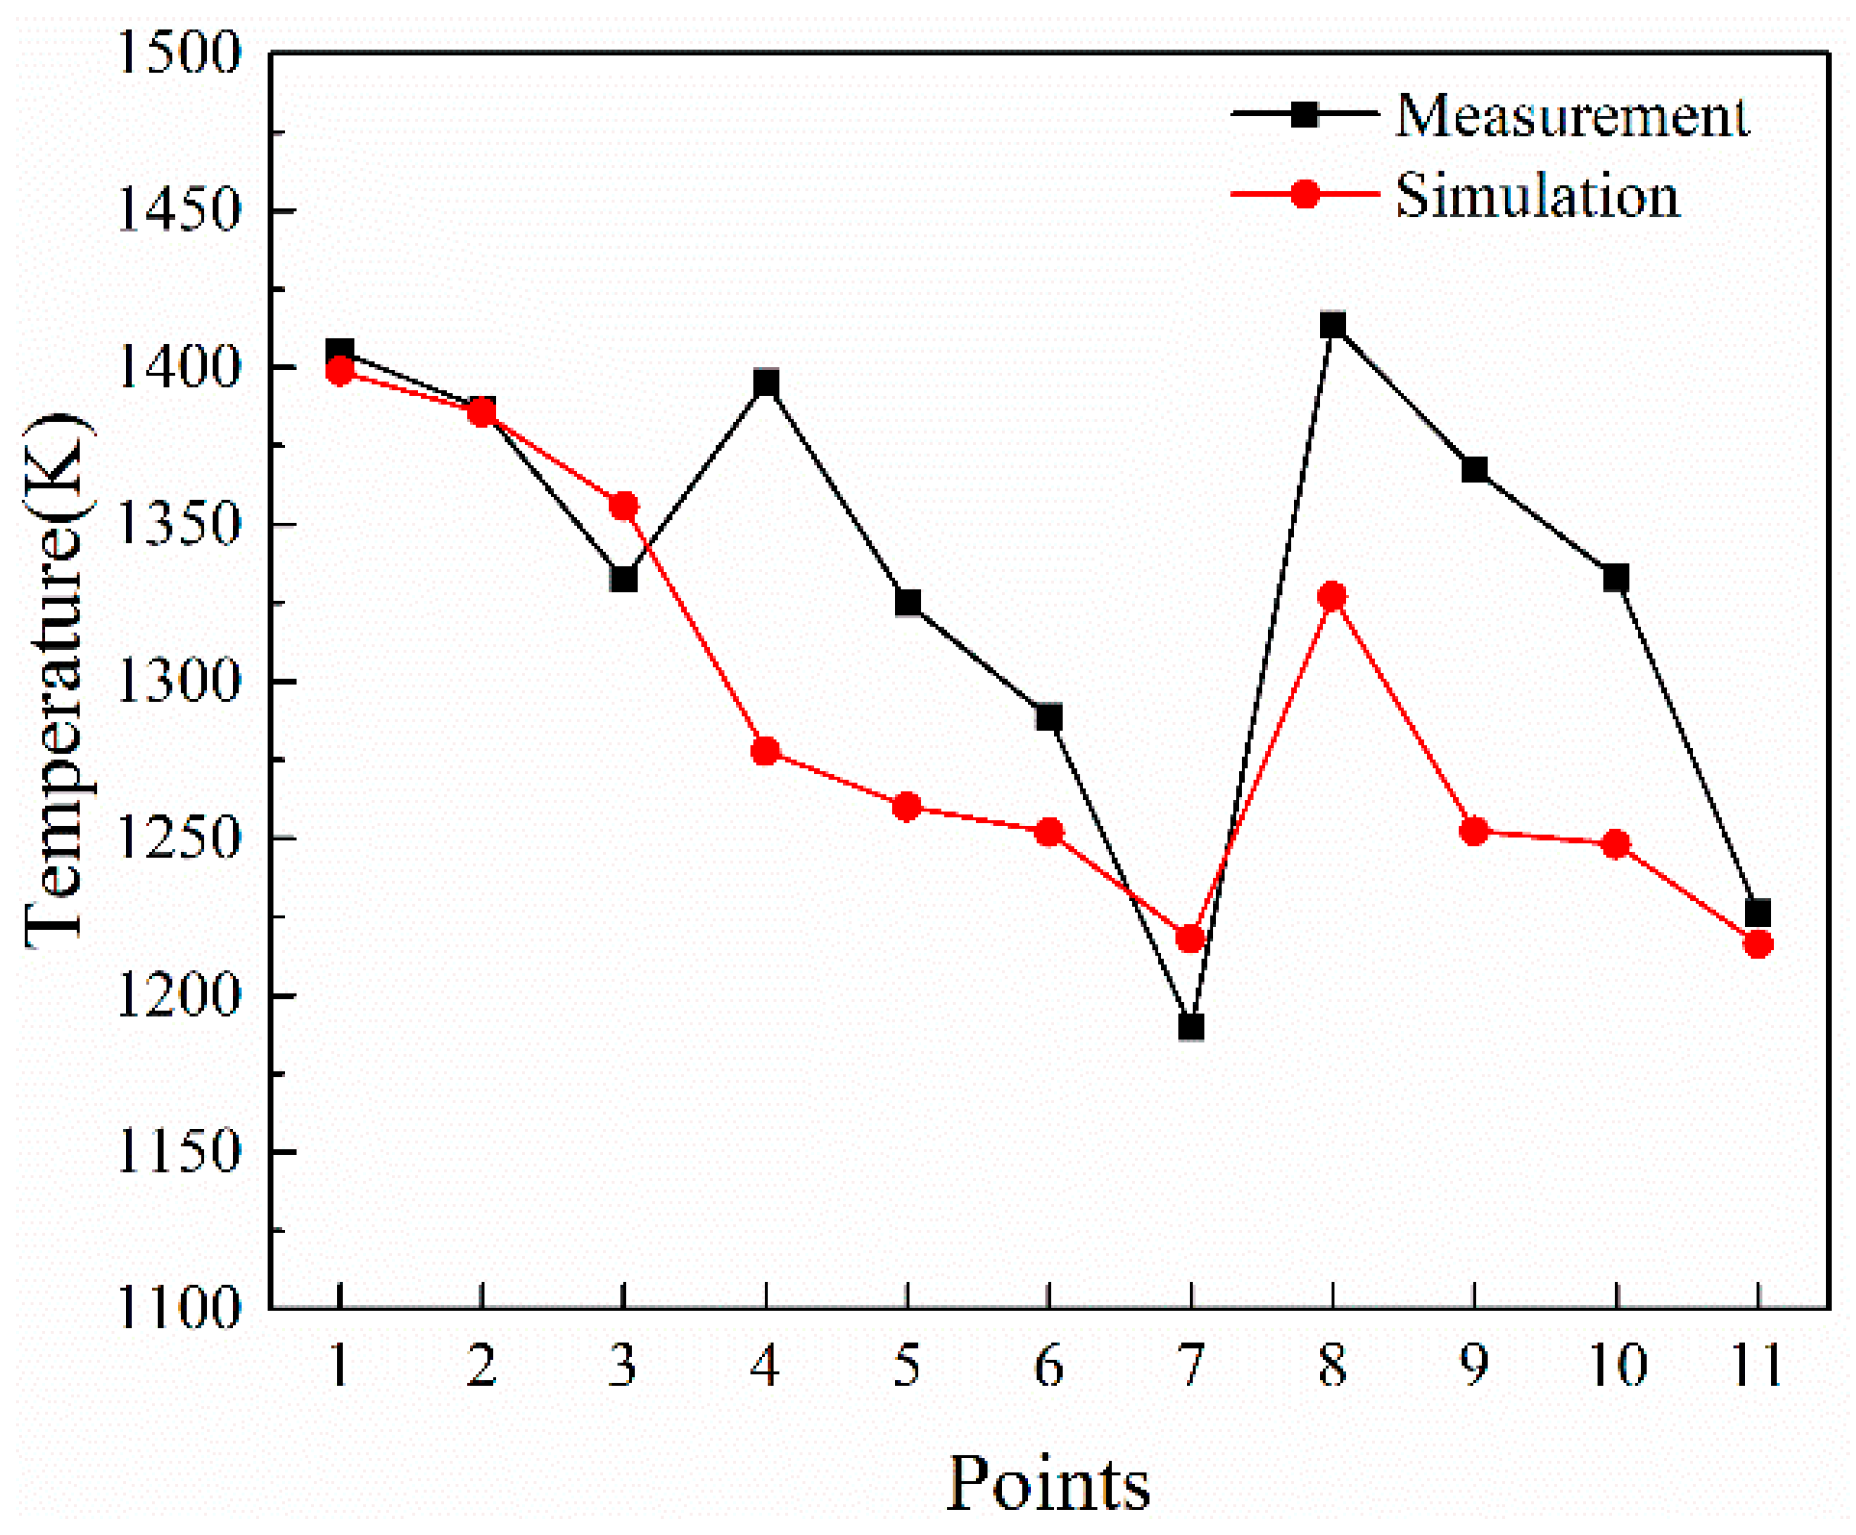
- The simulation method and model proposed in this paper are able to simulate the incineration process of a V-type waste incinerator, and the simulated temperature results are within a 10% error of the actual measured temperature. Therefore, the employed model is reliable and can reasonably simulate the combustion of MSW.
- (2)
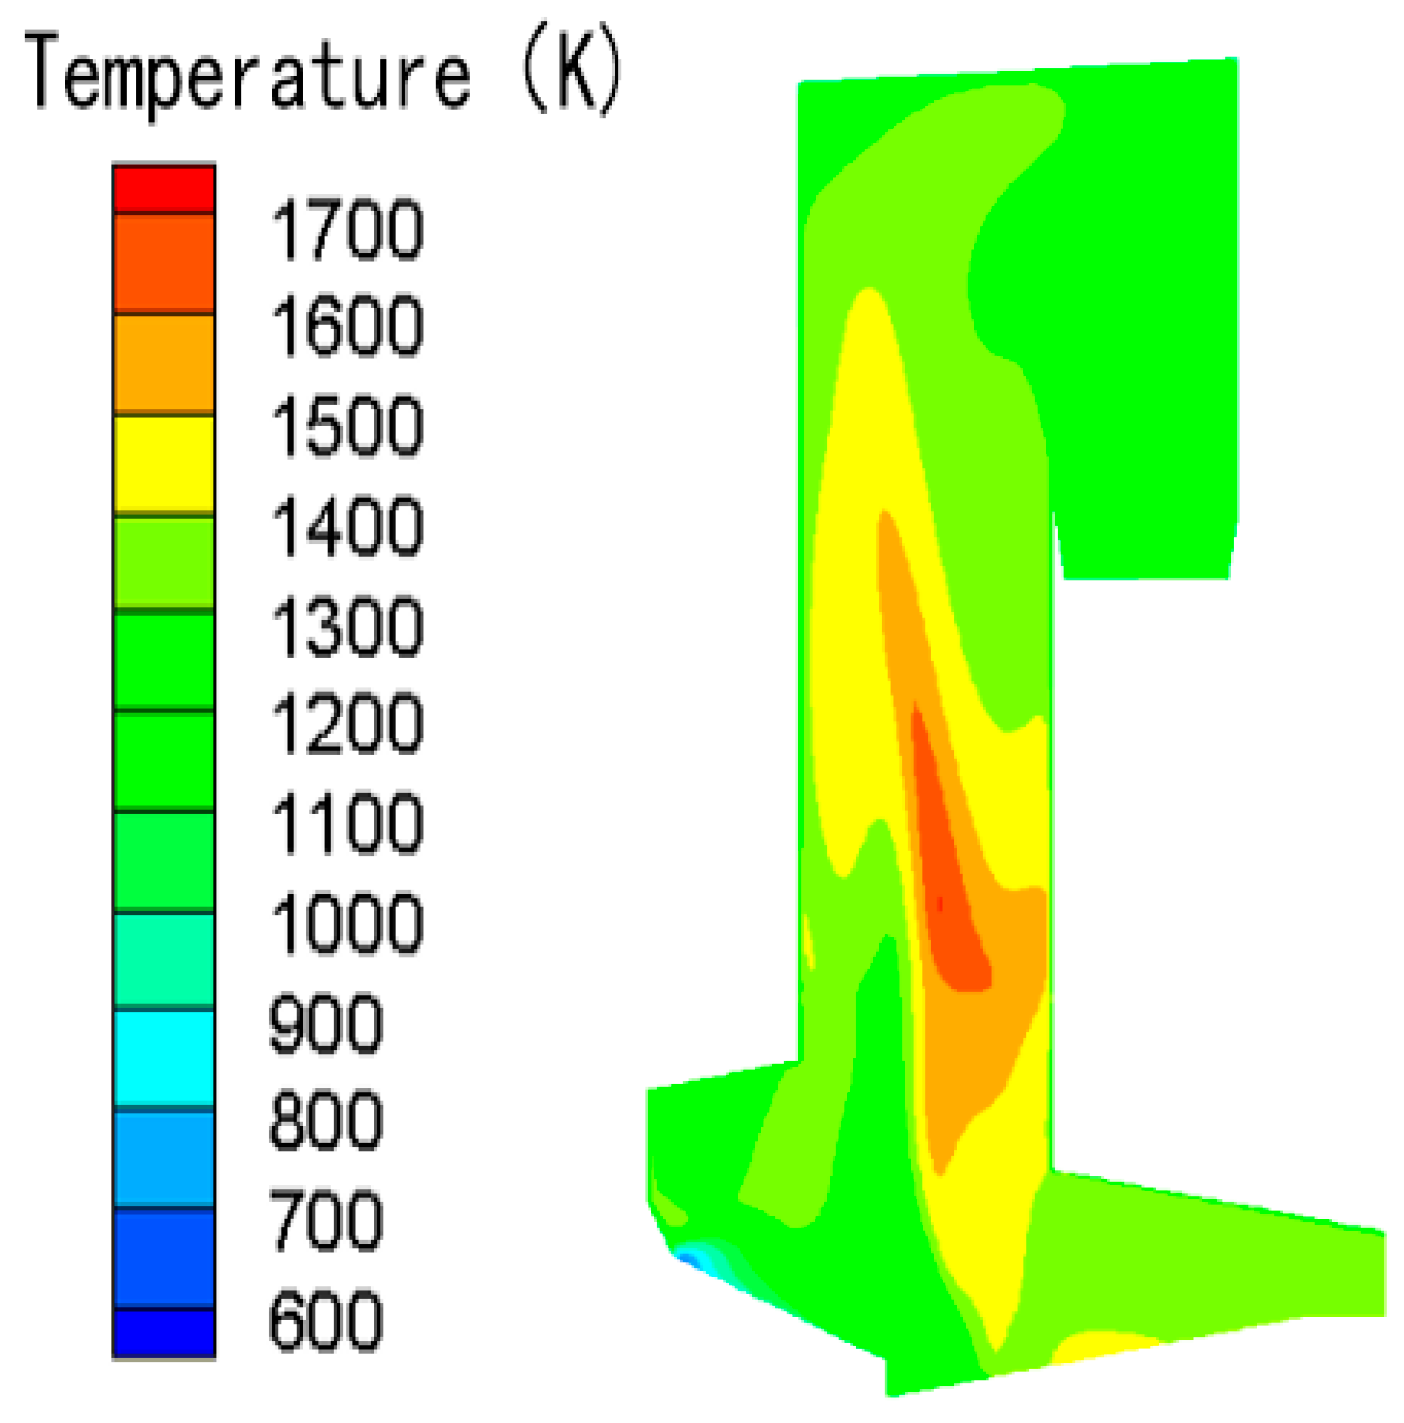
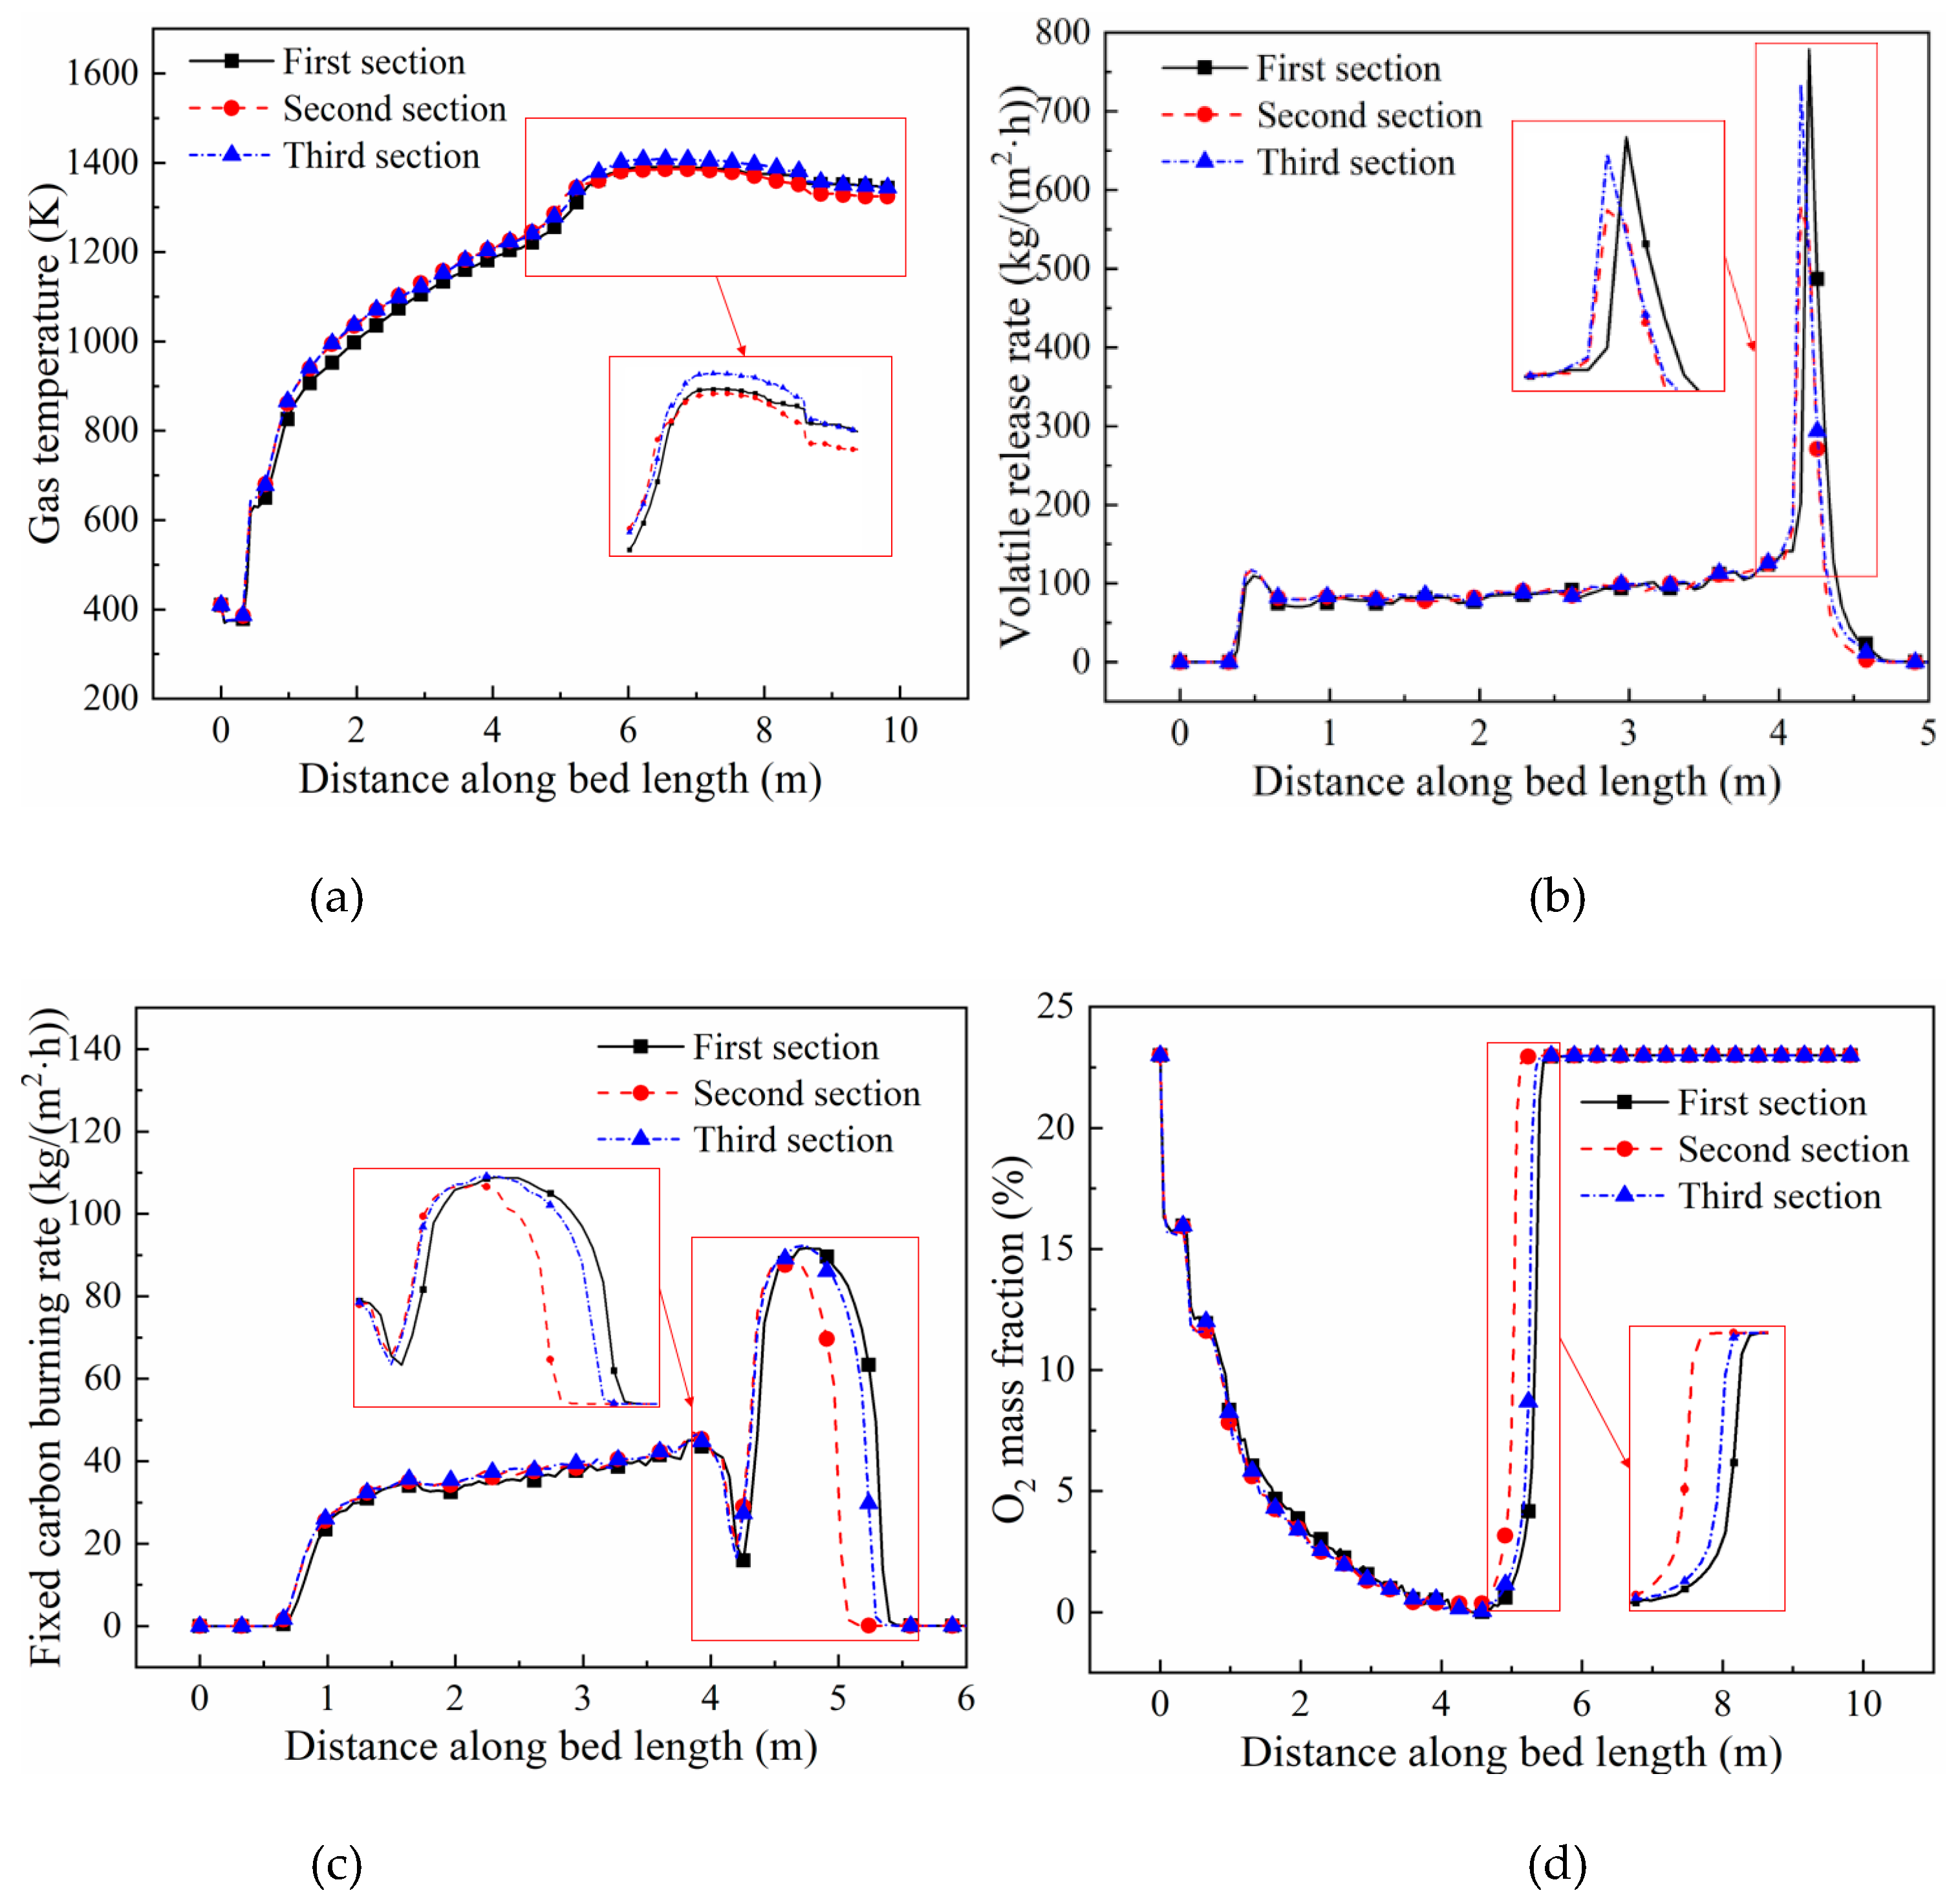
- In the combustion process of MSW, the combustion of volatiles and fixed carbon is mainly concentrated in the middle part of the grate. When secondary air is fed into the furnace chamber, volatiles are burned in the middle of the chamber, forming a high temperature zone with a maximum temperature of about 1650 K.
- (3)
- The particle size of fly ash along the incineration process is less than 1000 μm, and the main particle size range of fly ash captured by the bag filter is between 17.8–89.3 μm, which has a high capture efficiency. The waste incineration fly ash mainly contains irregularly shaped agglomerated particles, as well as spherical or ellipsoidal particles. The surface of the particles is uneven, and small flat, flocculent particles are adhered to the surface.
- (4)
- There are some differences in the main components of incineration ash and slag along the combustion process. The main oxide components in cyclone separator, horizontal flue fly ash and slag are CaO and SiO2, secondary components are MgO, Al2O3, Fe2O3, etc. The main constituent elements are O, Ca, Si, Cl, Mg, Al, etc. The bag dust fly ash is mainly CaO, the secondary components are Na2O and K2O, and the main constituent elements are Ca and Cl. Heavy metal elements such as Pb, Cu, Zn, Cr, etc., are present in waste incineration ash and slag.
Author Contributions
Funding
Data Availability Statement
Conflicts of Interest
Nomenclature
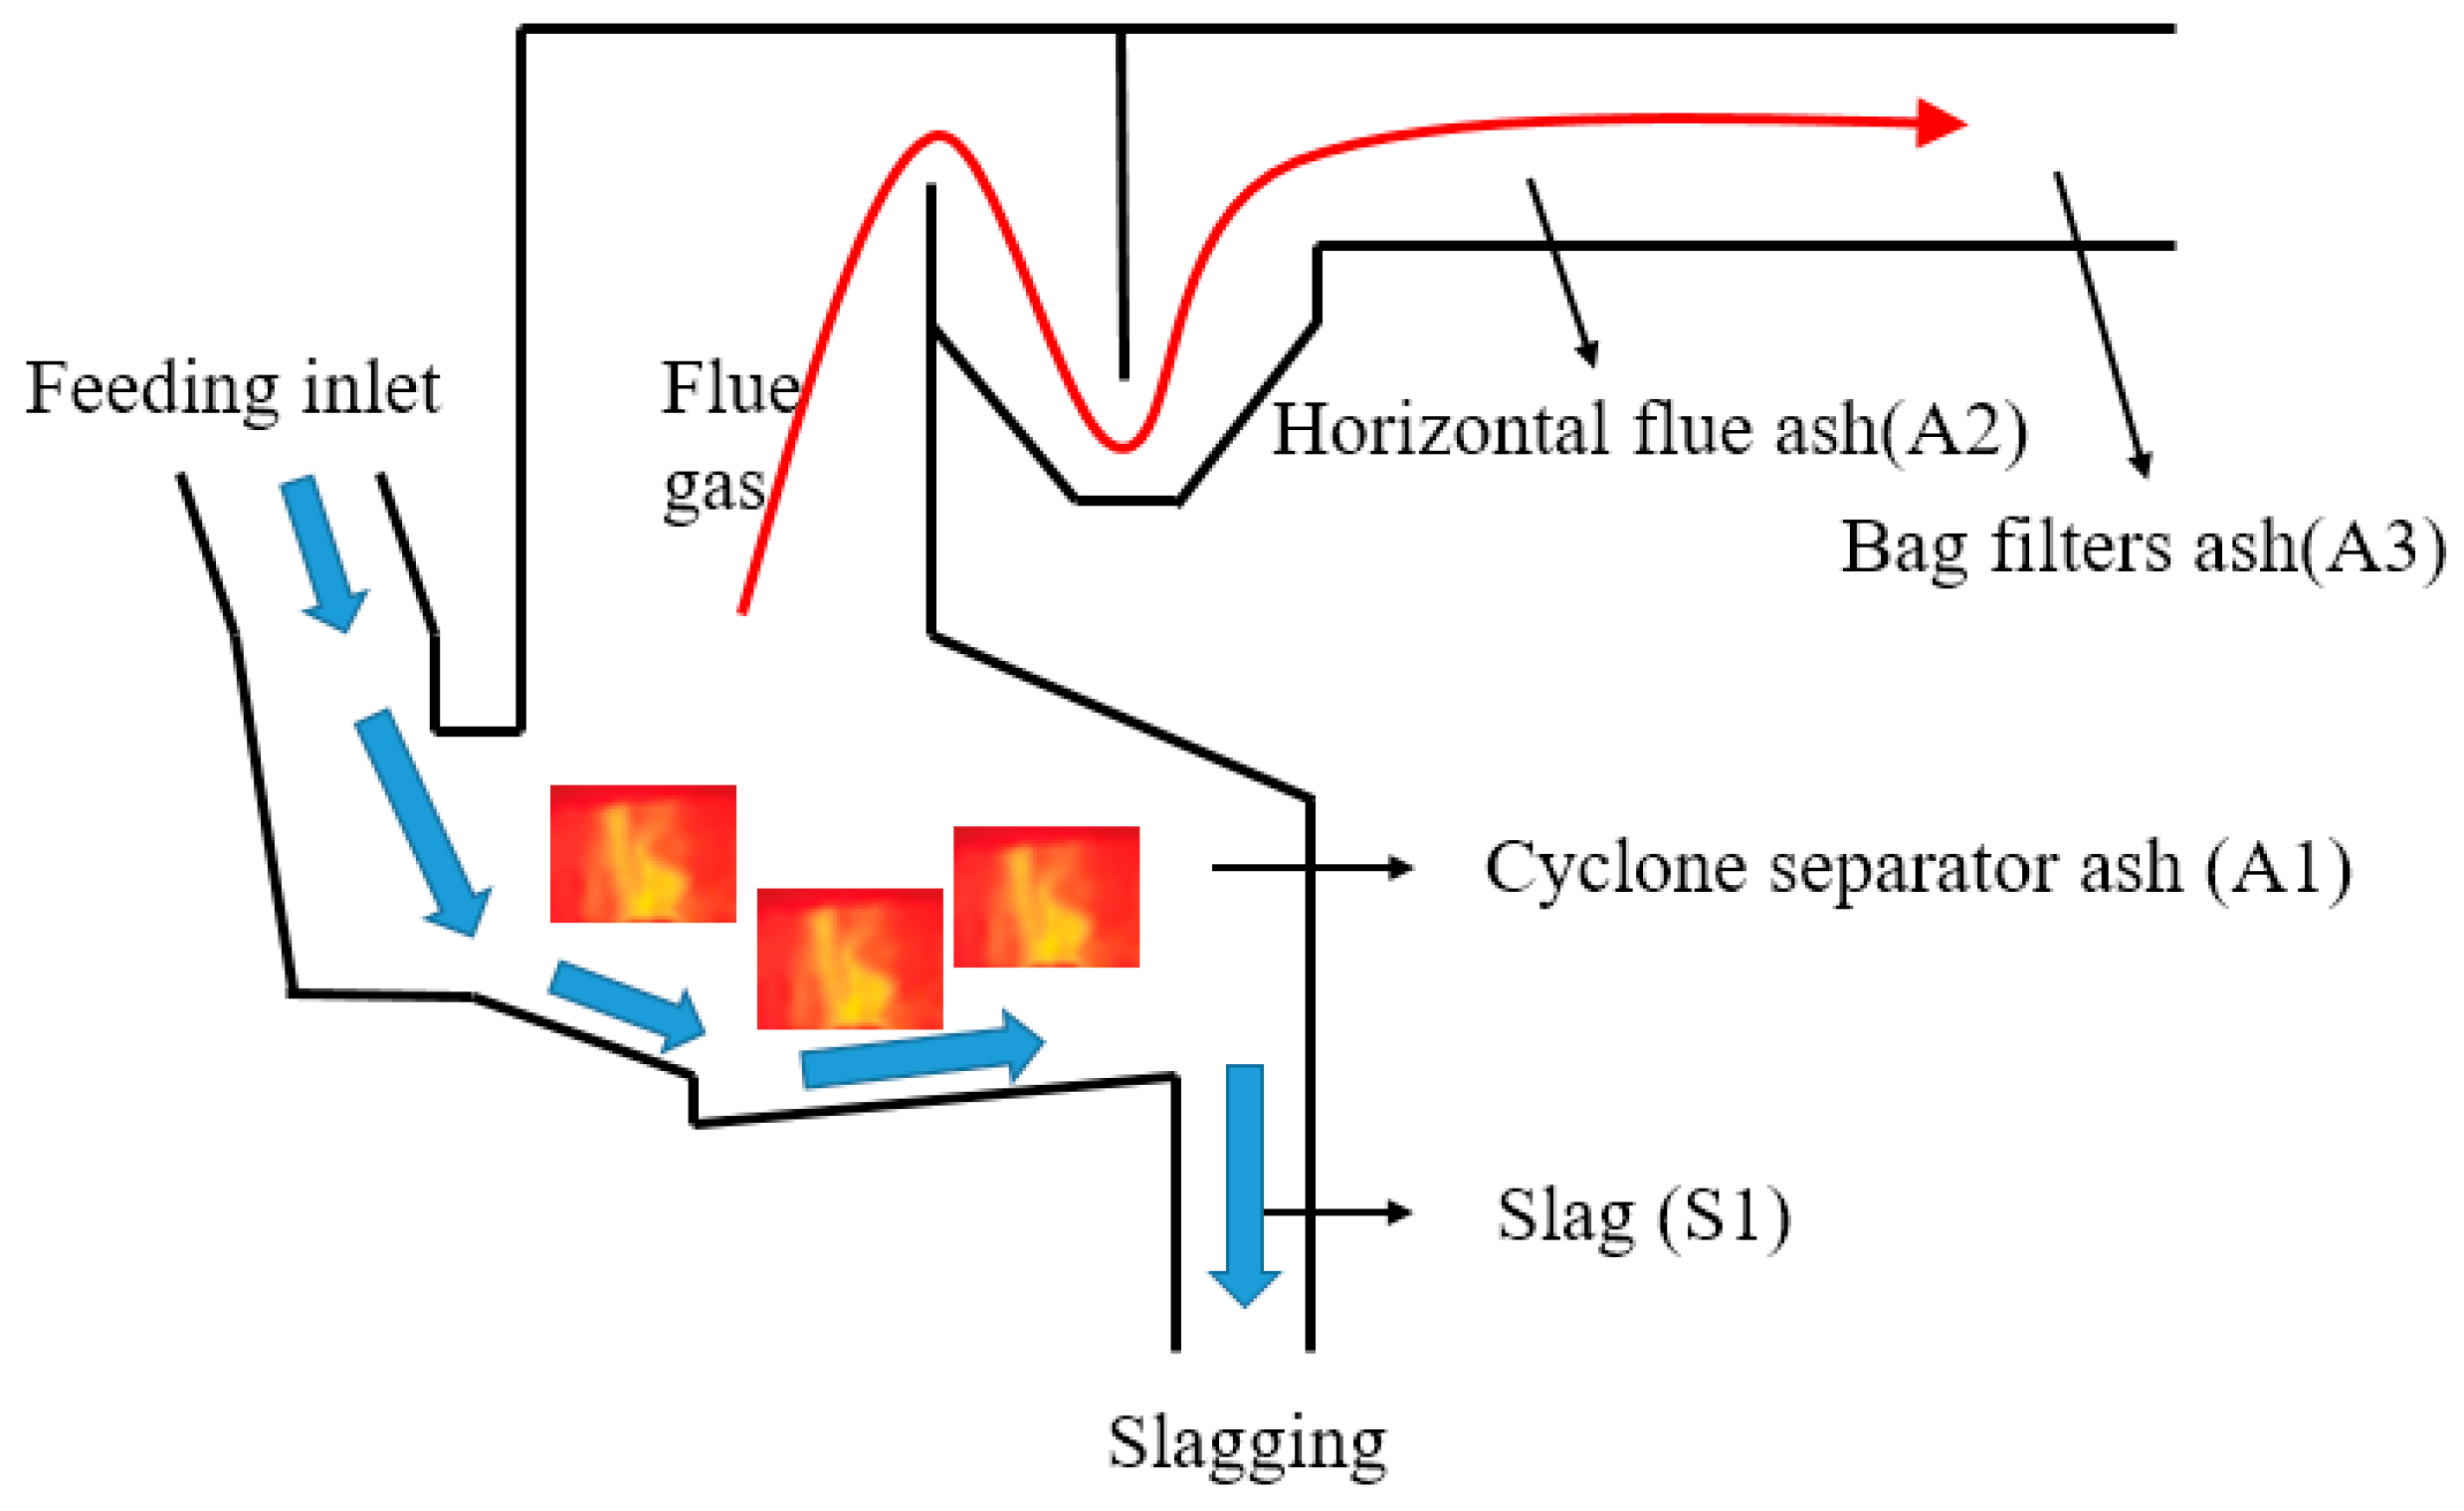
| A1 | cyclone separator ash |
| A2 | horizontal flue ash |
| A3 | bag filters ash |
| S1 | slag |
References
- Wiśniewska, M.; Kulig, A.; Lelicińska-Serafin, K. Odour Nuisance at Municipal Waste Biogas Plants and the Effect of Feedstock Modification on the Circular Economy—A Review. Energies 2021, 14, 6470. [Google Scholar] [CrossRef]
- Jing, Z.; Fan, X.; Zhou, L.; Fan, J.; Zhang, Y.; Pan, X.; Ishida, E.H. Hydrothermal solidification behavior of municipal solid waste incineration bottom ash without any additives. Waste Manag. 2013, 33, 1182–1189. [Google Scholar] [CrossRef]
- Shareefdeen, Z.; Elkamel, A.; Tse, S. Review of current technologies used in municipal solid waste-to-energy facilities in Canada. Clean Technol. Environ. Policy 2015, 17, 1837–1846. [Google Scholar] [CrossRef]
- Zhao, X.G.; Jiang, G.W.; Li, A.; Li, Y. Technology, cost, a performance of waste-to-energy incineration industry in China. Renew. Sustain. Energy Rev. 2016, 55, 115–130. [Google Scholar]
- Kanhar, A.H.; Chen, S.; Wang, F. Incineration Fly Ash and Its Treatment to Possible Utilization: A Review. Energies 2020, 13, 6681. [Google Scholar] [CrossRef]
- Chen, X.; Geng, Y.; Fujita, T.J.W.M. An overview of municipal solid waste management in China. Waste Manag. 2010, 30, 716–724. [Google Scholar] [CrossRef]
- Bermúdez, C.A.; Porteiro, J.; Varela, L.G.; Chapela, S.; Patiño, D.J.F.P.T. Three-dimensional CFD simulation of a large-scale grate-fired biomass furnace. Fuel Process. Technol. 2020, 198, 106219. [Google Scholar] [CrossRef]
- Karim, M.R.; Bhuiyan, A.A.; Naser, J.J.R.E. CFD simulation of biomass thermal conversion under air/oxy-fuel conditions in a reciprocating grate boiler. Renew. Energy 2020, 146, 1416–1428. [Google Scholar] [CrossRef]
- Yang, Y.B.; Swithenbank, J.J.W.M. Mathematical modelling of particle mixing effect on the combustion of municipal solid wastes in a packed-bed furnace. Waste Manag. 2008, 28, 1290–1300. [Google Scholar] [CrossRef]
- Yan, M.; Wang, J.; Hantoko, D.; Kanchanatip, E.J.F. Numerical investigation of MSW combustion influenced by air preheating in a full-scale moving grate incinerator. Fuel 2021, 285, 119193. [Google Scholar] [CrossRef]
- Xu, J.; Liao, Y.; Yu, Z.; Cai, Z.; Ma, X.; Dai, M.; Fang, S.J.F. Co-combustion of paper sludge in a 750 t/d waste incinerator and effect of sludge moisture content: A simulation study. Fuel 2018, 217, 617–625. [Google Scholar] [CrossRef]
- Becidan, M.; Ditaranto, M.; Carlsson, P.; Bakken, J.; Olsen, M.N.P.; Stuen, J. Oxyfuel Combustion of a Model MSW—An Experimental Study. Energies 2021, 14, 5297. [Google Scholar] [CrossRef]
- Shishkin, A.A.; Shishkin, A.A.; Dushkina, N.N. Research of the removal of fly ash particles from industrial boiler flue gases. Int. J. Energy Clean Environ. 2019, 20, 273–289. [Google Scholar] [CrossRef]
- Huang, T.; Liu, L.; Zhou, L.; Yang, K.J.C. Operating optimization for the heavy metal removal from the municipal solid waste incineration fly ashes in the three-dimensional electrokinetics. Chemosphere 2018, 204, 294–302. [Google Scholar] [CrossRef] [PubMed]
- Lin, H.; Ma, X.J.W.M. Simulation of co-incineration of sewage sludge with municipal solid waste in a grate furnace incinerator. Waste Manag. 2012, 32, 561–567. [Google Scholar] [CrossRef]
- Yang, Y.B.; Newman, R.; Sharifi, V.; Swithenbank, J.; Ariss, J.J.F. Mathematical modelling of straw combustion in a 38 MWe power plant furnace and effect of operating conditions. Fuel 2007, 86, 129–142. [Google Scholar] [CrossRef]
- Liang, Z.; Ma, X.J.W.M. Mathematical modeling of MSW combustion and SNCR in a full-scale municipal incinerator and effects of grate speed and oxygen-enriched atmospheres on operating conditions. Waste Manag. 2010, 30, 2520–2529. [Google Scholar] [CrossRef]
- Hu, Z.; Jiang, E.; Ma, X.Q. Numerical simulation on NOX emissions in a municipal solid waste incinerator. J. Clean. Prod. 2019, 233, 650–664. [Google Scholar] [CrossRef]
- Goh, Y.; Lim, C.; Zakaria, R.; Chan, K.; Reynolds, G.; Yang, Y.; Siddall, R.; Nasserzadeh, V.; Swithenbank, J.J.P.S.; Protection, E. Mixing, modelling and measurements of incinerator bed combustion. Process. Saf. Environ. Prot. 2000, 78, 21–32. [Google Scholar] [CrossRef]
- Yang, Y.; Ryu, C.; Goodfellow, J.; Sharifi, V.N.; Swithenbank, J. Modelling waste combustion in grate furnaces. Process Saf. Environ. Prot. 2004, 82, 208–222. [Google Scholar] [CrossRef]
- Zhou, L.; Bai, L.; Zhang, L.; Shi, W.; Agarwal, R.K. Validation and Comparison of Discrete Element Model and Two-Fluid Model for Dense Gas-Solid Flow Simulation in a Fluidized Bed. Int. J. Energy Clean Environ. 2019, 20, 135–151. [Google Scholar] [CrossRef]
- Cellek, M.S. Evaluation of oxygen enrichment effects on distribution combustion mode in a laboratory-scale furnace. Int. J. Energy Clean Environ. 2022, 23, 19–37. [Google Scholar] [CrossRef]
- Sigal, A.; Safiants, A.S.; Magera, Y.M. Diagnostic system for predicting the composition of municipal solid waste burnt in the recovery boiler. Int. J. Energy Clean Environ. 2017, 18, 175–187. [Google Scholar]
- Kolibaba, O.B.; Sokolskiy, A.I.; Gabitov, R.N. Research of the pyrolysis of municipal solid waste aimed at improving the efficiency of thermal reactors. Int. J. Energy Clean Environ. 2017, 18, 147–160. [Google Scholar] [CrossRef]
- Masashi, K.; Takeshi, K.; Youichi, S. MSW fly ash stabilized with coal ash for geotechnical application. J. Hazard. Mater. 2000, 76, 265–283. [Google Scholar]


| Moisture | Volatiles | Fixed Carbon | Ash | C | H | O | N | S | Cl | LHVnet, ar (kJ/kg) |
|---|---|---|---|---|---|---|---|---|---|---|
| 55.48 | 24.91 | 11.25 | 8.36 | 21.79 | 2.47 | 10.53 | 0.87 | 0.17 | 0.33 | 7200 |
| Composition | A1 | A2 | A3 | S1 | Composition | A1 | A2 | A3 | S1 |
|---|---|---|---|---|---|---|---|---|---|
| CaO | 36.71 | 34.81 | 60.75 | 28.28 | 1.77 | 2.70 | 6.35 | 2.05 | |
| 27.33 | 20.52 | 4.89 | 36.67 | P2O5 | 3.11 | 2.66 | 0.62 | 4.36 | |
| MgO | 8.10 | 5.66 | 1.43 | 4.74 | TiO2 | 1.61 | 1.84 | 0.35 | 1.36 |
| 8.10 | 6.42 | 1.17 | 8.60 | ZnO | 0.46 | 0.80 | 0.97 | 0.32 | |
| Cl | 4.690 | 6.956 | 23.347 | 2.828 | BaO | 0.22 | 0.22 | 0.07 | - |
| 4.23 | 4.87 | 0.88 | 4.57 | MnO | 0.14 | 0.15 | 0.03 | 0.14 | |
| 5.35 | 14.10 | 10.80 | 5.09 | CuO | 0.09 | 0.07 | 0.12 | 0.07 | |
| 2.53 | 4.84 | 11.12 | 3.37 | PbO | 0.04 | 0.06 | 0.28 | 0.02 |
Publisher’s Note: MDPI stays neutral with regard to jurisdictional claims in published maps and institutional affiliations. |
© 2021 by the authors. Licensee MDPI, Basel, Switzerland. This article is an open access article distributed under the terms and conditions of the Creative Commons Attribution (CC BY) license (https://creativecommons.org/licenses/by/4.0/).
Share and Cite
Luo, Z.; Chen, W.; Wang, Y.; Cheng, Q.; Yuan, X.; Li, Z.; Yang, J. Numerical Simulation of Combustion and Characteristics of Fly Ash and Slag in a “V-type” Waste Incinerator. Energies 2021, 14, 7518. https://doi.org/10.3390/en14227518
Luo Z, Chen W, Wang Y, Cheng Q, Yuan X, Li Z, Yang J. Numerical Simulation of Combustion and Characteristics of Fly Ash and Slag in a “V-type” Waste Incinerator. Energies. 2021; 14(22):7518. https://doi.org/10.3390/en14227518
Chicago/Turabian StyleLuo, Zixue, Wei Chen, Yue Wang, Qiang Cheng, Xiaohua Yuan, Zhigang Li, and Junjie Yang. 2021. "Numerical Simulation of Combustion and Characteristics of Fly Ash and Slag in a “V-type” Waste Incinerator" Energies 14, no. 22: 7518. https://doi.org/10.3390/en14227518