Article

Impact of Blow-By Gas and Endgap Ring Position on the Variations of Particle Emissions in Gasoline Engines

Ecole Centrale de Nantes, LHEEA Lab. (ECN/CNRS), 44321 Nantes, France
*
Author to whom correspondence should be addressed.
Energies 2021, 14(22), 7492; https://doi.org/10.3390/en14227492
Submission received: 16 September 2021 / Revised: 29 October 2021 / Accepted: 2 November 2021 / Published: 9 November 2021
(This article belongs to the Special Issue Sustainable Internal Combustion Engines)

Abstract

:
Particulate emission from internal combustion engines is a complex phenomenon that needs to be understood in order to identify its main factors. To this end, it appears necessary to study the impact of unburned gases, called blow-by gases, which are reinjected into the engine intake system. A series of transient tests demonstrate their significant contribution since the particle emissions of spark-ignition engines are 1.5 times higher than those of an engine without blow-by with a standard deviation 1.5 times greater. After analysis, it is found that the decanter is not effective enough to remove completely the oil from the gases. Tests without blow-by gases also have the advantage of having a lower disparity, and therefore of being more repeatable. It appears that the position of the “endgap” formed by the first two rings has a significant impact on the amount of oil transported towards the combustion chamber by the backflow, and consequently on the variation of particle emissions. For this engine and for this transient, 57% of the particulate emissions are related to the equivalence ratio, while 31% are directly related to the ability of the decanter to remove the oil of the blowby gases and 12% of the emissions come from the backflow. The novelty of this work is to relate the particles fluctuation to the position of the endgap ring.

Graphical Abstract

1. Introduction

The reduction of pollutant emissions, and particularly the soot particles emitted by internal combustion engines, is essential for human health. Indeed, the breathed air is filtered by the nose, which retains only particles whose size is greater than 10 microns. Then, smaller particles can circulate to the bronchi, generating a feeling of irritation and creating an excess of mucus. These are favorable grounds for the proliferation of viruses and bacteria. The soot particles come from the combustion or pyrolysis at high temperatures of unburned fuel. This unburned fuel has several origins [1]:
-
Incomplete combustion. This occurs when the mixture is not under stoichiometric conditions but is rich in fuel. The combustion process stops when there is not enough air to oxidize it. Therefore, there are unburned gases after combustion. Similarly, the extinction of the combustion flame against the cylinder walls, or before reaching the walls, generates unburned gases.
-
The oil film on the cylinder wall. It absorbs unburned fuel, which can be released after combustion.
-
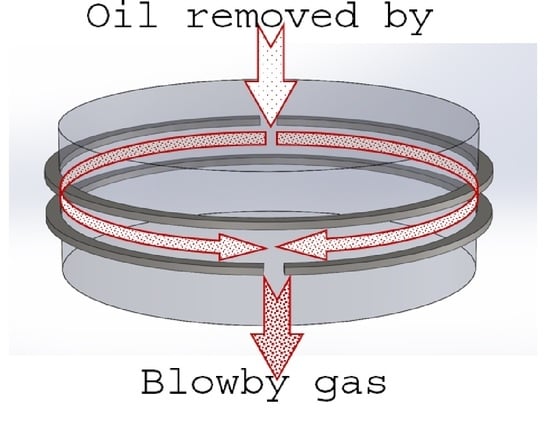
The “crevices”. These are the areas close to the valve seats, the cylinder head gasket, the spark plug, and the piston rings, which are not in direct contact with the combustion flame and remain unburned. Cheng et al. [1] have also specified that, in a steady state, 0.6% of the total fuel injected would pass through the piston rings and the cylinder wall to end up in the oil pan. These are commonly called blow-by gases. If all of the blow-by gases are recycled, that is to say the oil is removed and the gases are reinjected at the intake for a new cycle, there would be only 1.8% of unburned fuel that would be emitted in the atmosphere in the form of soot particles [1].
On current engines, generally, a piston consists of two compression rings and an oil scraper ring. The first two rings prevent the flow of combustion gases between the piston and the wall cylinder towards the oil pan. The third ring distributes the oil on the cylinder wall and scrapes off the excess [2]. The space left between the piston and the cylinder (lands 1,2,3 and 4 in Figure 1) highlights the importance of the rings [3]. During the compression and combustion phases, the pressure prevailing inside the cylinder presses the first two rings against the respective lower parts of the piston grooves. Then, fresh gas stays in these areas (lands 1 and 2).
During the exhaust gas expulsion phase, the cylinder pressure decreases, becoming lower than the pressure in land 2. Then, the first ring moves towards the upper part of the piston groove and carries part of the unburned gases in land 2. Next, these gases go to the scraper ring either via the cutting clearance of the second ring or via the piston groove since the second ring moves again axially during the next phases. Finally, these unburned gases are transferred through the scraper ring towards the oil pan. This is the classic blow-by path during a normal operation.
Takiguchi et al. [4] showed that the oil film thickness in the top land is two times more important than the second land in the expansion stroke. Namazian and Heywood [5] determined that a fraction of unburnt crevice gas is related to the ring gap location and Herbts and Priebsch [6] demonstrated that the pressure in the lands is affected by the ring size of the top and second rings. Rabuté and Tian [7] measured that the oil consumption and found out that it can be reduced by 90% with optimized design rings. These rings are not static but move axially and radially depending on the position of the piston, the in-cylinder pressure, the oil film thickness, and the engine temperature. Indeed, Schneider et al. [8,9] measured ring speeds of up to 10 rpm on a gasoline engine. This one depends on the low load and high engine speeds [10]. Usui et al. [11] observed that the oil over the top land and second land is significantly affected by the gas flow from the gap. Jung and Jim [12] found a relationship between ring-gap location and oil consumption. However, under special engine conditions, that is to say under heavy load and for high rotational speed, the first two rings can sometimes move radially inwards of the grooves of the piston and allow unburned gases to pass directly in the oil pan via the scraper ring [13]. Tian [14] and Chen [15] showed that this dynamic behavior called radial collapse is very sensitive to the pressure above the ring and to the tilt angle of the ring. When the ring collapses, it generates more blow-by. Tian [16] demonstrated that it can be limited via the shape of the rings. Rabuté and Tian [17] found out that blow-by is sensitive to the choice of ring materials. Wroblewski and Koszalka [18] measured the influence of various anti-wear coatings on frictional losses on the rings. Wroblewski and Iskra [19] demonstrated that the asymmetrical shape of the rings impacts the amount of oil scraped into the combustion chamber during the compression and exhaust stroke. Zarenbin et al. [20] studied the impact of piston ring mobility on the blow-by gas and determined that the movements of the rings in the grooves noticeably affect the gas escape into the crankcase. Turnbull et al. [21] showed that the power losses due to gas leakage can be more important than frictional losses.
Finally, the blow-by gases flow rate can rise up to 1% of the air mass flow rate of the engine. Before being reinjected into the intake, the oil of the blow-by gases must be removed in order to avoid the creation of particles and the degradation of the combustion. As the gases come into the oil pan, they are charged with drops of oil and various components contained in the oil that are spread as vapor. The blow-by gases consist of a gas phase containing, mainly NOx, CO2, O2, N2, and a liquid phase containing hydrocarbons (20% by mass) and water (80% by mass). These hydrocarbons are mainly composed 90% of gasoline and 10% of oil [22].
Particle fluctuation at steady-state regimes was observed by Thawko et al. [23] on a gasoline engine and by Swanson et al. [24] on a diesel engine. Ricardo et al. [25] found that the predicted soot particles mass was lower than experimental values and they suggested that other sources than fuel combustion should be considered. Berthome et al. [26] showed that the particle emissions of a gasoline engine are highly variable for identical test conditions. It is concluded that the particle emissions depend not only on the engine parameters but also on several phenomena such as oil consumption. The authors define a new characterization function for particle emissions of GDI:
N T o t a l   = N ¯   + δ N
with
N ¯ = a 0   + a 1 v ˜ + a 2 d v ˜ d t   + a 3 T q ˜ + a 4 d T q ˜ d t
and
δ N = δ   +   δ oc
where a i   i = 0 4 are coefficients, v ˜ and d v ˜ d t are the speed and acceleration, respectively, of the engine. T q ˜ and d T q ˜ d t are the speed and acceleration, respectively, of engine torque. δ N is a function that depends on equivalent ratio variations and wall fuel film impingement ( δ ) and oil consumption variations ( δ OC).
The objective of this article is to determine the weight and the variability of the particulate emissions generated by the functions δ and δ OC for an internal combustion engine. For that purpose, transient tests are realized with and without blow-by gases.

2. Materials and Methods

2.1. Description of Engine Bench

The tests are carried out on a three-cylinder spark-ignition engine. It is a turbocharged direct-injection engine. Its characteristics are specified in Table 1. It is braked by a dynamic HORIBA HT 250 bench managed by a SPARC control unit. The engine is instrumented with type K temperature sensors, 0–3 bar static pressure sensors, two Kistler type 4049B dynamic pressure sensors for the intake and the exhaust (frequency = 60 kHz), one HBM type 40 torquementer (frequency = 10 kHz), three AVL type ZI33 in-cylinder pressure sensors (frequency = 150 kHz), and one ETAS ES430 air-fuel ratio sensor (frequency = 2 kHz).
The INCA Software (version 7.1.10/3) controls the engine ECU. All the sensors are connected to a National Instrument fast acquisition box. The STARS software from HORIBA makes it possible to control automatically the dynamic bench, and it can create different cycles.
The PR-L804 fan from Dynair cools the engine radiator and the Fumex FB110 fan cools the intake heat exchanger. Both fans are controlled by STARS software, which modifies their rotation speeds according to the speed of the vehicle during a cycle. This equipment creates test conditions close to the real ones. The pollutant emissions CO and HC are measured with a 3200 CAPELEC device, and the NOx emission with an ECM NOxCANt sensor. The setup is shown in Figure 2.

2.2. Particles Measuring Device

The particle measurement device used in this study is a “Pegasor Particles Sensor” called PPS showed Figure 3. The sample is not diluted, and this device measures the current carried out by the particles. For that, the PPS uses the Corona effect to ionize particles: a Corona discharge occurs when an electric current carried by a high voltage passes through two electrodes separated by a neutral gas (air).
This electric arc creates positive ions that propagate towards the molecules of air. This is called the ionization phenomenon. Then the ionized air mixes with the exhaust gases containing particles. These particles absorb the positive ions. The mixture is thus composed of free ions and ionized particles. An electric trap captures the free ions by maintaining a positive voltage on its surface. This last one has the effect of pushing the positive ions towards the external surface of the trap in order to discharge them. If the trapping voltage increases, then the lighter ionized particles are absorbed by the trap. It is possible to choose a sample of particles according to their size thanks to the choice of the trapping voltage. It can vary from 0 V to 1000 V according to the manufacturer data [27]. A trapping voltage of 400 V is used to measure particles with a size above or equal to 23 nm. This trapping voltage is used in these tests because it corresponds to the minimum size required by the regulatory standards [28]. This technology is very reactive because it performs measurements at the frequency of 100 Hz. However, it is necessary to make the assumption of mean diameter, standard deviation, and fractal dimension in order to determine the number and the mass flow rate of the particles [29,30]. As particle emissions are higher during the transient phases, this study is performed in such an operating mode. However, it is not possible to know precisely the mean diameter of the particles, since it varies depending on the engine load and rotation speed. Therefore, in this paper, a simple comparison of the current measured by the PPS is made, because it is proportional to the particles emitted by the engine. This solution was chosen because the acquisition frequency of the PPS is high and allows the measurement of particle emissions during transients. Since a comparison will be made between the two configurations, a relative measurement is sufficient.

2.3. Description of the Blow-By Circuit

The engine is equipped with an oil separator located on the cylinder head shows Figure 4. Figure 5 presents a simplified diagram of this oil separator and the intake duct allowing a better understanding of the different paths used by the blow-by gases. The blow-by gases rise from the oil sump along two chimneys, crossing the engine block from the bottom to the top, and emerging on the oil separator inlet (1). These gases go through chicanes (2). These are designed to accelerate and project the gases against the walls, and finally increase the coalescence of the oil droplets to an oil film in order to remove the maximum of oil blow-by gases. The released oil falls back by gravity directly into the oil pan. Then, these gases head to the upper part of the oil separator, which contains a second series of chicanes (3) in order to be separated from the remaining oil.
The released oil returns by gravity in the oil pan via the duct (4). The cleaned gases (without oil) are reinjected into the intake manifold, either by the duct (5) when the engine is in atmospheric operation, or by the duct (6) when the engine is in turbocharged operation. In fact, when the pressure in the manifold is lower than atmospheric pressure, the gases are led to the manifold via the duct (5). Otherwise, the gases are led upstream of the compressor via the duct (6).
It is indeed the pressure prevailing in the oil pan that drives the ducts (5) and (6). Tests have shown that the pressure in this crankcase oscillates between 980 mbar and 1020 mbar depending on the atmospheric or turbocharged modes. It is important to specify that this separator is equipped with a flow regulator in the atmospheric duct (5) in order to limit the injection of gas at idle mode (when the vacuum is the most important). This could greatly affect idle speed control.

2.4. Transient Tests

In order to be close to the real conditions of the “stop and start” system, a transient start from idle to 2000 rpm and 60 Nm in 5 s is selected.
To reach this point, it is necessary to keep the accelerator pedal pressed at 100% for about 2 s. Particulate emissions show significant variations from test to test despite mastering both engine and bench parameters. It is, therefore, necessary to accumulate data and to proceed with a statistician approach to get a trend out, and thus evaluate the impact of the variable. To obtain as much data as possible, 100 transients (strictly identical from the point of view of the control) are carried out successively after reaching thermal stability and respecting a time of 20 s of idling between each test.
Figure 6 shows the evolution of engine speed, effective dynamic torque, in-cylinder pressure, and intake manifold pressure, depending on the position of the accelerator pedal during this transient. The signal “accelerator position” represents practically the position of the engine throttle, which means that it is in the fully open position for about 2 s before reaching the requested point. In Figure 6 bottom right, the dynamic effective torque during this transient is presented. The significant variations at the start are consequences of the important variations of the in-cylinder pressures between the cylinders. For example, for one cylinder, the in-cylinder pressure may be 25 bars while it may still be 6 bars for another cylinder (which is the idle in- cylinder pressure). This difference will generate a significant variation of the engine torque.
In this paper, two configurations are tested. The first one, called case 1, corresponds to the system in its original serial configuration. No modification is made to the oil separator. In the second configuration, called case 2, the ducts (5) and (6) remain open, but a vacuum pump (7) is introduced downstream of the air intake of the oil separator in order to directly suck the gases from the “blow-by” to the exhaust extractor (cf. Figure 5).

2.5. Similarity of the Tests

For each case, 100 transients, strictly identical from the point of view of the control, are carried out successively after having reached thermal stability and respecting a time of 20 s of idling between each test. In order to perform a relevant comparison between the two cases, it is necessary to control the similarity of each case.

2.5.1. Thermal and Atmospheric Conditions

In Table 2 below, the interest of such tests appears clearly. Indeed, it is possible to obtain a large number of tests for each configuration. Since the tests are carried out on the same day, the thermal and atmospheric conditions remain the same or very close. The temperatures and pressures shown in Table 2 are averaged over the duration of 100 transients.

2.5.2. Motor Actuators

Figure 7 shows the average evolution of 100 transients of the six main motor actuators registered for cases 1 and 2 with INCA software. The plots in the upper part represent the amount of fuel injected per cycle (left) and the injection pressure (right). The differences in the quantity of fuel injected and the supply pressure are very small and remain lower than 5%. The plots in the central part represent the evolution of the crankshaft position in degrees relative to the TDC of the intake camshaft (left) and exhaust camshaft (right). The position of the intake camshaft displays a maximum deviation of 2 °CA between the two configurations while it rises up to 4 °CA for the exhaust camshaft. The plots in the lower part show the position of the accelerator (left) and the spark advance in crankshaft degrees relative to TDC (right). For cases 1 or 2, the variations of the position of the accelerator pedal remain the same. For the spark advance, slight differences appear at idle due to the instability. From 1 s, the evolution is strictly similar. The largest deviations are 8 °CA at idle and 6 °CA at the end of the transient. Because the pick of particle emissions appears only during the transient stage (and not in the idle or stabilized stage), the slight differences of spark advance do not influence the particle emissions. In addition, it is useful here to specify that the acquisition frequency of these graphic representations is limited by the INCA software that communicates with the engine ECU. Therefore, some deviations that appear in Figure 7 do not actually exist during the test. In general, the differences between the main motor actuators of cases 1 and 2 are so small that it is possible to conclude that their evolutions are identical.

2.5.3. Engine Parameters

Figure 8 illustrates the average evolution of 100 transients of the main engine parameters on two levels. The evolution of engine speed and average torque is visible on the upper part of the figure, on the left and right, respectively. The lower part shows the variation of the intake pressure on the left and the air mass flow rate on the right. The deviations are minimal and difficult to detect. When they exist, they have no effect on particle emissions since they are outside of the time window when there is a significant production of particles.

3. Results

3.1. Oil Pan Pressure

Figure 9 shows the evolution of the pressure in the oil pan with the pressure in the manifold (grey curve). At idle for case 1, the pressure in the crankcase is 987 mbars. Then it rises to 1025 mbars during the transient and stabilizes around 990 mbars at 2000 rpm and 60 Nm.
During this test, there is a slight overpressure in the oil separator at 2.6 s. In case 1, the blow-by gases go through the low-pressure duct of the oil separator during the first second of the transient. Then, they cross the high-pressure duct for 1.8 s to finally return to the low-pressure duct for the rest of the transient. The pressure peak in the crankcase occurs when the pressure in the manifold is approximately 1100 mbars, which is 80 mbars more than the atmospheric pressure. In case 2, the pump sucks the blow-by gases in the oil separator and returns them to the exhaust gas extractor. In order to obtain the same evolution of pressure in the oil pan with case 1, the low and high-pressure ducts are not modified. Indeed, if the ducts were blocked, the pressure in the canister would remain constant and up to atmospheric pressure. Therefore, the blow-by gases, which have not been expelled by the pump, are reintroduced at the intake of the engine. However, given the high vacuum applied by the pump, these residual gases are close to zero. The result is similar to the serial configuration (case 1) with very slight differences at the idle and at the end of the transitory, but without effect on combustion.

3.2. Particle Emissions for Cases 1 and 2

The average evolution of particle emissions of the 100 transients for case 1 is shown in Figure 10. However, it is possible to separate three distinct zones. The first zone, called “a”, corresponds to the modification of the engine strategy. In idle, the engine is in the Atkinson cycle and the camshafts are offset to contain a smaller volume of air in the cylinder than in the Beau de Rochas cycle. This change of position is quick: a few milliseconds for approximately 40° of intake camshaft and 25° of exhaust camshaft position. It leads to a small particle peak. The second zone, called “b”, is the most important. It mainly corresponds to the rapid variation of the equivalence ratio required in relation to the requested power. In fact, during this phase, the ECU increases quickly the injection time and the injection pressure in order to reach full power. The third zone, called “c”, is due to the closure of the throttle. From the evolution of the manifold pressure shown in Figure 6 (top right), it appears that the throttle closes within 0.3 s. This rapid closing creates pressure waves that disrupt the volumetric efficiency of the engine. The ECU calculates the airflow from the pressure sensor on the manifold. As a result, the amount of air entering the cylinder is overestimated and this generates a significant increase of the equivalence ratio and therefore a peak of particles.
The average representative curve of particle emissions of the 100 transients for case 2 has the same shape as in case 1, but with a much lower peak in the second zone (b). The average current measured for 100 transients for case 1 and case 2 are shown in Table 3 below.
The percentage standard deviation is calculated from the standard deviation of Integ I ¯ of 100 transients divided by the mean. The emission level for case 2 is therefore 1.5 times lower without blow-by gases compared to case 1, with a standard deviation 1.5 times lower. Therefore, blow-by gases have a significant impact on particle emissions and on test repeatability. From this result, two remarks can be made:
  • If the emission level for case 1 is more important than case 2, this implies that the blowby gases are not completely free of oil and so that the engine oil separator is not 100% effective. Indeed, after the case 1 transients, the presence of oil is noticed in the blowby circuit from the engine oil separator to the intake manifold. Otherwise, there is no oil in the blowby circuit from the engine oil separator to the intake manifold for the case 2 transients.
  • If the standard deviation is almost 33% lower without blowby gases, this implies that the oil concentration of blowby gases reinjected at the intake is variable.

4. Discussion

The main sources of particles are rich mixture combustion, wall fuel film impingement, and oil consumption. In Section 2.5, it is demonstrated that the transient tests are perfectly repeatable, similar, and are carried out when the engine is warmed up. In previous work, it has already been shown that the variation of particles emissions for these same transients is not related to the variation of equivalence ratio but to the oil consumption [26]. In addition, the results show that the blow-by gases flow rate has an impact on the particle emission variations and on test repeatability. Consequently, the variations of emissions and standard deviation are mainly related to oil consumption.
The oil consumption sources are the expulsion of oil into the cylinder (backflow), the evaporation of the oil film on the cylinder wall, the transport of oil in the cylinder through the valve seats, and the transport of oil in the intake manifold via the blowby circuit [31,32,33].
The tests are carried out at the same engine cooling temperature (cf. Table 2). Therefore, there is no variation due to evaporation. The oil flow is strictly identical from one test to another since the tests are strictly identical (cf. Figure 7 and Figure 8). Then, there is no variation due to the transport of oil in the cylinder through the valve seats. Therefore, the only sources of variable oil consumption are the backflow and blowby phenomena. Some studies have shown that the piston rings are not static, but move axially, radially and revolve around the piston [8,9,10,11,12]. Schneider et al. [18] measured a speed of rotation of 0.25 rpm at 2000 rpm, while the ring manufacturer KOLBENSHIMD [2] states that the rotation can reach up to 15 rpm, depending on the engine speed and load. The position of the first two rings, characterized by the position of the “endgap”, influences the flow rate and the oil concentration of the blow-by gases [11,34,35,36,37,38]. Byung-Soon et al. [35] and Thirouard et al. [38] observed that this phenomenon is linked to the position of the “endgap”. If two ring gaps are lined up, the amount of oil removed by gas flow dragging from the land bounded by these two rings is null, and the amount of oil transport towards the combustion chamber by the backflow phenomena is maximal.
Conversely, if two ring gaps are in opposition (180° difference), the amount of oil removed by gas flow dragging from the land bounded by these two rings is maximal and the amount of oil transport towards the combustion chamber by the backflow is minimal. The consequences of these phenomena are presented in Figure 11.
Considering the high level of repeatability of transient tests, it is possible to simplify Equation (3) by assuming that δ OC >> δ and therefore δ N     δ OC. From these observations and the above analysis, it is possible to develop the variable part of the particle characterization function, that is to say:
δ N = δ N oil - blowby   ( θ _ rings )   +   δ N oil - backflow   ( θ _ rings )
where δ Noil-blowby (θ_rings) is the oil flow rate of the blow-by gases as a function of the position θ_rings, representing the angle between the “endgap “ of the first two rings, and δ Noil-backflow (θ_rings) is the oil flow rate returned to the cylinder as a function of position θ_rings.
Finally, it is possible to rewrite the Equation (1):
N T o t a l   = N ¯   + δ N oil - blowby   ( θ _ rings )   +   δ N oil - backflow   ( θ _ rings )
If the decanter of a spark-ignition engine is perfect, i.e., a 100% efficiency of the oil separator, the δ Noil-blowby (θ_rings) part would be zero since no drop of oil would be injected at the intake via the gases of the blow-by. Ultimately, particle emissions linked to δ Noil-blowby (θ_rings) exclusively depend on the efficiency of the oil separator, while those linked to δ Noil-backflow (θ_rings) depend on the position of the “endgap” formed by the first two rings. If the endgap position is known, it would be possible to determine the total particle emission of the combustion engine.
The difficulty is to determine the impact in terms of particle number concentration of the blowby and backflow phenomena. Equation (5) can be rewritten in terms of current, since the latter is proportional to the number of particles (see Section 2.2).
δ I T o t a l   = I ¯   δ I oil - blowby   ( θ _ rings )   +   δ I oil - backflow   ( θ _ rings )
The tests conducted without blowby gas (case 2) make it possible to simplify the previous equation because δ Ioil-blowby ( rings ) = 0.
I T o t a l   = I ¯   + δ I oil - backflow   ( θ r i n g s )
The average current measured for 100 transients was I Total   = IntegI   case   2   ¯ = 113 pA with σ = 8%. For this case, the minimum current measured is Imin = 93 pA and the maximum current measured is Imax = 140 pA. Based on the results of Thirouard and Hartl [37] and Figure 11, it appears that when the endgap angle formed by the compression and sealing segments is maximum, i.e., close to 180°, the sweeping effect of the oil contained between the segments is also maximum. This principle can be simplified as follows:
-
when θ rings   is close to 180°, then δ Ioil-backflow ( θ rings ) tends to 0
-
when θ rings is close to 0°, then δ Ioil-backflow ( θ rings ) is maximal.
As demonstrated in previous work on these same transients [26], under the same test conditions, the differences of the equivalence ratio are rather small in transients and therefore I ¯ can be considered constant between each test of the same series. Therefore, when the particle number concentration is minimal, it can be assumed that the angle formed by θ rings is maximal for all three cylinders. That is, Imin = 93 pA, δ Ioil-backflow ( θ rings ) tends to 0. Equation (7) can be simplified:
I T o t a l   = I ¯  
with
I ¯ = I min  
From the results, it appears that:
I T o t a l   = I ¯ = 93   pA
and when the current measured is maximal, it can be assumed that the angle formed by θ rings is minimal for all three cylinders. That is, Imax = 140 pA, δ Ioil-backflow ( θ rings ) is maximal.
This leads to:
δ I oil - backflow   ( θ min )   =   I max     I min   =   140     93   =   47   pA
These results are interesting because at the same test conditions, I ¯ is constant and therefore its value is close to 93 pA. Furthermore, from the result of Equation (10), it is possible to calculate the impact of the sweeping phenomenon of the oil stored between the segments by the blowby gases. This is between 0 ≤ δ Ioil-backflow ( θ rings ) ≤ 47 pA.
Equation (6) can be averaged and rewritten as follows:
I t o t a l   ¯ = I ¯   + I oil b l o w b y ¯   + I o i l b a c k f l o w ¯
From the results of the tests without blow-by, it is possible to determine the value of I oil backflow ¯   :
I o i l b a c k f l o w ¯   = I n t e g I c a s e 2   ¯ I ¯   I o i l b a c k f l o w ¯ = 113 93   I o i l b a c k f l o w ¯ = 20   pA
Then from the results with the blow-by gases, it is possible to determine the average weight I oil blowby ¯   for case 1 (normal configuration).
In fact, for these tests, I total   ¯   = IntegI   case   1   ¯ = 165 pA. From the Equation (12), it follows that:
I o i l b l o w b y ¯   = I t o t a l   ¯   I ¯   I o i l b a c k f l o w ¯ N o i l b l o w b y ¯ = 165 93 20   N o i l b l o w b y ¯ = 52   pA
Then, from Equations (10), (13), and (14) it is then possible to determine the average weight of each function during this transient, for this engine. The result is presented in Figure 12.
From this result, it appears that 57% of the particulate emissions are related to the equivalence ratio, while 31% are directly related to the ability of the decanter to remove the oil of the blowby gases. Finally, 12% of the emissions come from the backflow.

5. Conclusions

One hundred transients, strictly identical, carried out on a turbocharged spark-ignition engine with direct injection have highlighted the significant impact of particle emissions linked to blow-by gases and the endgap ring position.
-
Indeed, even equipped with a two-way oil separator (Low pressure and High pressure), this engine emits 1.5 times more particles with a standard deviation that decreases by 33% compared to a configuration without blow-by gases. After analysis, it turns out that the oil separators are not effective enough to completely remove the oil from the blow-by gases.
-
Furthermore, the position of the “endgap” formed by the first two rings has a significant impact on the amount of oil transported by the blow-by gases toward the intake manifold and by the backflow gases towards the combustion chamber.
-
It turns out that for this engine and this transient, 57% of the particulate emissions are related to the equivalence ratio, while 31% are directly related to the blowby gases. Finally, 12% of the emissions come from the backflow.
-
Therefore, the endgap position is the main factor linked to the variation of particulate emissions and because the rings are not static, it makes sense to get some variation of particulate emissions of a gasoline engine. These variations are linked to the piston/rings design and the oil separator efficiency.

Author Contributions

Conceptualization, V.B. and D.C.; formal analysis, V.B.; investigation, V.B.; methodology, V.B.; project administration, V.B., D.C. and J.-F.H.; resources, D.C. and J.-F.H.; software, V.B.; supervision, V.B., D.C. and J.-F.H.; validation, V.B., D.C. and J.-F.H.; visualization, V.B., D.C. and J.-F.H.; writing-original draft, V.B.; writing—review & editing, V.B., D.C. and J.-F.H. All authors have read and agreed to the published version of the manuscript.

Funding

This research received no external funding.

Conflicts of Interest

The authors declare no conflict of interest.

Abbreviations

CACrank Angle (degree)
ECUElectronic Control Unit
EndgapDistance left between the ends of the ring when installed in the cylinder
EVCExhaust Valve Closing
GDIGasoline Direct Injection
HPHigh Pressure
NParticle number concentration (#/m3)
ICurrent measured by the PPS and proportional to the particles number concentration
IminSmallest current value measured by the PPS for a series of 100 transients
ImaxHighest current value measured by the PPS for a series of 100 transients
IntensityMeasured current (pA)
IntegI ¯ 1 n 1 n I d I
IVOIntake Valve Closing
LPLow Pressure
OCOil Consumption
pAPico Ampère
PPSPegasor Particles Sensor
TGDITurbocharged Gasoline Direct Injection
TqTorque (nm)
TDCTop Dead Center
σ Standard Deviation
Equivalence ratio
θ_ringsAngular position between two endgap of the first two rings (°)
vEngine speed (rpm)

References

  1. Cheng, W.K.; Hamrin, D.; Heywood, J.B.; Hochgreb, S.; Min, K.; Norris, M. An Overview of Hydrocarbon Emissions Mechanisms in Spark-Ignition Engines; SAE Technical Paper 932708; SAE International: Warrendale, PA, USA, 1993. [Google Scholar] [CrossRef]
  2. Kolbenshmidt. Piston Rings for Combustion Engine. Available online: https://www.ms-motorservice.com.tr/fileadmin/media/MAM/PDF_Assets/Piston-Rings-for-Combustion-Engines_53094.pdf (accessed on 5 March 2020).
  3. Delprete, C.; Selmani, E.; Bisha, A. Gas escape to crankcase: Impact of system parameters on sealing behavior of a piston cylinder ring pack. Int. J. Energy Environ. Eng. 2019, 10, 207–220. [Google Scholar] [CrossRef] [Green Version]
  4. Takiguchi, M.; Nakayama, K.; Furuhama, S.; Yoshida, H. Variation of Piston Ring Oil Film Thickness in an Internal Combustion Engine—Comparison Between Thrust and Anti-Thrust Sides; SAE Technical Paper 980563; SAE International: Warrendale, PA, USA, 1998. [Google Scholar] [CrossRef]
  5. Namazian, M.; Heywood, J.B. Flow in the Piston-Cylinder-Ring Crevices of a Spark-Ignition Engine: Effect on Hydrocarbon Emissions, Efficiency and Power; SAE Technical Paper 820088; SAE International: Warrendale, PA, USA, 1982. [Google Scholar] [CrossRef]
  6. Herbst, H.M.; Priebsch, H.H. Simulation of Piston Ring Dynamics and Their Effect on Oil Consumption; SAE Technical Paper 2000-01-0919; SAE International: Warrendale, PA, USA, 2000. [Google Scholar] [CrossRef]
  7. Rabute’, R.; Tian, T. Challenges Involved in Piston Top Ring Designs for Modern SI Engines. J. Eng. Gas. Turbines Power 2000, 123, 448–459. [Google Scholar] [CrossRef]
  8. Schneider, E.W.; Blossfeld, D.H.; Lechman, D.C.; Hill, R.F.; Reising, R.F.; Brevick, J.E. Effect of Cylinder Bore Out-of-Roundness on Piston Ring Rotation and Engine Oil Consumption; SAE Technical Paper 930796; SAE International: Warrendale, PA, USA, 1 March 1993. [Google Scholar] [CrossRef]
  9. Schneider, E.W.; Blossfeld, D.H. Method for Measurement of Piston Ring Rotation in an Operating Engine; SAE Technical Paper 900224; SAE International: Warrendale, PA, USA, 1990. [Google Scholar] [CrossRef]
  10. Uhlig, B.P.; Kirner, C.; Preuss, A.-C.; Wachtmeister, G. Real-Time Measurement of the Piston Ring Gap Positions and Their Effect on Exhaust Engine Oil Emission; SAE Technical Paper 2018-01-5006; SAE International: Warrendale, PA, USA, 2018. [Google Scholar] [CrossRef]
  11. Usui, M.; Murayama, K.; Oogake, K.; Yoshida, H. Study of Oil Flow Surrounding Piston Rings and Visualization Observation; SAE Technical Paper 2008-01-0795; SAE Technical Paper 932708; SAE International: Warrendale, PA, USA, 2008. [Google Scholar] [CrossRef]
  12. Jung, S.; Jin, J. Monitoring of Rotational Movements of Two Piston Rings in a Cylinder Using Radioisotopes. J. Korean Nucl. Soc. 1999, 31, 423–431. [Google Scholar]
  13. Iijima, N.; Miyamoto, T.; Takiguchi, M.; Kai, R.; Sato, M. An Experimental Study on Phenomena of Piston Ring Collapse; SAE Technical Paper 2002-01-04832002; SAE International: Warrendale, PA, USA, 2002. [Google Scholar] [CrossRef]
  14. Tian, T. Dynamic behaviours of piston rings and their practical impact. Part 1: Ring flutter and ring collapse and their effects on gas flow and oil transport. Proc. Inst. Mech. Eng. Part. J. J. Eng. Tribol. 2002, 216, 209–228. [Google Scholar] [CrossRef]
  15. Cheng, C.; Schock, H.; Richardson, D. The Dynamics of Second Ring Flutter and Collapse in Modern Diesel Engines. J. Eng. Gas. Turbines Power 2015, 137, 111504. [Google Scholar] [CrossRef]
  16. Tian, T. Dynamic behaviours of piston rings and their practical impact. Part 2: Oil transport, friction and wear of ring/liner interface and the effects of piston and ring dynamics. Proc. Inst. Mech. Eng. Part. J. J. Eng. Tribol. 2002, 216, 229–248. [Google Scholar] [CrossRef]
  17. Kharazmi, A. Three Dimensional Analysis of the Gas Flow in Piston Ring Pack. Ph.D. Thesis, Michigan State University, Lansing, MI, USA, 2017. [Google Scholar]
  18. Wróblewski, P.; Koszalka, G. An Experimental Study on Frictional Losses of Coated Piston Rings with Symmetric and Asymmetric Geometry. SAE Int. J. Engines 2021, 14, 853–866. [Google Scholar] [CrossRef]
  19. Wróblewski, P.; Iskra, A. Problems of Reducing Friction Losses of a Piston-Ring-Cylinder Configuration in a Combustion Piston Engine with an Increased Isochoric Pressure Gain; SAE Technical Paper 2020-01-2227; SAE International: Warrendale, PA, USA, 15 September 2020. [Google Scholar] [CrossRef]
  20. Zarenbin, V.; Kolesnikova, T.; Sakno, O.; Ollo, V.; Klimenko, V. Impact Evaluation of Piston Rings Mobility on A Gas Passage in An Internal Combustion Engine (ICE). Sci. J. Sil. Univ. Technol. Ser. Transp. 2019, 104, 187–201. [Google Scholar] [CrossRef]
  21. Turnbull, R.; Dolatabadi, N.; Rahmani, R.; Rahnejat, H. An assessment of gas power leakage and frictional losses from the top compression ring of internal combustion engines. Tribol. Int. 2020, 142, 105991. [Google Scholar] [CrossRef]
  22. Jues, T. Modélisation et Simulation des gaz de Blow-by Dans un Décanteur Automobile. Ph.D. Thesis, L’Ecole Nationale Supérieure d’Arts et Métiers, Paris, France, 2010. [Google Scholar]
  23. Thawko, A.; Yadav, H.; Eyal, A.; Shapiro, M.; Tartakovsky, L. Particle emissions of direct injection internal combustion engine fed with a hydrogen-rich reformate. Int. J. Hydrogen Energy 2019, 44, 28342–28356. [Google Scholar] [CrossRef]
  24. Swanson, J.; Ragatz, A.; Watts, W.; Kittelson, D.; Winsor, R. Nanoparticle measurements used to detect an engine oil control ring failure. Proc. Inst. Mech. Eng. Part. D J. Automob. Eng. 2009, 223, 1071–1076. [Google Scholar] [CrossRef]
  25. Amirante, R.; Distaso, E.; Tamburrano, P.; Reitz, R.D. Measured and Predicted Soot Particle Emissions from Natural Gas Engines; SAE Technical Paper 2015-24-2518; SAE International: Warrendale, PA, USA, 2015. [Google Scholar] [CrossRef]
  26. Berthome, V.; Chalet, D.; Hetet, J.-F. Characterization of Particle Emissions of Turbocharged Direct Injection Gasoline Engine in Transients and Hot Start Conditions. J. Therm. Sci. 2021, 30, 2056–2070. [Google Scholar] [CrossRef]
  27. Pegasor, PPS-Plotter; User Manual; Pegasor Ltd.: Tampere, Finland, 2014.
  28. The European Commission. Commission Regulation (EU) No 459/2012 of 29 May 2012 amending Regulation (EC) No 715/2007 of the European Parliament and of the Council and Commission Regulation (EC) No 692/2008 as regards emissions from light passenger and commercial vehicles (Euro 6). Off. J. Eur. Union 2012, 142, 16–24. Available online: https://eur-lex.europa.eu/legal-content/EN/TXT/PDF/?uri=CELEX:32012R0459&from=EN (accessed on 5 March 2020).
  29. Amanatidis, S.; Maricq, M.M.; Ntziachristos, L.; Samaras, Z. Measuring number, mass, and size of exhaust particles with diffusion chargers: The dual Pegasor Particle Sensor. J. Aerosol Sci. 2016, 92, 1–15. [Google Scholar] [CrossRef]
  30. Ntziachristos, L.; Amanatidis, S.; Samaras, Z.; Janka, K.; Tikkanen, J. Application of the Pegasor Particle Sensor for the Measurement of Mass and Particle Number Emissions. SAE Int. J. Fuels Lubr. 2013, 6, 521–531. [Google Scholar] [CrossRef]
  31. Manni, M.; Carriero, M.; Roselli, A. A Study of Oil Consumption on a Diesel Engine with Independently Lubricated Turbocharger; SAE Technical Paper 2002-01-2730; SAE International: Warrendale, PA, USA, 2002. [Google Scholar] [CrossRef]
  32. Delvigne, T. Oil Consumption Sources in a Modern Gasoline Engine Including Contribution of Blow-by Separator and Turbocharger: An Experimental Study Based on the Use of Radiotracers. SAE Int. J. Fuels Lubr. 2010, 3, 916–924. [Google Scholar] [CrossRef]
  33. Yilmaz, E.; Tian, T.; Wong, V.W.; Heywood, J.B. The Contribution of Different Oil Consumption Sources to Total Oil Consumption in a Spark Ignition Engine; SAE Technical Paper 2004-01-2909; SAE Technical Paper 932708; SAE International: Warrendale, PA, USA, 2004. [Google Scholar] [CrossRef]
  34. Gohl, M.; Matz, G.; Preuss, A.-C.; Pischinger, S.; Günther, M.; Ebert, T. Investigation of Oil Sources in the Combustion Chamber of Direct Injection Gasoline Engines; SAE Technical Paper 2018-01-1811; SAE Technical Paper 932708; SAE International: Warrendale, PA, USA, 2018. [Google Scholar] [CrossRef]
  35. Min, B.-S.; Kim, J.-S.; Oh, D.-Y.; Choi, J.-K.; Jin, J.-H. Dynamic Characteristics of Oil Consumption—Relationship Between the Instantaneous Oil Consumption and the Location of Piston Ring Gap; SAE Technical Paper 982442; SAE International: Warrendale, PA, USA, 1998. [Google Scholar] [CrossRef]
  36. Icoz, T.; Dursunkaya, Z. Experimental Investigation of Oil Accumulation in Second Land of Internal Combustion Engines. J. Eng. Gas. Turbines Power 2005, 127, 206–212. [Google Scholar] [CrossRef]
  37. Thirouard, B.; Hart, D.P. Investigation of Oil Transport Mechanisms on the Piston Second Land of a Single Cylinder Diesel Engine, Using Two-Dimensional-Laser-Induzed Fluorescence. In Laser Techniques Applied to Fluid Mechanics, Proceedings of the 9th International Symposium, Lisbon, Portugal, 13–16 July 1998; Adrian, R.J., Durão, D.F.G., Durst, F., Heitor, M.V., Maeda, M., Whitelaw, J.H., Eds.; Springer: Berlin/Heidelberg, Germany, 2000; pp. 487–503. [Google Scholar]
  38. Thirouard, B.; Tian, T. Oil Transport in the Piston Ring Pack (Part I): Identification and Characterization of the Main Oil Transport Routes and Mechanisms; SAE Technical Paper 2003-01-1952; SAE International: Warrendale, PA, USA, 2003. [Google Scholar] [CrossRef]
Figure 1. Ring positions on an engine piston.
Energies 14 07492 g001
Figure 2. Experimental setup.
Energies 14 07492 g002
Figure 3. Schematic of the PPS operation.
Energies 14 07492 g003
Figure 4. Oil separator of EB2dts engine.
Energies 14 07492 g004
Figure 5. Simplified diagram of an engine oil separator.
Energies 14 07492 g005
Figure 6. Evolution of engine parameters during a transient.
Energies 14 07492 g006
Figure 7. Motor actuators for cases 1 and 2.
Energies 14 07492 g007
Figure 8. Evolution of engine parameters for cases 1 and 2.
Energies 14 07492 g008
Figure 9. Evolution of the oil pan pressure and intake pressure for cases 1 and 2.
Energies 14 07492 g009
Figure 10. Evolution of particle emissions during a transient for cases 1 and 2.
Energies 14 07492 g010
Figure 11. Oil concentration of the blowby gases vs. endgap position of the rings.
Energies 14 07492 g011
Figure 12. Distribution of particulate emissions during a transient.
Energies 14 07492 g012
Table 1. Engine main features.
Engine Main FeaturesMain Parameters of Piston Rings
Engine4-stroke, TGDI, 3-cylinderPiston diameter74.45 mm
Bore × Stroke75 mm × 90.48 mmRing 1 axial height1.2 mm
Displacement1199.9 cm3Ring 2 axial height1 mm
Valves12Ring 3 axial height2 mm
Compression ratio10.5:1Ring 1 end gap0.2 mm
Maximum Power96 kW @ 5500 rpmRing 2 end gap0.4 mm
Maximum Torque230 Nm @ 1750 rpmRing 3 end gap0.2 mm
Table 2. Test conditions.
CasesAveraged Temperature (°C)Pressure (mbars)
Engine coolingEngine oilIntakeEngine benchExhaustSample line PPSSample line PPSAtmospheric
192.4996.3024.6120.12356.62195.731531.731020.94
292.6796.9024.7020.37356.60196.091529.121021.39
Table 3. Results.
Table 3. Results.
Case Number IntegrI ¯   ( pA ) σ (%)
116512
21138
Publisher’s Note: MDPI stays neutral with regard to jurisdictional claims in published maps and institutional affiliations.

