Article

Magnetic Coupling-Based Battery Impedance Measurement Method

1
College of Electrical Engineering, Zhejiang University, Hangzhou 310081, China
2
Zhejiang University–University of Illinois at Urbana-Champaign Institute, Zhejiang University, Haining 314400, China
*
Author to whom correspondence should be addressed.
Energies 2021, 14(22), 7490; https://doi.org/10.3390/en14227490
Submission received: 5 October 2021 / Revised: 2 November 2021 / Accepted: 5 November 2021 / Published: 9 November 2021

Abstract

:
The battery impedance is an important indicator of battery health status. In this paper, a magnetic coupling-based impedance measurement method for electrochemical batteries is proposed. Without affecting the energy injection stage, the designed suppression resistance can minimize the influence of the primary circuit response, and the under-damped oscillation waveform containing the battery impedance information can be directly obtained on the primary inductance. The change of the mutual inductance value within a certain range will not affect the measurement results. Therefore, the measurement system has high stability and robustness. By utilizing the discrete Fourier transform (DFT)-based algorithm to calculate the damped oscillation parameters, the battery impedance is accurately derived from the calculated attenuation coefficient and damped oscillation frequency. The accuracy of this method under different coupling parameters is analyzed and verified by simulation and experiment on a Li-ion battery, which could be employed to estimate the state of charge (SOC).

1. Introduction

Electrochemical batteries have become widely used as energy storage devices for electric or hybrid vehicles [1,2], portable electronics [3], and renewable energy storage [4,5]. Therefore, monitoring the battery performance is important to ensure the safety and reliability of the battery-based energy systems.
The battery impedance is widely recognized as an important parameter because it provides useful information on the performance of the battery, including the state of charge (SOC) and other performances. Thus, various electrical battery models have been proposed and reported, which are electrical equivalent models using a combination of voltage sources, resistors, capacitors, and inductors [6,7,8,9]. The battery impedance parameters of the equivalent circuit are reflective of electrochemical reactions and transport processes. These factors are affected by the internal thermal condition of the battery, charging current, and ionic concentrations. To identify the battery parameters, electrochemical impedance spectroscopy (EIS) is an attractive method, which is achieved by injecting AC small voltage/current at different frequencies into the battery and measuring its response [8,9,10,11,12,13]. Thus, the complicated impedance network can be fitted with the impedance spectra. However, EIS requires expensive and cumbersome equipment for a wide range of frequency sweep, making it difficult to be applied in industrial measurements. A cost-effective method is to measure the battery’s ohmic resistance at a certain high frequency (typically 1 kHz). The SOC of the battery can be estimated by comparing the measured impedance with long-term collected experimental data [12,13].
Nowadays, the magnetic coupling-based impedance measurement is considered as a significant method, which is used in the inductive power transmission (IPT) system [14,15,16,17]. The literature [14,15,16,17] proposes a load identification method based on energy injection and energy dissipation. However, the load identification methods in [14,15,16] do not consider the mutual inductance variation, which is typical for the practical operation of IPT systems with variable magnetic coupling between the primary and secondary coils. The mutual inductance variation is taken into account in [17], but the calculation accuracy is poor. The above measurement method obtains the load impedance value indirectly through the secondary circuit reflection impedance of the coupling circuit, so the accuracy of the measurement result depends on the given mutual inductance value. The data processing method based on the zero-crossing detection and the peak point of the attenuated signal has poor stability and accuracy, especially for the measurement of small resistance, such as Li-ion batteries whose resistance is usually less than 1 Ω.
In this paper, a magnetic coupling-based impedance measurement approach for the electrochemical battery is presented. The proposed measurement approach enables the primary and secondary sides of the coupling circuit to work in different damped oscillation states, so that the secondary side waveform containing the battery impedance information can be directly distinguished by analyzing the waveform characteristics, eliminating the effect of the primary circuit on the measurement result, and reducing the requirement for the accuracy of mutual inductance. The detection method based on magnetic coupling has the electrical isolation capability, and the change of the mutual inductance value within a certain range will not affect the measurement results, so the measurement system has high robustness. By utilizing the discrete Fourier transform (DFT)-based algorithm to calculate the damped oscillation parameters [18], the battery impedance is accurately derived from the calculated attenuation coefficient and damped oscillation frequency. Finally, the accuracy and stability of this method under different coupling parameters are analyzed and verified by simulation and experiment on a Li-ion battery to estimate the state of charge (SOC).

2. Principle of Battery Resistance Measurement

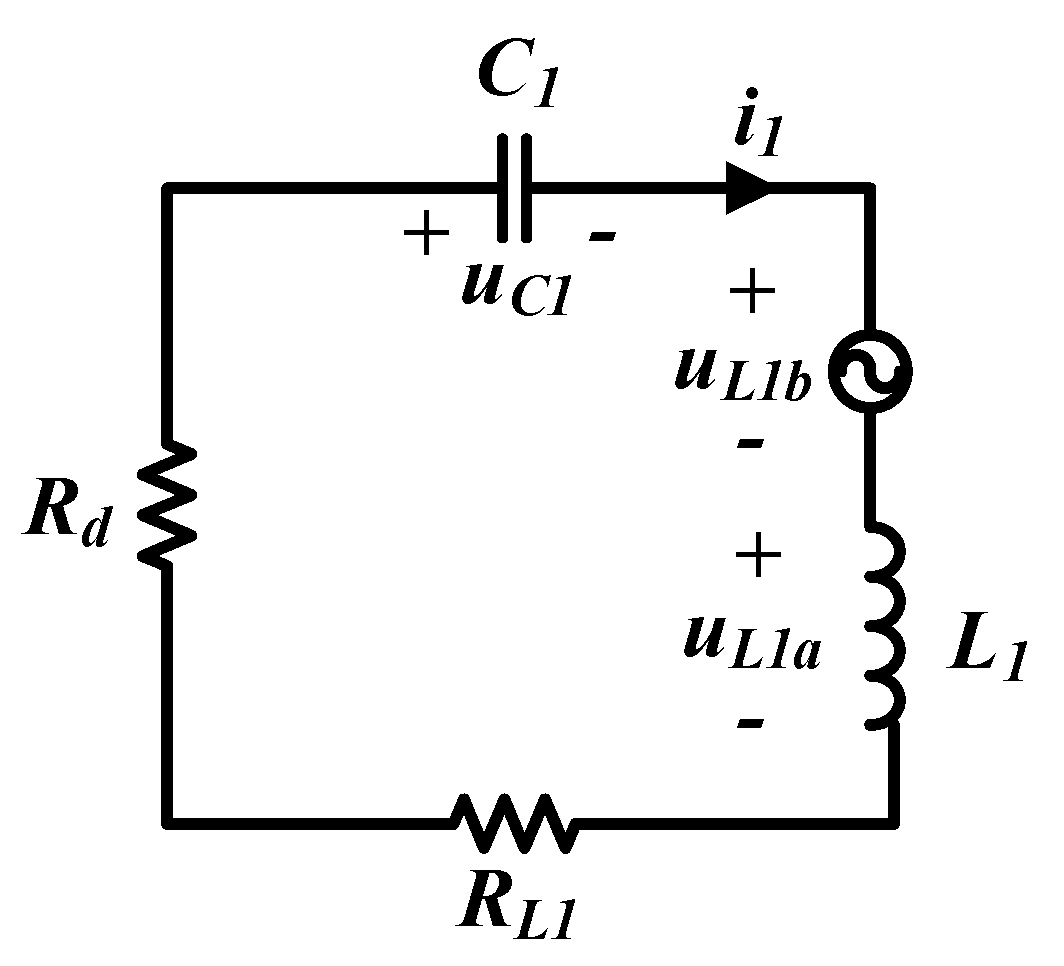
2.1. Simplified Electrical Battery Model

An electrical battery model can be represented with open-circuit voltage (OCV), resistors, capacitors, and inductors of an equivalent circuit, as shown in Figure 1a. The ohmic resistance, Ro, represents the electrolyte resistance. CDL and RCT represent the double layer and charge transfer effects on the electrodes. Warburg impedance ZW represents the diffusion due to the concentration polarization. The parasitic inductance Le represents the battery’s external/internal connections. OCV represents the battery open-circuit voltage.
The battery parameters including Ro, CDL, and RCT are used as the indicators of reflecting the SOC and other battery performances [6,7,8,10]. To simplify the circuit analysis and reduce the size of the measurement circuit to improve the practicality, 20 kHz was chosen as the measurement frequency. When the measurement frequency is high, the battery impedance model can be simplified by a voltage source in series with a resistor and inductor, as shown in Figure 1b. At this time, the battery equivalent impedance is inductive. According to the study of EIS, the parasitic inductance Le is usually less than 1 μH [8].

2.2. Measurement Principle

The schematic diagram of the measurement system is shown in Figure 2. M is the mutual inductance. L1 and L2 are the loosely coupled inductors with coupling coefficient k (k << 1), where L1 = L2 = L, k = M / L 1 L 2 = M / L . C1 and C2 are the compensating capacitors, where C1 = C2 = C. RL1 and RL2 are the line resistances, while R L 1 = R L 2 < 2 L / C . Lx is the battery parasitic inductance, which is usually less than 1 μH. E is the battery open-circuit voltage. Rx is the battery equivalent resistance, meeting R x + R L 2 < 2 L / C . Rd is the suppression resistor with a large resistance value, meeting R d 2 L / C . Udc is the DC power supply. uL1 is the observed signal, which represents the voltage across the inductor L1.
There are two operation stages in the process of the measurement. The system equivalent circuit in different operation stages is shown in Figure 3.
1st stage: Switches Q1 and Q2 work in the complementary mode, where the duty cycle is 50% and the switching frequency is at or near the natural resonant frequency ω0, which is given by
ω 0 = 1 L C .
In this stage, since the circuit works in a resonant state, the large parallel resistance Rd can be ignored. The square voltage source Up transfers energy to the detector through the mutual inductance. After the circuit goes into the steady state, L2 and C2 in the detector are charged; meanwhile, L1 and C1 in the receiver are also charged, as shown in Figure 3a.
2nd stage: Switches Q1 and Q2 are turned off. The series diodes D1 and D2 are used to prevent the current from flowing through the freewheeling diode of the MOS transistor. After that moment, the equivalent circuit is shown in Figure 3b. The circuit operates in free-range response, and the response uL1 can be expressed as
u L 1 ( t ) = L d i 1 ( t ) d t + M d i 2 ( t ) d t .
Due to the loose coupling relationship, the current response of the primary and secondary circuit can be recognized as decoupled. The response of the four-order circuit can be simplified to a linear superposition of two independent responses: the primary two-order response and the secondary two-order response.
As shown in Figure 4, the response uL1 is composed of the primary self-response, described as uL1a, and the secondary reflected response, which is equivalent to a voltage source Mdi2/dt, as described as uL1b.
For the primary self-response, the primary circuit works on the over-damped oscillation, due to
R d + R L 1 2 L / C .
Assuming the initial condition uc1|t=0 = U0 and i1|t=0 = 0, thus, uL1a can be described as
u L 1 a ( t ) = L d i 1 ( t ) d t = A 11 e α 1 t + A 12 e α 2 t
where A11 and A12 are the voltage amplitude, and α1 and α2 are the damping coefficient, which can be derived and simplified as
b 1 = R d + R L 1 2 L α 1 = b 1 b 1 2 ω 0 2 α 2 = b 1 + b 1 2 ω 0 2 A 11 = α 2 α 1 2 α 2 α 1 L C U 0 L R d 2 C U 0 A 12 = α 1 α 2 2 α 2 α 1 L C U 0 U 0
Similarly, the secondary circuit works on the under-damped oscillation. The open-circuit voltage of the battery can be regarded as a constant value due to the high measurement frequency. uL1b is derived by
u L 1 b ( t ) = M d i 2 ( t ) d t = A 2 e α 3 t sin ( ω d t + φ )
where A2 is the voltage amplitude, φ is the initial phase angle, α3 is the damping coefficient, and ωd is the operating frequency, which can be given by
α 3 = R x + R L 2 2 ( L + L x ) ω 1 = 1 ( L + L x ) C ω d = ω 1 2 α 3 2
Therefore, the observed signal uL1 can be expressed by
u L 1 ( t ) = A 11 e α 1 t + A 12 e α 2 t + A 2 e α 3 t sin ( ω d t + φ ) .
The battery resistance Rx and battery parasitic inductance Lx can be obtained by the calculation of the damping coefficient α3 and the operating frequency ωd in the signal uL1b.
In the under-damped series circuit, with determined inductor L and capacitor C, the parasitic inductance Lx can be derived by (7) and is expressed as
L x = 1 ( ω d 2 + α 3 2 ) C L .
Similarly, the battery resistance Rx is expressed as
R x = 2 α 3 C ( ω d 2 + α 3 2 ) R L 2 .
According to (10), the accuracy of the battery resistance depends on the calculation accuracy of the damping coefficient α3 and the operating frequency ωd and the given compensating capacitance C.
Additionally, the line resistance RL2 can be calculated by the same method in the under-damped circuit composed of the resistance RL2, inductance L, and capacitance C when the battery is not connected.

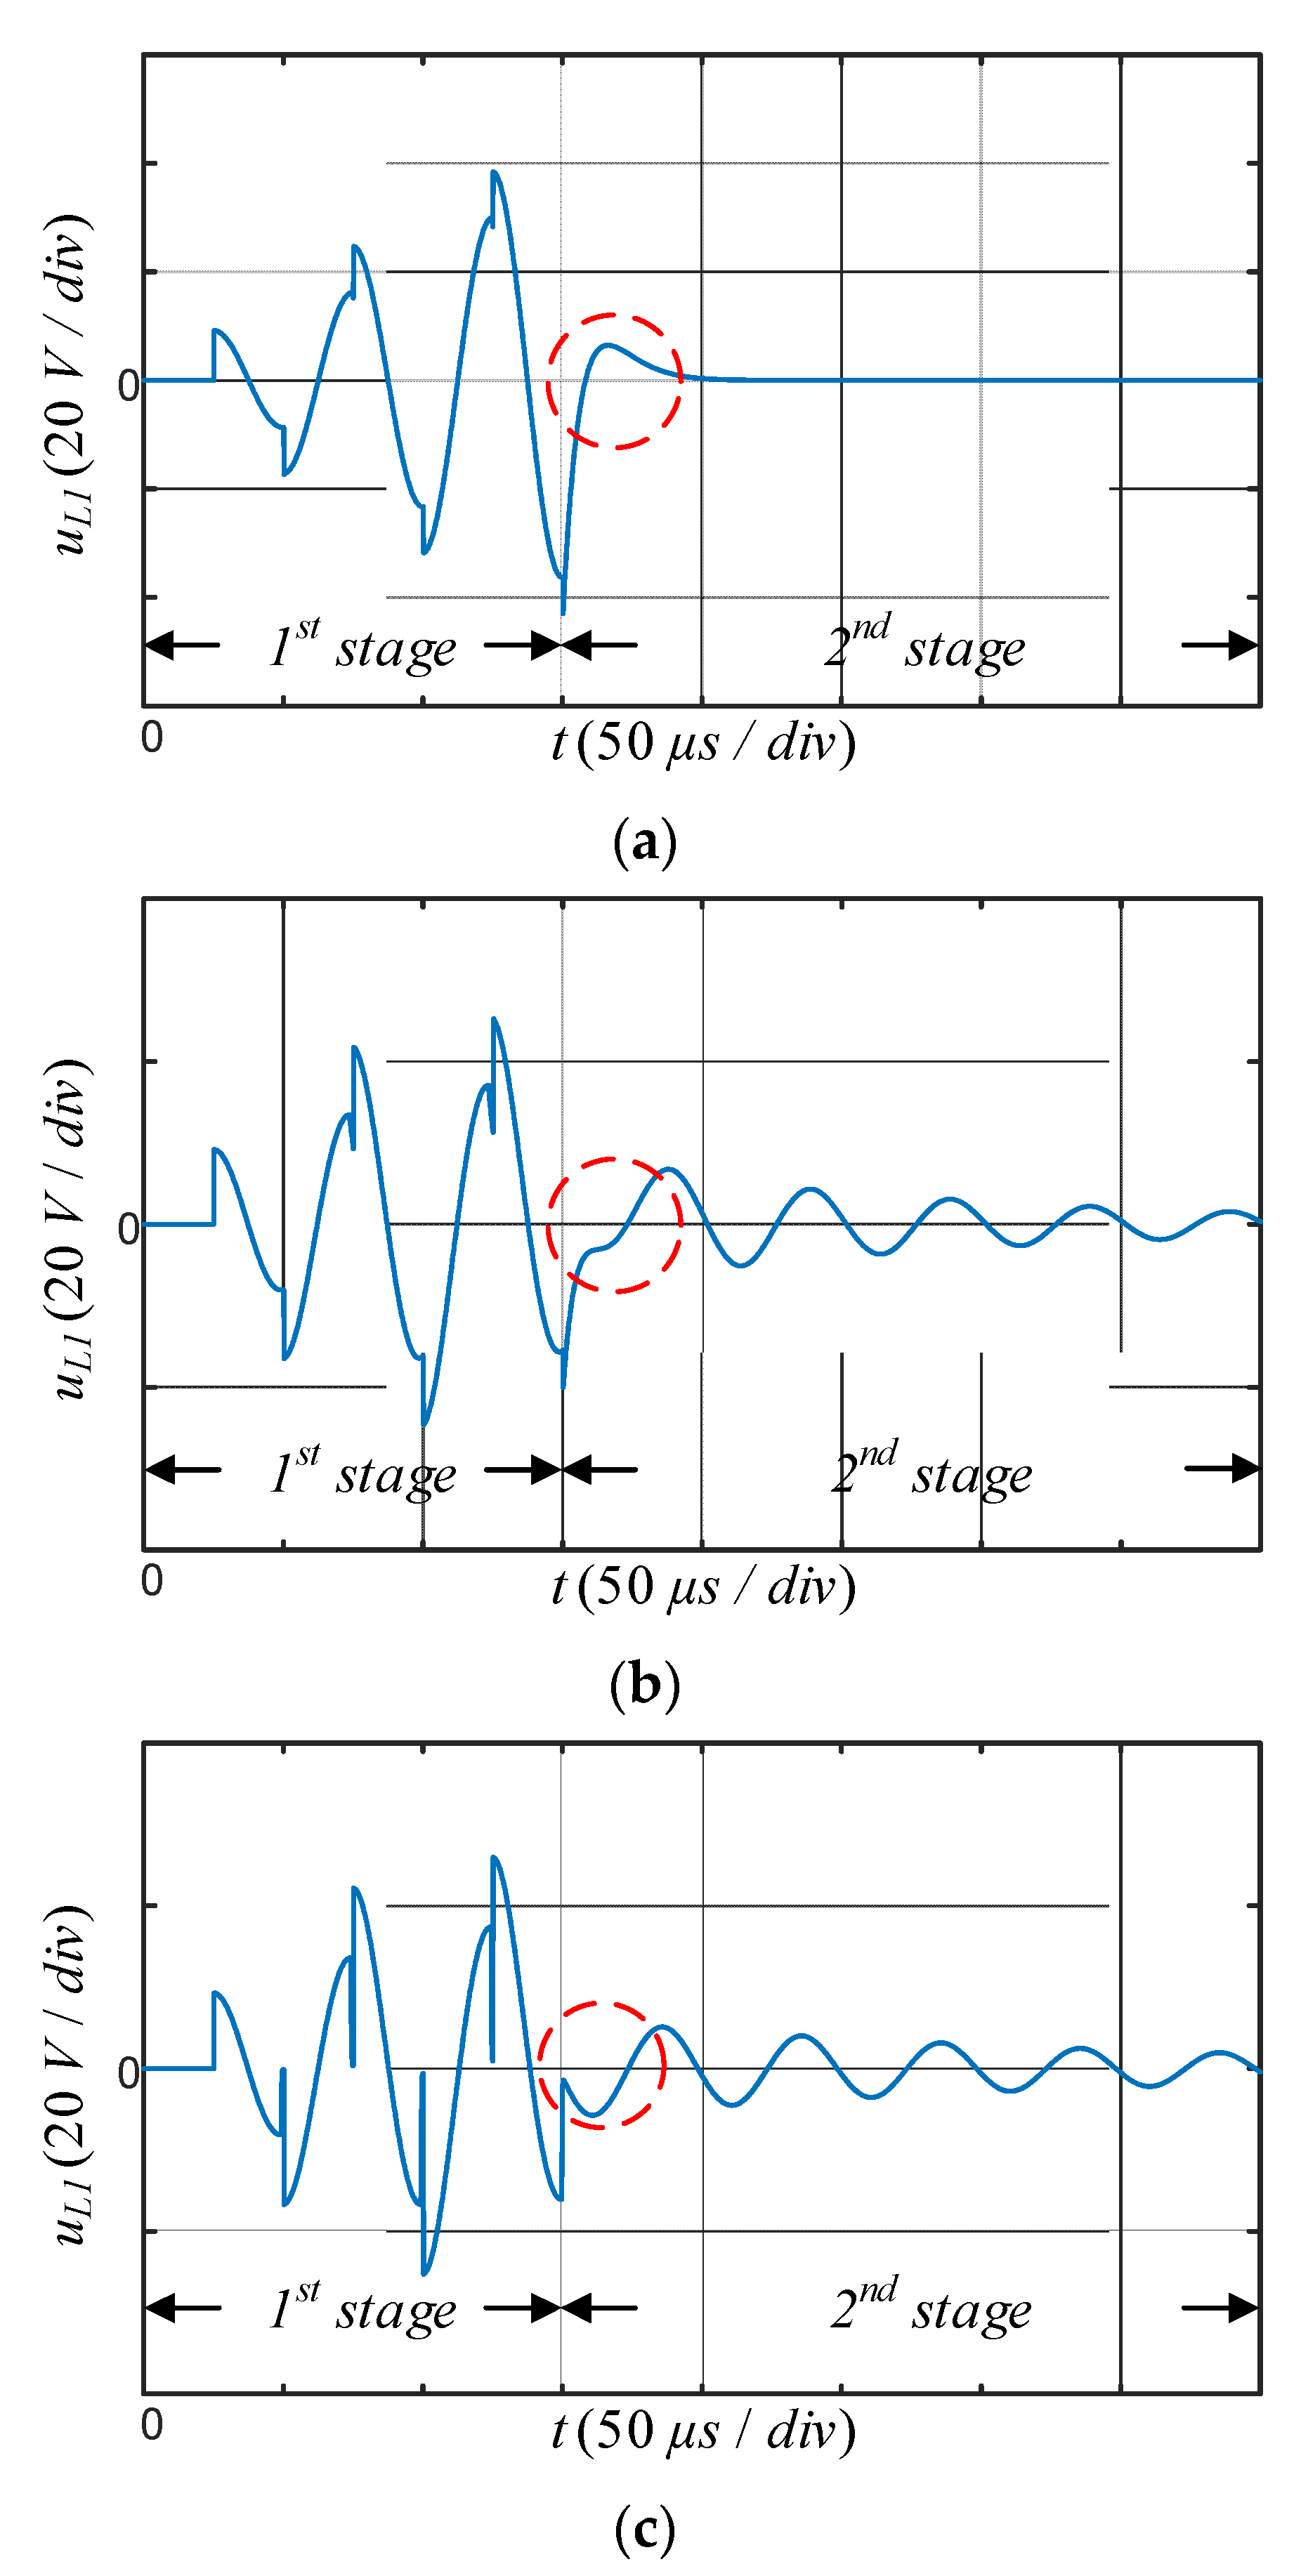
2.3. Error Signal Analysis

In the measured signal uL1, it can be seen from (8) that the primary self-response uL1a is the possible source of error. Due to α2 >> α3, the signal A 12 e α 2 t quickly attenuates to nearly zero and has little effect on the measurement accuracy by discarding the previous part of the waveform data. The main source of error is the signal A 11 e α 1 t . According to (5), when the designed inductance L and compensation capacitance C are determined, the increase in the resistance value Rd is beneficial to suppress the voltage amplitude A11 of the error signal and accelerate the decay rate α2. However, this does not mean that the larger the suppression resistance Rd, the better. When the circuit is working in the 2nd stage, the primary initial current i1 is not exactly equal to 0. So, when the resistance Rd is large, voltage spikes will be generated across the resistance to affect the safety and reliability of the circuit.
Figure 5 shows the waveforms of the primary side inductor voltage uL1 under different suppression resistance Rd and mutual inductance M. Rx = 0.2 Ω. Other parameters of the measuring circuit are listed in Table 1. As shown in Figure 5a, the observed signal uL1 in the 2nd stage is the over-damped oscillation waveform on the primary side when the mutual inductance M = 0. Therefore, when the mutual inductance value is 10 μH, the observed voltage uL1 in the 2nd stage will introduce the interference error of the primary side, as shown in Figure 5b. By increasing the resistance of the suppression resistor, the response error on the primary side will be suppressed, so that the obtained inductor voltage waveform uL1 is a purely under-damped response on the secondary side, as shown in Figure 5c.

3. DFT-Based Estimation of Damped Oscillation Parameters

3.1. DFT-Based Calculation Method

Assuming the observed signal uL1 is a pure under-damped wave, and it is defined as
x ( t ) = A e β t sin ( 2 π f 0 t + φ )
where A is the maximal amplitude, f0 is the resonant frequency in hertz, φ is the phase in radians, and β is the decay rate.
The sampling frequency in the measurement system is fs = 10 MHz, and the sampling sequence is shown in Figure 6, which is expressed as
x [ n ] = A e δ f 0 n f s sin ( 2 π f 0 n f s + φ )
where δ is the logarithmic decrement, δ = β/f0, n = 0, 1, …, N−1, and the number of samples is N = 3000.
The DFT of signal (12) is defined as
V [ k ] = n = 0 N 1 x [ n ] e j ω k n
where ωk = (2π/N)k, k = 0, 1, 2, …, N − 1.
Its angular frequency ωd1/fs lies either between the DFT bins ωK and ωK+1 or ωK and ωK−1, where the DFT bin for ωK has the highest magnitude.
By using the Bertocco-Yoshida algorithm [18], the first-order difference ratio of the DFT spectrum can be described as follows:
R = V [ K 1 ] V [ K ] V [ K ] V [ K + 1 ] .
Then
λ = e j ω K r R r e j 2 π / N R e j 2 π / N
r = e j ω K + e j ω K 1 e j ω K + 1 + e j ω K
and the decay rate β and resonant frequency f0 are expressed as
β = Re { ln ( λ ) } f s f o = Im { ln ( λ ) } f s / 2 π

3.2. Constraint Range of Measurement Object

Although the proposed method is suitable for calculating the decay rate and resonant frequency of the under-damped oscillation waveform, the logarithmic decrement has certain limitations on the calculation accuracy.
The estimation accuracy for test signals with f0 = 20.1 kHz is analyzed under different values of δ. As shown in Figure 7, the calculation accuracy of the decay rate β and resonant frequency f0 decreases as the logarithmic decrement δ increases. Especially when δ > 1, the accuracy of the decay rate β decreases significantly. Therefore, to guarantee that the calculating accuracy of the decay rate β and resonant frequency f0 is higher than 98%, δ needs to be restrained within 1.
Comparing (12) and (6), δ can be expressed as
δ = 2 π α 3 ω d = 2 π R x + R L 2 2 ( L + L x ) 1 ( L + L x )   C [ R x + R L 2 2 ( L + L x ) ] 2 = 2 π 4 ( L + L x ) ( R x + R L 2 ) 2 C 1 = 2 π 4 Q 2 1
where Q is the quality factor of the secondary circuit.
To ensure that the measurement method based on the DFT algorithm has high accuracy, the quality factor of the circuit needs to be large. This provides guidelines for the circuit parameter design.
Due to δ < 1, the measurement range of battery internal resistance can be derived as
R x < 0.314 L + L x C R L 2
According to (19), under the limitation of the accuracy of the DFT algorithm, the measurement range of the battery resistance depends on the designed circuit parameters L and C. This condition is much stronger than the conditions that make the circuit work in the under-damped oscillation state.

3.3. Detection Error of Battery Resistance

Although [18] shows that this method has high accuracy under the interference of Gaussian white noise, whether it has high accuracy for the source of error in this letter requires simulation and experimentation to verify.
Define γ1 as an estimation of the relative magnitude of the error signal, which is expressed as γ1 = A11/A2.
Define γ2 as the ratio of the damping coefficient, which is expressed as
γ 2 = α 1 α 3 2 ( L + L x ) C ( R x + R L 2 ) ( R d + R L 1 )
The size of γ1 and γ2 is the main parameter to measure the effect of the error signal, which is related to the mutual inductance M and the primary side resistor Rd. By selecting the appropriate circuit parameters, γ2 << 1. Rd = 10 kΩ. Thus, the measurement accuracy of the resistance Rx can be analyzed by using M as the variable. The calculated resistance is expressed by Rm, and the measurement error ε is expressed by ε = Rm − Rx. Other parameters of the measuring circuit are listed in Table 1.
As shown in Figure 8, this simulation result shows the changes in measurement error ε, where the mutual inductance values are 2 μH, 5 μH, 10 μH, and 20 μH. When the battery resistance Rx changes from 0 to 1000 mΩ, the measurement error ε approximates a linearly decreasing process and the variation range of the measurement error does not exceed 12 mΩ. The change of the mutual inductance value within a certain range from 5 to 2 μH has a little influence on the measurement results. The simulation result shows that the proposed method is also suitable for measurement occasions with high coupling factors when the mutual inductance value is 20 μH.

4. Experiment Result

In this section, the experimental platform is demonstrated in Figure 9. In the experimental system, the stm32f407 was selected as a controller of the load detection control system, and MOSFETs (Vishay, America) (SI2327DS and SI2324DS) were selected as the switch devices of the half-bridge inverter circuit. The high-speed sampling chip AD9220 was selected to sample the inductor voltage at 10 MHz. The platform can be used to test the resistance of batteries. The ambient temperature during the battery resistance test is 20 °C.
To verify the accuracy and practicality of the proposed method, experiments are conducted to detect the electrical network formed by series connection of standard resistors, inductors, and voltage source. The standard resistors have different resistance values, the inductance value is 1 μH, and the voltage source is 4.2 V. As shown in Figure 10, for standard resistor resistance Rx between 100 and 500 mΩ, the accuracy rate of the load detection is more than 98%.
To examine the effects of the SOC value on the resistance of the Li-ion battery, the measurement is performed at different SOC values, ranging from 100% to 0%, for different C-rates (1/4, 1/2 and 1C) when the frequency of the power converter is at 20 kHz. The line resistance can be measured by shorting the secondary circuit when the battery is not connected. This part can be subtracted from the final measured impedance to obtain the battery resistance. The contact resistance is included in the final measured resistance, but this does not affect the study of the trend of battery resistance as the SOC changes.
It can be observed in Figure 11 that the overall trend of the internal resistance of the battery is to decrease first and then increase as the SOC decreases. Among three different discharge rates, the battery resistance at 1C is the largest. The battery resistance varies little when the SOC decreases from 100% to 20%, and the battery resistance increases significantly when the SOC decreases from 20% to 0%. Therefore, this measurement method is suitable for the detection of deep battery discharge.

5. Conclusions

This paper has presented a magnetic coupling-based resistance measurement method for electrochemical batteries. The proposed measurement circuit enables the primary and secondary sides of the coupling circuit to work in different damped oscillation states so that the secondary side waveform containing the battery impedance information can be directly distinguished by analyzing the waveform characteristics, eliminating the effect of the primary circuit on the measurement result and reducing the requirement for accuracy of mutual inductance.
By utilizing the discrete Fourier transform (DFT)-based algorithm to calculate the damped oscillation parameters, the battery impedance is accurately derived from the calculated attenuation coefficient and damped oscillation frequency. The measurement range of the battery resistance is given according to the calculation accuracy of the DFT algorithm.
It can be seen through simulation that this measurement method has high accuracy. The change of the circuit mutual inductance value within a certain range will not affect the measurement results.
The standard resistance has been measured repeatedly by experiments to prove that the method has high accuracy, and the experiment confirms the change of battery resistance under different SOC values and different C-rates, which can be used to infer the SOC of a Li-ion battery.

Author Contributions

Conceptualization, J.W.; Data curation, Q.W.; Resources, Y.D. and X.H.; Supervision, C.L. and W.L.; Writing—original draft, J.M. All authors have read and agreed to the published version of the manuscript.

Funding

This research received no external funding.

Institutional Review Board Statement

Not applicable.

Informed Consent Statement

Not applicable.

Conflicts of Interest

The authors declare no conflict of interest.

References

  1. Yilmaz, M.; Krein, P.T. Review of Battery Charger Topologies, Charging Power Levels, and Infrastructure for Plug-In Electric and Hybrid Vehicles. IEEE Trans. Power Electron. 2013, 5, 2151–2169. [Google Scholar] [CrossRef]
  2. Hsu, R.C.; Liu, C.; Chan, D. A Reinforcement-Learning-Based Assisted Power Management with QoR Provisioning for Human–Electric Hybrid Bicycle. IEEE Trans. Ind. Electron. 2012, 8, 3350–3359. [Google Scholar] [CrossRef]
  3. Brush, L.C. Portable devices emerging power solutions. EDN Power Supplement, November 2003; 23–26. [Google Scholar]
  4. Velasco de la Fuente, D.; Trujillo Rodríguez, C.L.; Garcerá, G.; Figueres, E.; Ortega Gonzalez, R. Photovoltaic Power System with Battery Backup with Grid-Connection and Islanded Operation Capabilities. IEEE Trans. Ind. Electron. 2013, 4, 1571–1581. [Google Scholar] [CrossRef]
  5. Teleke, S.; Baran, M.E.; Huang, A.Q.; Bhattacharya, S.; Anderson, L. Control Strategies for Battery Energy Storage for Wind Farm Dispatching. IEEE Trans. Energy Convers. 2009, 3, 725–732. [Google Scholar] [CrossRef]
  6. Chen, M.; Rincon-Mora, G.A. Accurate electrical battery model capable of predicting runtime and I–V performance. IEEE Trans. Energy Convers. 2006, 2, 504–511. [Google Scholar] [CrossRef]
  7. Einhorn, M.; Conte, F.V.; Kral, C.; Fleig, J. Comparison, Selection, and Parameterization of Electrical Battery Models for Automotive Applications. IEEE Trans. Power Electron. 2013, 3, 1429–1437. [Google Scholar] [CrossRef]
  8. Li, S.; Wang, B.; Peng, H.; Hu, X. An electrochemistry based impedance model for lithium ion batteries. J. Power Sources 2014, 258, 9–18. [Google Scholar] [CrossRef]
  9. Lee, Y.; Park, S.; Han, S. Online Embedded Impedance Measurement Using High-Power Battery Charger. IEEE Trans. Ind. Appl. 2015, 1, 498–508. [Google Scholar] [CrossRef]
  10. Howey, D.A.; Mitcheson, P.D.; Yufit, V.; Offer, G.J.; Brandon, N.P. Online Measurement of Battery Impedance Using Motor Controller Excitation. IEEE Trans. Veh. Technol. 2014, 6, 2557–2566. [Google Scholar] [CrossRef]
  11. Buller, S.; Thele, M.; De Doncker, R.W.A.A.; Karden, E. Impedance-based simulation models of supercapacitors and Li-ion batteries for power electronic applications. IEEE Trans. Ind. Appl. 2005, 3, 742–747. [Google Scholar] [CrossRef]
  12. Huang, W.; Abu Qahouq, J.A. An Online Battery Impedance Measurement Method Using DC–DC Power Converter Control. IEEE Trans. Ind. Electron. 2014, 11, 5987–5995. [Google Scholar] [CrossRef]
  13. Carkhuff, B.G.; Demirev, P.A.; Srinivasan, R. Impedance-Based Battery Management System for Safety Monitoring of Lithium-Ion Batteries. IEEE Trans. Ind. Electron. 2018, 8, 6497–6504. [Google Scholar] [CrossRef]
  14. Dai, X.; Sun, Y.; Tang, C.; Wang, Z.; Su, Y.; Li, Y. Dynamic parameters identification method for inductively coupled power transfer system. In Proceedings of the IEEE International Conference on Sustainable Energy Technologies, Kandy, Sri Lanka, 6–9 December 2010; pp. 1–5. [Google Scholar]
  15. Hu, S.; Liang, Z.; Wang, Y.; Zhou, J.; He, X. Principle and Application of the Contactless Load Detection Based on the Amplitude Decay Rate in a Transient Process. IEEE Trans. Power Electron. 2017, 11, 8936–8944. [Google Scholar] [CrossRef]
  16. Wang, Z.; Li, Y.; Sun, Y.; Tang, C.; Lv, X. Load Detection Model of Voltage-Fed Inductive Power Transfer System. IEEE Trans. Power Electron. 2013, 11, 5233–5243. [Google Scholar] [CrossRef]
  17. Su, Y.; Zhang, H.; Wang, Z.; Hu, A.P.; Chen, L.; Sun, Y. Steady-state load identification method of inductive power transfer system based on switching capacitors. IEEE Trans. Power Electron. 2015, 11, 6349–6355. [Google Scholar] [CrossRef]
  18. Duda, K.; Magalas, L.B.; Majewski, M.; Zielinski, T.P. DFT-based Estimation of Damped Oscillation Parameters in Low-Frequency Mechanical Spectroscopy. IEEE Trans. Instrum. Meas. 2011, 11, 3608–3618. [Google Scholar] [CrossRef]
Figure 1. Equivalent circuit of electrical battery model: (a) Full battery impedance model; (b) Simplified battery impedance model.
Energies 14 07490 g001
Figure 2. Measurement system.
Energies 14 07490 g002
Figure 3. System equivalent circuit in different operation stages: (a) Energy injection stage; (b) Detection stage.
Energies 14 07490 g003
Figure 4. Composition of response uL1.
Energies 14 07490 g004
Figure 5. Simulation waveforms of primary side inductor voltage uL1 under different suppression resistance Rd and the mutual inductance M. (a) Rd = 15 Ω and M = 0. (b) Rd = 15 Ω and M = 10 μH. (c) Rd = 1000 Ω and M = 10 μH.
Energies 14 07490 g005
Figure 6. Under-damped waveform.
Energies 14 07490 g006
Figure 7. Calculation accuracy of decay rate β and resonant frequency f0.
Energies 14 07490 g007
Figure 8. Detection error curve.
Energies 14 07490 g008
Figure 9. Experimental platform.
Energies 14 07490 g009
Figure 10. Detection accuracy and error.
Energies 14 07490 g010
Figure 11. Battery resistance at various SOC values and C-rates.
Energies 14 07490 g011
Table 1. Simulation parameters.
Parameter NameValue
L1, L2/μH42
C1, C2/μF1.5
RL1, RL2/mΩ50
Lx/μH0.5
Battery voltage E/V4.2
Peak input voltage Udc/V10
Switching frequency fsw/kHz20
Sampling frequency fs/MHz10
Publisher’s Note: MDPI stays neutral with regard to jurisdictional claims in published maps and institutional affiliations.

