Article

Examining the Impacts of Economic, Social, and Environmental Factors on the Relationship between Urbanization and CO2 Emissions

1
School of Economics and Management, Wuhan Sports University, Wuhan 430070, China
2
School of Safety Science and Emergency Management, Wuhan University of Technology, Wuhan 430070, China
3
School of Mechatronics and Energy Engineering, NingboTech University, Ningbo 315100, China
*
Author to whom correspondence should be addressed.
Energies 2021, 14(21), 7430; https://doi.org/10.3390/en14217430
Submission received: 1 October 2021 / Revised: 2 November 2021 / Accepted: 5 November 2021 / Published: 8 November 2021
(This article belongs to the Section B3: Carbon Emission and Utilization)

Abstract

:
This study examines the relationship between urbanization, economic growth, industrial transformation, technological change, public services, demographical change, urban and natural environmental changes, and carbon emissions using a dataset of 182 prefecture-level cities in China between 2001 and 2010. Specifically, this paper differs from previous studies in two aspects. First, the extant literature has focused on how economic processes accompanying rapid urbanization affect carbon emissions in urban areas but gives little attention to the other dimensions of urbanization, including social and environmental changes, which may have important effects on carbon emissions. We assessed the effects of 17 key processes accompanying urbanization in a full range of economic, social, and environmental dimensions on carbon dioxide emissions in urban areas. The results showed that social processes accompanied with rapid urbanization had distinct effects on carbon emissions, compared to economic and environmental processes. Specifically, improvement in public services, indicated by education and cultural developments, reduces the increase in carbon emissions during urbanization, while economic growth and urban construction reinforces the growth in carbon emissions. Second, we examined the impact of various urbanization processes on carbon dioxide emissions using a unique dataset of 182 prefecture-level cities that covers a wide span of regions in China. The results of our analyses on the city level have important implications for the formulation of comprehensive policies aimed at reducing carbon dioxide emission in urban areas, focusing on different urbanization processes in economic, social, and environmental phases.

1. Introduction

The main driver of climate change is increased greenhouse gas emissions. The Paris Agreement (COP21) calls for ambitious efforts to be made by all countries to reach a global peak of greenhouse gas emissions as soon as possible [1,2]. China aims to offer a strong national contribution to the goal of low-carbon development. The outline of the National Economic and Social Development Plan for 2021–2025 calls for new progress to be made in the construction of an ecological civilization in China, including reducing the energy consumption per unit of GDP by 13.5% and carbon dioxide emissions per unit of GDP by 18%, compared with the level in 2021. Simultaneously, China has undergone fast-paced urbanization with a sharp increase in the urbanization rate, from 17.9% in 1978 to 59.94% in 2019. The urbanization process in China is characterized by significant regional heterogeneity; the urbanization rate of East, Central, and West China in 2019 is 70.69%, 56.85%, and 52.27%, respectively. Rapid urbanization has caused an increasingly intensive population shift from rural to urban areas, leading to a strong tension between increasing energy demand and the government’s emissions reduction goal [3,4]. Thus, it is of great importance to gain a better understanding of the nexus between carbon dioxide emissions and urbanization [5].
A large body of research motivated by the need for emission reduction has been carried out to explore the relationship between urbanization and carbon dioxide emissions [6]. Recent studies have verified the environmental Kuznets curve (EKC) hypothesis in this context, according to which carbon dioxide emission increases with expansion of urban land at low levels of urbanization but decreases with further expansion of urban land at high levels of urbanization [7,8,9,10,11]. However, two important gaps remain underexplored. First, our understanding of how urbanization processes influence carbon dioxide emissions in urban areas is still incomplete. In turn, the majority of extant literature has focused on the impact of economic processes accompanying rapid urbanization on carbon dioxide emissions in urban areas [12,13]. However, only a few studies have paid attention to the other urbanization processes, such as developments of education and healthcare services, population concentration, and changes in urban and natural environments, which may have important effects on carbon emissions [14,15,16]. It is increasingly highlighted that there are complex mechanisms by which urbanization has both positive and negative impact on energy consumption and carbon dioxide emissions [17,18,19,20,21,22]. Nevertheless, there is a lack of comprehensive research on the specific effects of urbanization processes in economic, social, and environmental aspects on carbon dioxide emissions. Second, few studies have examined the relationship between urbanization and carbon dioxide emissions in the context of a wide range of cities in China. Most previous studies investigated the impact of rapid urbanization on carbon emissions in China using panel data on different Chinese provinces [16,21,23,24], which prevented researchers from exploring the specific effects of urbanization on carbon dioxide emissions in the urban areas. Recent research has begun to focus on individual cities or urban agglomeration, for instance, Yangtze River Delta [7,18], Beijing–Tianjin–Hebei agglomeration [19], and Pearl River Delta [25]. Despite this, we still need to examine the impact of multiple urbanization processes on carbon dioxide emissions in the context of various cities in China in order to gain a full image of how urbanization influences carbon dioxide emissions in urban areas in China through alternative ways.
This study aims to make contributions by addressing these two research gaps. Specifically, the novelty of this research is demonstrated in two aspects. First, the literature reports an EKC relationship between urbanization and carbon dioxide emission. We aim to extend this discussion by exploring the specific factors underlying urbanization that can lead to the EKC relationship. Specifically, in addition to economic processes accompanying rapid urbanization, such as economic growth and technological change, this study comprehensively focuses on various social and environmental processes induced by urbanization, including education, healthcare, urban construction, and natural reserves in the analysis of the increase in carbon dioxide emissions in urban areas. In sum, we tested the impact of the interaction between urbanization rate and 17 economic, social, and environmental processes on carbon dioxide emissions. Second, this study adopted a sample of 182 Chinese cities over a period from 2001 to 2010 to test the relationship between urbanization and carbon dioxide emissions in urban areas in China. Overall, this study aims to develop a full image of the mechanisms by which urbanization influences carbon dioxide emissions by testing the effects of the interaction between urbanization rate and a wide range of economic, social, and environmental processes on carbon dioxide emissions using a unique dataset of 182 Chinese cities between 2001 and 2010, as shown in Figure 1. The results of this study have importance for the policies and measures aimed at reducing carbon dioxide emissions in the period of rapid expansion of urban areas for the realization of low-carbon development.

2. Literature Review

A longstanding theme of research in regional environmental management has been the relationship between urbanization and regional carbon dioxide emissions. However, significantly contrasting results are found in the existing literature. It was indicated that the links between urbanization and carbon dioxide emissions may vary in different areas across specific times [26,27]. First of all, it was argued that urbanization affects carbon dioxide emissions in distinct ways within different regions. Specifically, many cross-country studies reported disparities between the effects of urbanization on national carbon dioxide emissions [28,29,30,31]. For example, Al-Mulali et al. found that, for most countries, urbanization has a positive relationship with carbon dioxide emissions, while in other countries, the results are mixed [29]. Jorgensen et al. stated that urbanization has various effects on national carbon emissions throughout different world regions [30]. Furthermore, some researchers argued that the urbanization–emission relationship may depend on a country’s environmental management policies [31] or the presence of democracy [32]. Moreover, country-specific research revealed mixed results for how urbanization affects the carbon dioxide emissions of a national area [32,33,34,35,36]. For instance, research focusing on African countries found a negative association between urbanization and carbon dioxide emissions [8,32]. Additionally, similar results were also discovered in Saudi Arabia [34], and the BRICS economies [37,38], whereas there is no evidence pointing toward a possible association between urbanization and carbon dioxide emissions in newly industrialized countries [39] and emerging economies [40]. On the other hand, research showed that the effects of urbanization on carbon dioxide exhibit regional disparities within countries [7,41,42,43,44]. For instance, Wang et al. discovered that the relationship between urbanization and carbon dioxide emissions varied between Chinese provinces as a result of the characteristics of their economies [45]. Liu et al. showed that the impact of urbanization on carbon dioxide emissions in western China was greater than that in eastern and central China [43].
Recently, an increasing body of literature argued that the urbanization–emission relationship is far from monotonic, where the nonlinear relationship between urbanization and carbon dioxide emissions was explored in various countries and regions [4,28,33,35,36,46,47]. Specifically, Al-Mulali et al. reported that the long-term relationship between urbanization, energy consumption, and carbon dioxide emissions varied across the MENA countries in different development stages [33]. Then, zooming in on the Yangtze River Delta, where a Chinese megalopolis dramatically developed during the reform and opening-up period, a recent study discovered that carbon dioxide emissions decreased as the urban area was expanded during the early stage of urbanization, then increased when the urbanization rate reached a certain high level [7]. Based on this, some literature began to explore the driving forces that lead to an EKC relationship between urbanization and carbon dioxide emissions [8,9,10].
First of all, a body of literature has focused on how urbanization affects carbon dioxide emissions in regions with different levels of GDP or income per capita [13,14,15,34,35,38]. Then, based on these findings, researchers further investigated the processes underlying a region’s economic development that caused different relationships between urbanization and carbon dioxide emissions to occur. Some studies emphasized industrial structures [48,49,50,51] and the structure of energy consumption [52]. Third, a stream of literature analyzed the effects of technological progress, research and development (R&D), and innovation on the relationship between urbanization and carbon dioxide emissions [6,51]. Although there is a large body of literature that has explored the effect of urbanization on carbon dioxide emissions in recent years, the existing research landscape on this topic remains underexplored. For instance, some research suggests that social factors, such as income inequality, population structure, and population size, may affect the relationship between urbanization and carbon dioxide emissions [53]. Additionally, the land-use transition of a region may have distinct implications for the relationship between urbanization and carbon dioxide emissions [28,54,55].
Thus, it is still important to gain a complete understanding of the driving forces for an EKC relationship between urbanization and carbon dioxide emissions, which refer to the factors that mitigate the increase in carbon dioxide emissions as urban land expands, or even shift the effect of urbanization on carbon dioxide emissions from positive to negative. Thus, it is important to take a systematic view to reflect on and integrate existing knowledge from the research on urbanization, energy use, and carbon dioxide emissions. This study intends to fill in the research gap by building an integrated model that synthesizes the economic, technological, social, and environmental factors for the examination of the driving forces of an EKC relationship between urbanization and carbon dioxide emissions.

3. Methodology

3.1. Data and Sample

This study used a sample of 182 cities in China between 2001 to 2010 to explore how urbanization processes affect carbon dioxide emissions under different social, economic, and environmental conditions. The sample cities are located in the 30 provinces in mainland China, except Tibet. The average urbanization rate of the sample cities is 51%, with a minimum value of 23% and a maximum value of 89% in 2010. The population size of the sample cities ranges from 0.116 million to 30.17 million in 2010. The span of the locations of the sample cities is shown in Figure 2.
In line with this research goal, this study first collected data on population urbanization, economic development, households, and R&D activities from the Chinese Statistic Yearbook, China City Statistical Yearbook, China Urban Construction Statistical Yearbook, and China Statistics Yearbook on High Technology Industry in the period from 2001 to 2010.
Second, this study constructed carbon emissions inventories for China’s cities in the research period between the years 2001 and 2010 using the data on energy consumption in the sample cities for more than 20 fuel types, including raw coal, cleaned coal, other washed coal, briquettes, coke, coke oven gas, other gas, other coking products, crude oil, gasoline, kerosene, diesel oil, fuel oil, LPG, refinery gas, other petroleum products, and natural gas. The data on energy use were collected from the annual China Statistic Yearbook, China City Statistical Yearbook, China Urban Construction Statistical Yearbook, and China Emission Accounts and Datasets (CEADs). The carbon dioxide emissions inventory of each city was compiled based on the latest energy data revision (2015) by the Chinese Statistics Bureau in accordance with the IPCC Sectoral Emission Accounting Approach in the format of 45 production sectors and two residential sectors [3].

3.2. The Integrated Models of Urbanization–CO2 Emissions Relationship

To examine the effect of urbanization on carbon dioxide emissions in different development situations, this study proposes integrated models that extend the STIRPAT model by including a range of variables for economic development, social transformation, and environmental change and the interaction terms among them. Drawing from the existing literature, the new models capture the key urbanization processes that can affect how urbanization influences carbon dioxide emissions. The key variables of the integrated urbanization–emissions models are shown in Table 1.
In the first cluster, namely, economic processes, we considered factors related to economic growth, industrial transformation, and technological change, which are accompanied with a period of urbanization.
  • Factors related to economic growth: It was highlighted that economic growth, indicated by GDP per capita and income, has important implications for the relationship between urbanization and carbon dioxide emissions [11,13,14,15,34,35,38]. Moreover, research has reported that foreign direct investment (FDI) can affect the carbon dioxide emissions in host countries by driving economic development in those areas, which causes environmental degradation [56]. For instance, FDI can significantly enlarge the volume of industrial production in the host country, leading to more energy use and carbon dioxide emission. However, it is also noted that FDI for environment-friendly businesses occurs through advanced human capital and sustainable infrastructural developments. Thus, this model included three variables, namely, GDP per capita, income, and FDI to indicate the economic growth of an area.
  • Factors associated with industrial transformation: It was suggested that adjustments in industrial structure provide great opportunities for emissions reductions during the urbanization process, as the energy use in the primary industry is more intense than that in the tertiary industry [49,52]. In this model, industrial transformation was included to reflect economic development.
  • Factors regarding technological change: Technology is one of the main drivers of economic development. It leads to the optimization of the industrial structure and introduces new products or processes that are beneficial for environmental protection and emissions reductions, for example, renewable energy use [51], higher labor productivity [57], energy-saving buildings, and central heating systems that can improve the energy-use efficiency in urban areas [58]. The extent of technological change is indicated by both the technological input (measured by R&D spending) and technological output (measured by the number of patents) in this model.
The second cluster, namely, social processes, captured the factors associated with public services, cultural development, and demographic transition, induced by a period of urbanization.
  • Factors concerning public services: Improvement in public services may not have direct effects on carbon dioxide emissions, but they are closely related to the transformation of the energy consumption patterns of urban residents. For instance, a higher awareness of the negative effect of carbon emissions on residents’ health will prompt the local government to undertake more emissions reduction measures [59]. In this model, the factors education and healthcare were adopted to indicate the social wellbeing of an area.
  • Factors associated with cultural development: Urban dwellers may change their energy consumption pattern, as they will likely have a higher awareness of the importance of energy-saving measures and thus favor green products [60]. Therefore, the variable culture was included in the model.
  • Factors related to demographic transition: It was found that urbanization significantly drives carbon dioxide emissions when the effects of aging and shrinking household sizes increase residential energy consumption [53]. This model included the factors of family size and senior citizens to track the demographic transition of a region.
The third cluster, namely, environmental processes, was associated with the factors related to urban construction and changes in natural environment, induced by a period of urbanization.
  • Factors related to urban construction: The expansion of urban areas is accompanied by the increasing construction of civic buildings and public infrastructure, which generates more carbon emissions when a large amount of infrastructure and residential buildings are under construction [58]. Later, the shift in transport behavior as a result of building public infrastructure provides opportunities for carbon emissions reductions during the urbanization process in the long term [28,54,55,61,62]. Therefore, this model considered the factors of infrastructure and transportation, which may influence carbon dioxide emissions in the urbanization process.
  • Factor concerning natural environment: Research on greenhouse gases suggests that the quality of the ecological environment in urban areas, such as urban land, may have a significant impact on carbon dioxide emissions [63,64,65,66,67]. In addition, the area of natural reserves can reduce carbon dioxide emissions in the expansion process [64]. Thus, this model includes the factor natural reserves, which indicates the percentage of natural reserves in a city.
  • Factors regarding disposal of industrial wastes: Disposal of industrial wastes may have specific implications for the relationship between urbanization and carbon dioxide emissions. For example, some researchers found that the disposal of multiple forms of solid waste also results in increasing carbon dioxide emissions [63]. Overall, waste treatment is indicated by the generation of wastewater, waste gas, and solid wastes within a city.
The integrated model of urbanization–CO2 emissions relationship can be given as follows:
l n ( C O 2   e m i s s i o n s i t )        = β 1 + α 1 l n ( U r b a n i z a t i o n   r a t e i t ) + β 2 l n ( G D P   p e r   c a p i t a i t )        + β 3 l n ( Industrial   transformatio n i t ) + β 4 l n ( F D I i t ) + β 5 l n ( Incom e i t )        + β 6 l n ( R & D   spendin g i t ) + β 7 l n ( Patent s i t ) + β 8 l n ( Educatio n i t ) + β 9 l n ( Cultur e i t )        + β 10 l n ( Healthcar e i t ) + β 11 l n ( Family   siz e i t ) + β 12 l n ( Senior   citizen s i t )        + β 13 l n ( Infrastructur e i t ) + β 14 l n ( Transportatio n i t )        + β 15 l n ( Environmental   protectio n i t ) + β 16 l n ( Wastewate r i t ) + β 17 l n ( Waste   ga s i t )        + β 18 l n ( Solid   waste s i t ) + ε it
where l n ( C O 2   e m i s s i o n s i t ) denotes the logarithm of carbon dioxide emission inventory generated by the fuel combustion of city i in year t.
Building on the basic model, our empirical model of EKC can be given by
l n ( C O 2   e m i s s i o n s i t )        = β 1 + α 1 l n ( U r b a n i z a t i o n   r a t e i t ) + α 2 ( l n ( U r b a n i z a t i o n   r a t e i t ) ) 2        + β 2 l n ( G D P   p e r   c a p i t a i t ) + β 3 l n ( Industrial   transformatio n i t ) + β 4 l n ( F D I i t )        + β 5 l n ( Incom e i t ) + β 6 l n ( R & D   spendin g i t ) + β 7 l n ( Patent s i t ) + β 8 l n ( Educatio n i t )        + β 9 l n ( Cultur e i t ) + β 10 l n ( Healthcar e i t ) + β 11 l n ( Family   siz e i t ) + β 12 l n ( Senior   citizen s i t )        + β 13 l n ( Infrastructur e i t ) + β 14 l n ( Transportatio n i t )        + β 15 l n ( Environmental   protectio n i t ) + β 16 l n ( Wastewate r i t ) + β 17 l n ( Waste   ga s i t )        + β 18 l n ( Solid   waste s i t ) + ε it
where l n ( C O 2   e m i s s i o n s i t ) denotes the logarithm of carbon dioxide emission inventory generated by the fuel combustion of city i in year t.
The advantage of this integrated model of urbanization–CO2 emissions relationship is that it allowed us to examine the effects of the interaction between urbanization rate and a broad range of economic, social, and environmental processes on carbon dioxide emissions. Specifically, to explore the moderating effects of economic processes on the relationship between urbanization rate and carbon dioxide emissions, the following model was adopted:
l n ( C O 2   e m i s s i o n s i t )        = β 1 + δ 1 l n ( U r b a n i z a t i o n   r a t e i t ) × l n ( G D P   p e r   c a p i t a i t ) + δ 2 l n ( U r b a n i z a t i o n   r a t e i t )        × l n ( Industrial   transformatio n i t ) + δ 3 l n ( U r b a n i z a t i o n   r a t e i t ) × l n ( F D I i t )        + δ 4 l n ( U r b a n i z a t i o n   r a t e i t ) × l n ( Incom e i t ) + δ 5 l n ( U r b a n i z a t i o n   r a t e i t )        × l n ( R & D   spendin g i t ) + δ 6 l n ( U r b a n i z a t i o n   r a t e i t ) × l n ( Patent s i t )        + α 1 l n ( U r b a n i z a t i o n   r a t e i t ) + β 2 l n ( G D P   p e r   c a p i t a i t )        + β 3 l n ( Industrial   transformatio n i t ) + β 4 l n ( F D I i t ) + β 5 l n ( Incom e i t )        + β 6 l n ( R & D   spendin g i t ) + β 7 l n ( Patent s i t ) + β 8 l n ( Educatio n i t ) + β 9 l n ( Cultur e i t )        + β 10 l n ( Healthcar e i t ) + β 11 l n ( Family   siz e i t ) + β 12 l n ( Senior   citizen s i t )        + β 13 l n ( Infrastructur e i t ) + β 14 l n ( Transportatio n i t )        + β 15 l n ( Environmental   protectio n i t ) + β 16 l n ( Wastewate r i t ) + β 17 l n ( Waste   ga s i t )        + β 18 l n ( Solid   waste s i t ) + ε it
where l n ( C O 2   e m i s s i o n s i t ) denotes the logarithm of carbon dioxide emission inventory generated by the fuel combustion of city i in year t.
Then, in order to explore the moderating effects of social processes on this relationship, the following model was adopted:
l n ( C O 2   e m i s s i o n s i t )        = β 1 + δ 1 l n ( U r b a n i z a t i o n   r a t e i t ) × l n ( E d u c a t i o n i t ) + δ 2 l n ( U r b a n i z a t i o n   r a t e i t )        × l n ( Cultur e i t ) + δ 3 l n ( U r b a n i z a t i o n   r a t e i t ) × l n ( Healthcar e i t )        + δ 4 l n ( U r b a n i z a t i o n   r a t e i t ) × l n ( Family   siz e i t ) + δ 5 l n ( U r b a n i z a t i o n   r a t e i t )        × l n ( Senior   citizen s i t ) + α 1 l n ( U r b a n i z a t i o n   r a t e i t ) + β 2 l n ( G D P   p e r   c a p i t a i t )        + β 3 l n ( Industrial   transformatio n i t ) + β 4 l n ( F D I i t ) + β 5 l n ( Incom e i t )        + β 6 l n ( R & D   spendin g i t ) + β 7 l n ( Patent s i t ) + β 8 l n ( Educatio n i t ) + β 9 l n ( Cultur e i t )        + β 10 l n ( Healthcar e i t ) + β 11 l n ( Family   siz e i t ) + β 12 l n ( Senior   citizen s i t )        + β 13 l n ( Infrastructur e i t ) + β 14 l n ( Transportatio n i t )        + β 15 l n ( Environmental   protectio n i t ) + β 16 l n ( Wastewate r i t ) + β 17 l n ( Waste   ga s i t )        + β 18 l n ( Solid   waste s i t ) + ε it
where l n ( C O 2   e m i s s i o n s i t ) denotes the logarithm of carbon dioxide emission inventory generated by the fuel combustion of city i in year t.
Finally, aimed at exploring the moderating effects of environmental processes on this relationship, the following model was adopted:
l n ( C O 2   e m i s s i o n s i t )        = β 1 + δ 1 l n ( U r b a n i z a t i o n   r a t e i t ) × l n ( frastructur e i t ) + δ 2 l n ( U r b a n i z a t i o n   r a t e i t )        × l n ( Transformatio n i t ) + δ 3 l n ( U r b a n i z a t i o n   r a t e i t ) × l n ( Environmental   Protectio n i t )        + δ 4 l n ( U r b a n i z a t i o n   r a t e i t ) × l n ( Wastewate r i t ) + δ 5 l n ( U r b a n i z a t i o n   r a t e i t )        × l n ( Waste   ga s i t ) + δ 6 l n ( U r b a n i z a t i o n   r a t e i t ) × l n ( Solid   waste s i t )        + α 1 l n ( U r b a n i z a t i o n   r a t e i t ) + β 2 l n ( G D P   p e r   c a p i t a i t )        + β 3 l n ( Industrial   transformatio n i t ) + β 4 l n ( F D I i t ) + β 5 l n ( Incom e i t )        + β 6 l n ( R & D   spendin g i t ) + β 7 l n ( Patent s i t ) + β 8 l n ( Educatio n i t ) + β 9 l n ( Cultur e i t )        + β 10 l n ( Healthcar e i t ) + β 11 l n ( Family   siz e i t ) + β 12 l n ( Senior   citizen s i t )        + β 13 l n ( Infrastructur e i t ) + β 14 l n ( Transportatio n i t )        + β 15 l n ( Environmental   protectio n i t ) + β 16 l n ( Wastewate r i t ) + β 17 l n ( Waste   ga s i t )        + β 18 l n ( Solid   waste s i t ) + ε it
where l n ( C O 2   e m i s s i o n s i t ) denotes the logarithm of carbon dioxide emission inventory generated by the fuel combustion of city i in year t.
In summary, this study proposes integrated models of the urbanization–CO2 emissions relationship by synthesizing a full range of economic, social, and environmental processes regarding urbanization into the STIRPAT model. Using this model, we could design a series of empirical tests to examine by which mechanisms the increase in urbanization rate will drive or reduce carbon dioxide emissions in urban areas.

4. Results

Table 2 shows the descriptive statistics and correlations for all of the variables. As can be seen in the table, CO2 emissions were positively correlated with the variable urbanization, together with the variables GDP per capita and income, which were associated with economic development. Moreover, CO2 emissions were also positively related to the variables infrastructure and transportation, which were associated with the urban environment. In contrast, CO2 emissions were negatively linked with the variables associated with technological change, including R&D spending and patents. In addition, CO2 emissions were positively associated with natural reserves and negatively linked with wastewater, waste gas, and solid wastes. More interestingly, the relationships between CO2 emissions and the variables associated with social transformation were mixed. Specifically, CO2 emissions were negatively related to education, culture, and family size but positively related to healthcare and senior citizens. The results of the correlation analysis provided us with preliminary evidence for the multiple mechanisms by which urbanization processes influenced carbon dioxide emissions. In order to check if this study is confronted with both multicollinearity and confounding variable problems, we calculated the variation inflation factor (VIF) for the set of variables, which indicates a VIF of 2.79 (see Table 3).
Next, we used a series of regression analyses to investigate the effects of urbanization rate on carbon dioxide emissions under different economic, technological, social, and environmental conditions. As shown in Table 4, the result of the Hausman test in each of the regression models confirmed that the correlation between the fixed unobservable effect and explanatory variables should be considered. Therefore, this research applied a fixed-effect estimator to analyze the relationship between urbanization and carbon dioxide emissions. In addition, robust estimators of variance were used to correct misspecifications due to heteroskedasticity and autocorrelation in all the models.
In line with the purpose of this study, we first examined how urbanization influenced carbon dioxide emissions based on Equation (2). The results of the regression analysis are shown in Table 4. The coefficient of urbanization rate was positive at the 5% significance level in model 1, taking the value of 0.055. This indicated that a 1% increase in the rate of urbanization increased the carbon dioxide emissions by 0.055% after a year. In addition, the coefficient for the quadratic term of urbanization rate is −0.038 at the 1% significance level in model 1. This suggests that when the urbanization rate of a region arrives at a certain threshold, a 1% increase in urbanization rate would decrease energy intensity by 0.038% and decrease carbon dioxide emissions by 0.038%. Consistent with the findings of previous research, these results provide evidence for an inverted U-shaped relationship between urbanization and carbon dioxide emissions. It shows that as a region’s urban area expands, total energy consumption of the region may increase significantly, leading to the growth of carbon dioxide emissions. However, when the expansion exceeds a certain level, it may reinforce the efficiency of energy use and in turn reduce carbon dioxide emissions.
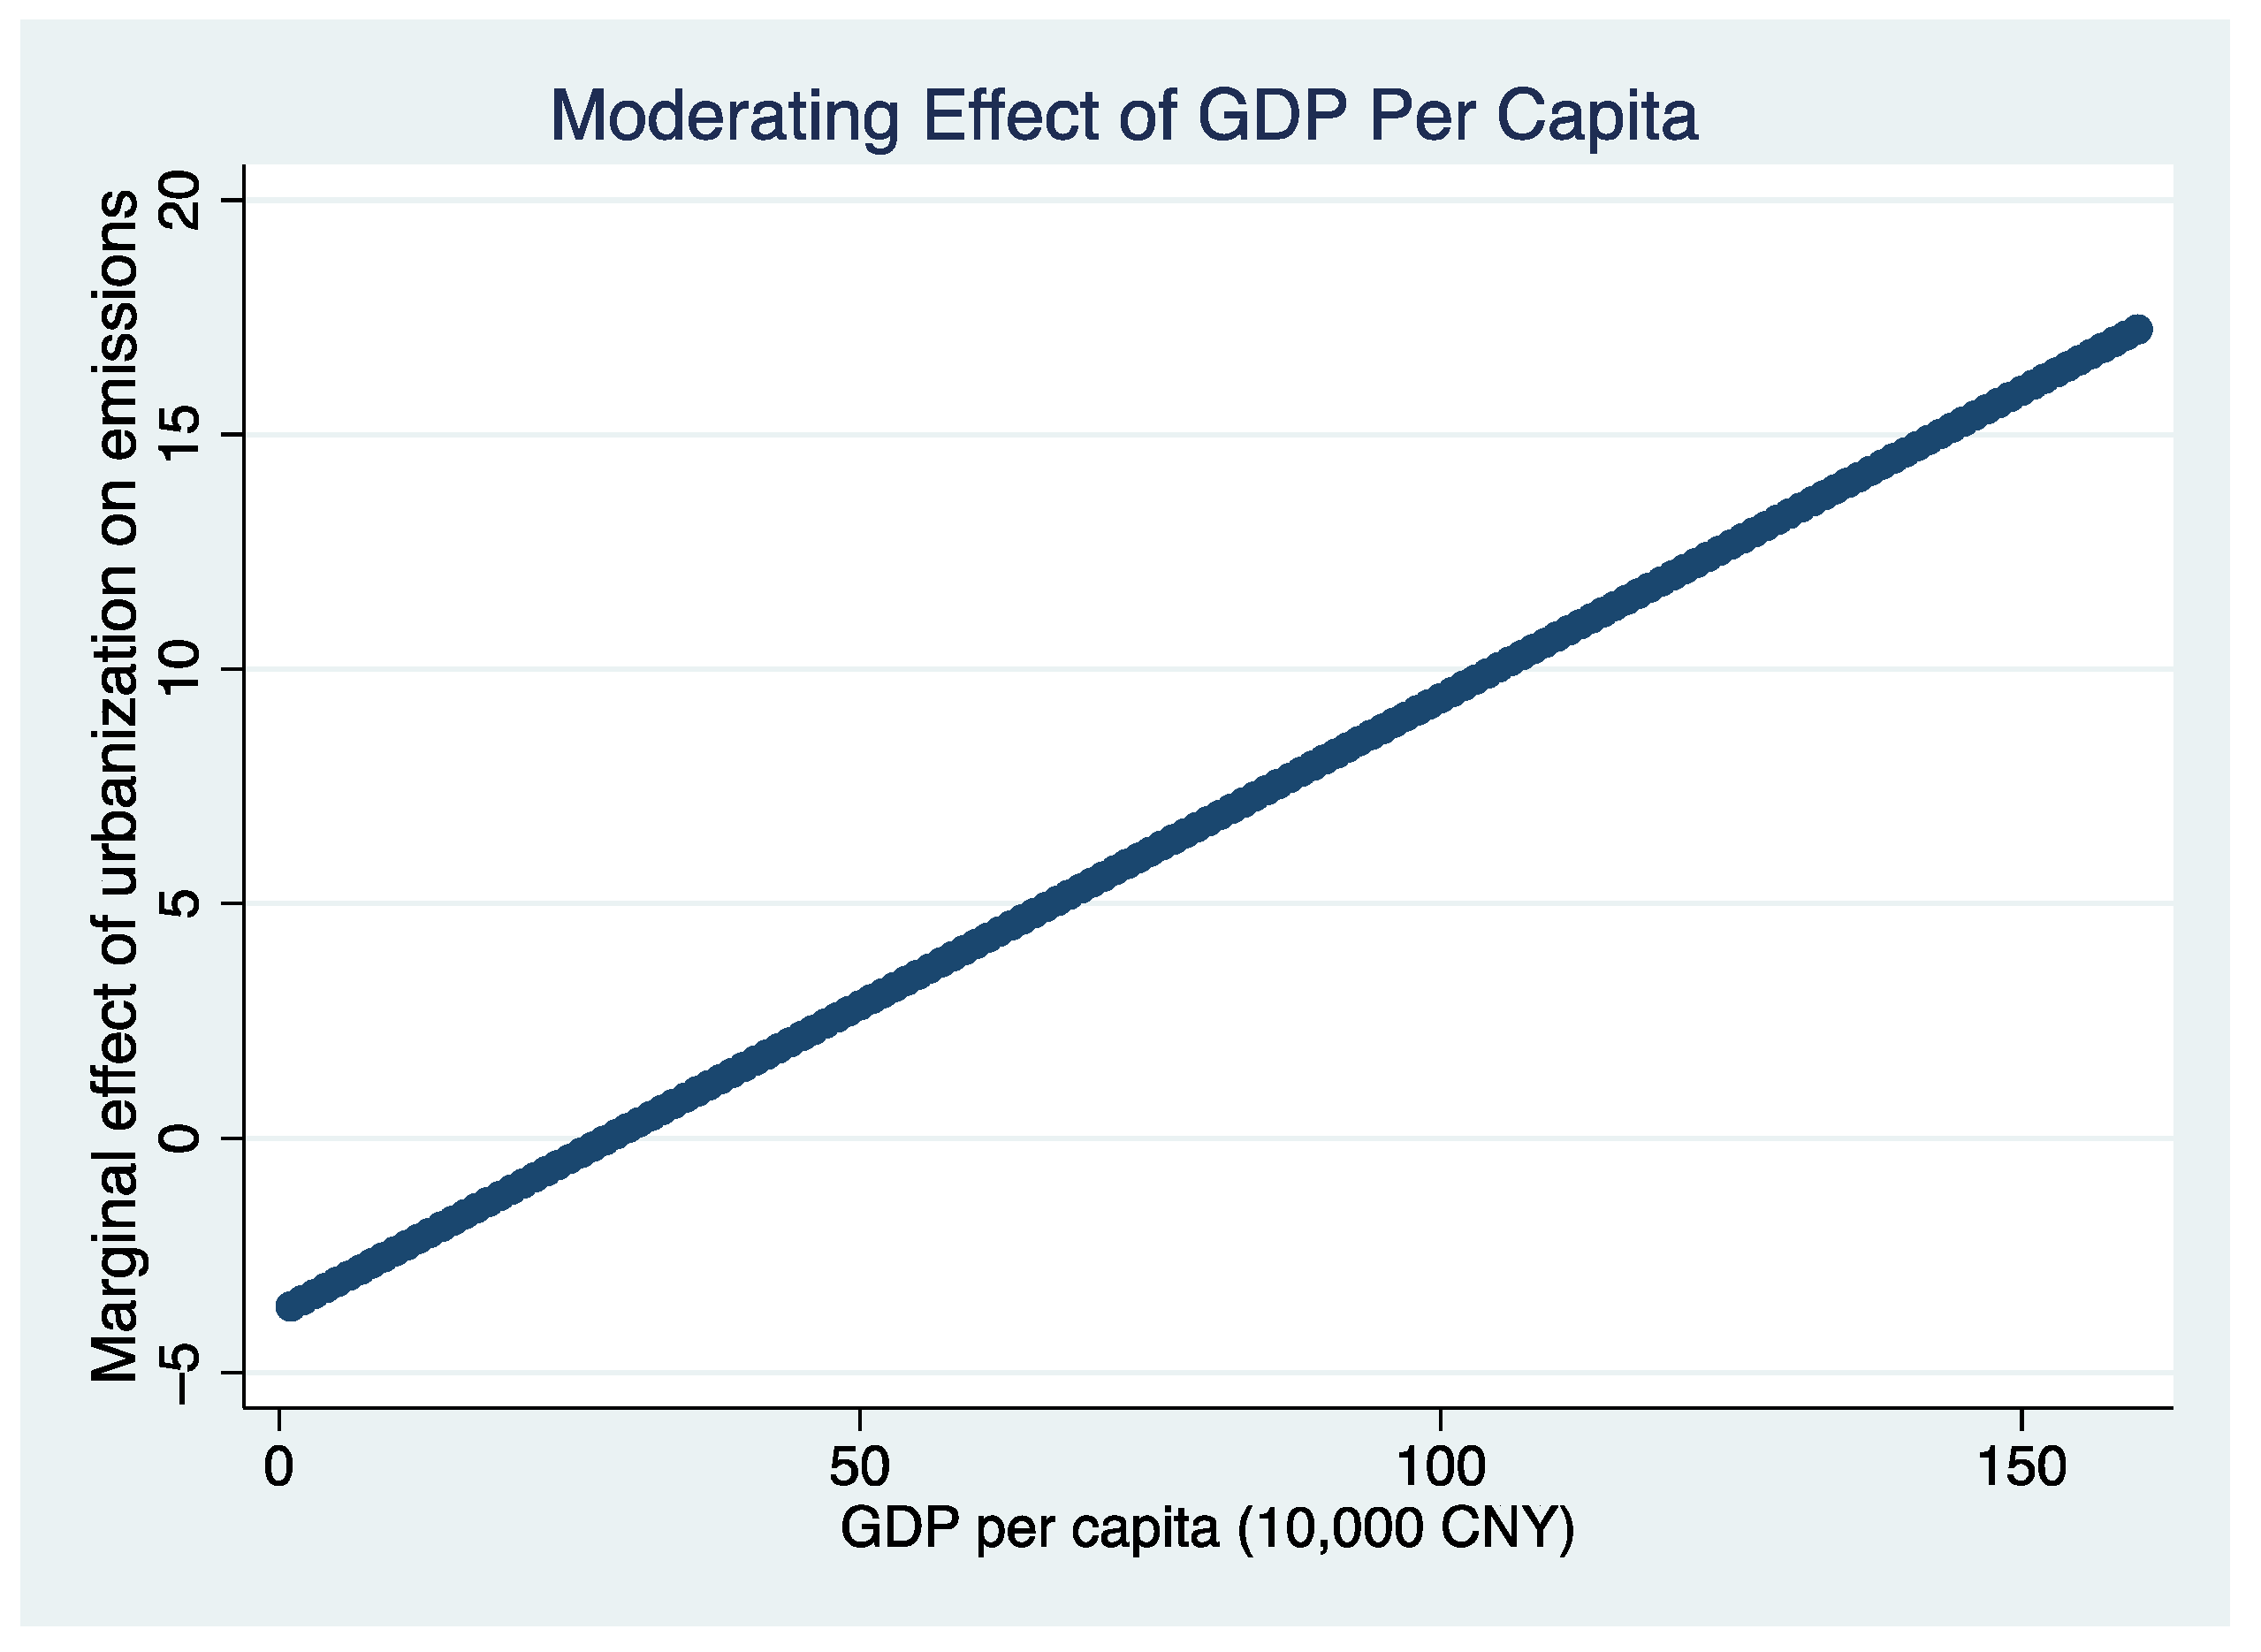
Next, to gain an in-depth understanding of the mechanisms by which urbanization influenced energy-related carbon dioxide emissions, the relationship between urbanization and carbon dioxide emissions was investigated under different development conditions. First, we started from the impact of urbanization on carbon dioxide emissions given distinct levels of economic development, using Equation (3). As shown in Table 4, the coefficient for the interaction term between urbanization rate and GDP per capita was positive at the 5% significance level in both models 2 and 8 (model 2: β = 0.005, p-value < 0.05; model 8: β = 0.003, p-value < 0.05). It was indicated that economic growth may reinforce the driving effect of urbanization on carbon dioxide emissions. This result is further reflected in Figure 3. It shows that the marginal effect of urbanization on carbon dioxide emissions became even stronger as GDP per capita took a higher value.
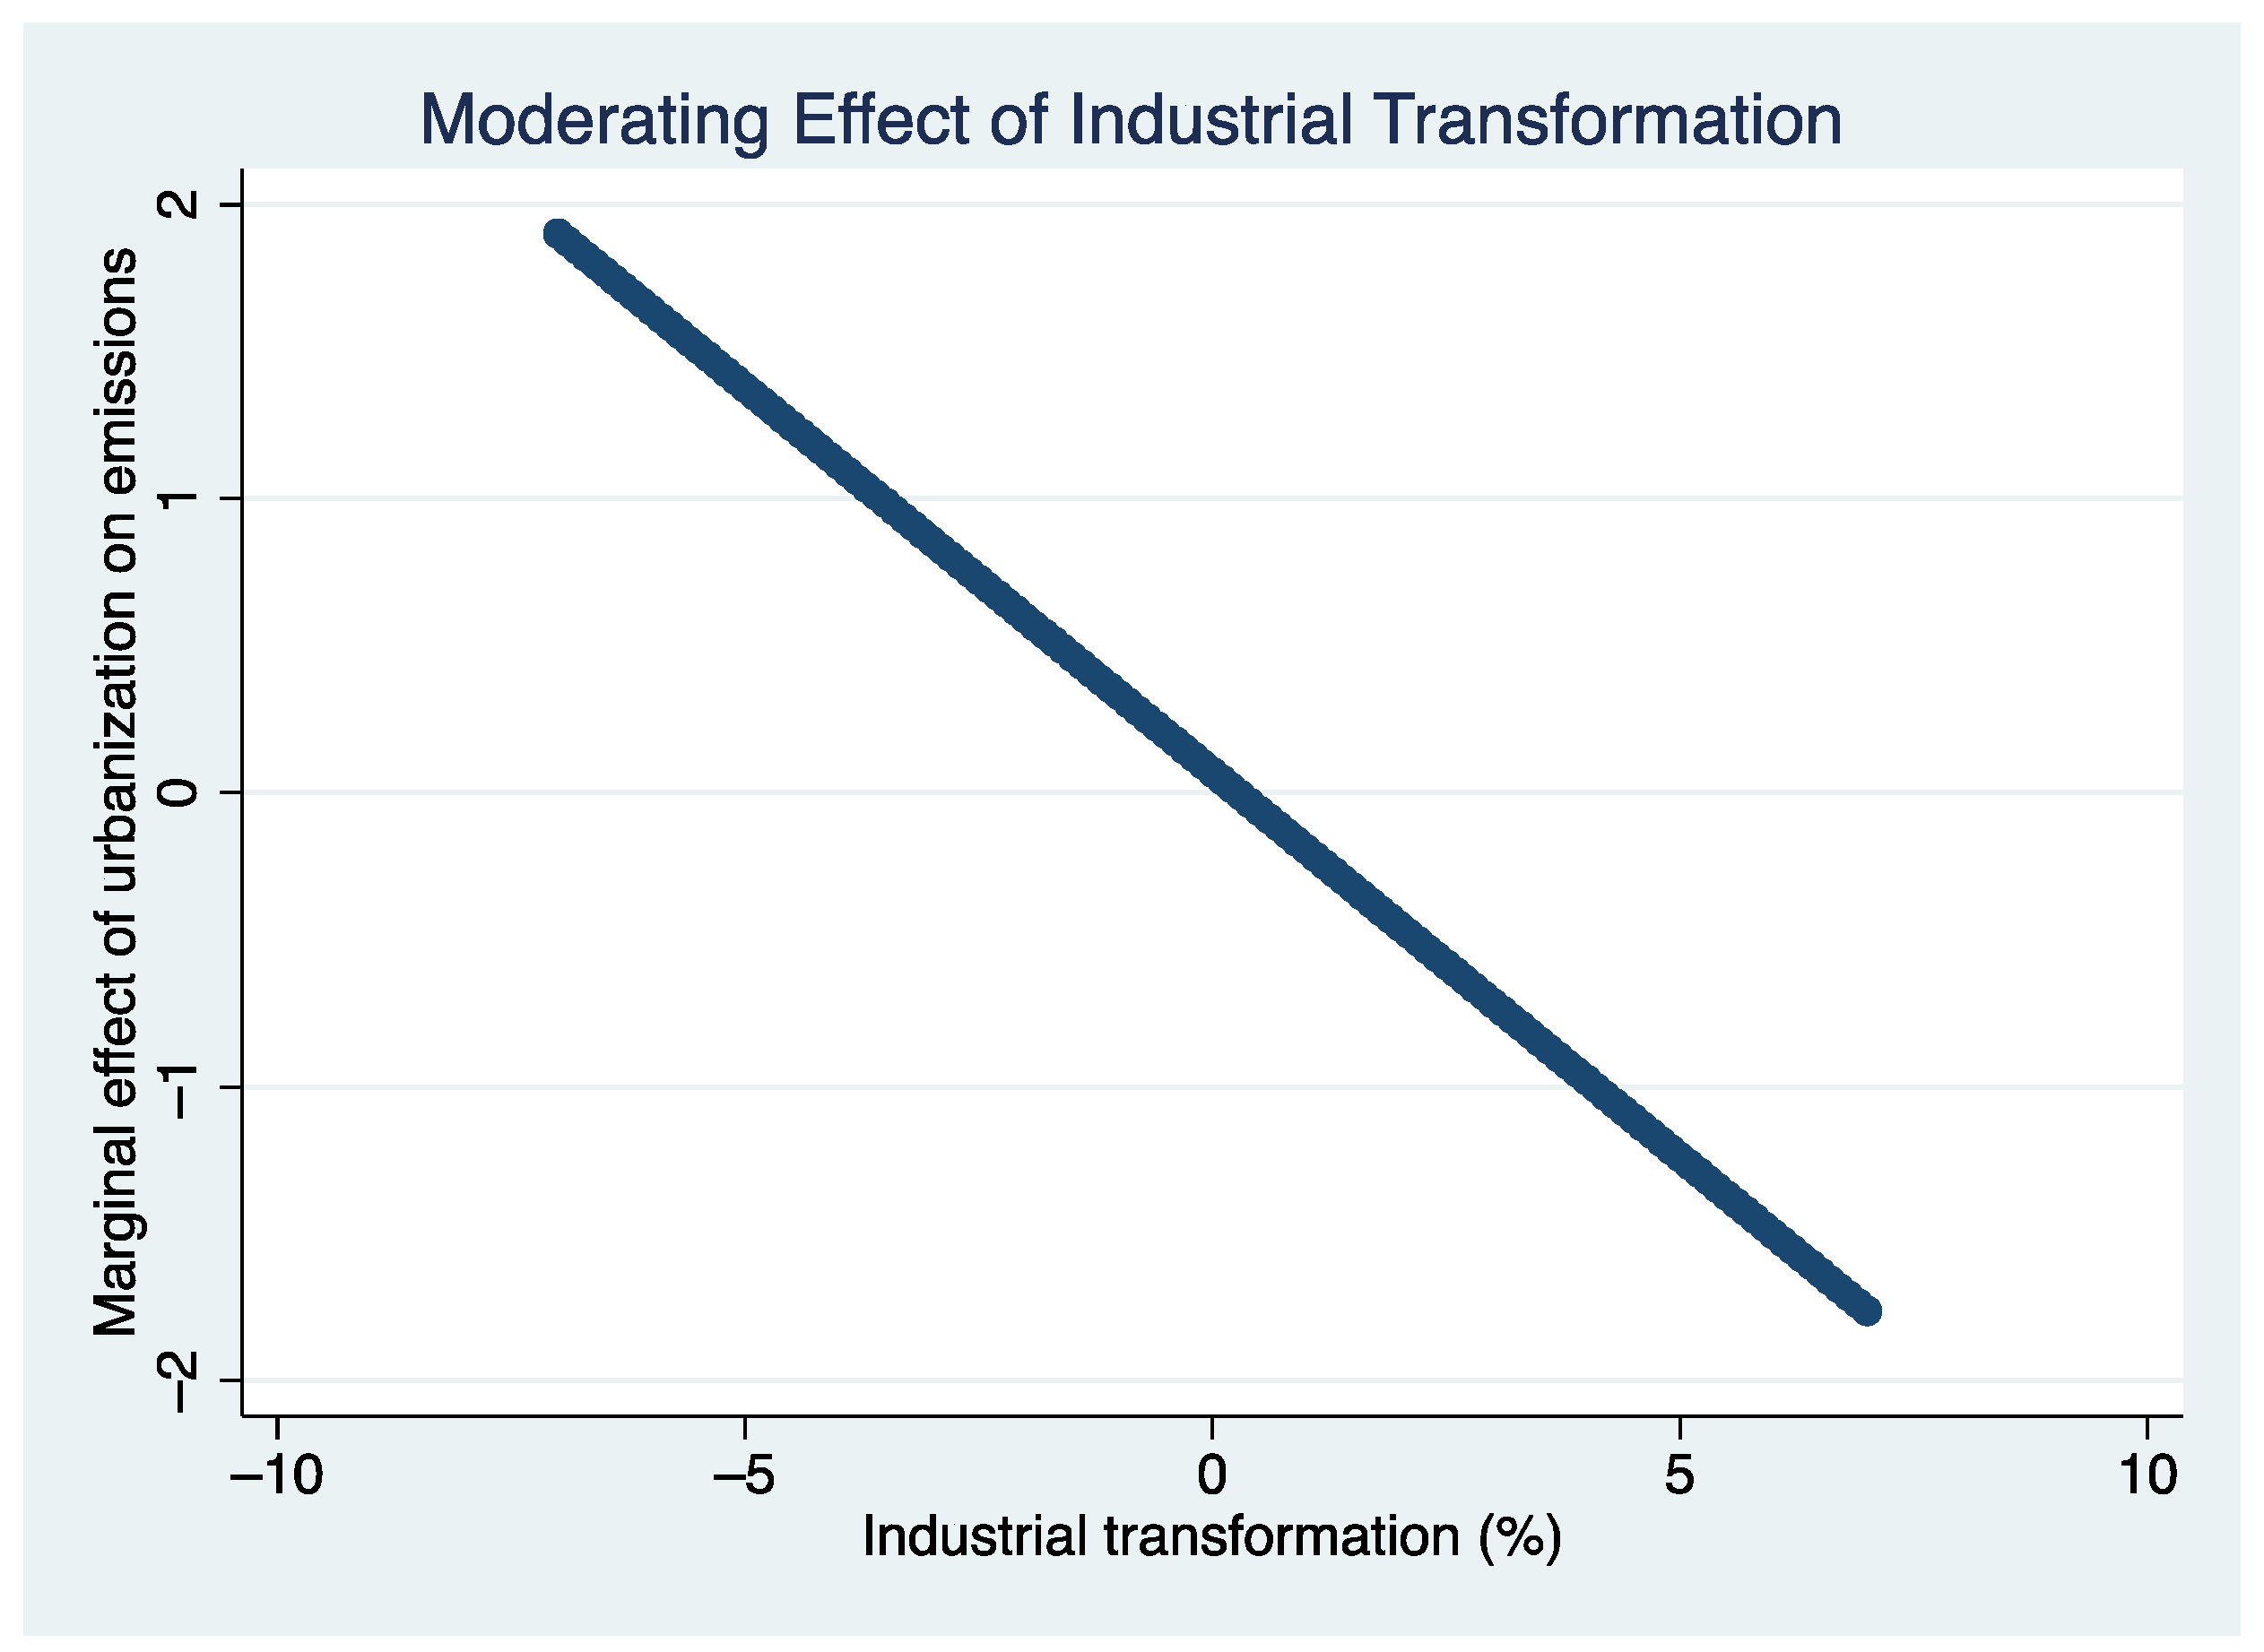
On the other hand, the coefficient for the interaction term between urbanization rate and industrial transformation was negative at the 5% significance level in models 3 and 8 (model 3: β = −0.263, p-value < 0.05; model 8: β = −0.215, p-value < 0.05), suggesting that the growth of carbon dioxide emissions in an area, along with its urbanization process, was mitigated if the tertiary industry in this area grew faster. This result is further demonstrated in Figure 4, which shows that the marginal effect of urbanization on carbon dioxide emissions was reduced as industrial transformation, as indicated by the growth rate of the share of the tertiary industry, became higher. Overall, these results show that when economic growth is faster, the expansion of the urban area could increase the carbon dioxide emissions to a greater extent. However, as the industrial structure was increasingly updated, which was characterized by a sharp rise in the share of the tertiary industry, the patterns of energy consumption were renovated, leading to a lower increase in carbon dioxide emissions as the urban areas expanded.
Then, the coefficients for the interaction terms between urbanization rate and R&D spending and between urbanization rate and patents were found to be negative at the 5% and 1% significance level in models 6 and 7, respectively (model 6: β = −0.002, p-value < 0.05; model 7: β = −0.058, p-value < 0.01). It was indicated that the positive impact of urbanization on carbon dioxide emissions in an area was weakened when the total investments in research activities were higher in this area or when the organizations of this region produced more innovative outputs. This result is further supported by Figure 5 and Figure 6, which show that the positive effects of urbanization on carbon dioxide emissions were lowered as R&D spending and patents increased. Taken together, these findings suggest that the accumulation of technological advantages could offer opportunities to reduce the amount of carbon dioxide emissions during the urbanization process.
Then, the impact of social transformation on different aspects of the relationship between urbanization and carbon dioxide emissions was analyzed, using Equation (4). Table 5 shows that the coefficient for the interaction term between urbanization rate and education was negative and significant in models 1 and 6 at the 10% and 1% significance level, respectively (model 1: β = −0.154, p-value < 0.1; model 6: β = −0.205, p-value < 0.01). This provides evidence for the idea that the expansion of urban areas could increase carbon dioxide emissions to a lesser extent if more education resources were available. The result is further reflected in 
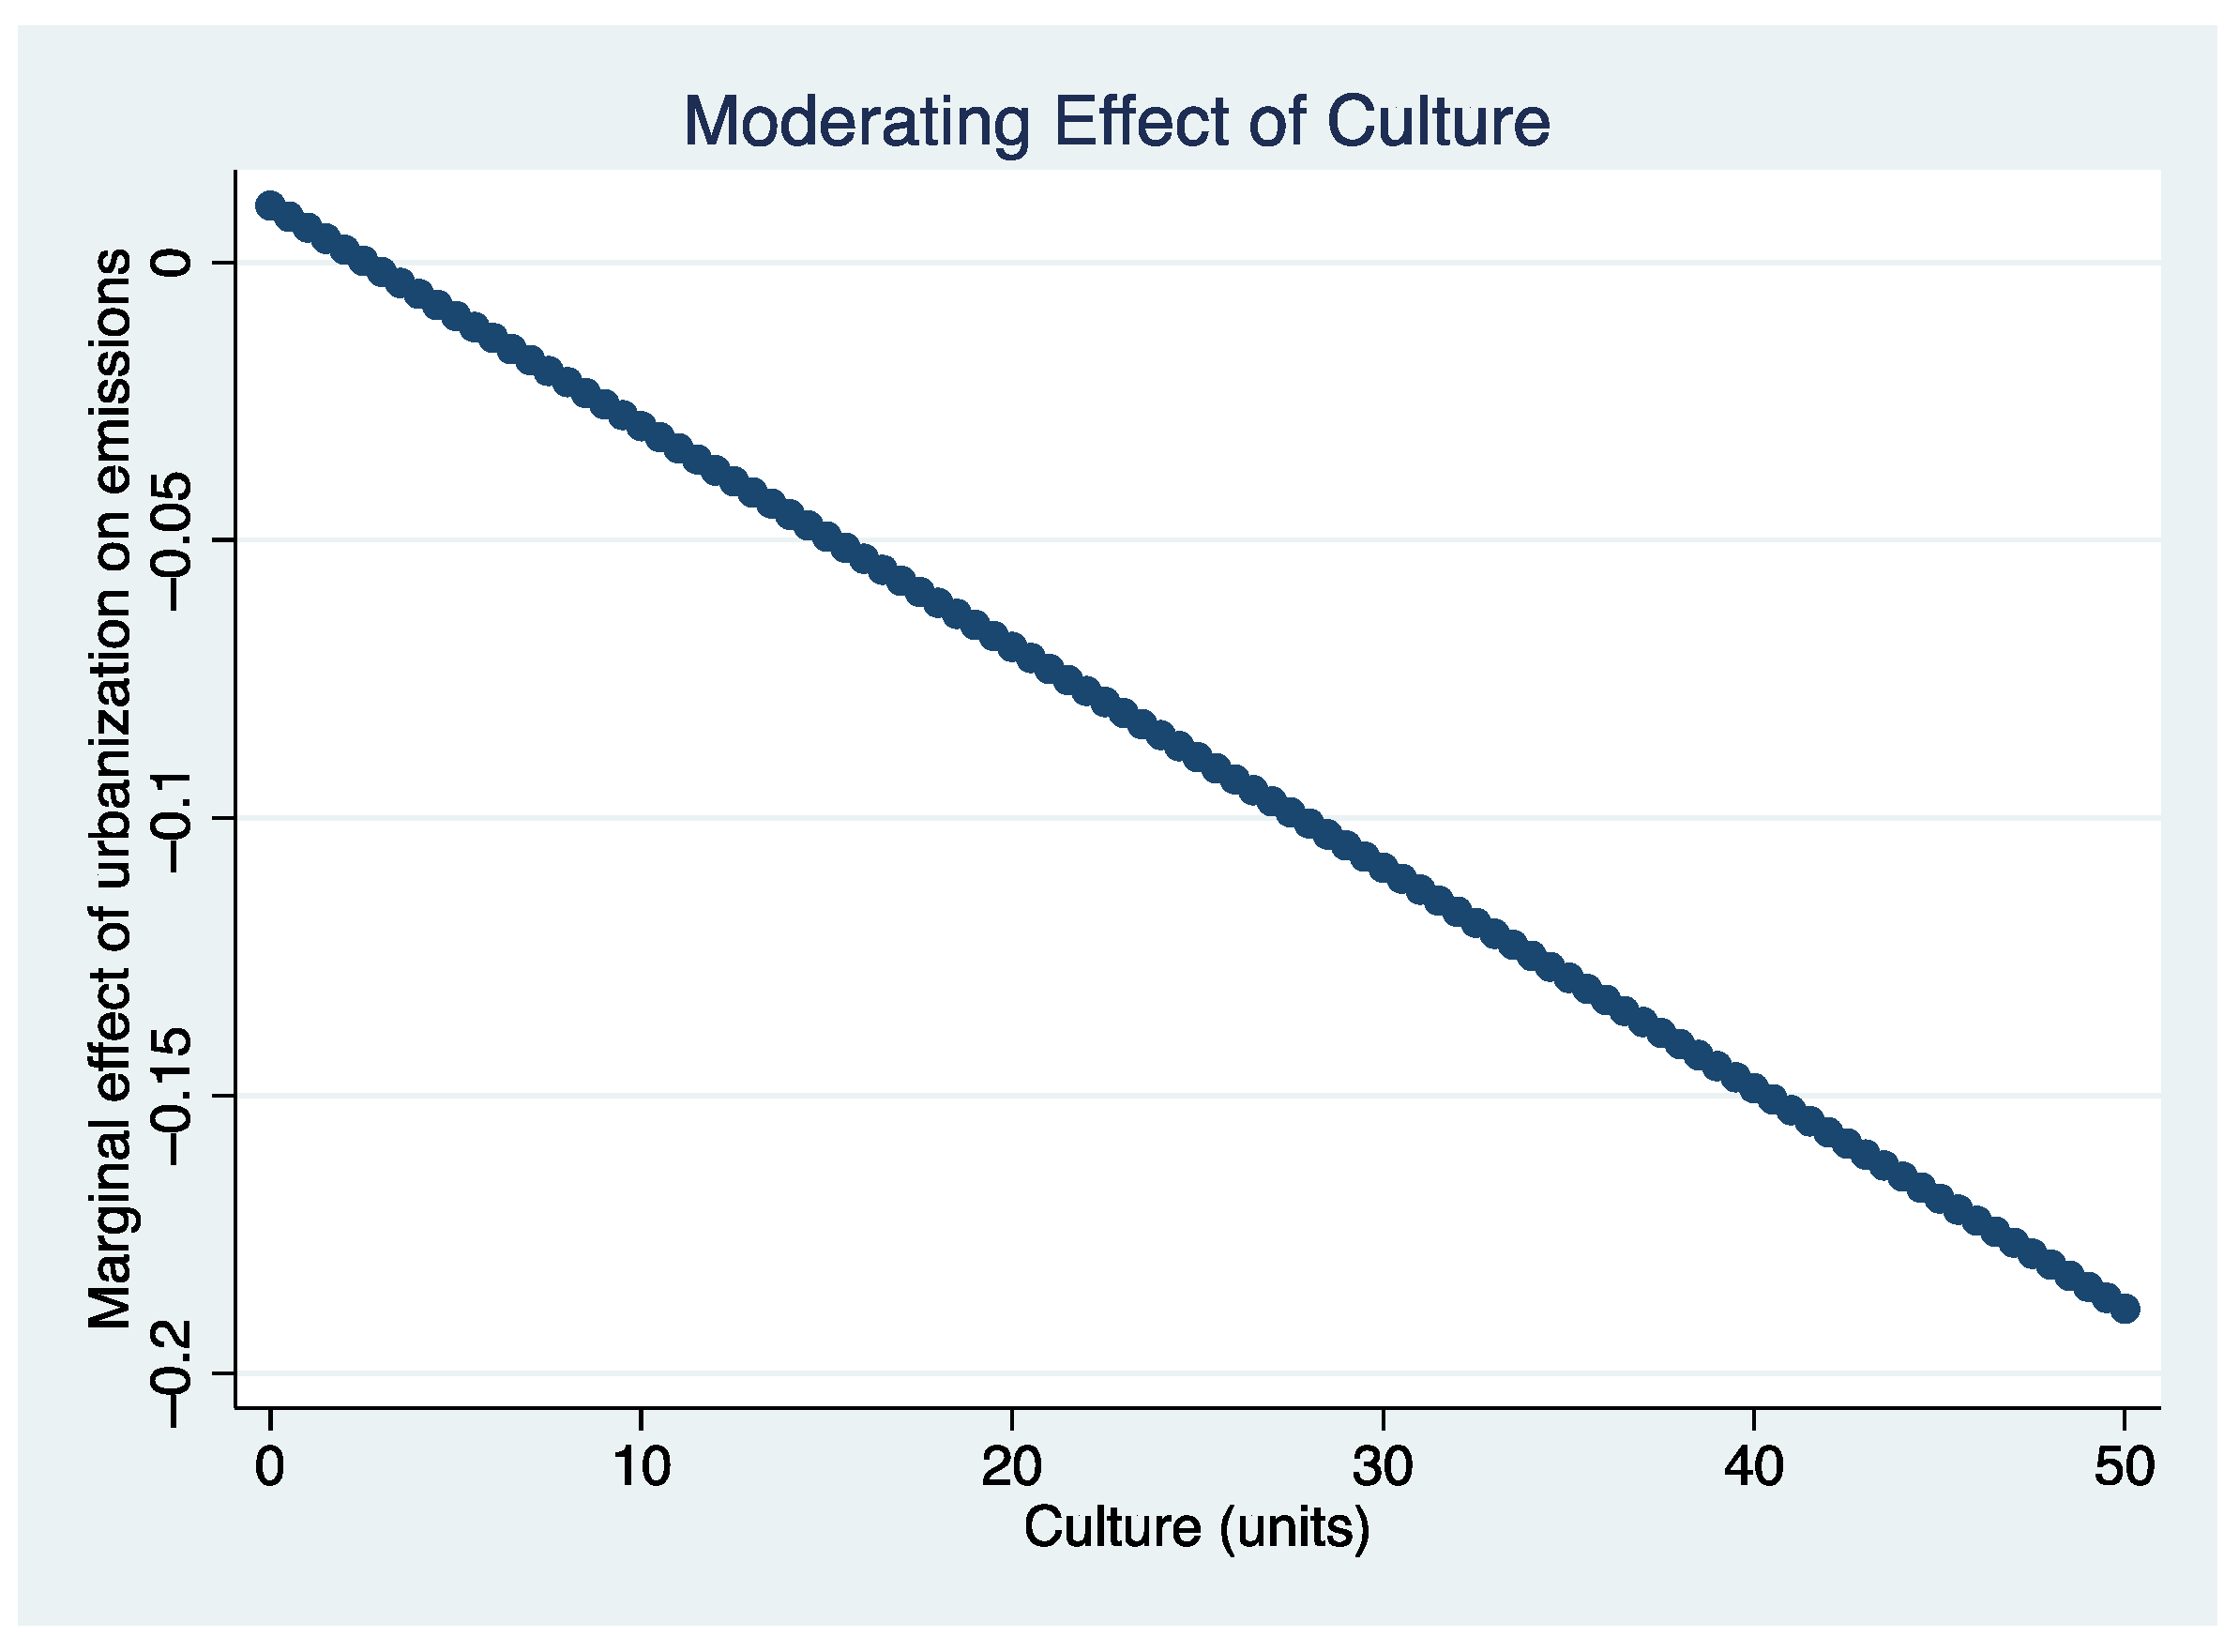
Figure 7. In addition, these results provide some evidence for the moderating effect of green cultures. The coefficient for the interaction between urbanization rate and culture was negative and significant in model 2 (model 2: β = −1.804, p-value < 0.05). It was indicated that the positive effect of urbanization on carbon dioxide emissions could be lowered if green cultures were more developed in this area. Figure 8 provides complementary evidence for this result. Finally, the coefficient for the interaction term between urbanization rate and family size was negative at the 5% significance level in models 4 and 6 (model 4: β = −0.076, p-value < 0.05; model 6: β = −0.089, p-value < 0.05), suggesting that the increase in carbon dioxide emissions during the urbanization process could be reduced with an increase in the average household size. This result is further reflected in Figure 9. Overall, these results imply that urbanization could have less of a driving effect on carbon dioxide emissions when the social wellbeing of the region is further improved during the urbanization process.
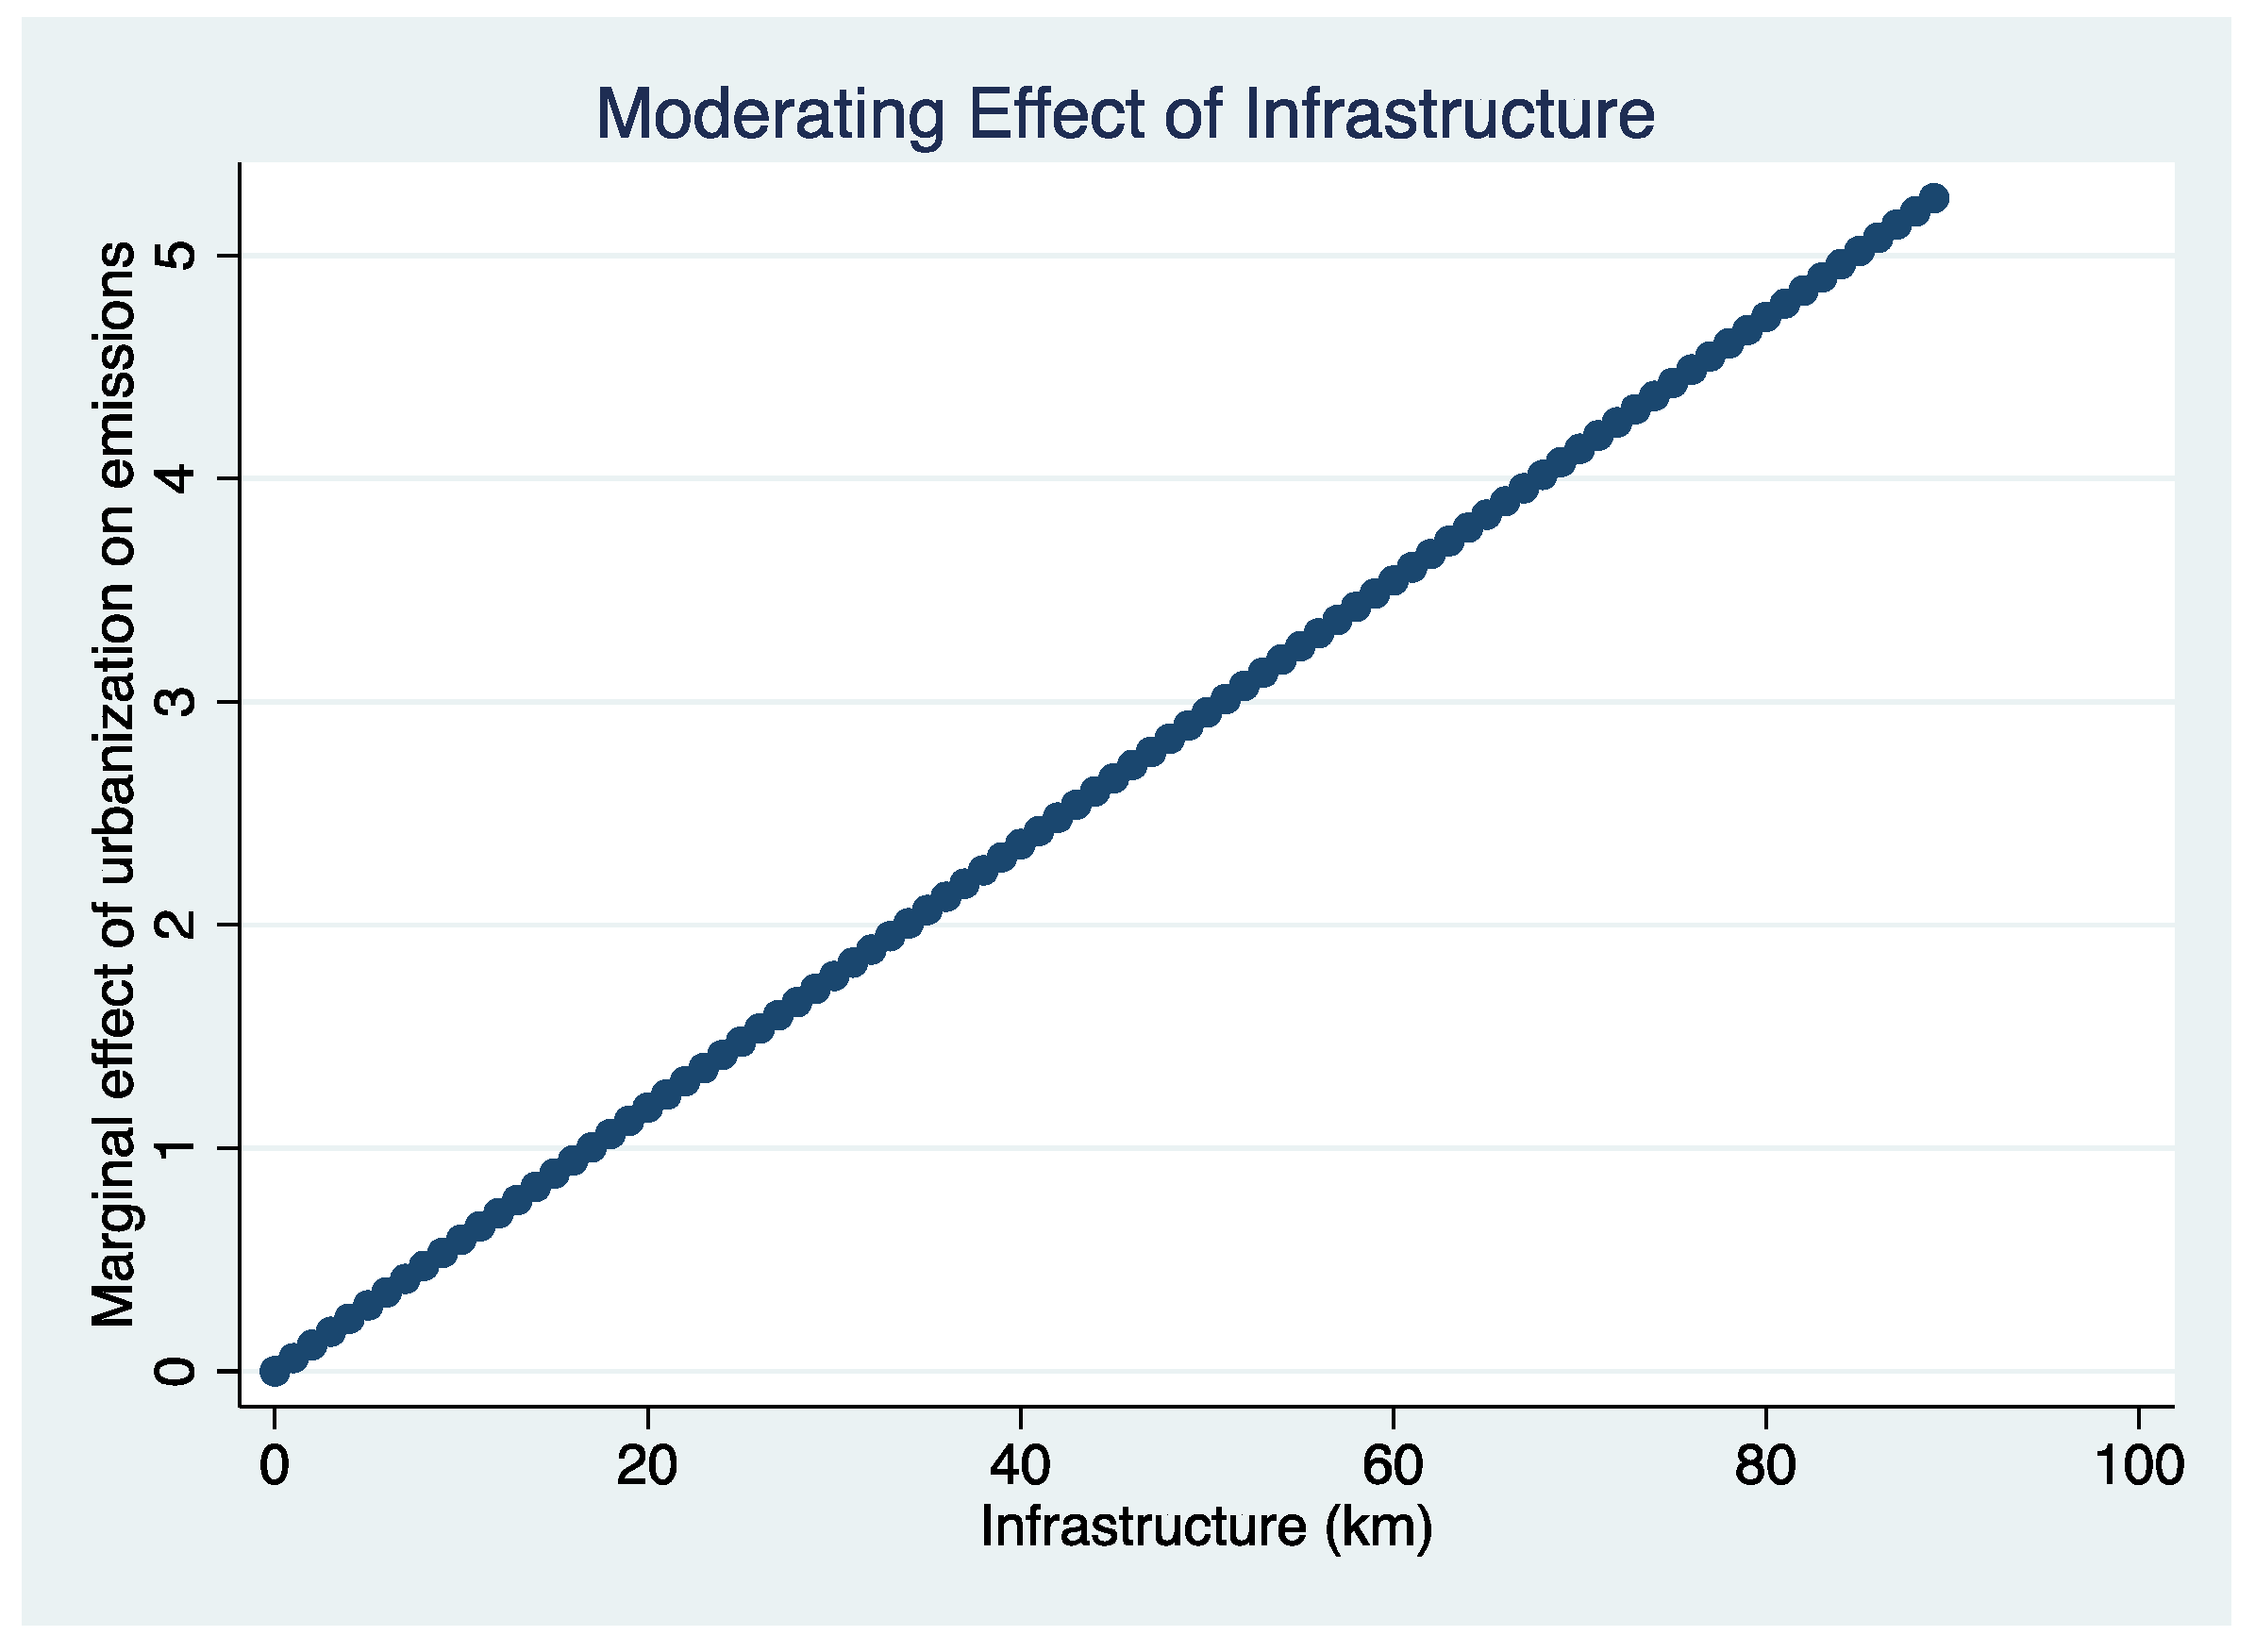
We then analyzed the impact of the urban environment on the relationship between urbanization and carbon dioxide emissions, using Equation (5). Table 6 shows that the coefficients for the interaction term between urbanization rate and infrastructure and between urbanization rate and transportation were positive and significant in models 1 and 2, respectively (model 1: β = 0.002, p-value < 0.01; model 2: β = 0.199, p-value < 0.01), indicating that infrastructure construction and public transportation could exacerbate the increase in carbon dioxide emissions during the urbanization process. This result is further supported by Figure 10 and Figure 11, which show that the marginal effect of urbanization on carbon dioxide emissions became stronger with an increase in the level of infrastructure and transportation facilities in the area. The implication of these results for urbanization and carbon dioxide emissions was that the construction of the urban environment increased the growth of carbon dioxide emissions during the urbanization process. Finally, the impact of ecological environmental conditions on the urbanization–emissions relationship was examined. As shown in Table 6, the coefficient for the interaction term between urbanization rate and wastewater was positive and significant in models 4 and 7 (model 4: β = 0.381, p-value < 0.01; model 7: β = 0.016, p-value < 0.05). This result is further supported by Figure 12, which shows that the marginal effect of urbanization on carbon dioxide emissions in a region became stronger as the volume of industrial wastewater produced in this area increased. It was indicated that urbanization could result in a higher amount of carbon dioxide emissions when production processes generated considerable wastewater and imposed a negative impact on the ecological environment.
Taken together, these results show that economic growth, as indicated by GDP per capita and FDI, enhances the driving effect of urbanization on carbon dioxide emissions. Moreover, infrastructure construction, increasing transportation demand, and wastewater also reinforced the growth of carbon dioxide emissions during urbanization processes. However, industrial transformation, technological change, and social transformation, such as education and cultural development, could significantly mitigate the increase in carbon dioxide emissions as urban areas expanded.

5. Discussion and Conclusions

It is noted in the existing literature that there is an EKC relationship between urbanization and carbon dioxide emissions, which means that carbon dioxide emission increases with expansion of urban land at low levels of urbanization but decreases with further expansion of urban land at high levels of urbanization [7,8,9]. Using a sample of 182 cities in China between 2001 and 2010, this study empirically examined the driving forces underlying the EKC relationship between urbanization and carbon dioxide emissions. Specifically, we explored how the relationship between urbanization and carbon dioxide emissions is changed by economic development, technological change, social transformation, urban environmental change, and the ecological environment quality. The results have important implications for our understanding of the environmental impact of the advance of urbanization.
First, when the urbanization process was accompanied by fast economic growth, economic production was more concentrated in energy-intensive industries, leading to the rapid growth of energy-related carbon dioxide emissions. However, when the urbanization process was characterized by industrial transformation toward increasing the share of the tertiary industry, the energy intensity of the economic production was lower and, in turn, the increase in carbon dioxide emissions generated in this urbanization process was reduced. Second, the construction of infrastructure could result in higher demands for energy-intensive construction materials, reinforcing the increase in carbon dioxide emissions during the urbanization process. Additionally, urban infrastructure could shift the consumption patterns of urban residents toward energy-intensive lifestyles, such as relying on private cars and extensive demands for goods and services, which could also enhance the increase in carbon dioxide emissions in the urbanization process. However, public infrastructure, such as central heating systems, could also improve the energy efficiency of urban residents and therefore mitigate the growth of carbon dioxide emissions in the urbanization process. Third, the concentration of the population in urban areas increased the demand for delivery services for raw materials, finished goods, and food in urban areas. When public transportation facilities were underdeveloped, the energy intensity of transportation could be quite high, exacerbating the growth in carbon dioxide emissions in the urbanization process. However, the concentration of the urban population in cities also gave rise to higher energy efficiency in production and manufacturing processes, which could reduce the carbon dioxide emissions caused by the growth of urban land. Moreover, urban dwellers were likely to be influenced by advocates for new low-carbon lifestyles, led by institutional changes in urban areas. Therefore, citizens living in large cities could gradually become aware of the problem of climate change and start to buy green products and bioproducts. Finally, technological change could provide new opportunities for emissions reductions when urban areas were continuously expanding. For instance, the increasing use of renewable energy in public transport systems could switch the relationship between energy use and carbon dioxide emissions during the urbanization process. As a result, the driving effect of urbanization on carbon dioxide emissions could be alleviated.
This study contributes to the literature on this relationship in two aspects. First of all, taking a holistic perspective, this study shed new light on our understanding of a full image of the mechanisms of urbanization on carbon dioxide emissions. The literature has long emphasized that urbanization is accompanied by multiple transition processes in social, economic, and environmental phases, which have distinct implications for the increase in carbon dioxide emissions in urban areas. We found that although economic growth and urban construction induced by rapid urbanization may reinforce the growth of carbon emissions, there are multiple social and economic processes that can help with carbon emission reduction in the period of urbanization.
Second, the results of the extensive analyses on the city level in this study have important implications for the implementation of carbon emission reduction. Specifically, this study highlighted that urbanization has both positive and negative impact on carbon dioxide emissions due to the underlying economic, social, and environmental processes. According to our findings, as urban land continuously expands in China, the government should take measures to motivate technological progress and propel social and cultural reform towards low-carbon lifestyles and green economy. Additionally, the government should pay attention to the reduction of carbon emissions in construction processes and in built environments of urban areas. Following this line of thought, future studies could pay more attention to green technologies for carbon emission reduction in the construction sector.
This paper has limitations that provide a basis for future research. We adopted a linear fixed effects estimator to test the driving forces of an EKC relationship between urbanization and carbon dioxide emissions. However, this method has a number of limitations in this context. First, the function that describes the relationship between urbanization and carbon dioxide emissions is not fully known. Although we built a model that captures most of the relevant factors by analyzing the literature, it is still possible that there are other variables that should be included in the model [68,69]. Furthermore, in the context of energy-related carbon dioxide emissions, parametric analyses often do not approximate the relationship well enough [68]. Therefore, nonparametric trending methods can be superior. Future studies can consider using nonparametric models to examine the factors underlying the EKC relationship between urbanization and carbon dioxide emissions.

Author Contributions

The conceptualization of integrated models of the relationship between urbanization and carbon dioxide emissions, Y.D. and Q.Y.; the methodology of the analysis of the effects of urbanization on carbon dioxide emissions, Y.D.; the investigation and data curation, Y.D. and L.C.; the validation of research data, Y.D. and L.C.; the formal statistical analysis, Y.D.; writing—original draft preparation, Y.D.; writing—review and editing, Y.D. and Q.Y.; visualization, Y.D.; supervision, Q.Y.; project administration, Q.Y.; funding acquisition, Q.Y. All authors have read and agreed to the published version of the manuscript.

Funding

This research was funded by the Major Project of the National Social Science Fund of China, grant number: 16ZDA045.

Institutional Review Board Statement

Not applicable.

Informed Consent Statement

Not applicable.

Data Availability Statement

Publicly available datasets were analyzed in this study. This data can be found here: https://www.ceads.net/data/city/ (accessed on 30 July 2021).

Acknowledgments

We acknowledge the support from the Major Project of the National Social Science Fund of China (grant number: 16ZDA045).

Conflicts of Interest

The authors declare no conflict of interest.

References

  1. Li, K.; Lin, B. Impacts of Urbanization and Industrialization on Energy Consumption CO2 Emissions: Does the Level of Development Matter? Renew. Sustain. Energy Rev. 2015, 52, 1107–1122. [Google Scholar] [CrossRef]
  2. Wang, Y.; Zhang, C.; Lu, A.; Li, L.; He, Y.; ToJo, J.; Zhu, X. A disaggregated analysis of the environmental Kuznets curve for industrial CO2 emissions in China. Appl. Energy 2017, 190, 172–180. [Google Scholar] [CrossRef]
  3. Wang, S.; Liu, X.; Zhou, C.; Hu, J.; Ou, J. Examining the Impacts of Socioeconomic Factors, Urban Form, and Transportation Networks on CO2 Emissions in China’s Megacities. Appl. Energy 2017, 185, 189–200. [Google Scholar] [CrossRef]
  4. Zhang, N.; Yu, K.; Chen, Z. How does urbanization affect carbon dioxide emissions? A cross-country panel data analysis. Energy Policy 2017, 107, 678–687. [Google Scholar] [CrossRef]
  5. Zhang, W.; Xu, H. Effects of land urbanization and land finance on carbon emissions: A panel data analysis for Chinese provinces. Land Use Policy 2017, 63, 493–500. [Google Scholar] [CrossRef] [Green Version]
  6. Wang, S.; Ma, Y. Influencing factors and regional discrepancies of the efficiency of carbon dioxide emissions in Jiangsu, China. Ecol. Indic. 2018, 90, 460–468. [Google Scholar] [CrossRef]
  7. Li, J.; Huang, X.; Kwan, M.P.; Yang, H.; Chuai, X. The effect of urbanization on carbon dioxide emissions efficiency in the Yangtze River Delta, China. J. Clean. Prod. 2018, 188, 38–48. [Google Scholar] [CrossRef]
  8. Kaika, D.; Zervas, E. The Environmental Kuznets Curve (KEC) theory-Part A: Concept, causes and the CO2 emissions case. Energy Policy 2013, 62, 1392–1402. [Google Scholar] [CrossRef]
  9. Li, T.; Wang, Y.; Zhao, D. Environmental Kuznets Curve in China: New evidence from dynamic panel analysis. Energy Policy 2016, 91, 138–147. [Google Scholar] [CrossRef]
  10. Sadik-Zada, E.R.; Ferrari, M. Environmental policy stringency, technical progress and pollution haven hypothesis. Sustainability 2020, 12, 3880. [Google Scholar] [CrossRef]
  11. Sadik-Zada, E.R.; Gatto, A. The puzzle of greenhouse gas footprints of oil abundance. Socio-Econ. Plan. Sci. 2021, 75, 100936. [Google Scholar] [CrossRef]
  12. Chikaraishi, M.; Fujiwara, A.; Kaneko, S.; Poumanyvong, P.; Komatsu, S.; Kalugin, A. The moderating effects of urbanization on carbon dioxide emissions: A latent class modeling approach. Technol. Forecast. Soc. Chang. 2015, 90, 302–317. [Google Scholar] [CrossRef]
  13. Haseeb, A.; Xia, E.; Baloch, M.A.; Abbas, K. Financial Development, Globalization, and CO2 Emission in the Presence of EKC: Evidence from BRICS Countries. Environ. Sci. Pollut. Res. 2018, 25, 31283–31296. [Google Scholar] [CrossRef]
  14. Haouraji, C.; Mounir, B.; Mounir, I.; Farchi, A. Exploring the Relationship between Residential CO2 Emissions, Urbanization, Economic Growth, and Residential Energy Consumption: Evidence from the North Africa Region. Energies 2021, 14, 5849. [Google Scholar] [CrossRef]
  15. Kasman, A.; Duman, Y.S. CO2 emissions, economic growth, energy consumption, trade and urbanization in new EU member and candidate countries: A panel data analysis. Econ. Model. 2015, 44, 97–103. [Google Scholar] [CrossRef]
  16. Sun, W.; Huang, C. How does urbanization affect carbon emission efficiency? Evidence from China. J. Clean. Prod. 2020, 272, 122828. [Google Scholar] [CrossRef]
  17. Liu, B.; Tian, C.; Li, Y.; Song, H.; Ma, Z. Research on the effects of urbanization on carbon emissions efficiency of urban agglomerations in China. J. Clean. Prod. 2018, 197, 1374–1381. [Google Scholar] [CrossRef]
  18. Zhou, C.; Wang, S.; Wang, J. Examining the influences of urbanization on carbon dioxide emissions in the Yangtze River Delta, China: Kuznets curve relationship. Sci. Total Environ. 2019, 675, 472–482. [Google Scholar] [CrossRef]
  19. Zhou, Y.; Chen, M.; Tang, Z.; Mei, Z. Urbanization, land use change, and carbon emissions: Quantitative assessments for city-level carbon emissions in Beijing-Tianjin-Hebei region. Sustain. Cities Soc. 2021, 66, 102701. [Google Scholar] [CrossRef]
  20. Yao, F.; Zhu, H.; Wang, M. The Impact of Multiple Dimensions of Urbanization on CO2 Emissions: A Spatial and Threshold Analysis of Panel Data on China’s Prefecture-Level Cities. Sustain. Cities Soc. 2021, 73, 103113. [Google Scholar] [CrossRef]
  21. Ren, F.; Yu, X. Coupling analysis of urbanization and ecological total factor energy efficiency—A case study from Hebei province in China. Sustain. Cities Soc. 2021, 74, 103183. [Google Scholar] [CrossRef]
  22. Lehmann, S. Can rapid urbanisation ever lead to low carbon cities? The case of Shanghai in comparison to Potsdamer Platz Berlin. Sustain. Cities Soc. 2012, 3, 1–12. [Google Scholar] [CrossRef]
  23. Du, L.; Chu, W.; Cai, S. Economic development and carbon dioxide emissions in China: Provincial panel data analysis. China Econ. Rev. 2012, 23, 371–384. [Google Scholar] [CrossRef]
  24. Sun, J.; Shi, J.; Shen, B.; Li, S.; Wang, Y. Nexus among Energy Consumption, Economic Growth, Urbanization and Carbon Emissions: Heterogeneous Panel Evidence Considering China’s Regional Differences. Sustainability 2018, 10, 2383. [Google Scholar] [CrossRef] [Green Version]
  25. Sun, X.; Li, J.; Qiao, H.; Zhang, B. Energy implications of China’s regional development: New insights from multi-regional input-output analysis. Appl. Energy 2017, 196, 118–131. [Google Scholar] [CrossRef]
  26. Wang, Y.; Wang, Y.; Zhou, J.; Zhu, X.; Lu, G. Energy Consumption and Economic Growth in China: Amultivariate Causality Test. Energy Policy 2011, 39, 4399–4406. [Google Scholar] [CrossRef]
  27. Yan, H. Provincial energy intensity in China: The role of urbanization. Energy Policy 2015, 86, 635–650. [Google Scholar] [CrossRef]
  28. Poumanyvong, P.; Kaneko, S. Does Urbanization Lead to Less Energy Use and Lower CO2 Emissions? Across-Country Analysis. Ecol. Econ. 2010, 70, 1344–1353. [Google Scholar] [CrossRef]
  29. Al-Mulali, U.; Sab, C.N.B.C.; Fereidouni, H.G. Exploring the bi-directional long run relationship between urbanization, energy consumption, and carbon dioxide emission. Energy 2012, 46, 156–167. [Google Scholar] [CrossRef]
  30. Jorgenson, A.K.; Auerbach, D.; Clark, B. The (De-) carbonization of urbanization, 1960–2010. Clim. Chang. 2014, 127, 561–575. [Google Scholar] [CrossRef]
  31. Barido, D.P.D.L.; Marshall, J.D. Relationship between Urbanization and CO2 Emissions Depends on Income Level and Policy. Environ. Sci. Technol. 2014, 48, 3632–3639. [Google Scholar] [CrossRef]
  32. Adams, S.; Nsiah, C. Reducing Carbon Dioxide Emissions; Does Renewable Energy Matter? Sci. Total Environ. 2019, 693, 133288. [Google Scholar] [CrossRef]
  33. Al-Mulali, U.; Fereidouni, H.G.; Lee, Y.; Sab, C.N.B.C. Exploring the relationship between urbanization, energy consumption, and CO2 emission in MENA countries. Renew. Sustain. Energy Rev. 2013, 23, 107–112. [Google Scholar] [CrossRef]
  34. Raggad, B. Carbon dioxide emissions, economic growth, energy use, and urbanization in Saudi Arabia: Evidence from the ARDL approach and impulse saturation break tests. Environ. Sci. Pollut. Res. 2018, 25, 14882–14898. [Google Scholar] [CrossRef]
  35. Shahbaz, M.; Sbia, R.; Hamdi, H.; Ozturk, I. Economic growth, electricity consumption, urbanization and environmental degradation relationship in United Arab Emirates. Ecol. Indic. 2014, 45, 622–631. [Google Scholar] [CrossRef]
  36. Martinez-Zarzoso, I.; Maruotti, A. The impact of urbanization on CO2 emissions: Evidence from developing countries. Ecol. Econ. 2011, 70, 1344–1353. [Google Scholar] [CrossRef] [Green Version]
  37. Wang, Y.; Li, L.; Kubota, J.; Han, R.; Zhu, X.; Lu, G. Does urbanization lead to more carbon emission? Evidence from a panel of BRICS countries. Appl. Energy 2016, 168, 375–380. [Google Scholar] [CrossRef]
  38. Zhu, H.; Xia, H.; Guo, Y.; Peng, C. The heterogeneous effects of urbanization and income inequality on CO2 emissions in BRICS economies: Evidence from panel quantile regression. Environ. Sci. Pollut. Res. 2018, 25, 17176–17193. [Google Scholar] [CrossRef]
  39. Hossain, M.S. Panel Estimation for CO2 Emissions, Energy Consumption, Economic Growth, Trade Openness and Urbanization of Newly Industrialized Countries. Energy Policy 2011, 39, 6991–6999. [Google Scholar] [CrossRef]
  40. Sadorsky, P. The effect of urbanization on CO2 emissions in emerging economies. Energy Econ. 2014, 41, 147–153. [Google Scholar] [CrossRef]
  41. Feng, K.; Siu, Y.L.; Guan, D.; Hubacek, K. Analyzing Drivers of Regional Carbon Dioxide Emissions for China: A Structural Decomposition Analysis. J. Ind. Ecol. 2012, 16, 600–611. [Google Scholar] [CrossRef]
  42. Wang, S.; Fang, C.; Guan, X.; Pang, B.; Ma, H. Urbanisation, Energy Consumption, and Carbon Dioxide Emissions in China: A Panel Data Analysis of China’s Provinces. Appl. Energy 2014, 136, 738–749. [Google Scholar] [CrossRef]
  43. Liu, Y.; Yan, B.; Zhou, Y. Urbanization, economic growth, and carbon dioxide emissions in China: A panel cointegration and causality analysis. J. Geogr. Sci. 2015, 26, 131–152. [Google Scholar] [CrossRef] [Green Version]
  44. Fan, J.-S.; Zhou, L. Impact of urbanization and real estate investment on carbon emissions: Evidence from China’s provincial regions. J. Clean. Prod. 2018, 209, 309–323. [Google Scholar] [CrossRef]
  45. Zhang, Y.; Wang, H.; Liang, S.; Xu, M.; Liu, W.; Li, S.; Zhang, R.; Nielsen, C.P.; Bi, J. Temporal and spatial variations in consumption-based carbon dioxide emissions in China. Renew. Sustain. Energy Rev. 2014, 40, 60–68. [Google Scholar] [CrossRef]
  46. Hao, H.; Geng, Y.; Wang, H.; Ouyang, M. Regional disparity of urban passenger transport associated GHG (greenhouse gas) emissions in China: A review. Energy 2014, 68, 783–793. [Google Scholar] [CrossRef]
  47. Zhou, X. Study on the Relationship between Urbanization and Carbon Dioxide Emissions in China. China Popul. Resour. Environ. 2011, 12, 875–895. [Google Scholar]
  48. Wang, F.; Gao, M.; Liu, J.; Qin, Y.; Wang, G.; Fan, W.; Ji, L. An Empirical Study on the Impact Path of Urbanization to Carbon Emissions in the China Yangtze River Delta Urban Agglomeration. Appl. Sci. 2019, 9, 1116. [Google Scholar] [CrossRef] [Green Version]
  49. Zhang, Y.-J.; Liu, Z.; Zhang, H.; Tan, T.-D. The impact of economic growth, industrial structure and urbanization on carbon emission intensity in China. Nat. Hazards 2014, 73, 579–595. [Google Scholar] [CrossRef]
  50. Liu, M.; Liu, Y. The Relationship between the Development of China’s Urbanization and Carbon Emission: An Empisical Study Based on 30 Provinces’ Data. Urban Stud. 2011, 18, 27–32. [Google Scholar]
  51. Zhou, X.; Zhang, J.; Li, J. Industrial structural transformation and carbon dioxide emissions in China. Energy Policy 2013, 57, 43–51. [Google Scholar] [CrossRef]
  52. Behera, S.R.; Dash, D.P. The effect of urbanization, energy consumption, and foreign direct investment on the carbon dioxide emission in the SSEA (South and Southeast Asian) region. Renew. Sustain. Energy Rev. 2017, 70, 96–106. [Google Scholar] [CrossRef]
  53. Zhu, Q.; Peng, X. The impacts of population change on carbon emissions in China during 1978–2008. Environ. Impact Assess. Rev. 2012, 36, 1–8. [Google Scholar] [CrossRef]
  54. Madlener, R.; Sunak, Y. Impacts of Urbanization on Urbanstructures and Energy Demand: What Can We Learn for Urban Energy Planning and Urbanization Management? Sustain. Cities Soc. 2011, 1, 45–53. [Google Scholar] [CrossRef]
  55. Sadorsky, P. Do Urbanization and Industrialization Affect Energy Intensity in Developing Countries? Energy Econ. 2013, 37, 52–59. [Google Scholar] [CrossRef]
  56. Ekeocha, D.O. Urbanization, inequality, economic development and ecological footprint: Searching for turning points and regional homogeneity in Africa. J. Clean. Prod. 2020, 291, 125244. [Google Scholar] [CrossRef]
  57. Krey, V.; O’Neill, B.C.; van Ruijven, B.; Chaturvedi, V.; Daioglou, V.; Eom, J.; Jiang, L.; Nagai, Y.; Pachauri, S.; Ren, X. Urban and rural energy use and carbon dioxide emissions in Asia. Energy Econ. 2012, 34, S272–S283. [Google Scholar] [CrossRef]
  58. Ma, B. Does urbanization affect energy intensities across provinces in China? Long-run elasticities estimation using dynamic panels with heterogeneous slopes. Energy Econ. 2015, 49, 390–401. [Google Scholar] [CrossRef]
  59. Dong, H.; Xue, M.; Xiao, Y.; Liu, Y. Do carbon emissions impact the health of residents? Considering China’s industrialization and urbanization. Sci. Total Environ. 2020, 758, 143688. [Google Scholar] [CrossRef]
  60. Zhang, C.; Lin, Y. Panel Estimation for Urbanization, Energy Consumption and CO2 Emissions: Are Gional Analysis in China. Energy Policy 2012, 49, 488–498. [Google Scholar] [CrossRef]
  61. Huo, T.; Cao, R.; Du, H.; Zhang, J.; Cai, W.; Liu, B. Nonlinear influence of urbanization on China’s urban residential building carbon emissions: New evidence from panel threshold model. Sci. Total Environ. 2021, 772, 145058. [Google Scholar] [CrossRef]
  62. Lv, Q.; Liu, H.; Yang, D.; Liu, H. Effects of Urbanization on Freight Transport Carbon Emissions in China: Common Characteristics and Regional Disparity. J. Clean. Prod. 2019, 211, 481–489. [Google Scholar] [CrossRef]
  63. Xin, C.; Zhang, T.; Tsai, S.-B.; Zhai, Y.-M.; Wang, J. An Empirical Study on Greenhouse Gas Emission Calculations under Different Municipal Solid Waste Management Strategies. Appl. Sci. 2020, 10, 1673. [Google Scholar] [CrossRef] [Green Version]
  64. Pawłowski, A.; Pawłowska, M.; Pawłowski, L. Mitigation of Greenhouse Gases Emissions by Management of Terrestrial Ecosystem. Ecol. Chem. Eng. 2017, 24, 213–221. [Google Scholar] [CrossRef] [Green Version]
  65. Xu, B.; Lin, B. Differences in regional emissions in China’s transport sector: Determinants and reduction strategies. Energy 2016, 95, 459–470. [Google Scholar] [CrossRef]
  66. Han, J.; Meng, X.; Zhou, X.; Yi, B.; Liu, M.; Xiang, W.N. A Long-Term Analysis of Urbanization Process, Landscape Change, and Carbon Sources and Sinks: A Case Study in China’s Yangtze River Delta Region. J. Clean. Prod. 2017, 141, 1040–1050. [Google Scholar] [CrossRef]
  67. Tao, Y.; Li, F.; Wang, R.; Zhao, D. Effects of land use and cover change on terrestrial carbon stocks in urbanized areas: A study from Changzhou, China. J. Clean. Prod. 2015, 103, 651–657. [Google Scholar] [CrossRef]
  68. Sadik-Zada, E.R.; Loewenstein, W. Drivers of CO2-Emissions in Fossil Fuel Abundant Settings: (Pooled) Mean Group and Nonparametric Panel Analyses. Energies 2020, 13, 3956. [Google Scholar] [CrossRef]
  69. Lee, J.; Robinson, P.M. Panel nonparametric regression with fixed effects. J. Econom. 2015, 188, 346–362. [Google Scholar] [CrossRef] [Green Version]
Figure 1. An integrated model of the relationship between urbanization and carbon dioxide emissions.
Energies 14 07430 g001
Figure 2. Locations of the sample cities.
Energies 14 07430 g002
Figure 3. Moderating effect of GDP per capita.
Energies 14 07430 g003
Figure 4. Moderating effect of industrial transformation.
Energies 14 07430 g004
Figure 5. Moderating effect of R&D spending.
Energies 14 07430 g005
Figure 6. Moderating effect of patents.
Energies 14 07430 g006
Figure 7. Moderating effect of education.
Energies 14 07430 g007
Figure 8. Moderating effect of culture.
Energies 14 07430 g008
Figure 9. Moderating effect of family size.
Energies 14 07430 g009
Figure 10. Moderating effect of infrastructure.
Energies 14 07430 g010
Figure 11. Moderating effect of transportation.
Energies 14 07430 g011
Figure 12. Moderating effect of wastewater.
Energies 14 07430 g012
Table 1. Key variables and measures of the integrated model for the relationship between urbanization and CO2.
ClusterVariableMeasure
Environmental outcomeCO2 emissionsCarbon dioxide emission inventory generated by the fuel combustion of a city (Mt)
UrbanizationUrbanization rateThe percentage of the urban population in the overall population of a city (%)
Economic processesGDP per capitaGross domestic product per capita in a city (CNY 10,000)
IncomeIncome of urban residents (CNY 10,000)
FDIThe sum of foreign direct investment of a city (USD 10,000)
Industrial transformationIncrease in the share of tertiary industry in a city (%)
R&D spendingThe aggregate of R&D expenditure of all high-tech firms in a city (CNY 10,000)
PatentsThe accumulative number of patents applied for by all high-tech firms in a city (pieces)
Social processesEducationEducated population of a city (10,000 persons)
HealthcareThe number of employed personnel in healthcare institutions by city (10,000 persons)
Culture The number of libraries and museums of a city (units)
Family sizeAverage family size (persons/household)
Senior citizensPopulation aged 65 and over (persons)
Environmental processesInfrastructureThe amount of gas supply of a city (km)
TransportationThe number of passengers carried by the public transportation services of a city (10,000 passengers)
Natural reservesPercentage of nature reserves in a city (%)
WastewaterTotal volume of wastewater discharge (10,000 tons)
Waste gasTotal volume of industrial waste gas emission (100 million m3)
Solid wastesVolume industrial solid wastes produced (10,000 tons)
Table 2. Descriptive statistics and correlations.
Variable NameMeanS.D.MinMax12345678910111213141516171819
1 CO2 emissions23617818421.00
2 Urbanization rate511523890.081.00
3 GDP per capita342721640.260.651.00
4 Industrial transformation0.812.08−79.10−0.140.420.681.00
5 FDI539668135750.540.540.630.291.00
6 Income19124730.260.690.710.690.561.00
7 R&D spending25340012705−0.490.460.520.510.790.711.00
8 Patents224470332−0.460.410.570.330.760.600.891.00
9 Education2116−0.030.620.580.680.340.510.420.211.00
10 Culture67049−0.400.350.400.320.690.530.840.790.241.00
11 Healthcare2101910.51−0.17−0.04−0.230.500.050.450.45−0.190.551.00
12 Family size3024−0.25−0.50−0.45−0.45−0.41−0.51−0.42−0.30−0.62−0.27−0.031.00
13 Senior citizens924160.240.410.430.310.420.420.390.280.450.370.24−0.571.00
14 Infrastructure11130890.560.440.440.350.500.450.450.560.350.590.47−0.450.591.00
15 Transportation6604913029980.67−0.060.07−0.200.390.160.480.53−0.090.620.69−0.030.220.461.00
16 Natural reserves96130−0.37−0.08−0.15−0.06−0.31−0.19−0.28−0.29−0.12−0.30−0.420.09−0.14−0.20−0.431.00
17 Wastewater14615239380.640.240.330.110.540.510.790.810.070.870.70−0.220.290.720.56−0.361.00
18 Waste gas770450.52−0.100.04−0.210.130.120.070.01−0.130.310.35−0.070.080.200.31−0.100.271.00
19 Solid wastes1383480.220.510.710.700.550.990.690.580.520.700.01−0.530.410.620.13−0.130.490.071.00
Note: 1820 observations.
Table 3. Variation inflation factor (VIF) statistics.
VariableVIF1/VIF
ln (Urbanization rate)2.730.3663
ln (GDP per capita)6.510.1536
ln (Industrial transformation)5.490.1821
ln (FDI)4.770.2096
ln (Income)5.620.1779
ln (R&D spending)4.090.2445
ln (Patents)2.550.3922
ln (Education)7.590.1318
ln (Culture)1.990.5025
ln (Healthcare)2.720.3676
ln (Family size)6.130.1631
ln (Senior citizens)2.780.3597
ln (Infrastructure)2.430.4115
ln (Transportation)1.260.7937
ln (Natural reserves)1.850.5405
ln (Wastewater)2.790.3584
ln (Waste gas)1.680.5952
ln (Solid wastes)5.580.1792
Mean VIF3.81
Note: 1820 observations.
Table 4. Moderating effects of economic factors on the relationship between urbanization and carbon dioxide emissions.
DV: CO2 Emissionst+1Model 1Model 2Model 3Model 4Model 5Model 6Model 7Model 8
ln (Urbanization rate) × 0.005 ** 0.003 **
ln (GDP per capita) (0.002) (0.002)
ln (Urbanization rate) × −0.263 ** −0.215 **
ln (Industrial transformation) (0.111) (0.101)
ln (Urbanization rate) × 0.269 * 0.185
ln (FDI) (0.145) (0.209)
ln (Urbanization rate) × 0.288 −3.373
ln (Income) (0.375) (2.981)
ln (Urbanization rate) × −0.002 ** −0.086
ln (R&D spending) (0.000) (0.085)
ln (Urbanization rate) × −0.058 ***−0.454
ln (Patents) (0.006)(0.317)
ln (Urbanization rate)0.055 **0.001 *0.0020.049 **−0.0540.005 ***0.004 ***0.037 *
(0.024)(0.002)(0.001)(0.020)(0.193)(0.000)(0.000)(0.021)
ln (Urbanization rate)2−0.038 ***
(0.012)
ln (GDP per capita)0.0010.131 **0.068 **1.6041.1860.0030.023−3.228
(0.001)(0.044)(0.025)(1.753)(1.575)(0.021)(0.019)(3.748)
ln (Industrial transformation)−0.051 ***−0.050 ***−0.054 ***−3.065 **−0.049 **−0.092 ***−0.085 ***−2.896 **
(0.011)(0.011)(0.011)(1.261)(0.021)(0.013)(0.013)(1.229)
ln (FDI)−0.002−0.001−0.0020.998 ***3.025 **0.006 **0.007 **0.999 ***
(0.002)(0.001)(0.001)(0.000)(1.258)(0.003)(0.003)(0.000)
ln (Income)0.0130.0100.008−0.0450.999 ***−0.005−0.0020.183
(0.028)(0.026)(0.026)(0.188)(0.000)(0.018)(0.018)(0.189)
ln (R&D spending)−0.003 **−0.003 ***−0.003 **−1.001 ***−1.001 ***−0.004 ***−0.003 ***1.001 ***
(0.002)(0.002)(0.002)(0.002)(0.002)(0.001)(0.001)(0.002)
ln (Patents)−0.027 ***−0.030 ***0.0110.6220.5990.023−0.058 ***0.452
(0.008)(0.008)(0.011)(0.425)(0.409)(0.026)(0.007)(0.317)
ln (Education)−0.012−0.014−0.0120.0380.0400.0040.002−0.173
(0.026)(0.028)(0.028)(0.185)(0.187)(0.018)(0.018)(0.185)
ln (Culture)0.0740.125−0.394 ***−0.370 ***−0.412 ***−1.816 *−1.998 *−0.445 ***
(0.084)(0.137)(0.069)(0.063)(0.077)(1.022)(1.022)(0.087)
ln (Healthcare)−0.021 **0.095−0.078 **−0.092 **−0.137 **−0.171 **−0.117 **−0.185 ***
(0.007)(0.074)(0.038)(0.039)(0.044)(0.053)(0.050)(0.050)
ln (Family size)−0.148 **−0.195 ***−0.216 ***−0.224 ***−0.203 ***−0.112 ***−0.113 ***−0.171 ***
(0.044)(0.025)(0.014)(0.014)(0.014)(0.014)(0.016)(0.017)
ln (Senior citizens)−0.026 *−0.261 *−0.060−0.065−0.014−0.020 ***−0.020 ***0.045
(0.014)(0.151)(0.080)(0.075)(0.086)(0.005)(0.005)(0.099)
ln (Infrastructure)0.001−0.172 **0.0170.007−0.016−0.022 ***−0.022 ***−0.045
(0.001)(0.081)(0.041)(0.040)(0.044)(0.002)(0.002)(0.052)
ln (Transportation)−0.003−0.150 ***−0.085 ***−0.084 ***−0.090 ***−0.136 ***−0.137 ***−0.102 ***
(0.002)(0.031)(0.014)(0.011)(0.013)(0.011)(0.011)(0.017)
ln (Natural reserves)0.134−0.028 ***−0.015 ***−0.015 ***−0.018 ***0.0000.000−0.017 ***
(0.272)(0.007)(0.004)(0.002)(0.005)(0.000)(0.000)(0.003)
ln (Wastewater)−0.2880.021 ***0.021 ***0.021 ***0.021 ***−0.004−0.0040.021 ***
(0.275)(0.003)(0.002)(0.002)(0.002)(0.011)(0.011)(0.003)
ln (Waste gas)0.0090.248 ***0.142 ***0.143 ***0.165 ***−0.126−0.1160.198 ***
(0.026)(0.020)(0.011)(0.010)(0.012)(0.149)(0.149)(0.013)
ln (Solid wastes)0.370 **0.0020.0010.0010.001−0.001−0.0010.001
(0.166)(0.006)(0.000)(0.000)(0.000)(0.004)(0.004)(0.000)
Constant0.0640.0640.0661.712 *1.724 *−3.749 ***−2.767 ***0.234 ***
(0.091)(0.093)(0.093)(0.875)(0.878)(0.719)(0.691)(0.075)
Number of obs.18201820182018201820182018201820
R20.0620.1530.1540.1540.1550.24840.24830.111
Hausman testChi2(19) = 31.14 **Chi2(19) = 33.29 ***Chi2(19) = 31.83 **Chi2(19) = 33.85 **Chi2(19) = 36.45 ***Chi2(19) = 32.57 **Chi2(19) = 36.10 **Chi2(24) = 38.34 **
Notes: Standard errors are in parentheses. * Denotes significance at the 10% level; ** denotes significance at the 5% level; *** denotes significance at the 1% level.
Table 5. Moderating effects of social factors on the relationship between urbanization and carbon dioxide emissions.
Model 1Model 2Model 3Model 4Model 5Model 6
ln (Urbanization rate) × −0.154 * −0.205 ***
ln (Education)(0.088) (0.015)
ln (Urbanization rate) × −1.804 ** 0.055
ln (Culture) (0.834) (0.041)
ln (Urbanization rate) × 0.002 −0.026
ln (Healthcare) (0.009) (0.024)
ln (Urbanization rate) × −0.076 ** −0.089 **
ln (Family size) (0.029) (0.029)
ln (Urbanization rate) × 0.051−0.220
ln (Senior citizens) (0.048)(0.328)
ln (Urbanization rate)0.2720.407 *0.199 *0.1490.049 **−0.083
(0.382)(0.219)(0.121)(0.118)(0.021)(0.075)
ln (GDP per capita)0.012 ***0.012 ***0.030 ***0.030 ***−1.2120.034
(0.004)(0.004)(0.004)(0.004)(1.584)(0.041)
ln (Industrial transformation)−0.238 *−0.219 *−0.438 ***−0.437 ***−3.025 **−0.085 ***
(0.128)(0.131)(0.118)(0.119)(1.260)(0.013)
ln (FDI)−0.015−0.016−0.0230.032 **0.999 ***0.015 ***
(0.016)(0.016)(0.016)(0.013)(0.000)(0.002)
ln (Income)0.1480.133−0.018−0.0190.0380.021 ***
(0.202)(0.203)(0.097)(0.097)(0.203)(0.002)
ln (R&D spending)−0.044 ***−0.044 ***−0.044 ***−0.042 ***−1.001 ***−0.142 ***
(0.011)(0.011)(0.006)(0.006)(0.002)(0.008)
ln (Patents)0.244 **0.135−0.063−0.066−0.6010.000
(0.115)(0.133)(0.088)(0.088)(0.410)(0.000)
ln (Education)−0.137−0.1240.0210.021−0.026−0.003
(0.201)(0.204)(0.097)(0.097)(0.199)(0.011)
ln (Culture)−0.495 ***−0.478 **−0.495 ***−0.114 *0.098−0.115 *
(0.140)(0.140)(0.140)(0.067)(0.067)(0.065)
ln (Healthcare)−0.154 **−0.149 **−0.154 **−1.320 ***−1.277 ***−1.384 ***
(0.063)(0.065)(0.065)(0.213)(0.213)(0.215)
Ln (Family size)−0.033−0.029−0.032−0.109 ***−0.113 ***−0.108 ***
(0.022)(0.022)(0.022)(0.016)(0.016)(0.016)
ln (Senior citizens)−0.015 **−0.013 **−0.013 **−0.007−0.008 *−0.008
(0.004)(0.004)(0.004)(0.005)(0.005)(0.005)
ln (Infrastructure)−0.020 ***−0.020 ***−0.020 ***−0.018 ***−0.017 ***−0.018 ***
(0.003)(0.003)(0.003)(0.002)(0.002)(0.002)
ln (Transportation)−0.218 ***−0.216 ***−0.217 ***−0.133 ***−0.134 ***−0.134 ***
(0.021)(0.021)(0.021)(0.012)(0.012)(0.012)
ln (Natural reserves)0.001−0.001 ***0.001−0.001 *−0.002 **−0.002 **
(0.002)(0.002)(0.002)(0.001)(0.001)(0.001)
ln (Wastewater)0.0150.0150.0150.0080.0070.007
(0.034)(0.034)(0.034)(0.013)(0.013)(0.013)
ln (Waste gas)0.659 **0.656 **0.657 **0.535 **0.553 ***0.561 ***
(0.285)(0.285)(0.285)(0.157)(0.158)(0.157)
ln (Solid wastes)0.0050.0050.0050.0040.0050.005
(0.006)(0.006)(0.006)(0.004)(0.004)(0.004)
Constant−1.141−1.404 *−1.194−2.412 ***−2.595 ***−2.436 ***
(0.787)(0.785)(0.786)(0.625)(0.615)(0.626)
Number of obs.182018201820182018201820
R20.25720.25760.26080.34030.34010.3402
Hausman testChi2(19) = 30.57 **Chi2(19) = 36.25 ***Chi2(19) = 32.59 **Chi2(19) = 39.22 ***Chi2(19) = 35.56 **Chi2(23) = 38.67 **
Notes: Standard errors are in parentheses. * Denotes significance at the 10% level; ** denotes significance at the 5% level; *** denotes significance at the 1% level.
Table 6. Moderating effects of urban environmental factors on the relationship between urbanization and carbon dioxide emissions.
Model 1Model 2Model 3Model 4Model 5Model 6Model 7
ln (Urbanization rate) ×0.002 *** 0.002 ***
ln (Infrastructure)(0.001) (0.001)
ln (Urbanization rate) × 0.199 *** 0.216 ***
ln (Transportation) (0.052) (0.052)
ln (Urbanization rate) × 0.016 0.193
ln (Natural reserves) (0.013) (0.533)
ln (Urbanization rate) × 0.381 *** 0.016 **
ln (Wastewater) (0.102) (0.004)
ln (Urbanization rate) × −0.098 −0.023
ln (Waste gas) (0.084) (0.026)
ln (Urbanization rate) × 3.0150.097
ln (Solid wastes) (2.583)(0.217)
ln (Urbanization rate)0.502 **0.514 **0.1140.402 **0.354 *−0.0670.499 **
(0.245)(0.245)(0.131)(0.133)(0.202)(0.075)(0.245)
ln (GDP per capita)−0.035−0.0190.028 ***0.026 ***0.012 ***0.014−0.035
(0.052)(0.050)(0.002)(0.004)(0.004)(0.040)(0.052)
ln (Industrial transformation)−0.050 **−0.050 **−0.436 ***−0.391 **−0.238 *−0.086 ***−0.051 **
(0.022)(0.022)(0.117)(0.116)(0.128)(0.013)(0.022)
ln (FDI)0.015 ***0.016 ***0.032 **0.028 **−0.0150.017 ***0.016 ***
(0.005)(0.005)(0.013)(0.011)(0.016)(0.004)(0.005)
ln (Income)0.033 ***0.033 ***−0.018−0.0340.1380.021 ***0.033 ***
(0.003)(0.003)(0.094)(0.097)(0.204)(0.002)(0.003)
ln (R&D spending)−0.172 ***−0.172 ***−0.049 ***−0.044 ***0.046 ***0.144 ***−0.173 ***
(0.015)(0.015)(0.011)(0.009)(0.011)(0.010)(0.015)
ln (Patents)−0.002−0.002−0.021−0.381 ***−0.248 **0.001−0.002
(0.002)(0.002)(0.092)(0.102)(0.113)(0.001)(0.002)
ln (Education)−0.015−0.0150.0220.036−0.128−0.003−0.015
(0.016)(0.016)(0.096)(0.097)(0.205)(0.011)(0.016)
ln (Culture)−0.537 **−0.532 **−0.502 **−0.514 **−0.497 **−0.114 *−0.532 **
(0.206)(0.206)(0.245)(0.245)(0.243)(0.067)(0.206)
ln (Healthcare)0.0020.002−0.035−0.019−0.035−1.322 ***0.002
(0.008)(0.008)(0.052)(0.050)(0.052)(0.215)(0.008)
ln (Family size)−0.197 ***−0.196 ***−0.050 **−0.050 **−0.051 **−0.109 ***−0.196 ***
(0.053)(0.053)(0.022)(0.022)(0.022)(0.016)(0.053)
ln (Senior citizens)0.0980.113 *−0.015 ***−0.016 ***−0.016 ***−0.0090.005
(0.065)(0.065)(0.005)(0.005)(0.005)(0.007)(0.011)
ln (Infrastructure)−1.275 ***−1.384 ***−0.031 ***−0.033 ***−0.033 ***−0.018 ***−0.553 ***
(0.211)(0.215)(0.001)(0.003)(0.003)(0.002)(0.158)
ln (Transportation)−0.113 ***−0.108 ***−0.172 ***−0.172 ***−0.173 ***−0.133 ***0.005
(0.016)(0.016)(0.015)(0.015)(0.015)(0.012)(0.002)
ln (Natural reserves)−0.008 *−0.008−0.002−0.002−0.0020.001 *−0.228 **
(0.005)(0.005)(0.002)(0.002)(0.002)(0.001)(0.088)
ln (Wastewater)0.016 ***0.017 ***−0.015−0.015−0.0150.0080.007
(0.001)(0.001)(0.016)(0.016)(0.016)(0.013)(0.013)
ln (Waste gas)0.134 ***0.134 ***0.537 **0.532 **0.532 **0.535 **0.561 ***
(0.012)(0.012)(0.206)(0.206)(0.206)(0.157)(0.157)
ln (Solid wastes)0.002 **0.002 **0.0020.0020.0020.0040.003
(0.001)(0.001)(0.008)(0.008)(0.008)(0.004)(0.004)
Constant−2.987 ***−2.960 ***−1.141−1.404 *−1.194−2.412 ***−2.930 ***
(0.633)(0.642)(0.787)(0.785)(0.786)(0.625)(0.642)
Number of obs.1820182018201820182018201820
R20.34070.34010.34770.27160.27250.14010.3406
Hausman testChi2(19) = 28.57 *Chi2(19) = 37.32 ***Chi2(19) = 38.62 ***Chi2(19) = 33.35 **Chi2(19) = 31.47 **Chi2(19) = 33.08 **Chi2(24) = 37.40 **
Notes: Standard errors are in parentheses. * Denotes significance at the 10% level; ** denotes significance at the 5% level; *** denotes significance at the 1% level.
Publisher’s Note: MDPI stays neutral with regard to jurisdictional claims in published maps and institutional affiliations.

