
Heat Dissipation in Variable Underground Power Cable Beddings: Experiences from a Real Scale Field Experiment

 , ,
, ,
Abstract
:1. Introduction
1.1. Thermal Cable Rating
1.2. Investigation of the Bedding’s Influence on the Heat Dissipation of Underground Power Cables
2. Materials and Methods
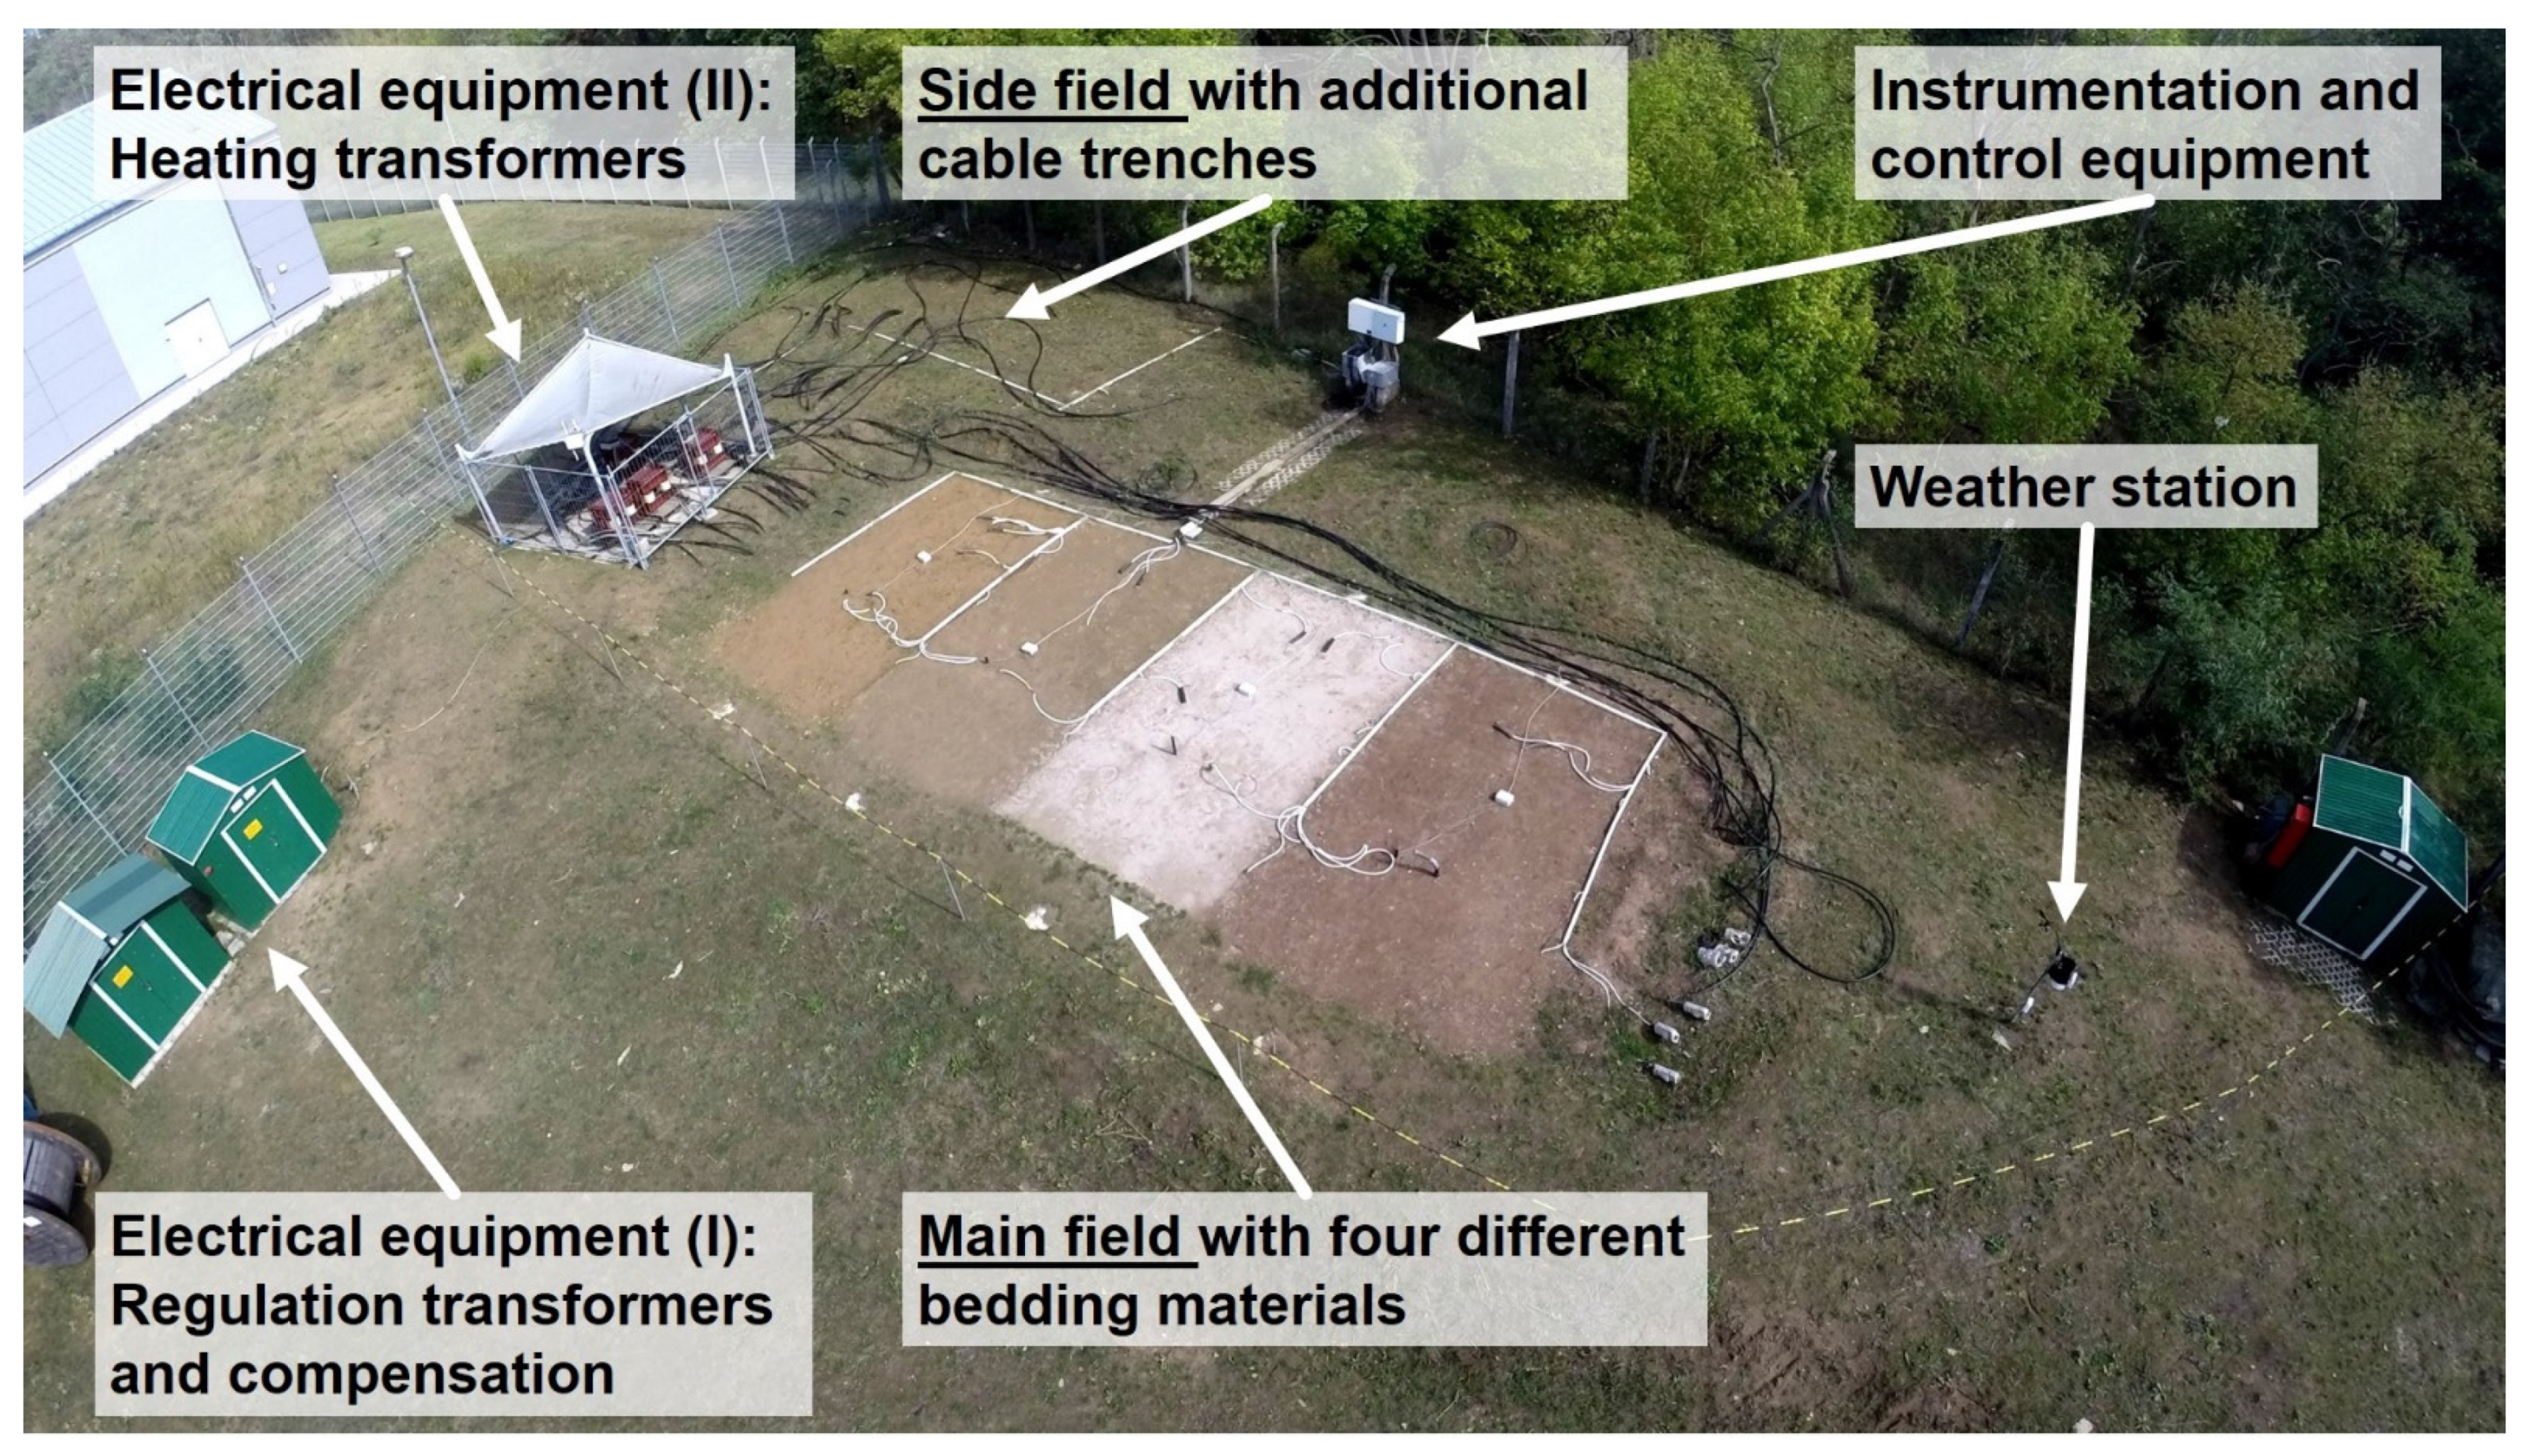
2.1. Experimental Setup
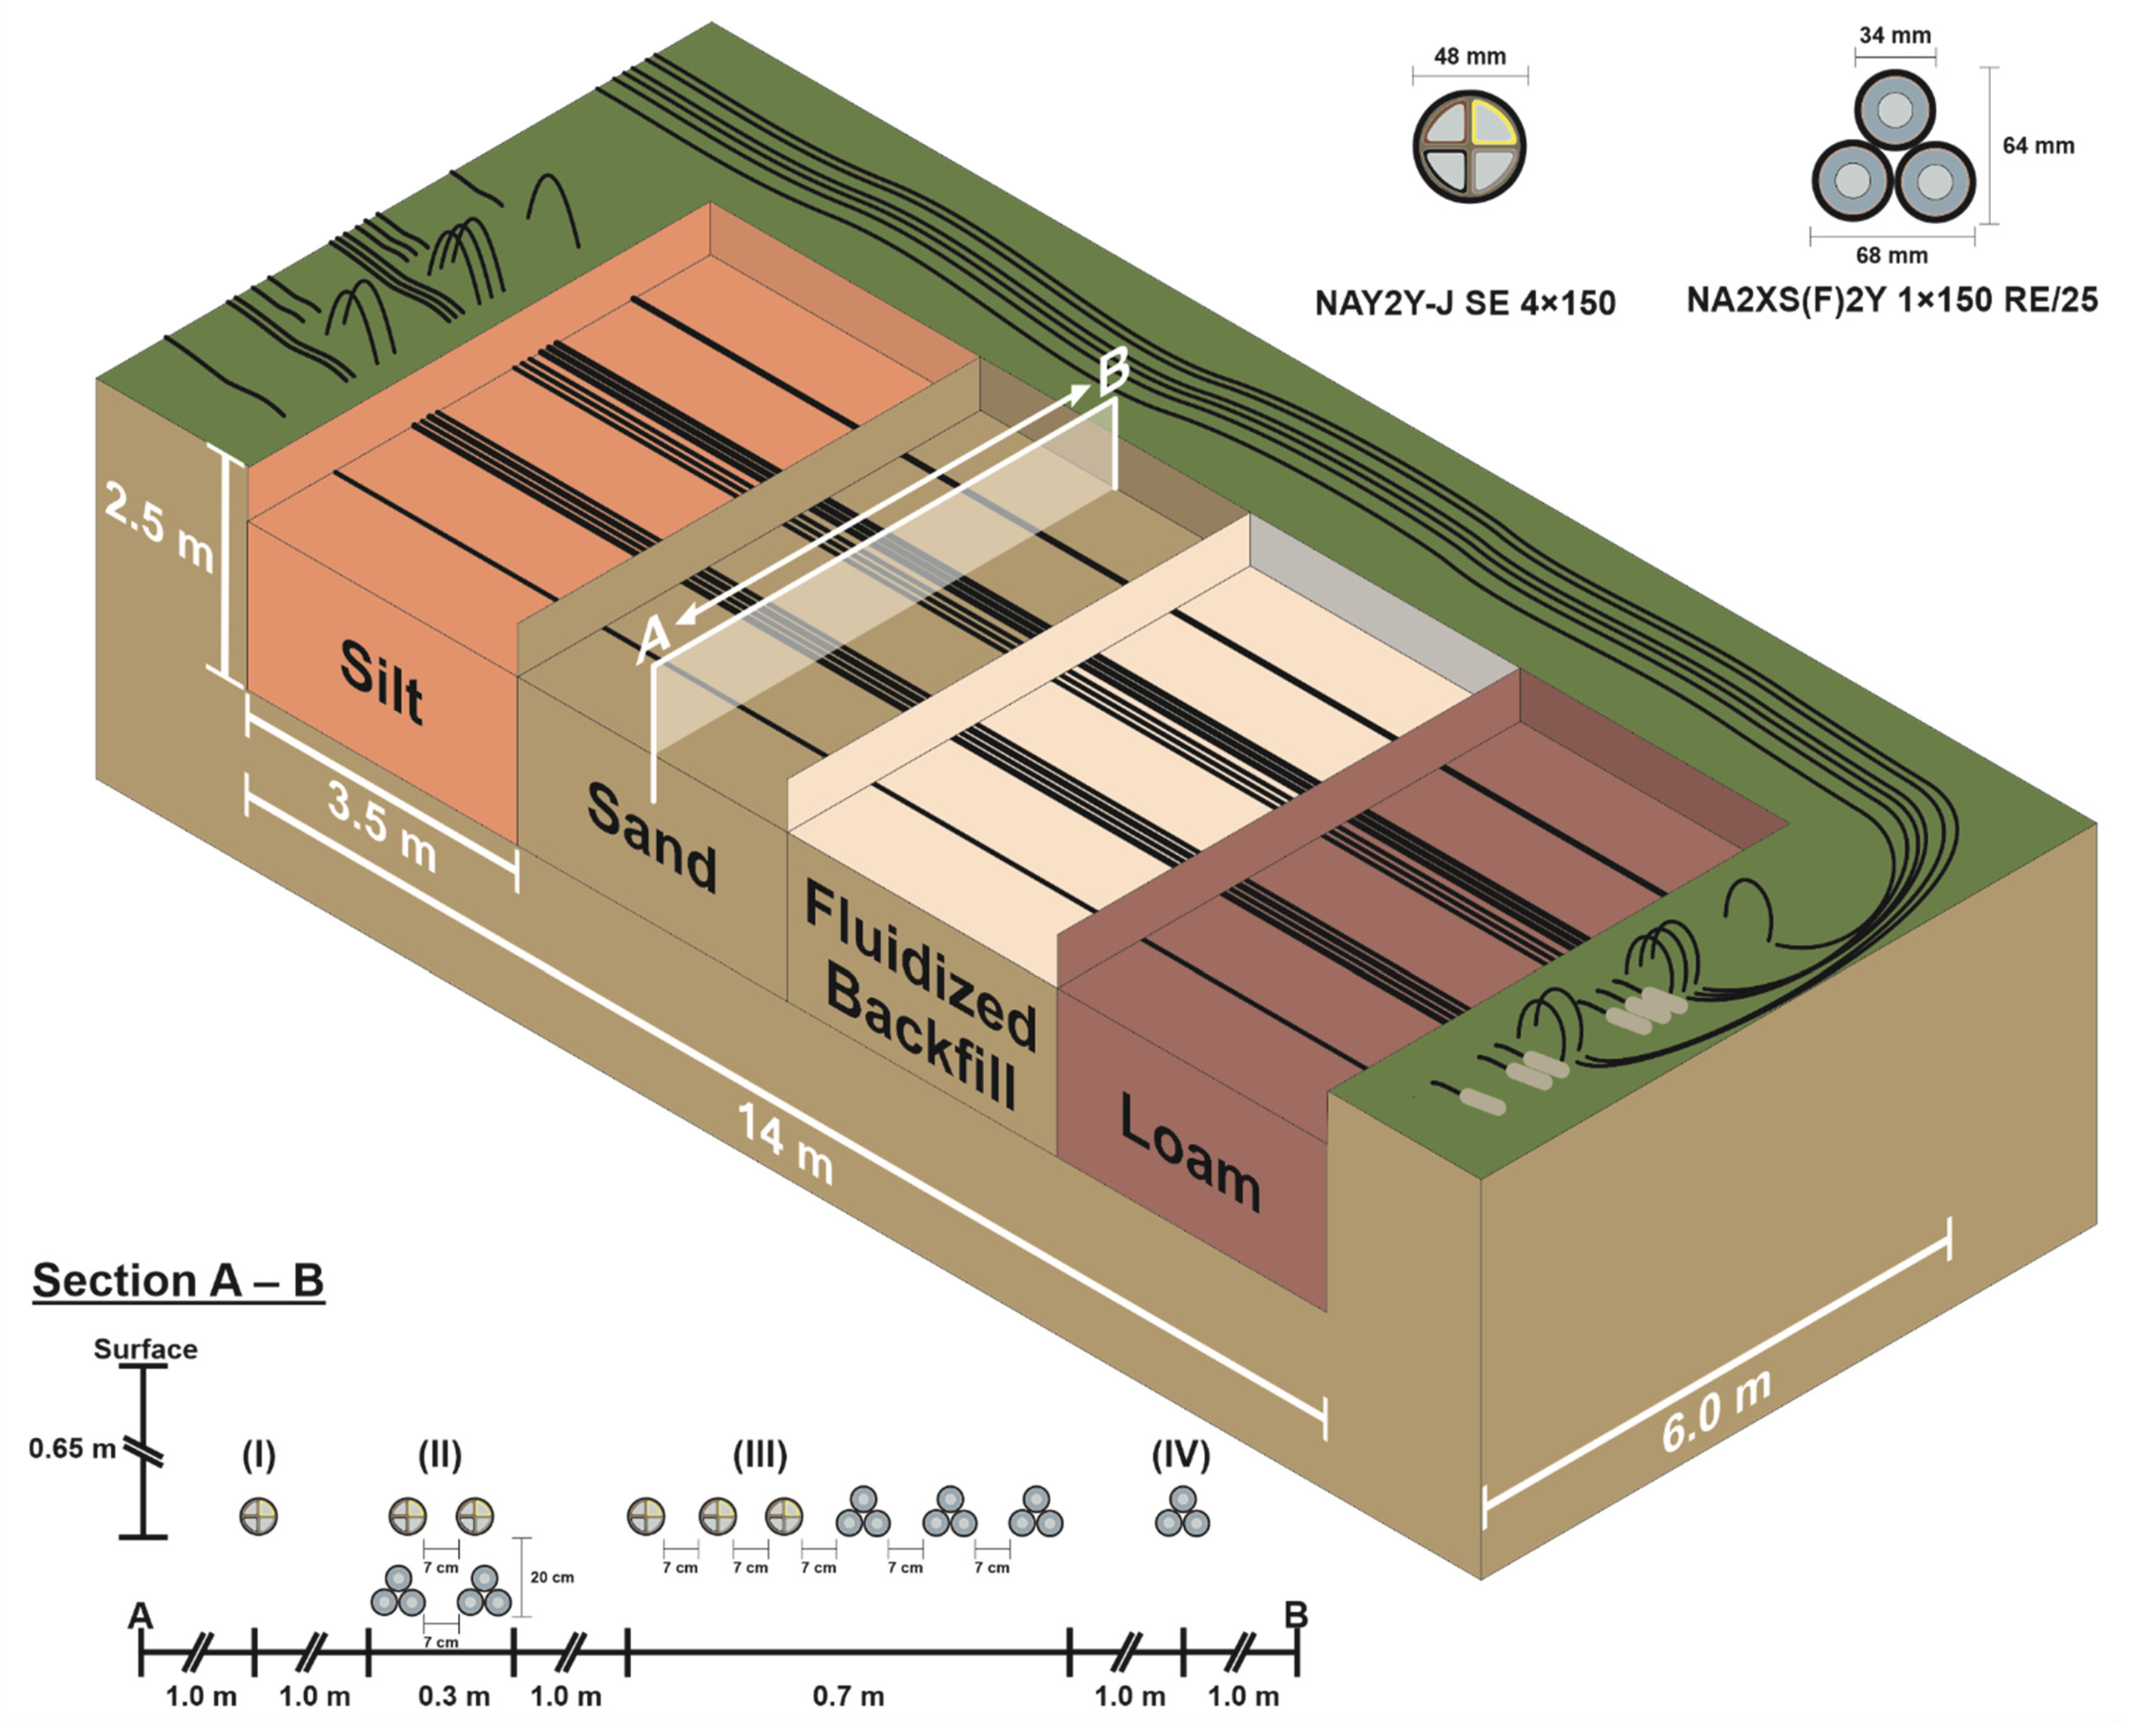
2.1.1. Main Field
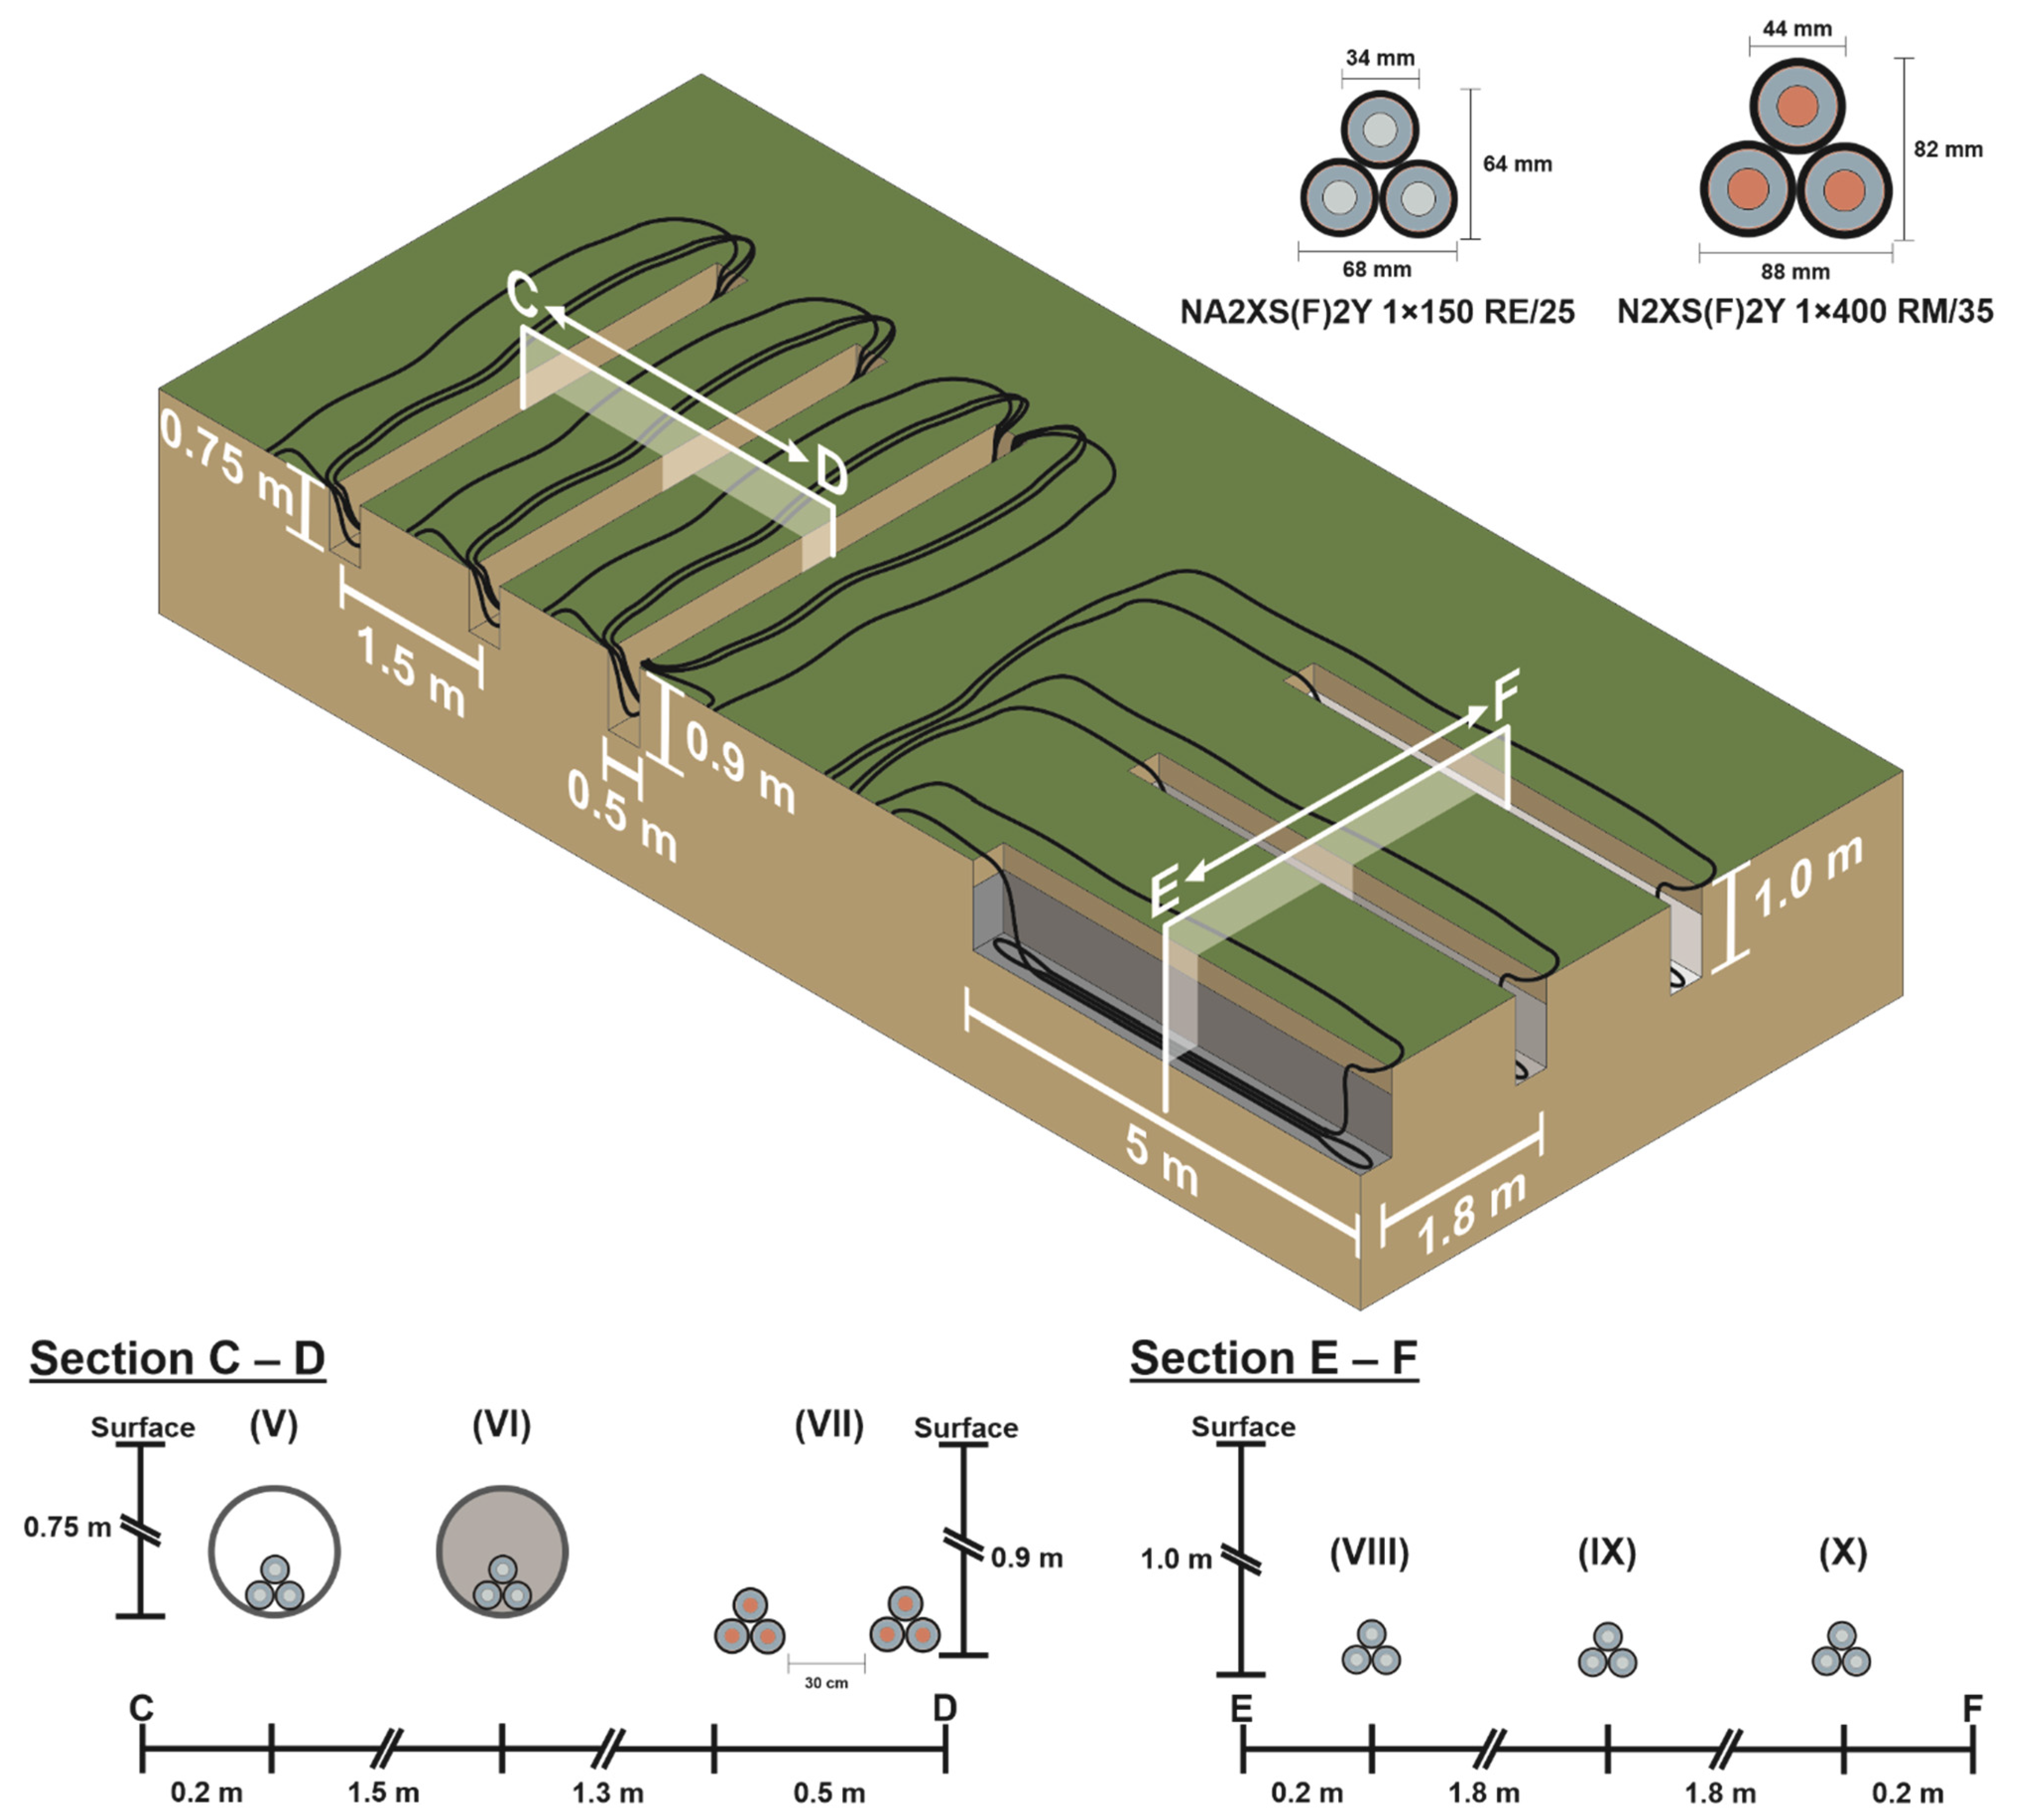
2.1.2. Side Field
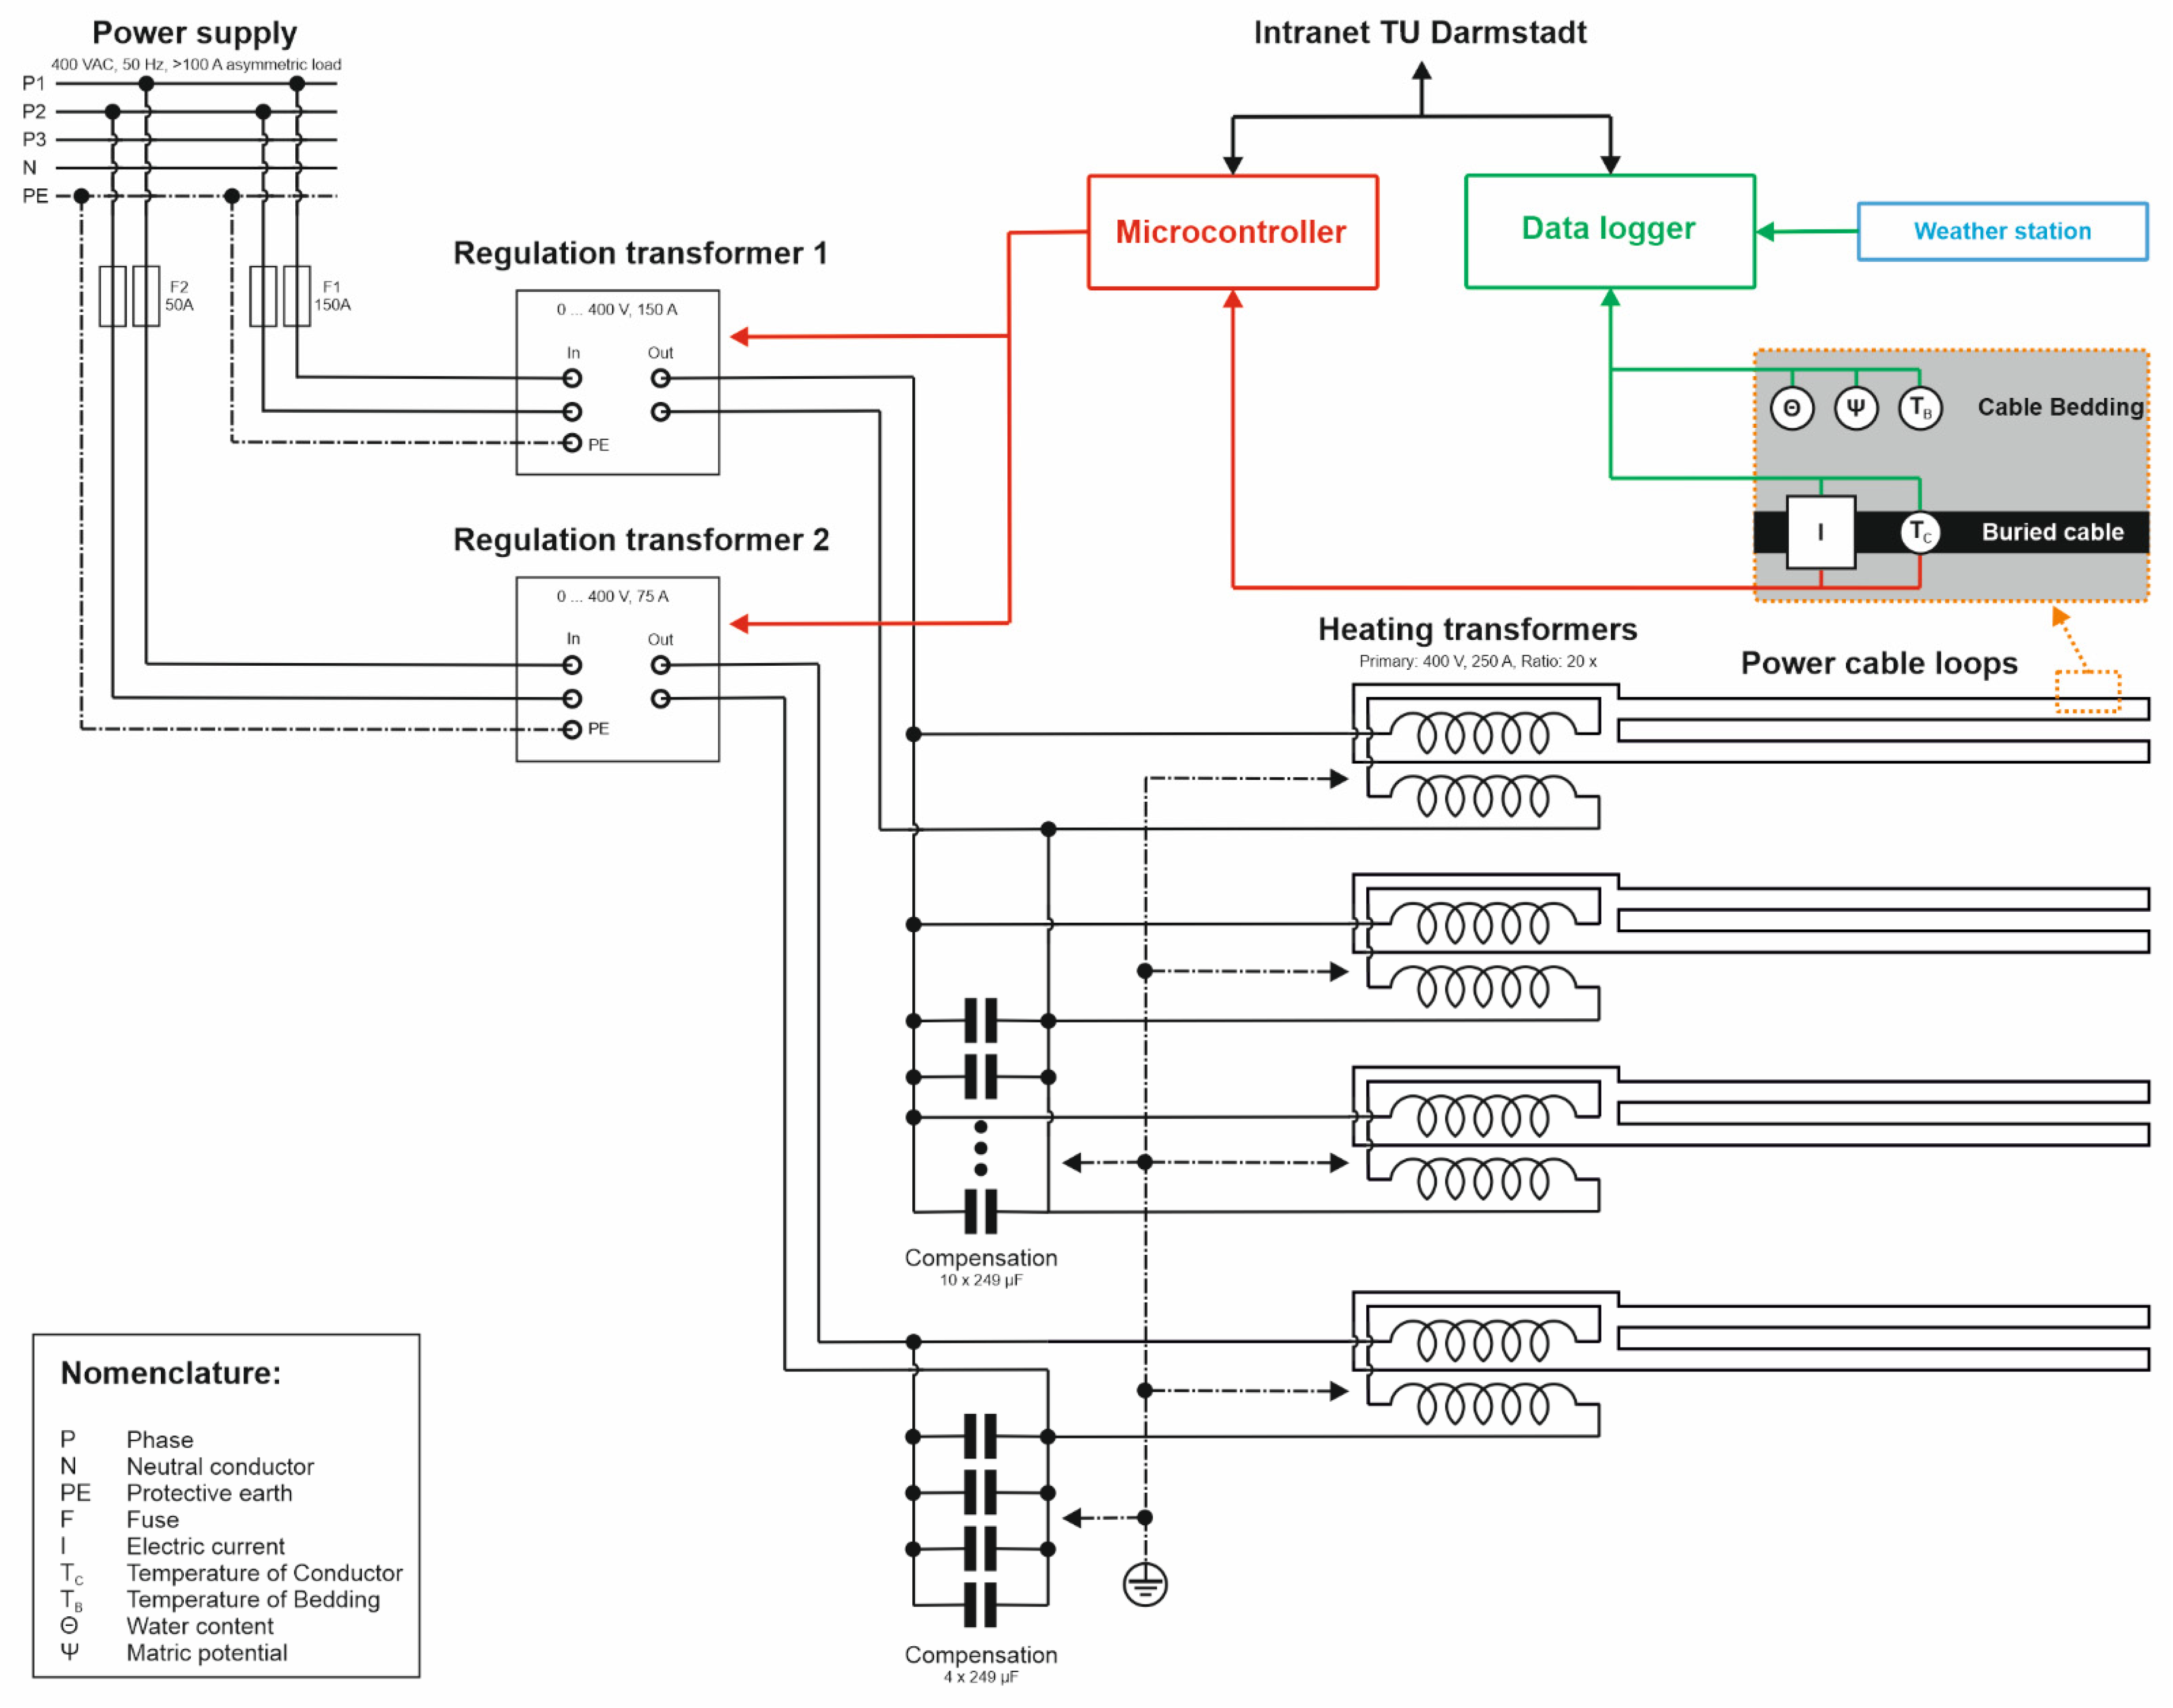
2.1.3. Electrical Equipment and Cable Operation
2.1.4. Monitoring Strategy and Equipment
2.2. Load Profiles
2.2.1. Constant Scenario
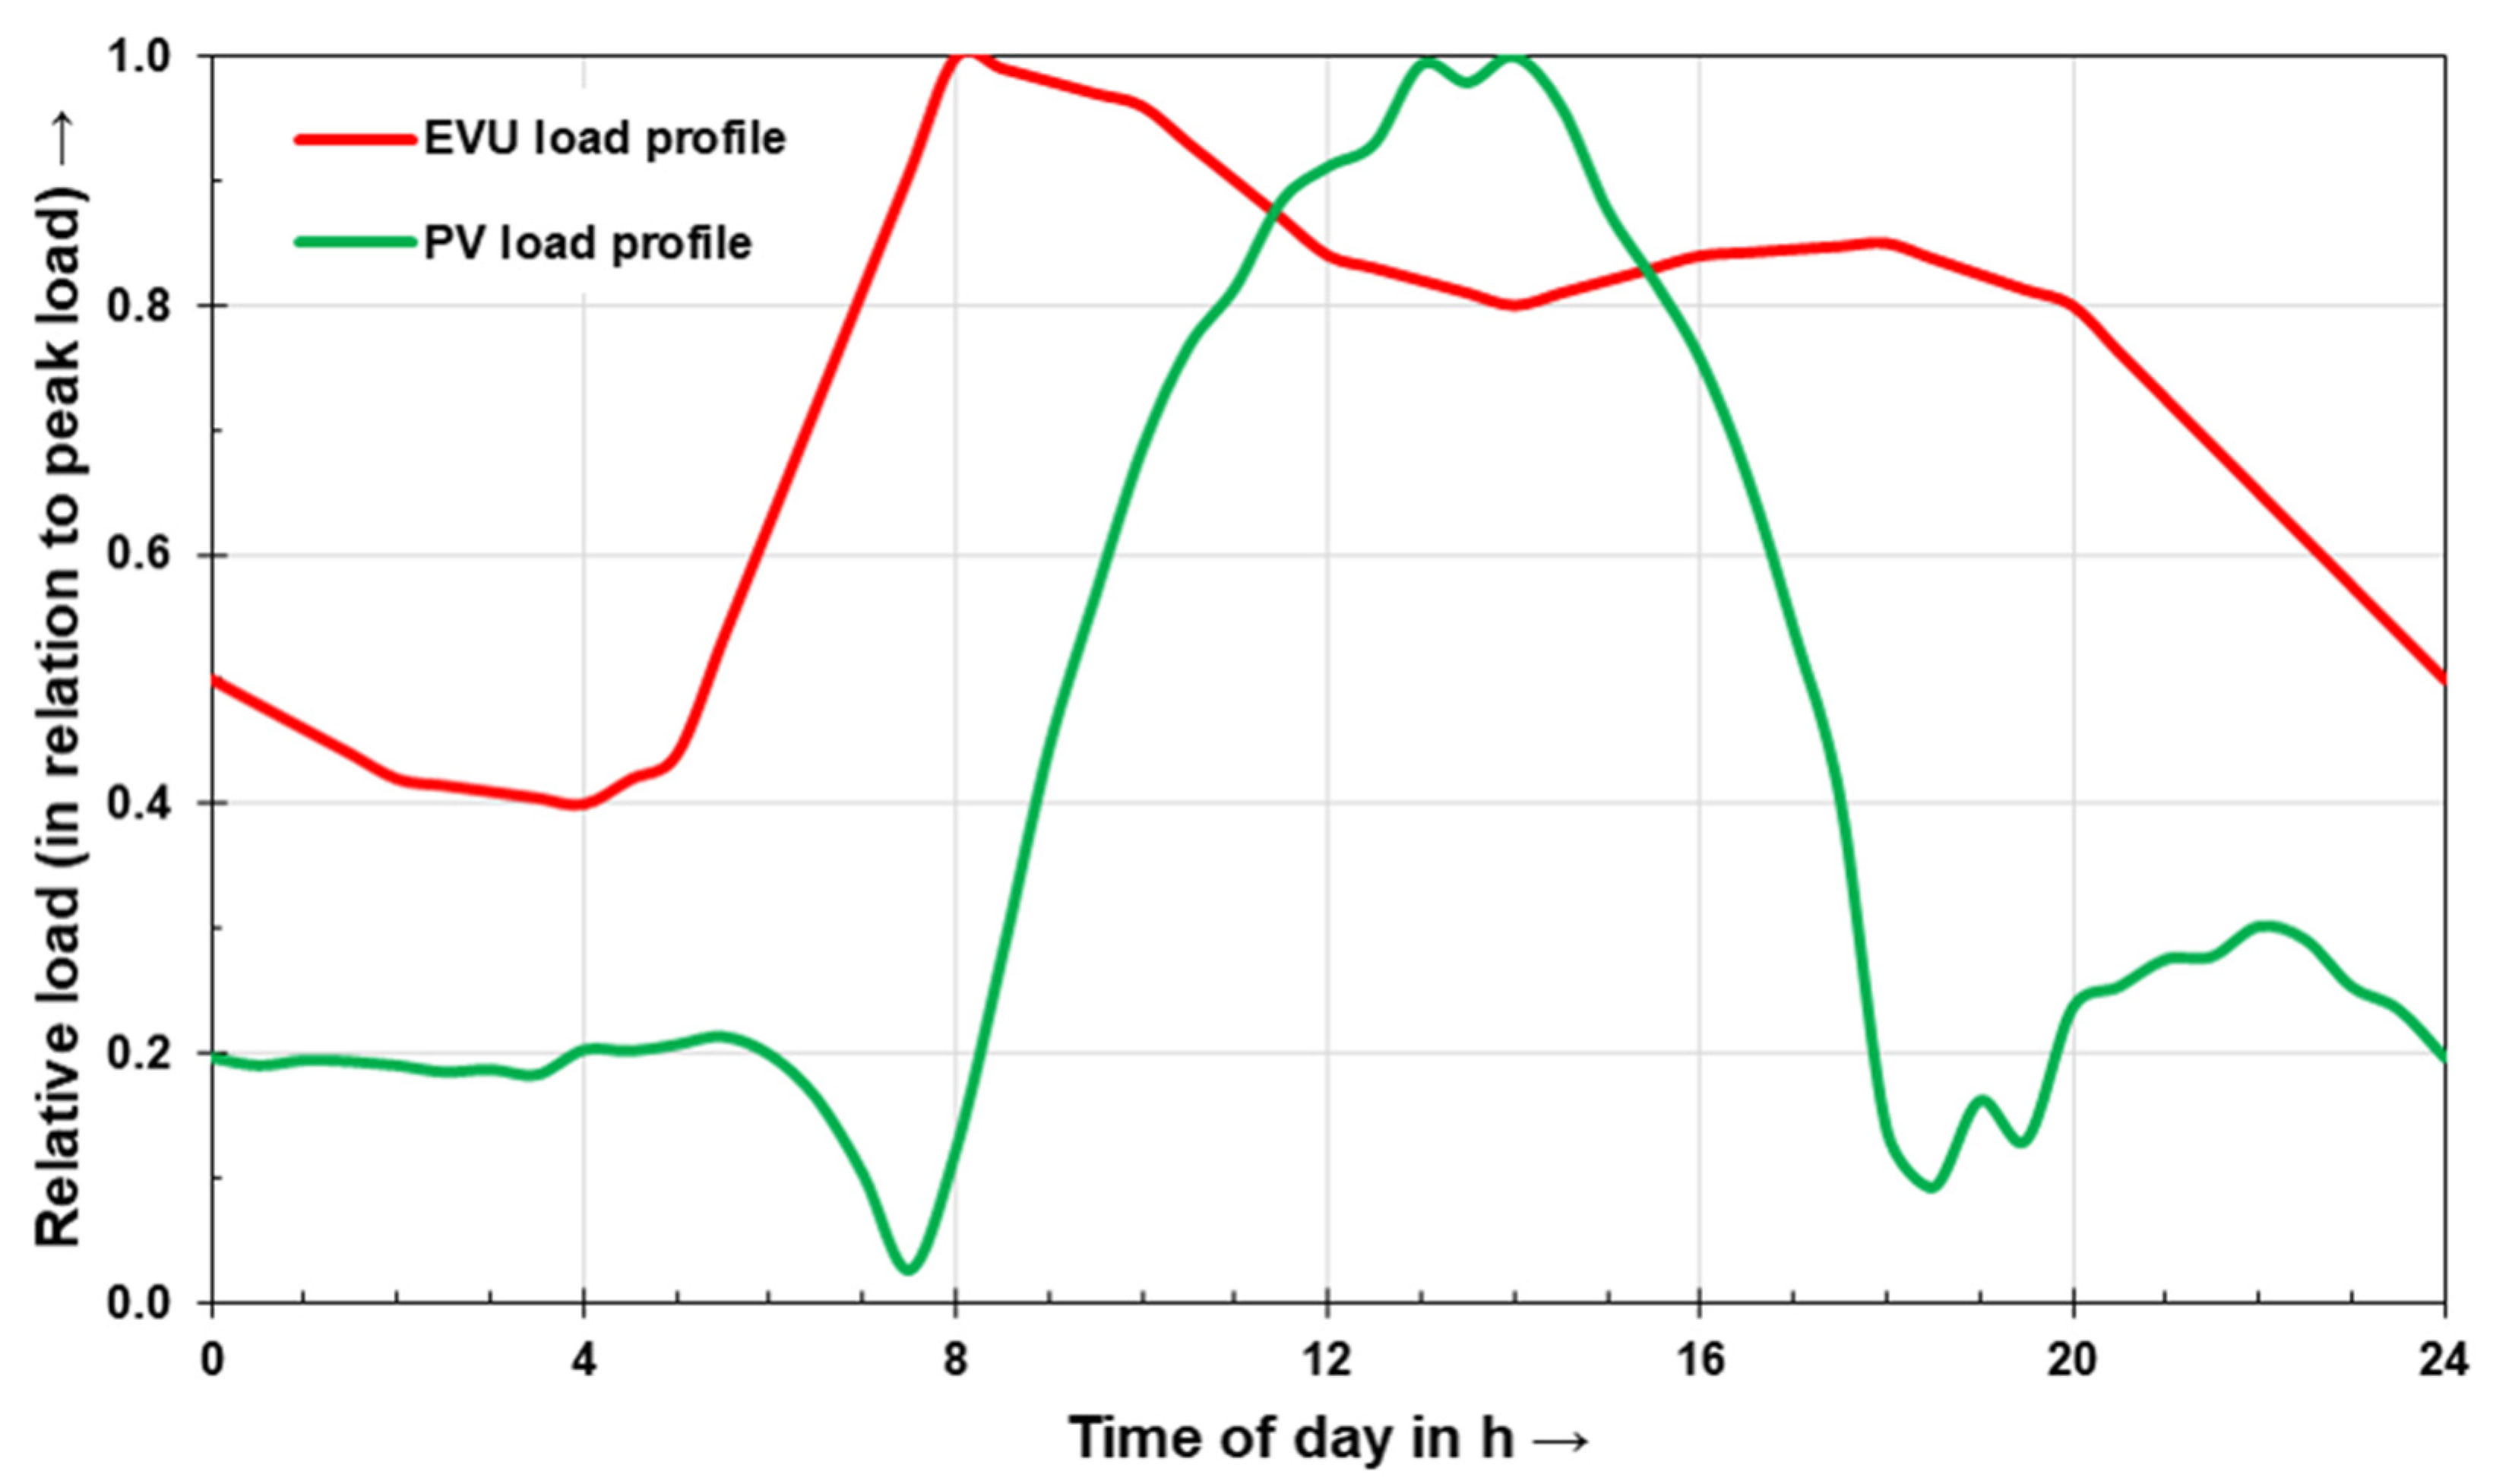
2.2.2. Dynamic Scenario
3. Results
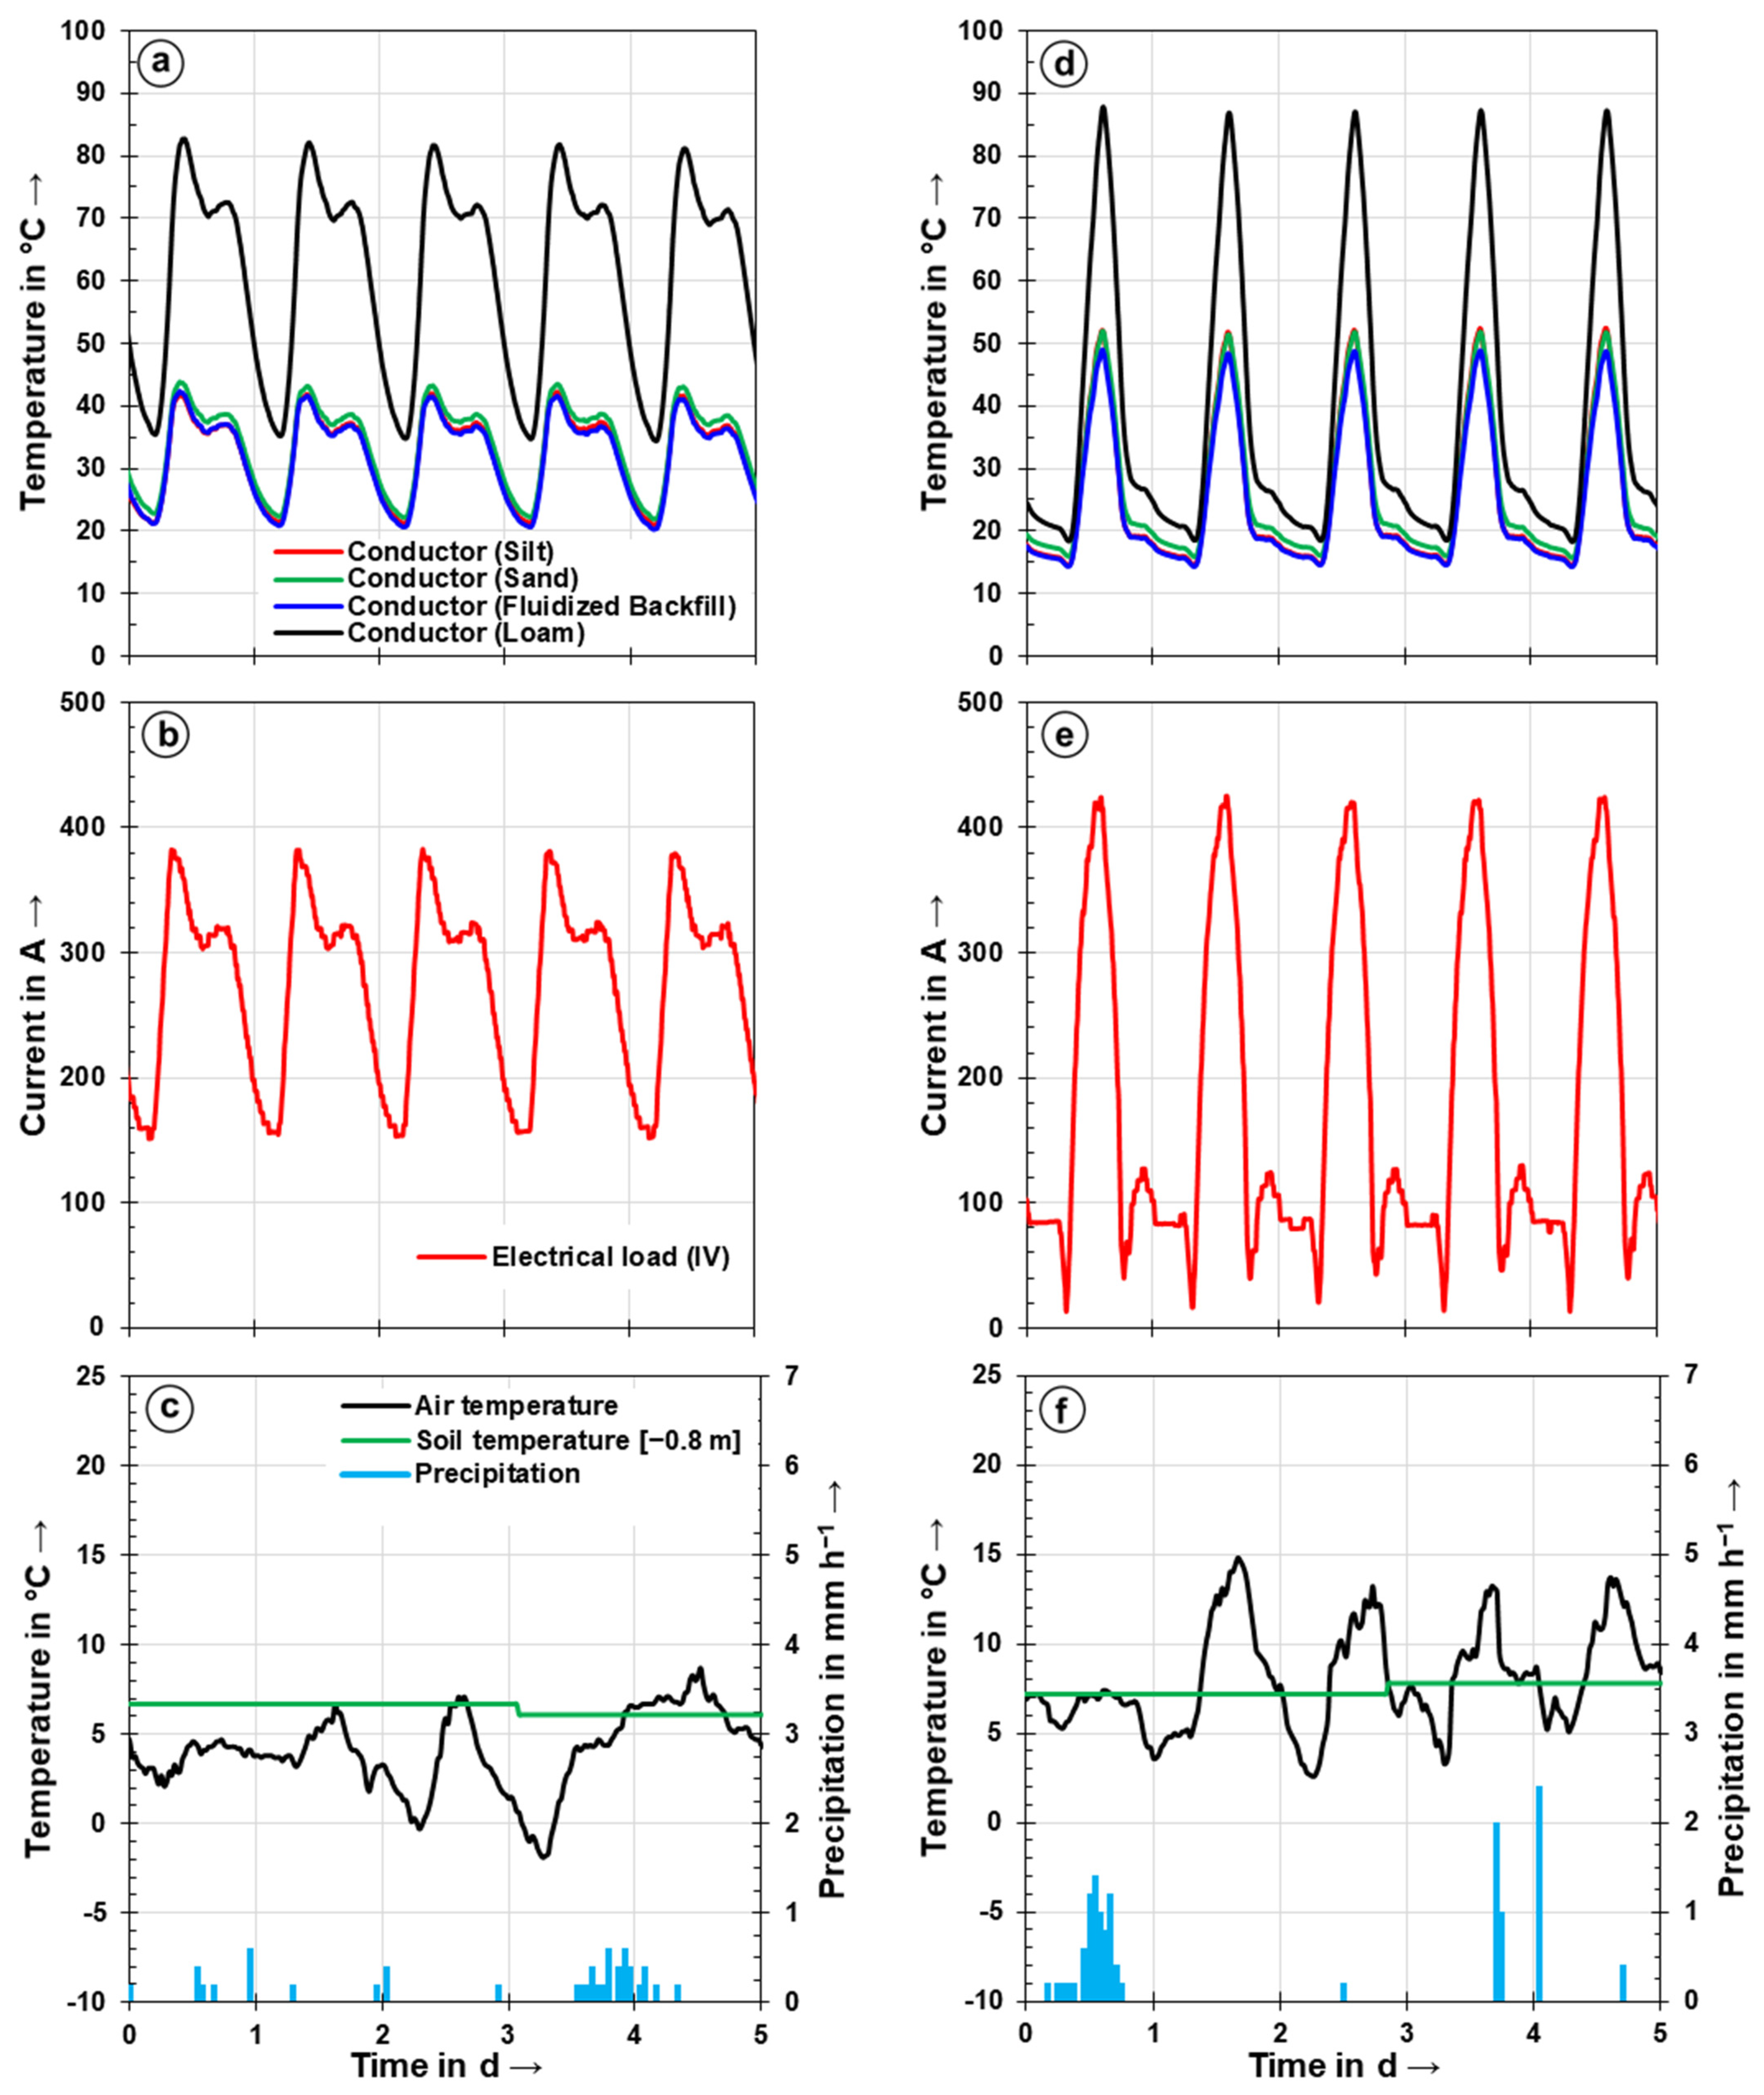
3.1. Constant and Dynamic Loading of Single MV-Trefoil (IV)
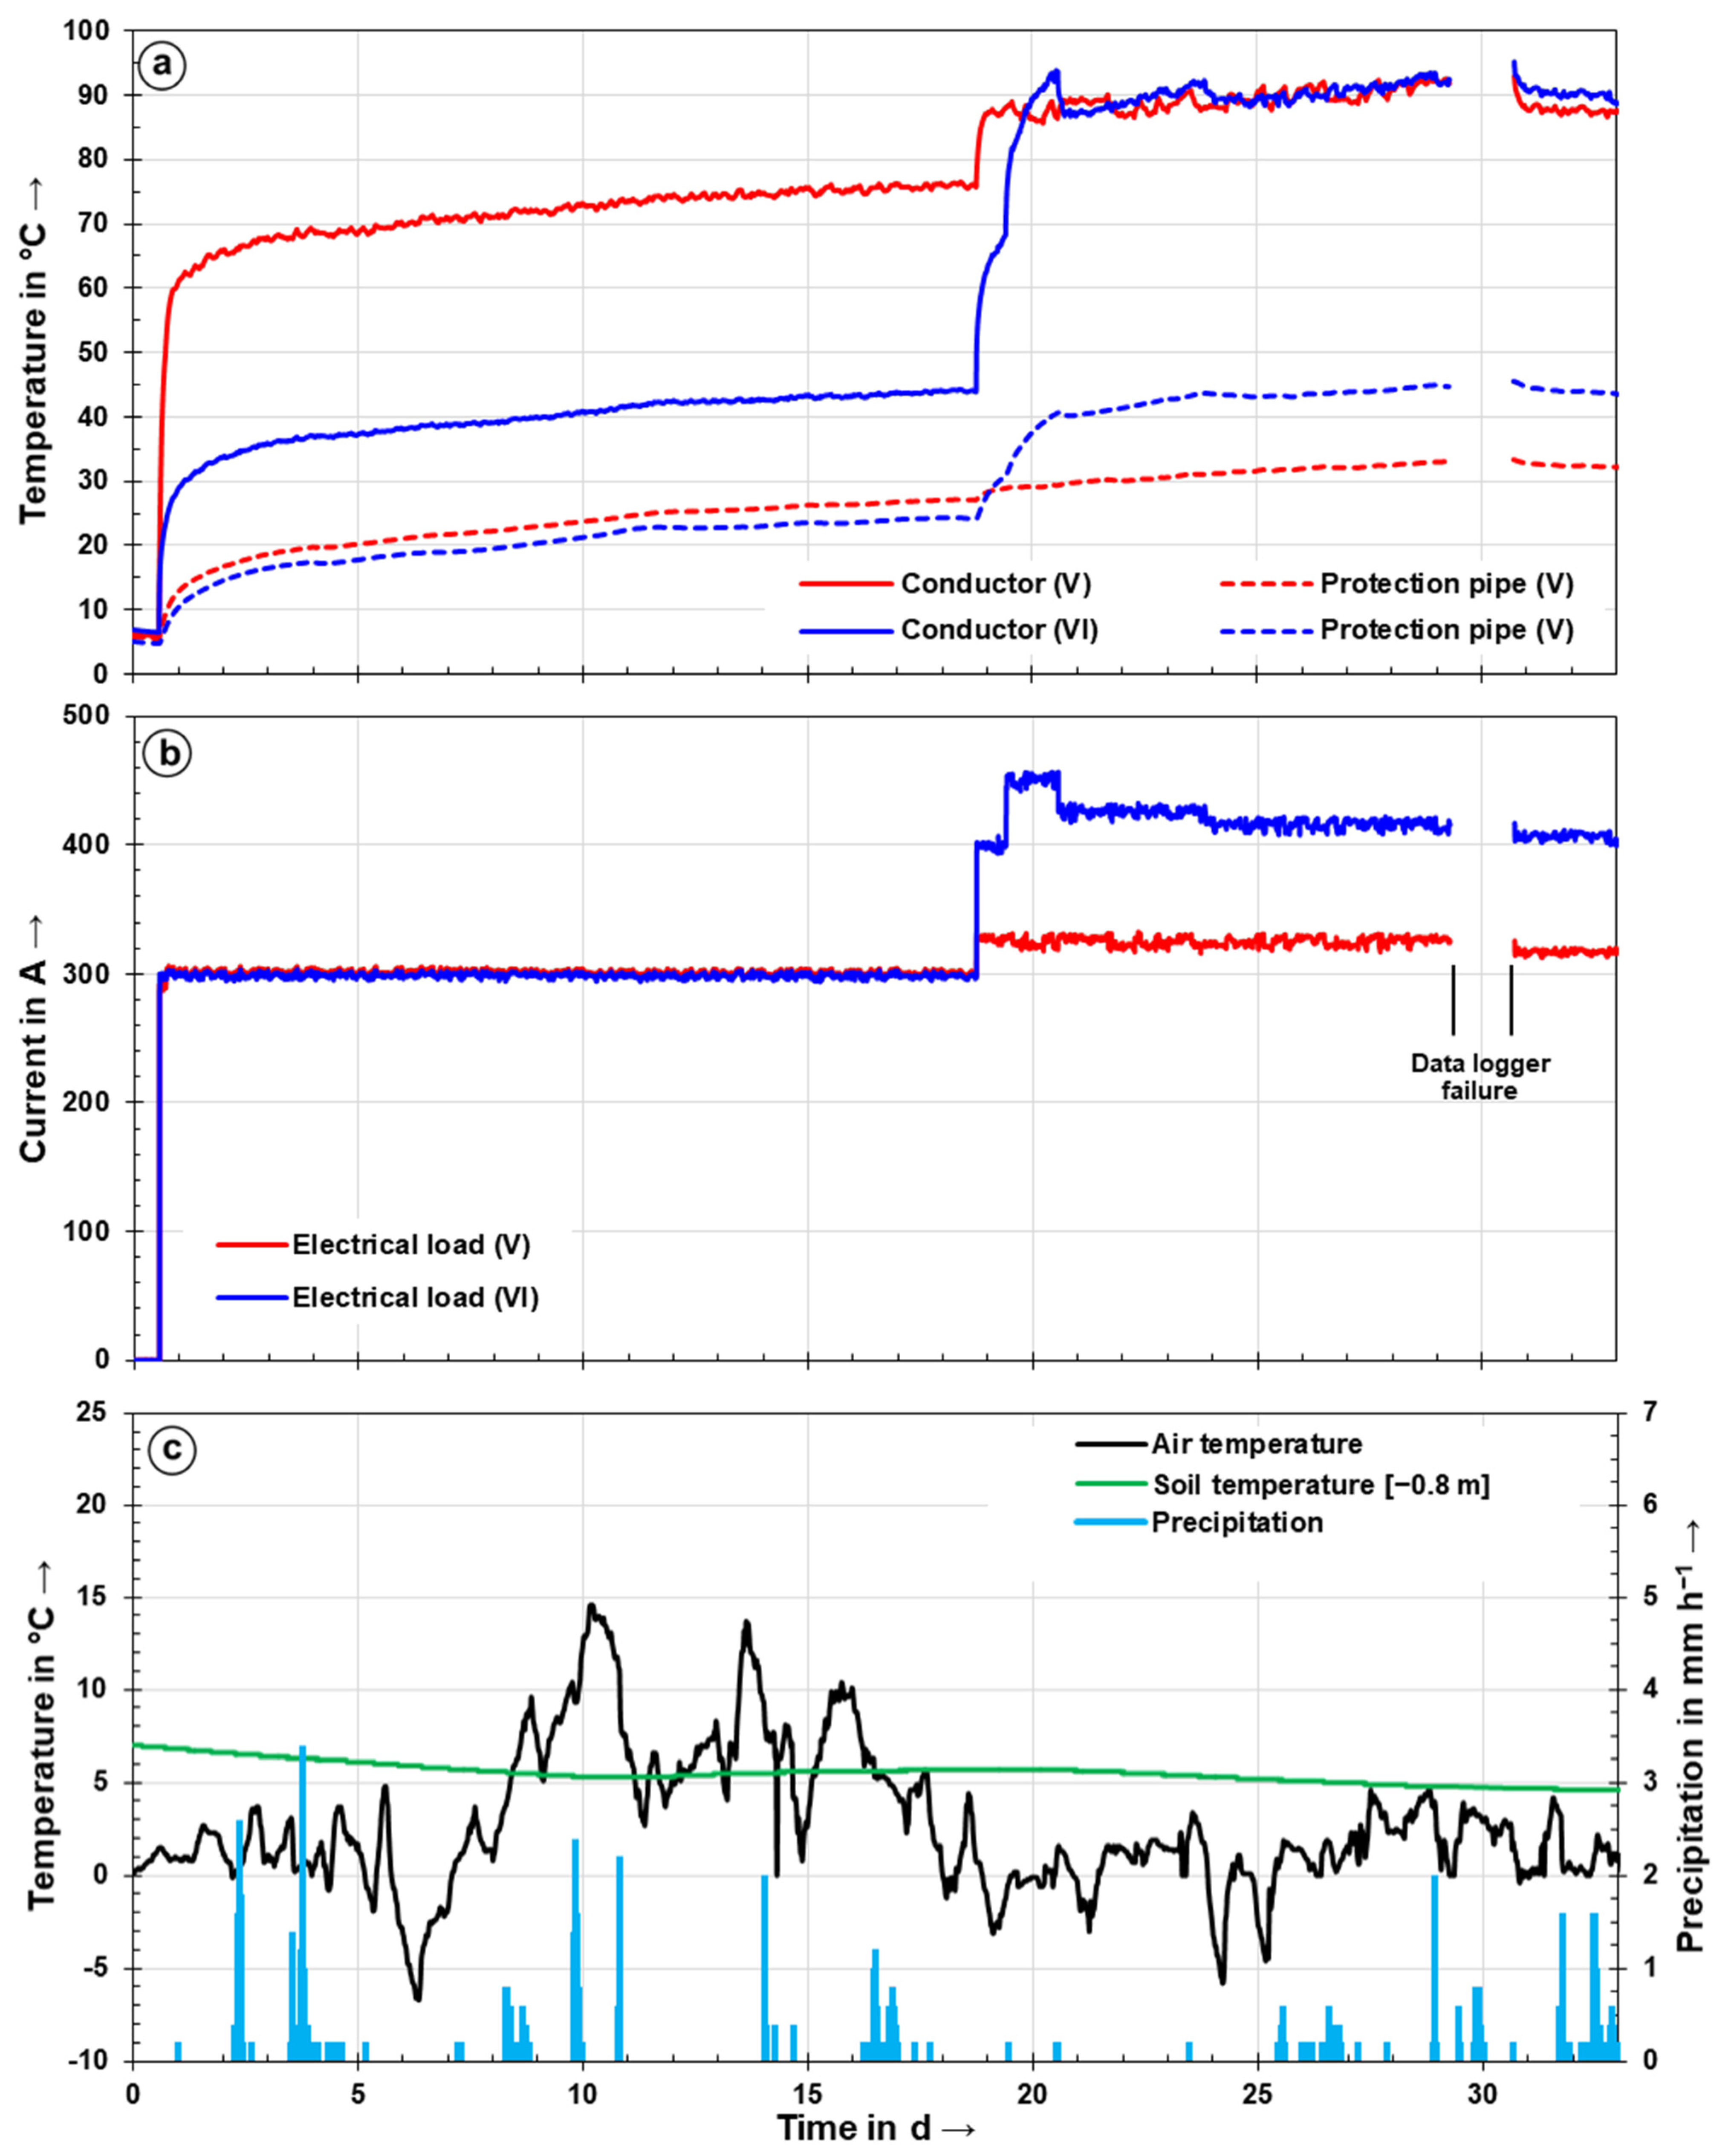
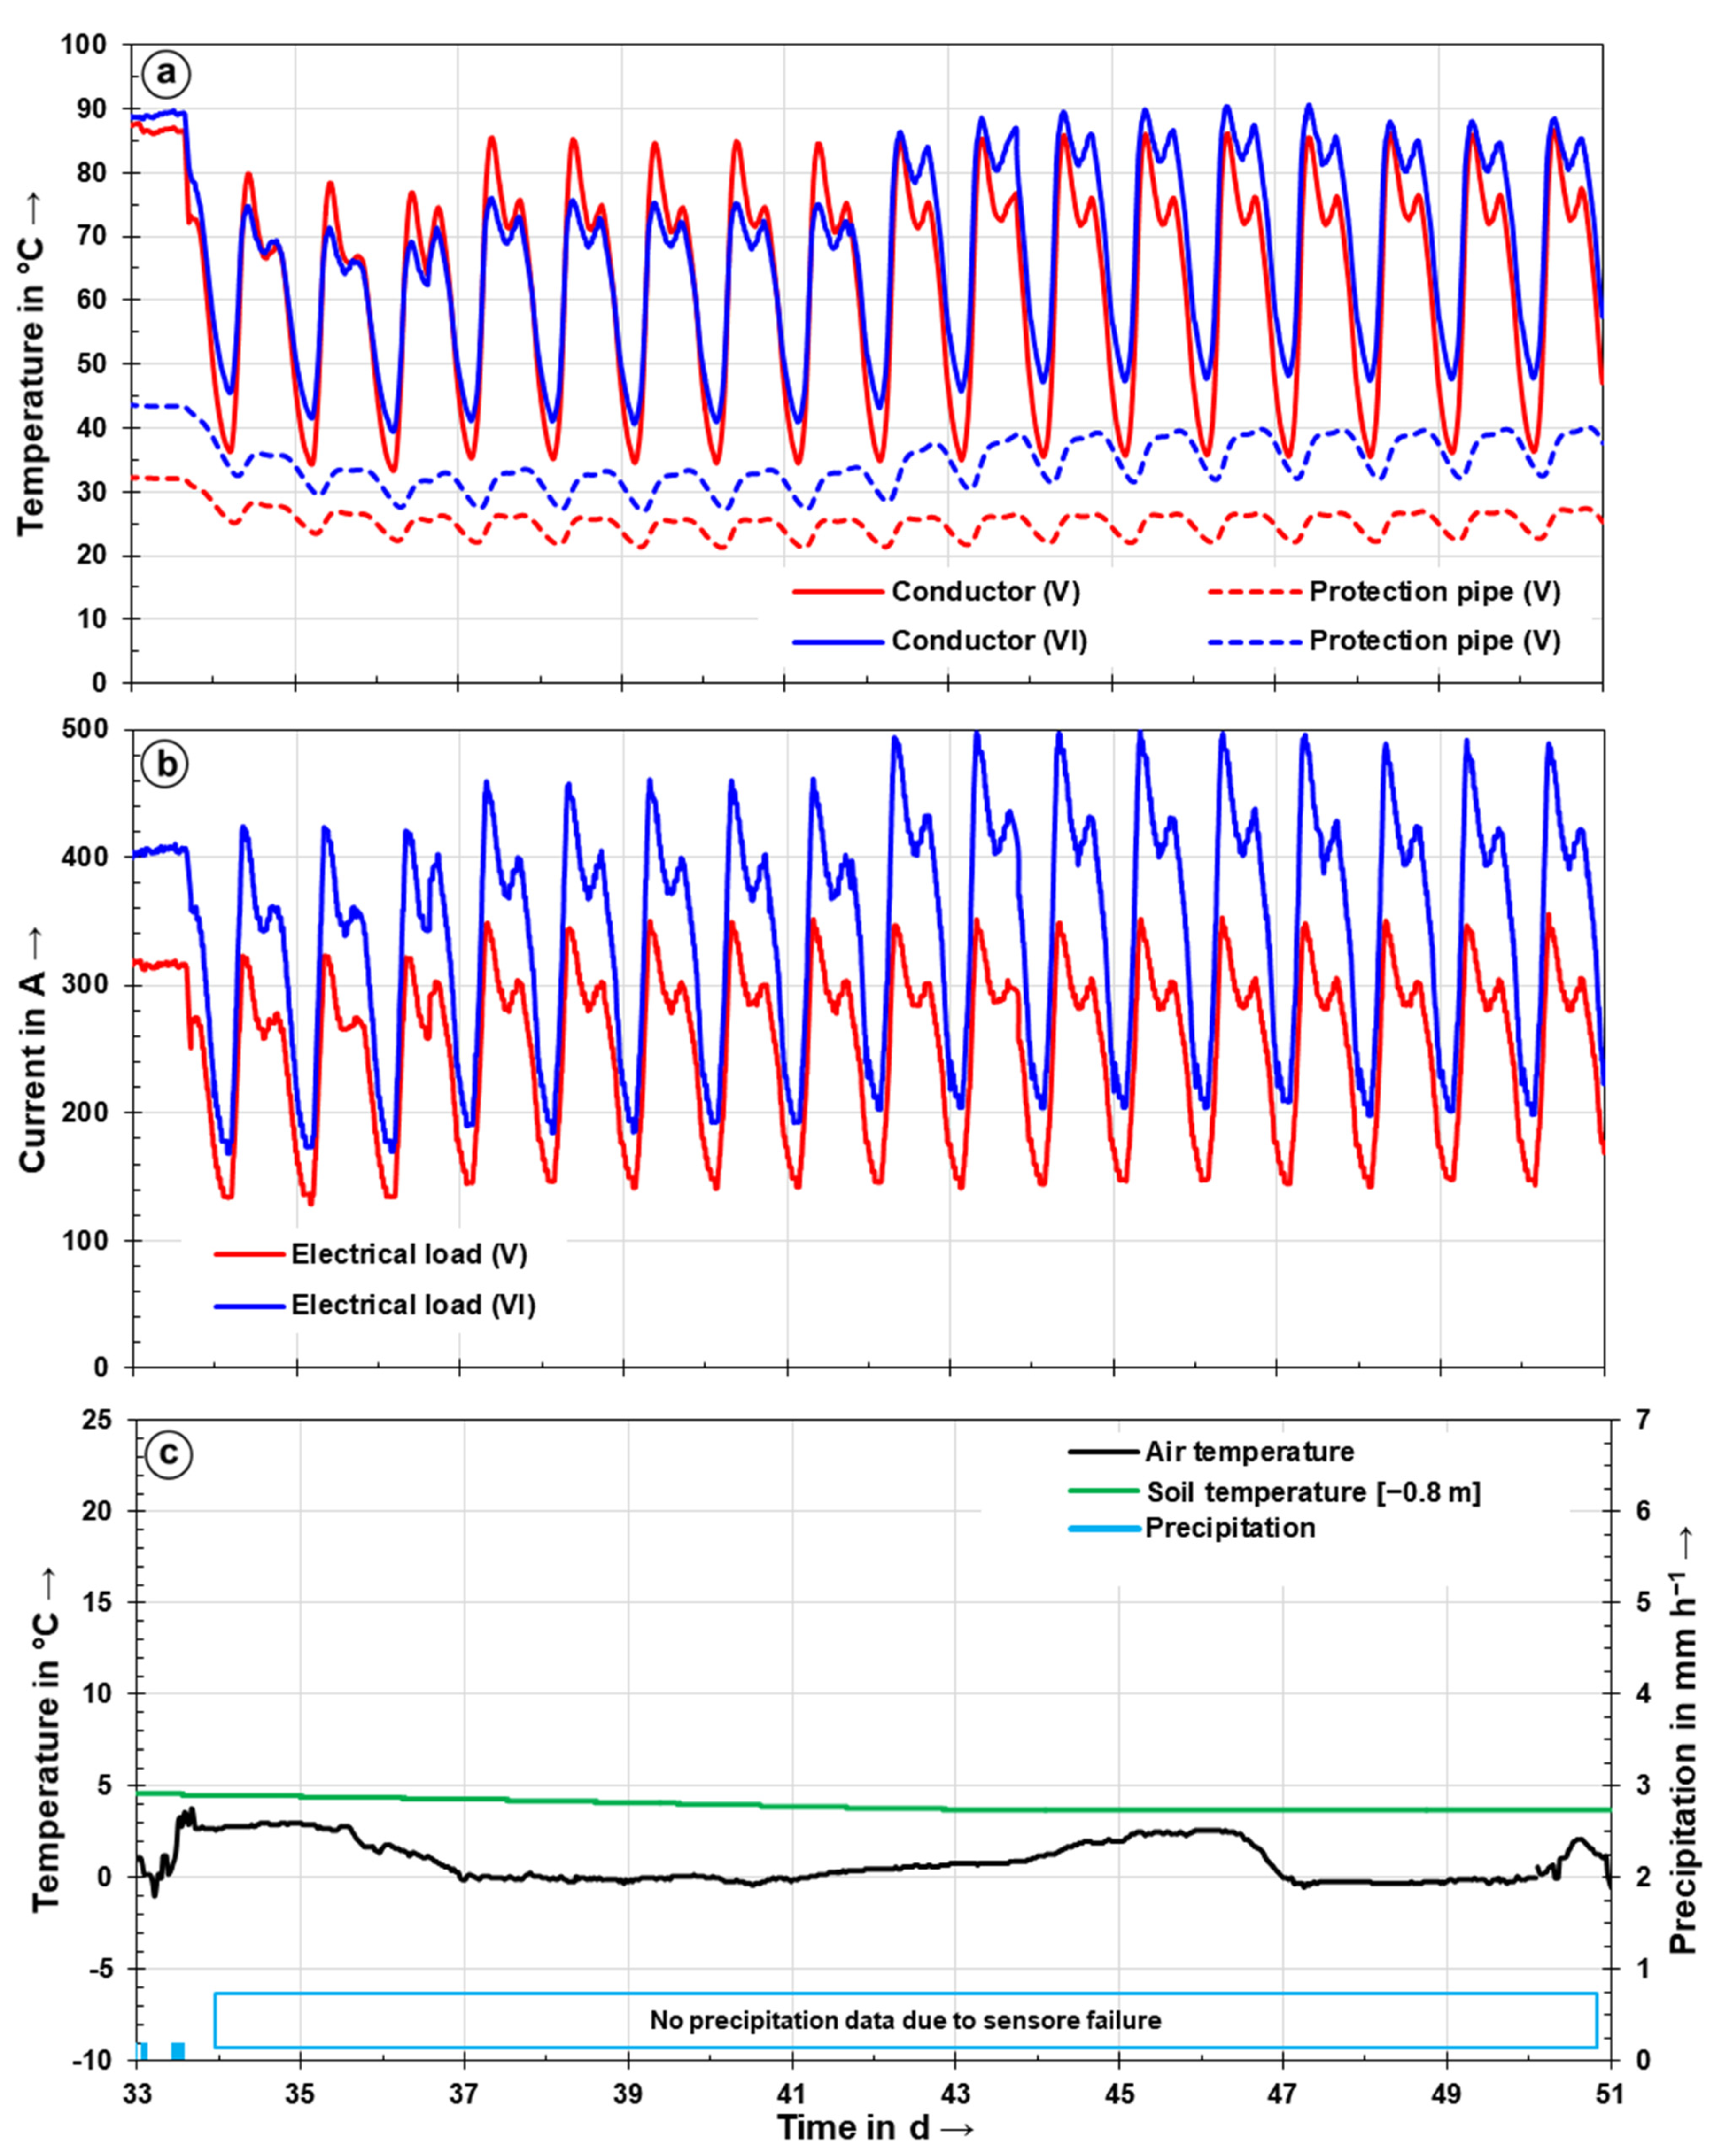
3.2. Constant and Dynamic Loading of Ducted Systems (V + VI)
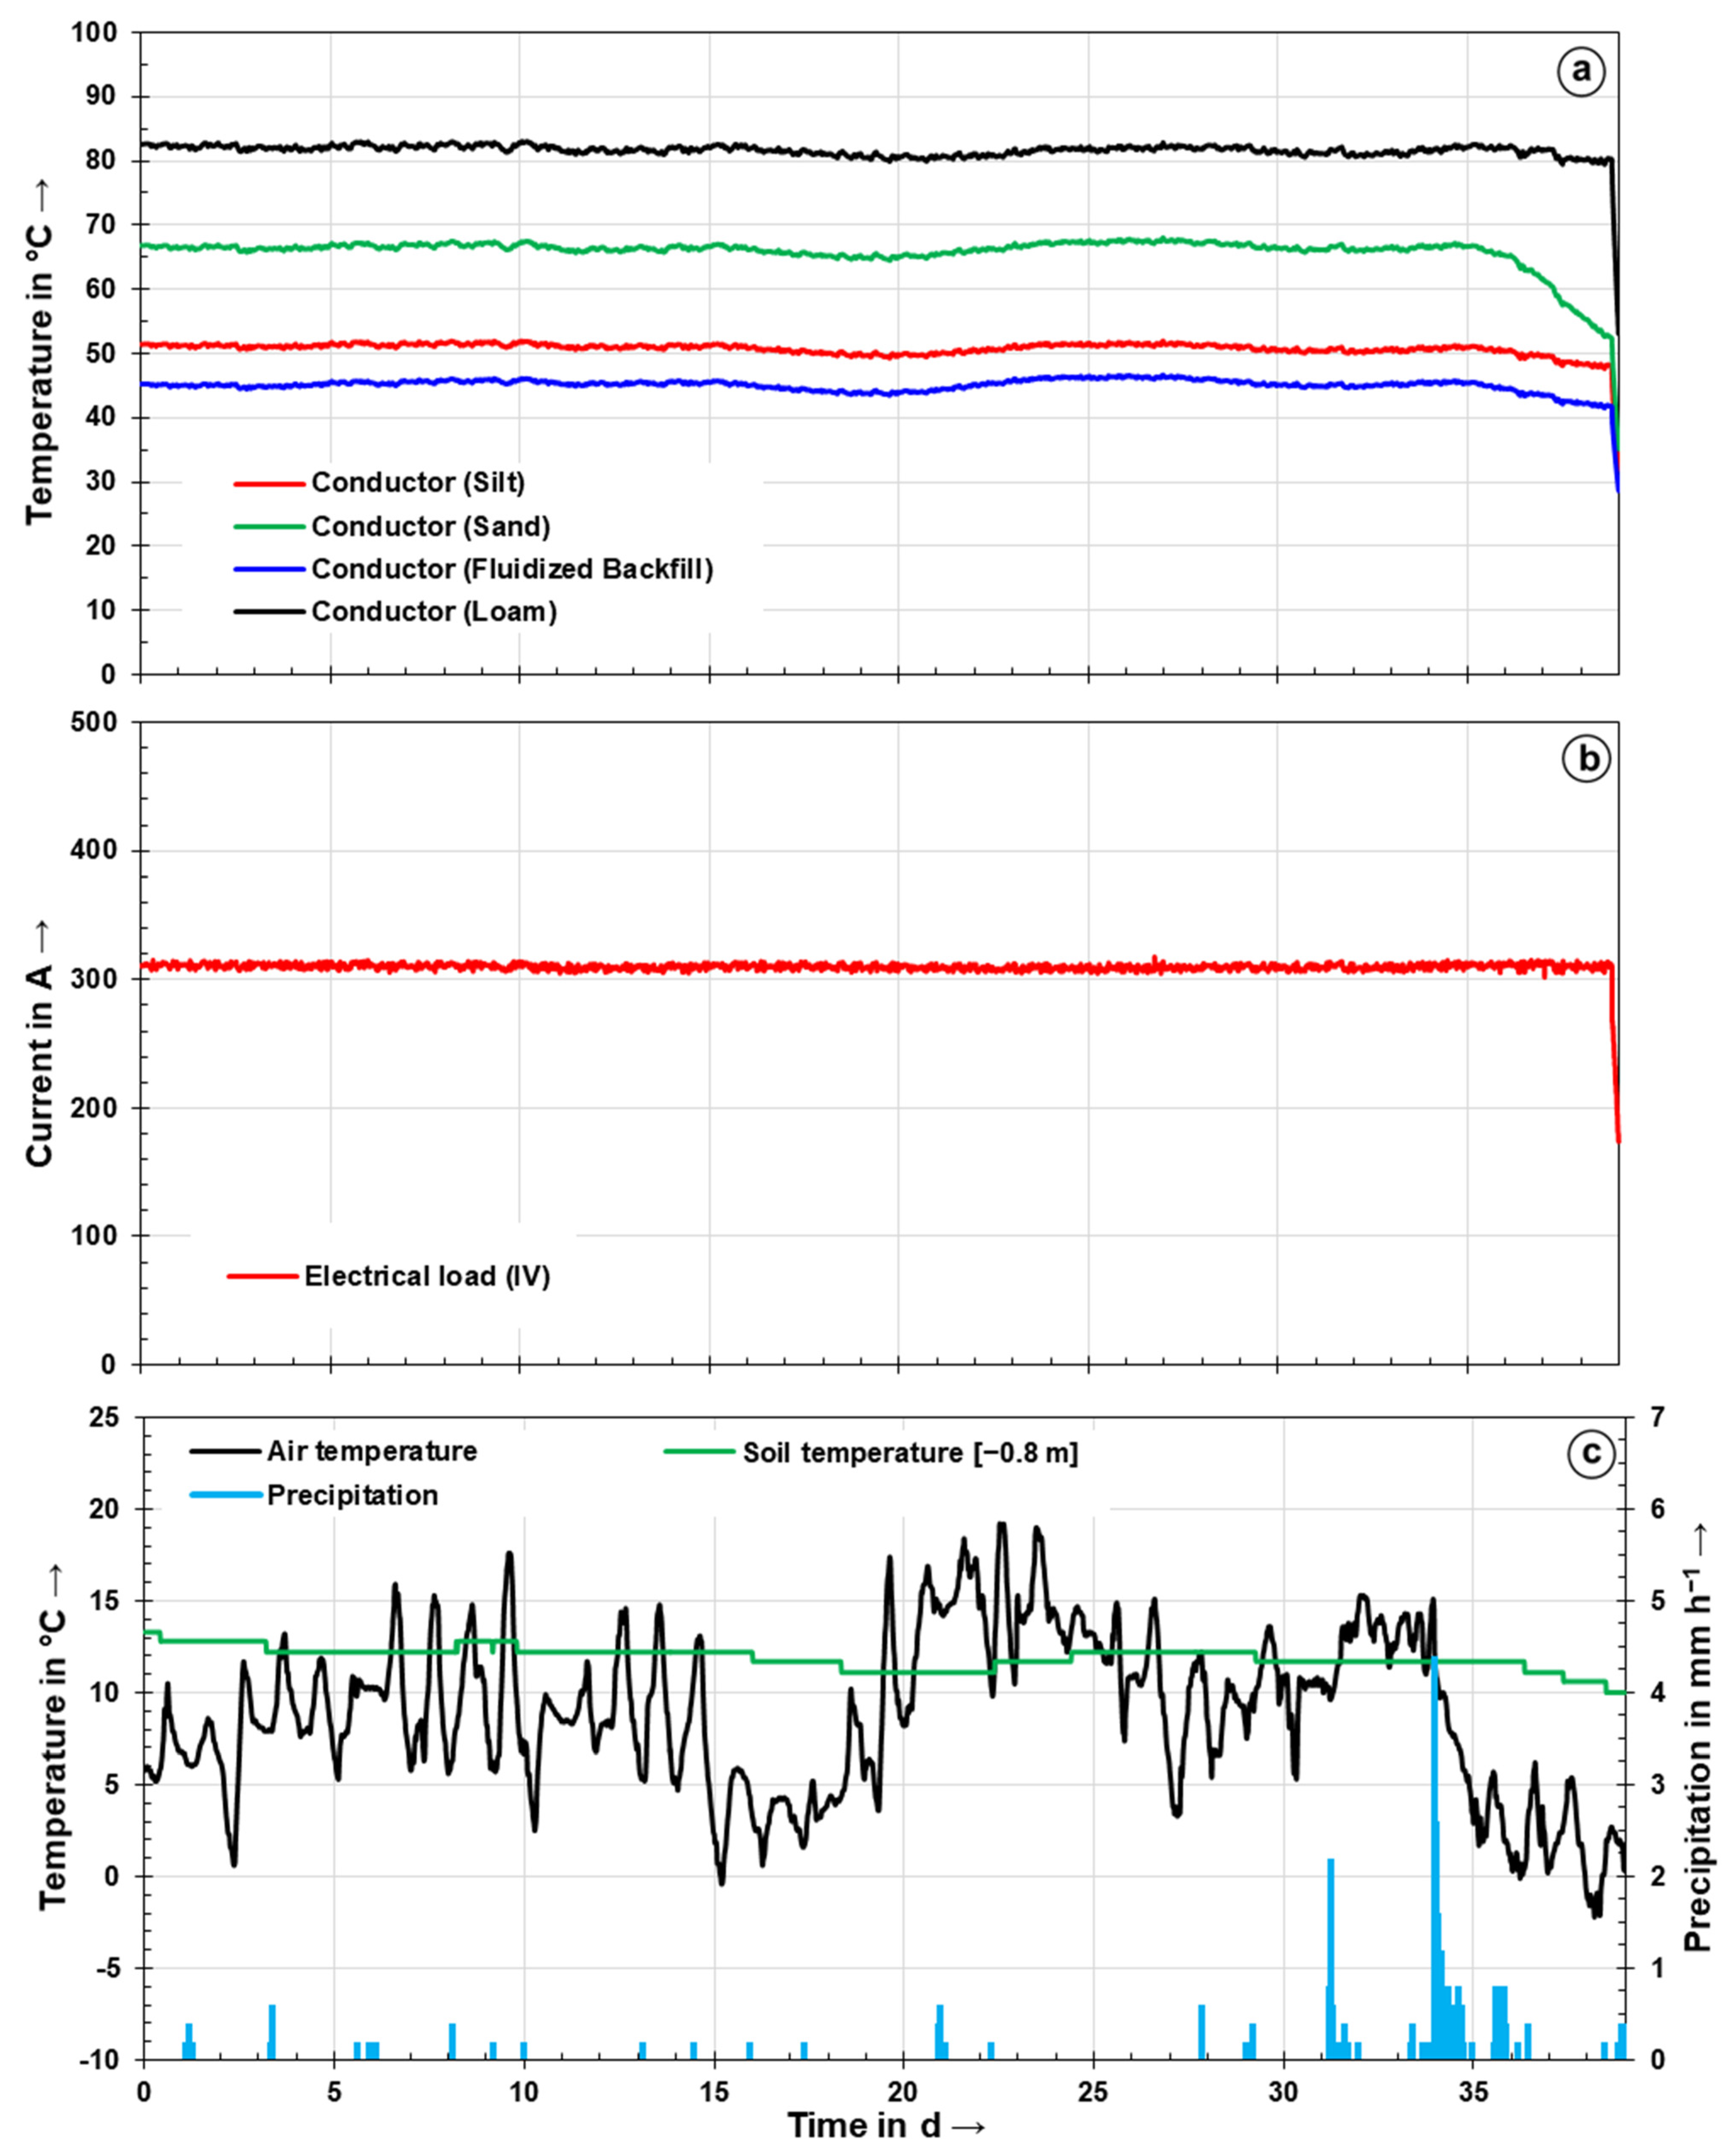
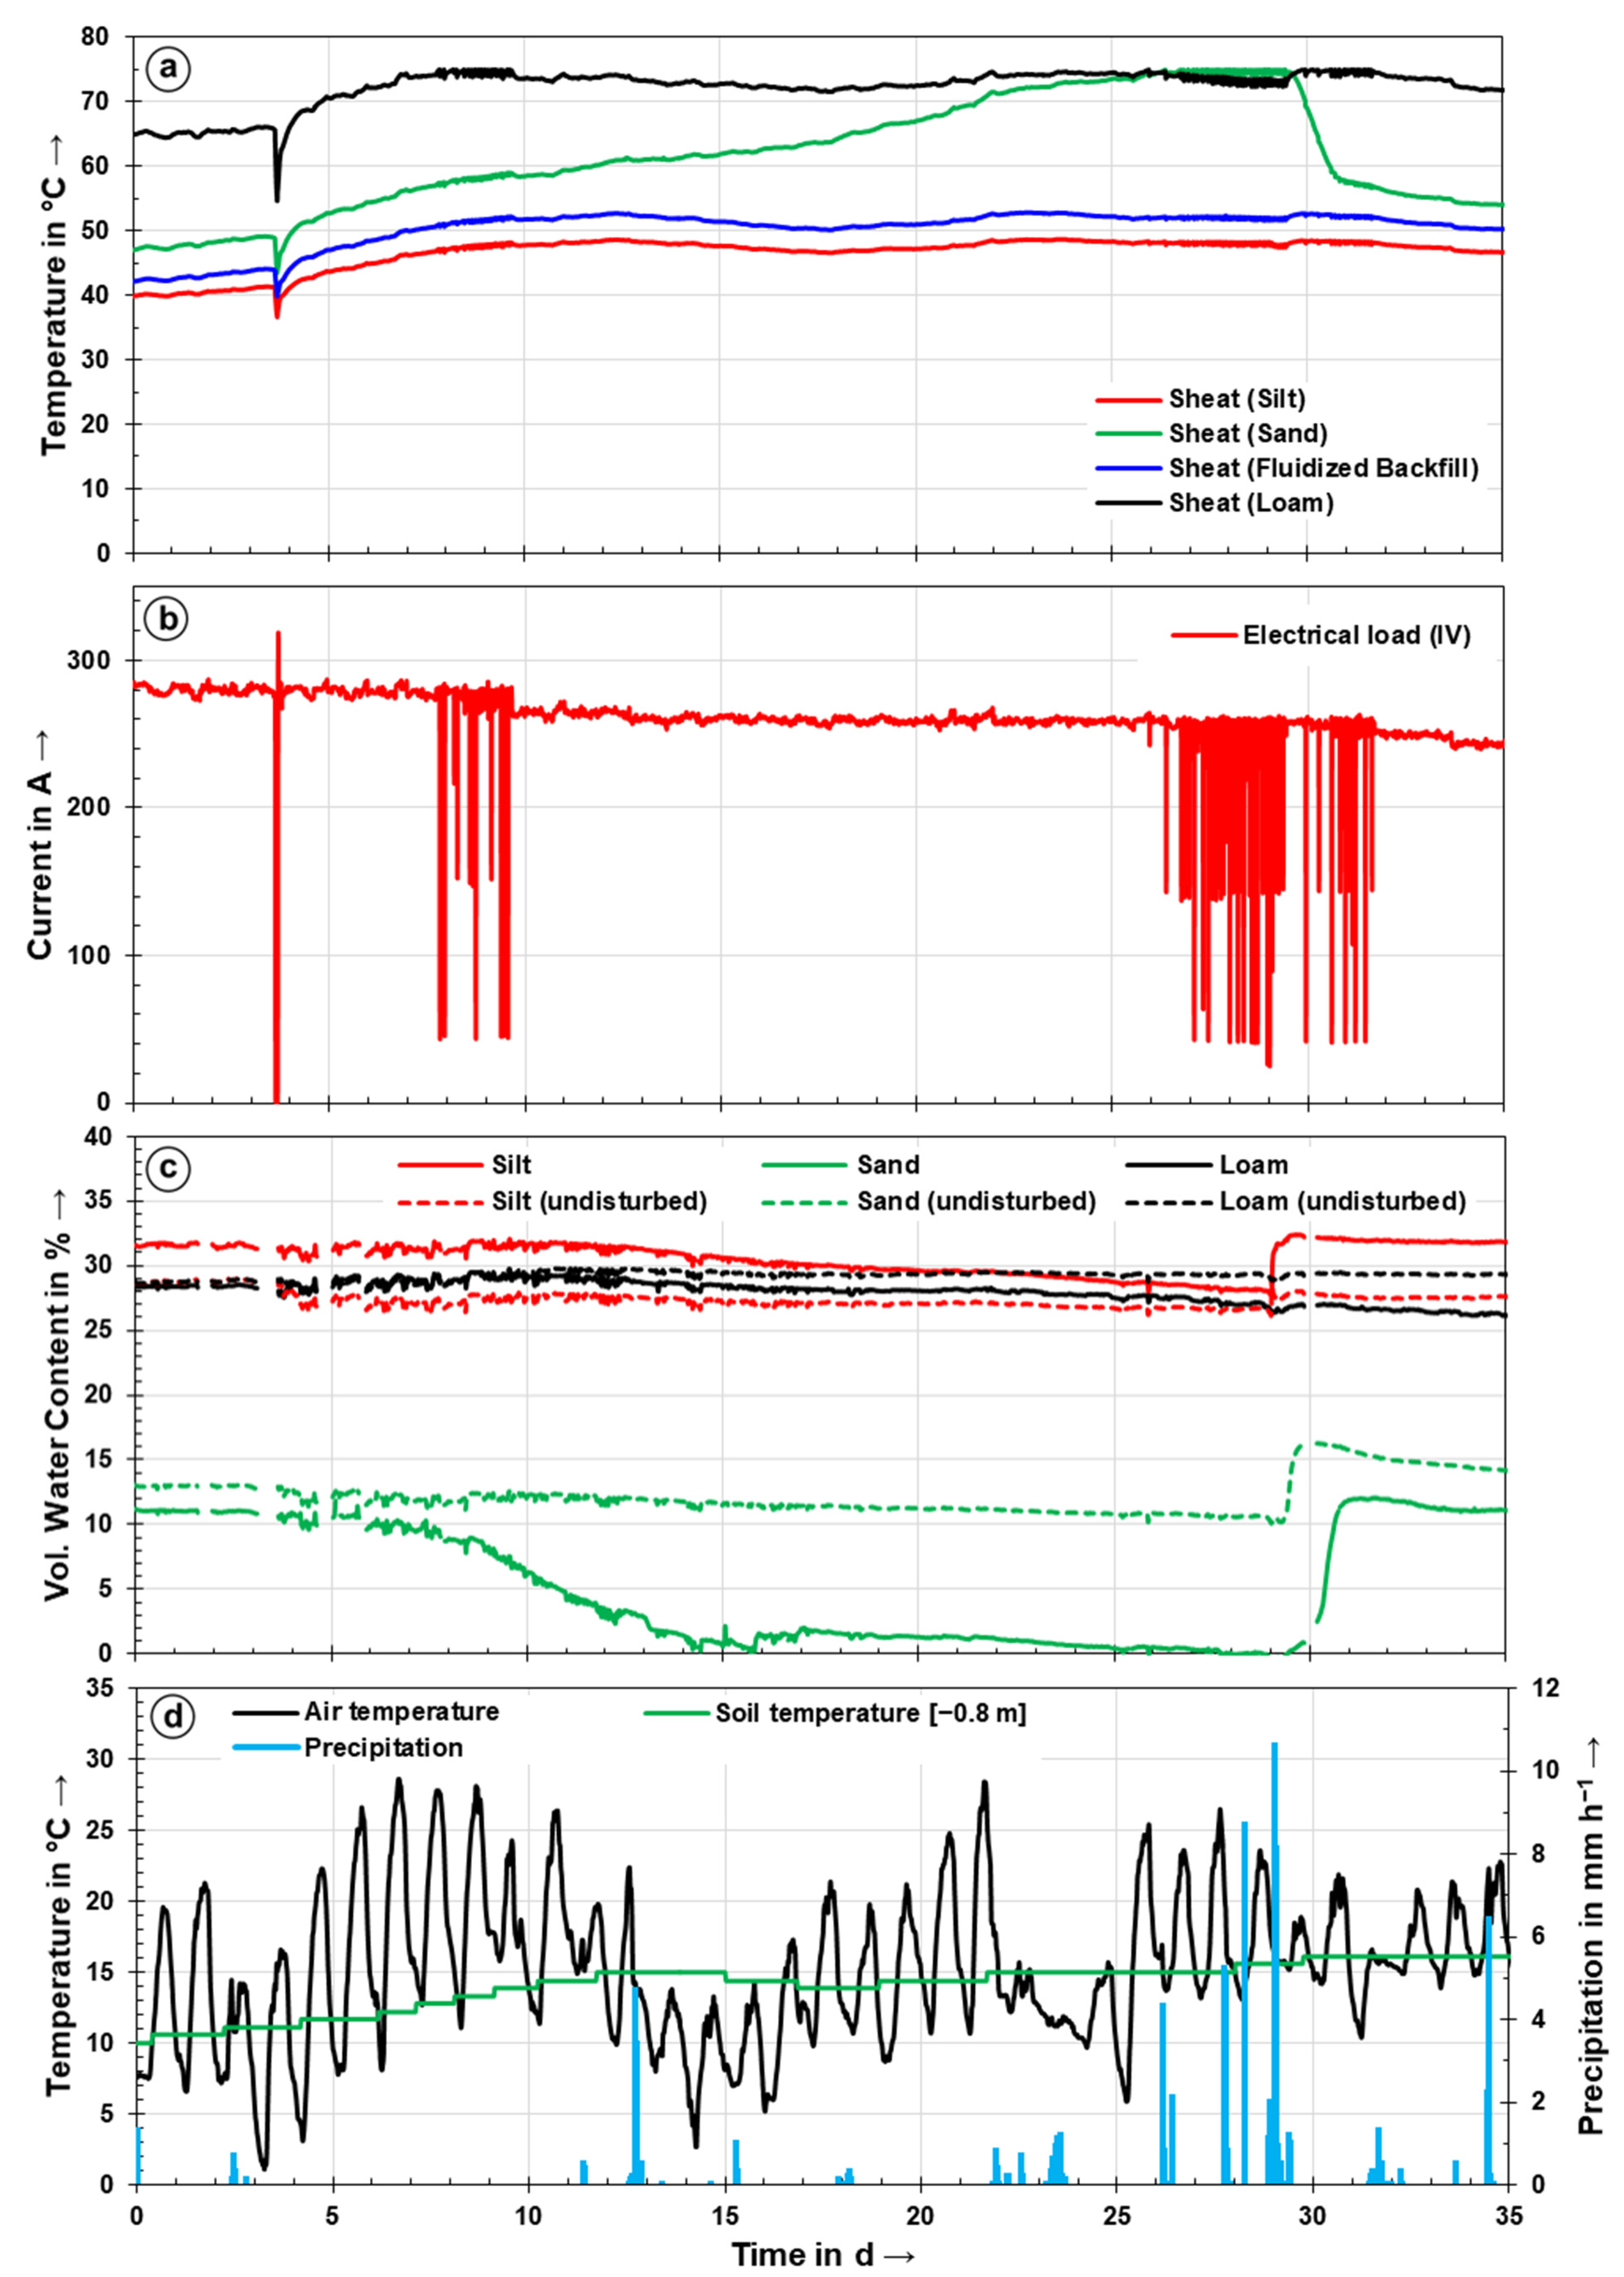
3.3. Effect of Drying-Out and Rewetting during Long Term Experiment of Double MV-Trefoils (II)
4. Discussion
4.1. Setup and Operation of a Field Experiment to Investigate Cable Beddings
4.2. Influence of Bedding Materials on the Ampacity of Buried Power Cables
5. Conclusions
Author Contributions
Funding
Institutional Review Board Statement
Informed Consent Statement
Data Availability Statement
Acknowledgments
Conflicts of Interest
References
- Toman, M.T.; Jemelkova, B. Energy and Economic Development: An Assessment of the State of Knowledge. Energy J. 2003, 24, 93–122. [Google Scholar] [CrossRef]
- Editorial The greener grid. Nature 2008, 454, 551–552. [CrossRef]
- Steinbach, A. Barriers and solutions for expansion of electricity grids—The German experience. Energy Policy 2013, 63, 224–229. [Google Scholar] [CrossRef]
- Bertsch, V.; Hall, M.; Weinhardt, C.; Fichtner, W. Public acceptance and preferences related to renewable energy and grid expansion policy: Empirical insights for Germany. Energy 2016, 114, 465–477. [Google Scholar] [CrossRef]
- Lienert, P.; Sütterlin, B.; Siegrist, M. Public acceptance of high-voltage power lines: The influence of information provision on undergrounding. Energy Policy 2018, 112, 305–315. [Google Scholar] [CrossRef]
- Menges, R.; Beyer, G. Underground cables versus overhead lines: Do cables increase social acceptance of grid development? Results of a Contingent Valuation survey in Germany. Int. J. Sustain. Energy Plan. Manag. 2014, 3, 33–48. [Google Scholar] [CrossRef]
- Forschungsgemeinschaft für Elektrische Anlagen und Stromwirtschaft. In Planungshandbuch zur Integration von Erzeugungsanlagen in Verteilungsnetze; FGH: Mannheim, Germany, 2014.
- Anders, G.J. Rating of Electric Power Cables: Ampacity Computations for Transmission, Distribution, and Industrial Applications, 1st ed.; McGraw-Hill Professional: New York, NY, USA, 1997; 428p. [Google Scholar]
- Neher, J.H.; McGrath, M.H. The calculation of the temperature rise and load capability of cable systems. Trans. Am. Inst. Electr. Eng. Part III Power Appar. Syst. 1957, 76, 752–764. [Google Scholar] [CrossRef]
- IEC 60287 Electric Cables—Calculation of the Current Rating; International Electrotechnical Committee: Geneva, Switzerland, 2014.
- IEC 60853 Calculation of the Cyclic and Emergency Current Rating of Cables; International Electrotechnical Committee: Geneva, Switzerland, 2008.
- Brakelmann, H. Physical Principles and Calculation Methods of Moisture and Heat Transfer in Cable Trenches, 1st ed.; VDE: Berlin, Germany, 1984; 93p. [Google Scholar]
- Philip, J.R.; De Vries, D.A. Moisture movement in porous materials under temperature gradients. Trans. Am. Geophys. Union 1957, 38, 222–232. [Google Scholar] [CrossRef]
- CIGRE 21 Current ratings of cables buried in partially dried out soil. Electra 1986, 104, 12–22.
- CIGRE 21 Methods for calculating cyclic ratings for buried cables with partial drying of the surrounding soil. Electra 1992, 145, 32–67.
- CIGRE 21 Determination of a value of critical temperature rise for a cable backfill material. Electra 1992, 145, 14–30.
- Campbell, G.S.; Norman, J.M. An Introduction to Environmental Biophysics, 2nd ed.; Springer: New York, NY, USA, 1998. [Google Scholar] [CrossRef]
- Blume, H.-P.; Brümmer, G.W.; Fleige, H.; Horn, R.; Kandeler, E.; Kögel-Knabner, I.; Kretzschmar, R.; Stahr, K.; Wilke, B.-M. Scheffer/Schachtschabel Soil Science, 1st ed.; Springer: Berlin/Heidelberg, Germany, 2016. [Google Scholar] [CrossRef]
- Saito, H.; Šimůnek, J.; Mohanty, B.P. Numerical Analysis of Coupled Water, Vapor, and Heat Transport in the Vadose Zone. Vadose Zone J. 2006, 5, 784–800. [Google Scholar] [CrossRef] [Green Version]
- Moradi, A.; Smits, K.M.; Lu, N.; McCartney, J.S. Heat Transfer in Unsaturated Soil with Application to Borehole Thermal Energy Storage. Vadose Zone J. 2016, 15, 1–17. [Google Scholar] [CrossRef] [Green Version]
- Verschaffel-Drefke, C.; Balzer, C.; Schedel, M.; Hinrichsen, V.; Sass, I. Experiment for Validation of Numerical Models of Coupled Heat and Mass Transfer around Energy Cables. VZJ 2021. [Google Scholar] [CrossRef]
- Campbell, G.S.; Jungbauer, J.D.; Bidlake, W.R.; Hungerford, R.D. Predicting the effect of temperature on soil thermal conductivity. Soil Sci. 1994, 158, 307–313. [Google Scholar] [CrossRef]
- Côté, J.; Konrad, J.-M. A generalized thermal conductivity model for soils and construction materials. Can. Geotech. J. 2005, 42, 443–458. [Google Scholar] [CrossRef]
- Ocłoń, P.; Cisek, P.; Pilarczyk, M.; Taler, D. Numerical simulation of heat dissipation processes in underground power cable system situated in thermal backfill and buried in a multilayered soil. Energy Convers. Manag. 2015, 95, 352–370. [Google Scholar] [CrossRef]
- Kroener, E.; Campbell, G.S.; Bittelli, M. Estimation of Thermal Instabilities in Soils around Underground Electrical Power Cables. Vadose Zone J. 2017, 16, 1–13. [Google Scholar] [CrossRef]
- Hruška, M.; Clauser, C.; De Doncker, R.W. Influence of dry ambient conditions on performance of underground medium-voltage DC cables. Appl. Therm. Eng. 2018, 149, 1419–1426. [Google Scholar] [CrossRef]
- Trüby, P.; Aldinger, E. Auswirkungen der Wärmeemission von Hochspannungserdkabeln auf den Wärme- und Wasserhaushalt des Bodens. Schr.-R.D. Dtsch. Rates Für Landespfl. 2013, 84, 100–108. [Google Scholar]
- Mitchell, J.K.; McMillan, J.C.; Green, S.L.; Sisson, R.C. Field Testing of Cable Backfill Systems. In Proceedings of the Symposium on Underground Cable Thermal Backfill, Toronto, ON, Canada, 17–18 September 1981; pp. 19–32. [Google Scholar]
- Radhakrishna, H.S. Fluidized Cable Thermal Backfill. In Proceedings of the Symposium on Underground Cable Thermal Backfill, Toronto, ON, Canada, 17–18 September 1981; pp. 34–53. [Google Scholar]
- Koopmans, G.; van de Wiel, G.M.L.M.; van Loon, L.J.M.; Palland, C.L. Soil physical route survey and cable thermal design procedure. IEE Proc. C Gener. Transm. Distrib. 1989, 136, 341–346. [Google Scholar] [CrossRef]
- Gouda, O.E.; Abdel-Aziz, A.M.; Refale, R.A.; Matter, Z. Experimental study for drying-out of soil around underground power cables. In Proceedings of the 5th Midwest Symposium on Circuits and Systems, Washington, DC, USA, 9–12 August 1992; pp. 99–102. [Google Scholar] [CrossRef]
- Trinks, S.; Kluge, B.; Wessolek, G.; Köhler, M. Optimierung der Strombelastbarkeit erdverlegter Energiekabel—Ein neues Berechnungsverfahren CableEarth. Netzpraxis 2013, 52, 51–58. [Google Scholar]
- Trüby, P. Auswirkungen der Wärmeemission von Höchstspannungserdkabeln auf den Boden und auf Landwirtschaftliche Kulturen; Consentec GmbH: Berlin, Germany, 2014; 45p. [Google Scholar]
- Stegner, J.; Drefke, C.; Hentschel, K.; Sass, I. Quantifizierung der Wärmeableitung bei erdverlegten Mittel- und Niederspannungskabeln. BBR 2013, 64, 16–21. [Google Scholar]
- HLNUG Bodenkarte von Hessen 1:25000—Blatt 6117 Darmstadt West, 1st ed.; Hessian Agency for Nature Conservation, Environment and Geology: Wiesbaden, Germany, 1985.
- HLNUG Geologische Übersichtskarte von Hessen 1:300000, 5th ed.; Hessian Agency for Nature Conservation, Environment and Geology: Wiesbaden, Germany, 2007.
- DIN VDE 0276-1000 Starkstromkabel-Teil 1000: Strombelastbarkeit, Allgemeines, Umrechnungsfaktoren; Beuth Publishing DIN: Berlin, Germany, 1995.
- Drefke, C.; Schedel, M.; Stegner, J.; Balzer, C.; Hinrichsen, V.; Sass, I. Measurement Method of Thermal Properties of Cementitious Bedding Materials and Unsaturated Soils: Hydraulic Influence on Thermal Parameters. GTJ 2017, 40, 160–170. [Google Scholar] [CrossRef]
- Kirkham, D.; Powers, W.L. Advanced Soil Physics; Wiley-Interscience: Hoboken, NJ, USA, 1972; 534p. [Google Scholar]


| Attribute | Unit | NAY2Y-J SE 4 × 150 | NA2XS(F)2Y 1 × 150 RE/25 | N2XS(F)2Y 1 × 400 RM/35 |
|---|---|---|---|---|
| No. of cores × nominal cross section | mm2 | 4 × 150 SE | 1 × 150/25 RE | 1 × 400/35 RM |
| Conductor Material | Aluminum | Aluminum | Copper | |
| Insulation Material | PVC | XLPE | XLPE | |
| Nominal insulation thickness | mm | 1.8 | 5.5 | 5.5 |
| Nominal sheath thickness | mm | 2.5 | 2.5 | 2.5 |
| Outer diameter approx. | mm | 48 | 34 | 44 |
| Rated voltage | kV | 0.6/1 | 12/20 | 12/20 |
| DC resistance at 20 °C | Ω km−1 | 0.206 | 0.206 | 0.047 |
| Capacitance | µF km−1 | n. a. | 0.24 | 0.358 |
| Max. operating conductor temperature | °C | 70 | 90 | 90 |
| Used in configurations | Main field | I, II, III | II, III, IV | |
| Side field | V, VI, VIII, IX, X | VII |
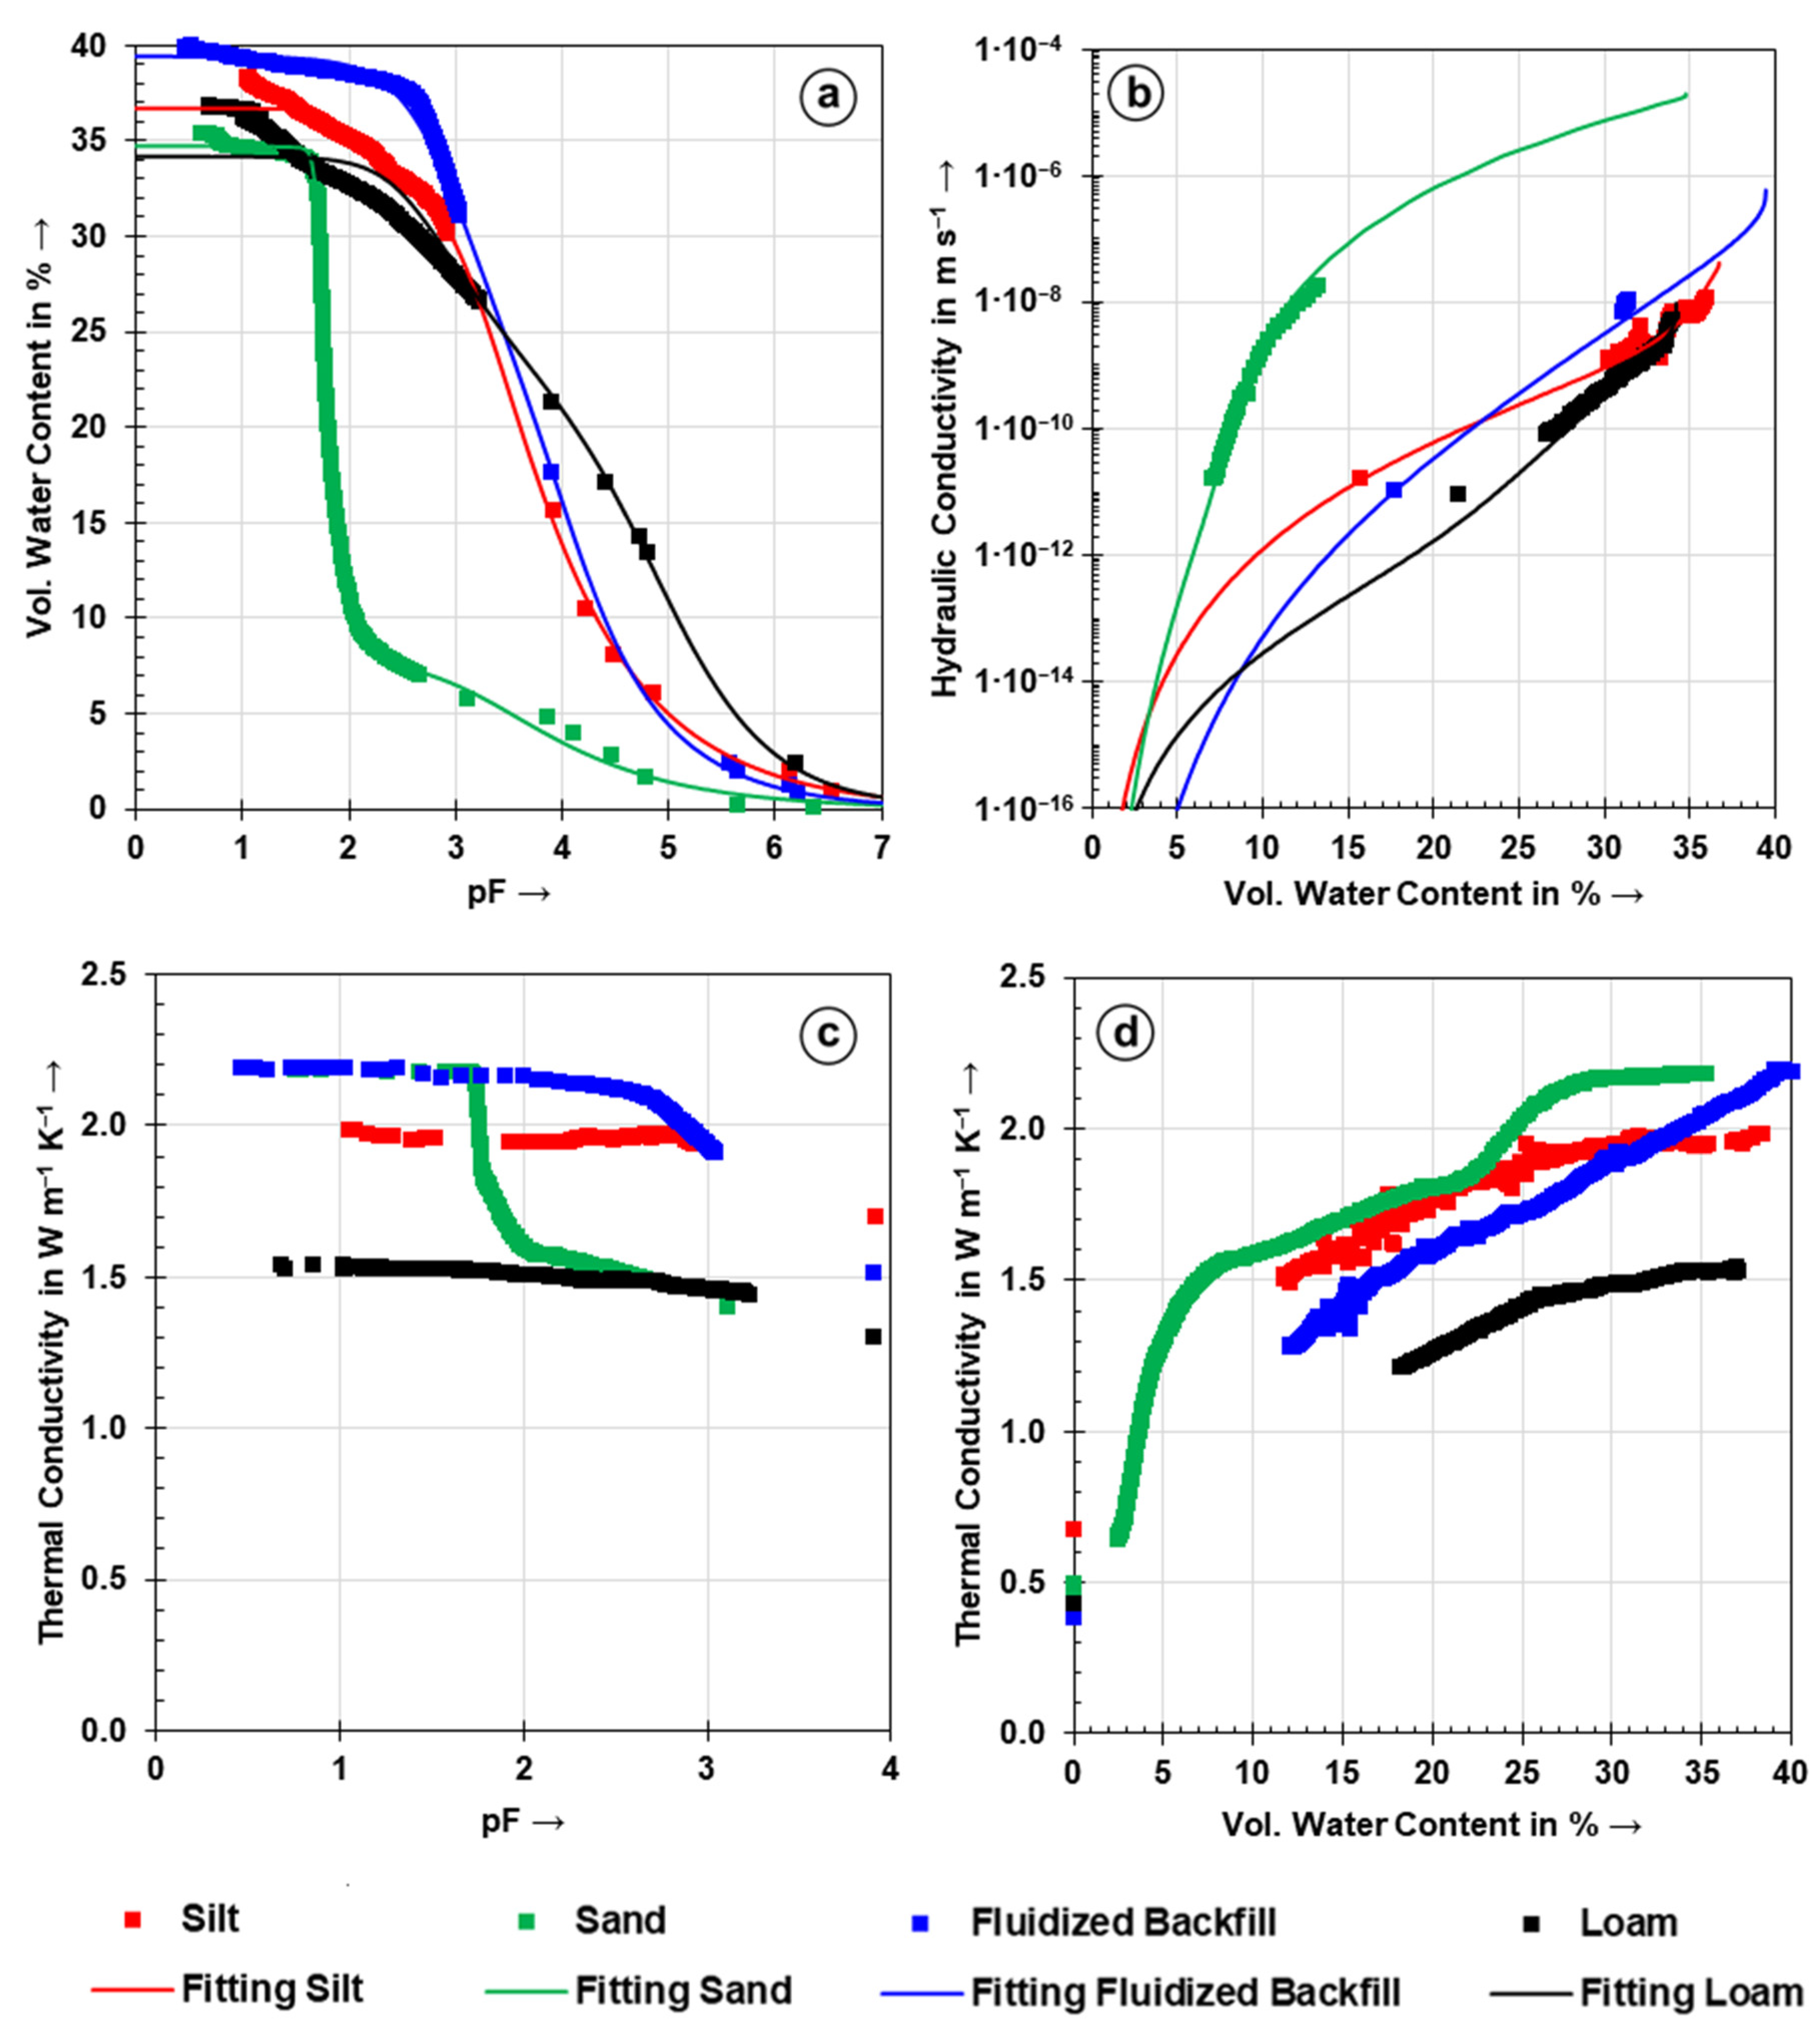
| Property | Unit | Silt | Sand | Fluidized Backfill | Loam |
|---|---|---|---|---|---|
| D10 | mm | 0.007 | 0.09 | 0.18 * | <0.001 |
| D30 | mm | 0.02 | 0.14 | 0.34 * | 0.006 |
| D50 | mm | 0.03 | 0.19 | 0.51 * | 0.04 |
| D60 | mm | 0.04 | 0.21 | 0.63 * | 0.06 |
| Uniformity coefficient CU | - | 5.7 | 2.3 | 3.5 * | >15 |
| Bulk Density | g∙cm−3 | 1.72 | 1.62 | 1.64 | 1.75 |
| Grain Density | g∙cm−3 | 2.67 | 2.66 | 2.75 | 2.75 |
| Porosity | % | 35.6 | 39.1 | 40.4 | 36.4 |
| Organic Content | M.-% | 1.9 | 1.1 | 0.8 | 1.4 |
| Place of Loss | Type | Percentage of Overall Losses | Occurrence at TU Darmstadt Test Site | |
|---|---|---|---|---|
| 150 mm2 | 400 mm2 | |||
| Conductor | Resistive Losses | 97.02 | 81.86 | Yes |
| Losses due to Skin Effect | 0.22 | 5.12 | Yes | |
| Losses due to Proximity Effect | 0.11 | 2.09 | Negligible differences due to phase position | |
| Dielectric | Dielectric Losses | 0.05 | 0.05 | No |
| Screen | Resistive Losses | 2.60 | 10.88 | No |
Publisher’s Note: MDPI stays neutral with regard to jurisdictional claims in published maps and institutional affiliations. |
© 2021 by the authors. Licensee MDPI, Basel, Switzerland. This article is an open access article distributed under the terms and conditions of the Creative Commons Attribution (CC BY) license (https://creativecommons.org/licenses/by/4.0/).
Share and Cite
Verschaffel-Drefke, C.; Schedel, M.; Balzer, C.; Hinrichsen, V.; Sass, I. Heat Dissipation in Variable Underground Power Cable Beddings: Experiences from a Real Scale Field Experiment. Energies 2021, 14, 7189. https://doi.org/10.3390/en14217189
Verschaffel-Drefke C, Schedel M, Balzer C, Hinrichsen V, Sass I. Heat Dissipation in Variable Underground Power Cable Beddings: Experiences from a Real Scale Field Experiment. Energies. 2021; 14(21):7189. https://doi.org/10.3390/en14217189
Chicago/Turabian StyleVerschaffel-Drefke, Christoph, Markus Schedel, Constantin Balzer, Volker Hinrichsen, and Ingo Sass. 2021. "Heat Dissipation in Variable Underground Power Cable Beddings: Experiences from a Real Scale Field Experiment" Energies 14, no. 21: 7189. https://doi.org/10.3390/en14217189