Article

An Integrated of Hydrogen Fuel Cell to Distribution Network System: Challenging and Opportunity for D-STATCOM

by
Mohamed Mohamed Khaleel
1,2,*,
Mohd Rafi Adzman
1 and
Samila Mat Zali
1
1
Faculty of Electrical Engineering Technology, University Malaysia Perlis, Arau 02600, Malaysia
2
Aeronautical Engineering Department, Faculty of Civil Aviation, Misrata, Libya
*
Author to whom correspondence should be addressed.
Energies 2021, 14(21), 7073; https://doi.org/10.3390/en14217073
Submission received: 2 August 2021 / Revised: 10 October 2021 / Accepted: 11 October 2021 / Published: 29 October 2021
(This article belongs to the Topic Power Distribution Systems)

Abstract

:
The electric power industry sector has become increasingly aware of how counterproductive voltage sag affects distribution network systems (DNS). The voltage sag backfires disastrously at the demand load side and affects equipment in DNS. To settle the voltage sag issue, this paper achieved its primary purpose to mitigate the voltage sag based on integrating a hydrogen fuel cell (HFC) with the DNS using a distribution static synchronous compensator (D-STATCOM) system. Besides, this paper discusses the challenges and opportunities of D-STATCOM in DNS. In this paper, using HFC is well-designed, modeled, and simulated to mitigate the voltage sag in DNS with a positive impact on the environment and an immediate response to the issue of the injection of voltage. Furthermore, this modeling and controller are particularly suitable in terms of cost-effectiveness as well as reliability based on the adaptive network fuzzy inference system (ANFIS), fuzzy logic system (FLC), and proportional–integral (P-I). The effectiveness of the MATLAB simulation is confirmed by implementing the system and carrying out a DNS connection, obtaining efficiencies over 94.5% at three-phase fault for values of injection voltage in HFC D-STATCOM using a P-I controller. Moreover, the HFC D-STATCOM using FLC proved capable of supporting the network by 97.00%. The HFC D-STATCOM based ANFIS proved capable of supporting the network by 98.00% in the DNS.

1. Introduction

Energy storage system (ESS) technologies, power quality (PQ), and carbon emission CO2 are among the increasingly complex and crucial issues faced by the world today, and a settlement must be reach to provide an immediate solution [1,2]. This is demonstrated by the European Union rapidly approaching the targets which can be seen by 2030. The first target contributed to the reduction in the level of greenhouse gas (GHG) emitting resources available to 40.0% as compared with 1990 levels. The second target is growing the share of renewable energy sources (RES) at least 32.0%. The third target is leading to enhanced efficiency of energy at least to 27% [3]. Technological innovation becomes part of the solution and the key to ensuring energy security and power system stability without causing widespread damage by negative environmental impacts and providing the best possible, efficient, cost-effective energy solutions. Deficiencies of electrical power grids in terms of stability, controllability, efficiency, and redundancy are noted [4]. This made it possible to estimate the capacity for installed water electrolyzes in the near future decarbonized global economy to be between 3000.00 GW and 6000.00 GW by 2050 [5].
In this sense, the hydrogen fuel cell (HFC) offers excellent facilities for distribution in flexible AC transmission system technology and high-level stability in the distribution network system (DNS), thereby contributing to overall energy conservation, enhancing the performance of energy, and ably assisting to reduce the negative effect on the environment as well as global emissions [6,7]. It is worthy to mention that ESS technologies play the role of decarbonizing the distribution network by growing the integration of the RES and decreasing power quality issues, e.g., the voltage sag [8] or demand and balancing generation, and enabling ancillary services, e.g., voltage regulation as well as frequency in DNS operation by storing the energy or releasing immediately in a rapid response to the DNS needs [8,9,10]. Moreover, the placement of network-scale ESS technology has a highly critical impact on performance enhancements over DNS [11]. The classification of ESS is taking a key role in the process of converting electrical energy. One of these classifications could depend on the duration of the storage period, such as short-term ESS and long-time ESS. Figure 1 presents the classification of ESS technologies. From this perspective, the ESSs are discussed in several studies [6,11,12,13].
Several types of ESSs technologies are utilized in electrical power systems such as HFC, providing advantages such as higher efficiency, endurance, and energy to weight ratio. The HFC power generation functions primarily through feeding hydrogen into the anode of the cell. Meanwhile, the cathode side is supplied using oxygen (air) typically offered through a pump or a compressor [14]. Moreover, ESS technology is developing fast. Currently, one of the biggest sources of electrical power that utilizes ES is pumped hydro storage (PHS), using around 127.0 GW. In addition to that, 400.0 MW is used for compressed air energy storage (CAES) [15,16]. Furthermore, superconducting magnetic energy storage (SMES) has attracted a lot of interest in terms of energy storage efficiency (95.0%) and its fast response [17]. Besides, flywheel energy (FE) is a key feature of the electrical ES, including hybrid power generation, high storage periods, frequent use, and electrical grids, as many research studies have demonstrated [12,18,19]. It is worthy to mention that the first ab initio calculations in the world for a high voltage, rechargeable, 5 Volt Li-ion battery cathode material Li2CoMn3O8 were performed by Eglitis and Borstel [20,21]. The concentrating solar power (CSP) including the phase change material (PCM) provides access to advanced ESS technology in an electrified world. At the same time, thermal energy storage (TES) systems are considered indispensable for today’s modern CSP power plants. These findings indicate that more than 80% of CSP power plants design incorporate all the latest safety features and TES systems [15,22].
DNS service providers are considered a crucial part of ensuring secure and efficient network operation [6,11]. Even though the fulfillment of this objective can significantly raise the cost of the system. Even though the cost involved can be high, the network reinforcement for thermal and voltage stability could have a direct effect on the electricity cost to the costumers. This is further supported by the Electric Power Research Institute (EPRI) U.S. predicting the annual financial price of outages to become USD 100.00 billion, in terms of disruptions appears in the DNS [23]. Moreover, voltage profile enhancement and reducing flicker disturbance are of vital importance in the mitigation of network power quality issues. For this reason, this paper sets DN as a long-term goal to mitigate the voltage sag based on hydrogen fuel cells (HFC). With this motivation, the implementation of distribution network-scale HFC involves a large capital expenditure. Distribution networks have enquired as to whether achieving their targeted anticipated increase in efficiency is challenging. From this perspective, the HFC can be utilized in the distribution static compensator (D-STATCOM) system which can associate to supply electrical power for several hours in DNS.
Power quality (PQ) is becoming an increasingly important matter concerning DNS, utilities in the electrical power system, and the environmental impact of pollution [6,22,23,24,25]. Voltage sag or dips are the critical factors that will determine the effect of transient disturbance events in the network [26]. Voltage sag or dips are the critical factors that will determine the effect of transient disturbance events in the network [26]. Furthermore, voltage sag can hinder the induction motor starting as well as challenge transformer energizing in the DNS. Moreover, the issue of voltage sag is an important point regarding the effect on DNS through the involvement of the demand load, whereby voltage sags have an adverse influence on the network output [25,27]. This is demonstrated by the Department of Energy (DOE) estimates that the financial price of electrical power outages per hour for a brokerage enterprise reach USD 6.50 million. In European countries, it is estimated that PQ issues affect industry and commerce around $10.0 Billion. [25].
Hydrogen fuel cells (HFC) have contributed deeply to electrical power systems due to their technical benefits, easy maintenance, and running cost. Typically, HFC can be widely used and implemented in distribution network systems. However, one of the biggest issues that face the operation of DNS is power quality issues, especially voltage sag. The issue of voltage sag leads to a high decrease in the whole DNS efficiency. One of the most common issues to attract the attention of many researchers [6,12,13,28,29], voltage sag can cause huge damage to DNS and equipment, customer demand, and industrial application. Thus, the voltage sag continues to pose huge challenges to the DNS. As a novelty, to address this paper, the present paper aims to provide a comprehensive study of annual energy storage deployment by countries, 2013–2019, and the global energy-associated CO2 emissions caused by the power sector in advanced economies and the rest of the world from 2010 until 2019. In addition to that, the technical novelty of the paper is to propose HFC D-STATCOM associated with ANFIS, FLC, and PI controller to enhance the controller performance under single, two, and three-phase fault scenarios against voltage sag issues. To settle this issue, the model of ANFIS and FLC controller for a three-phase full-bridge inverter with pulse width modulation (PWM) is demonstrated in the presence of different disturbances. Furthermore, a filter is modeled to decrease the voltage sag which the stability of the filter can be considered as an important issue. Based on the backpropagation algorithm used for decreasing fuzzy rules. This paper points out that the computational burden has been improved, resulting in the faster dynamic performance of HFC D-STATCOM to inject the voltage in the DNS. It can be seen that the ANFIS and FLC scheme provides appropriate results with less computational burden and simpler structure with optimized responses in challenging conditions. The capability of the proposed HFC D-STATCOM is validated for different operating conditions through simulation and results.
This paper has organized as follows: Section 2 describes the relationship between the energy storage system and carbon emission (CO2). In addition, annual energy storage deployment by countries, 2013–2019, and energy-related (CO2) emissions, 2010–2019 are considered. Section 3 discusses applications and technologies of ESS in electric power systems. Section 4 discusses the DNS of ESSs, PQ issues, challenge of ESSs, and change in DNS fault level, DNS, voltage sag, source of voltage sag, and negative effect of voltage sag. Section 5 addresses the benefits of HFC in DNS. Section 6 is primarily concerned with modeling D-STATCOM and modeling HFC-connecting to DNS. Section 7 presents a discussion regarding the control techniques of HFC D-STATCOM. Section 8 deals with simulation parameters. To sum up, the results of modeling and conclusions are presented in Section 9 and Section 10.

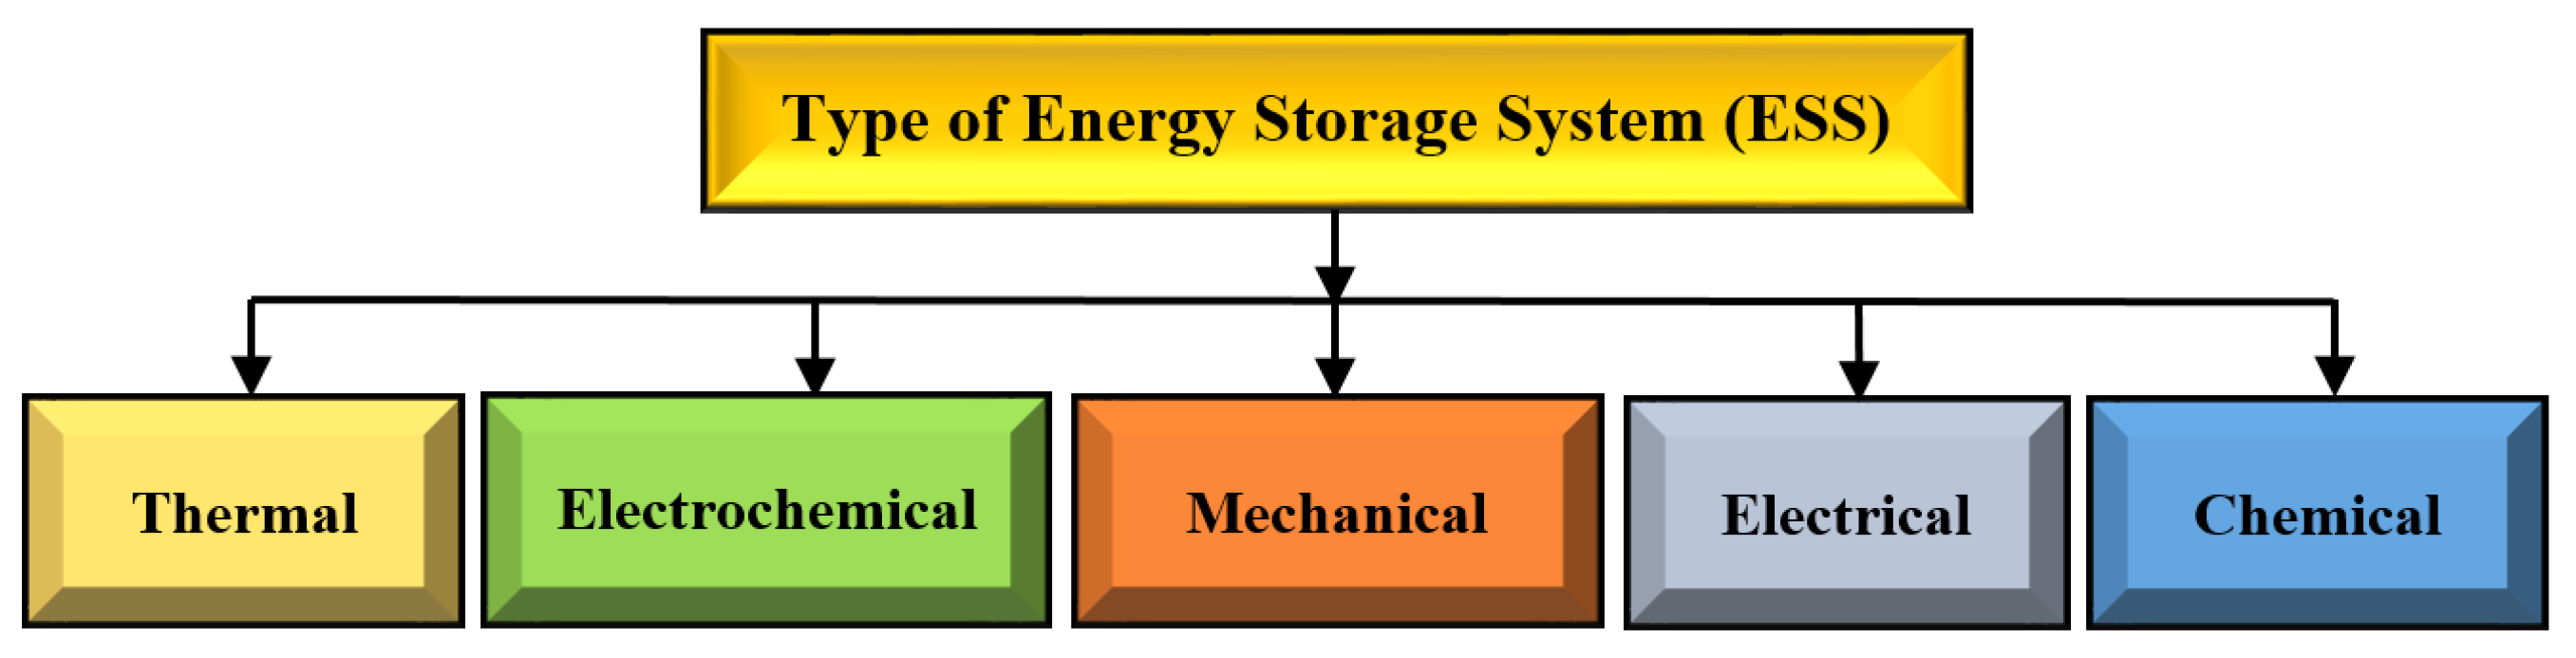
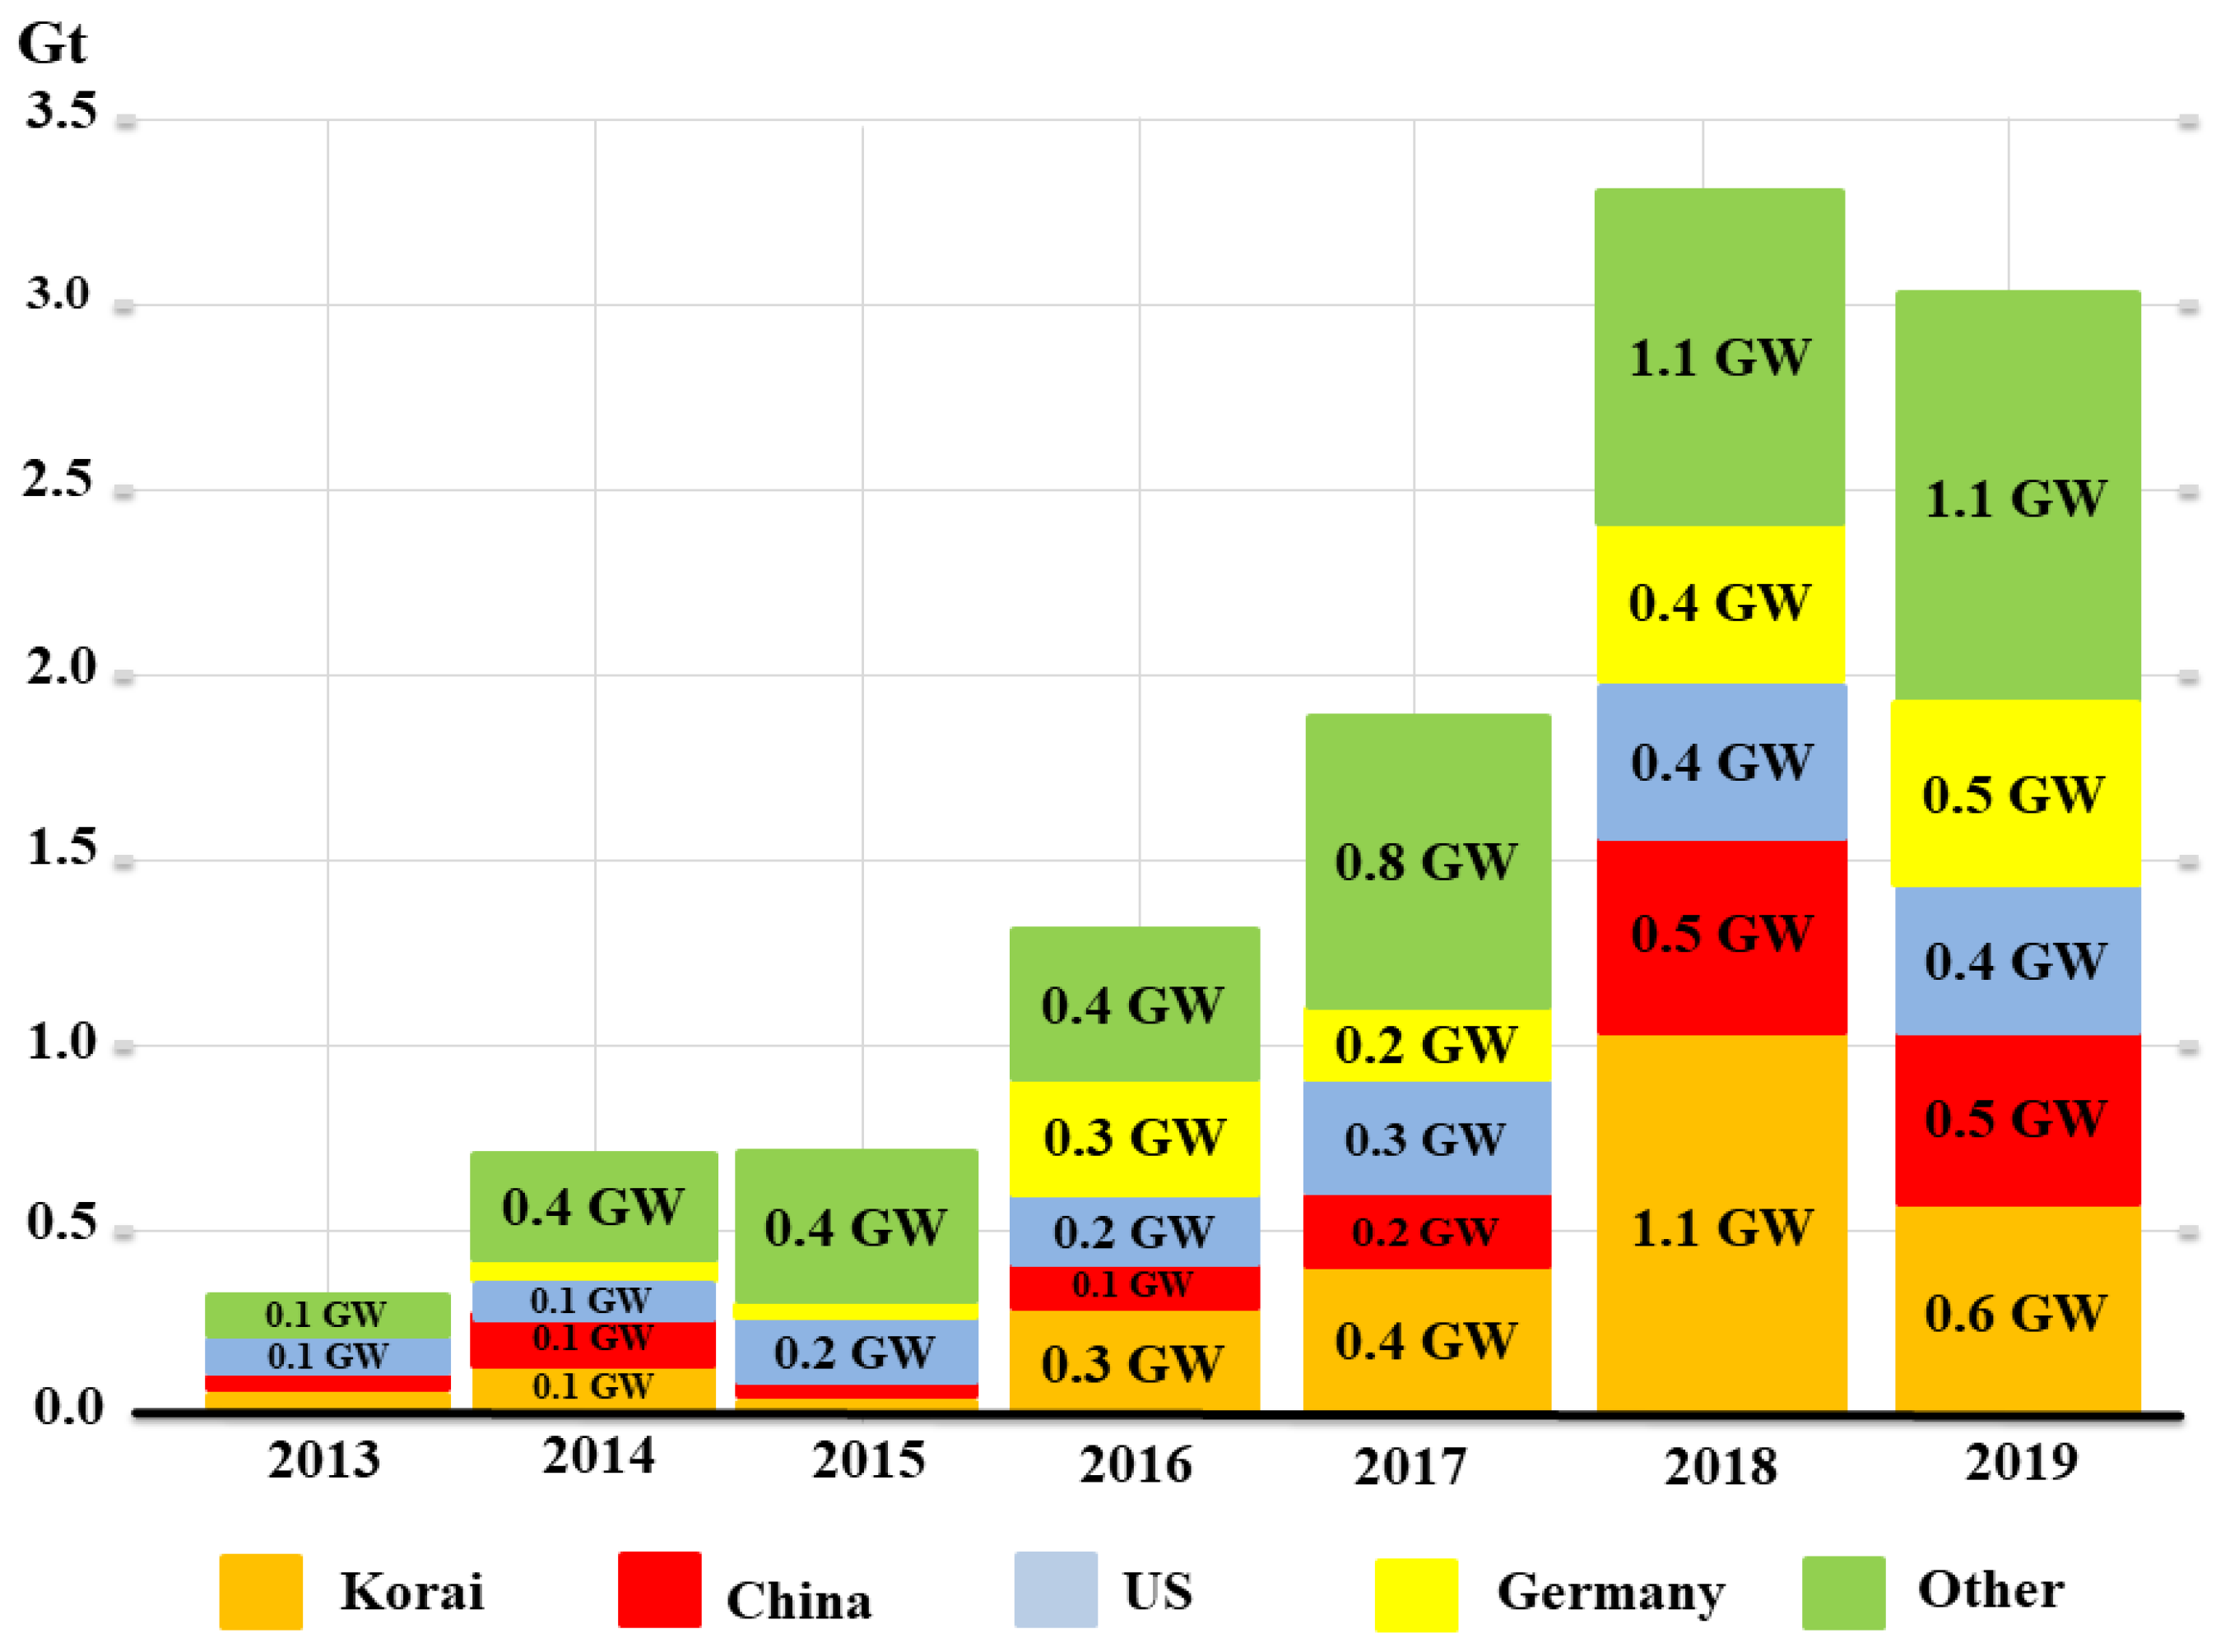
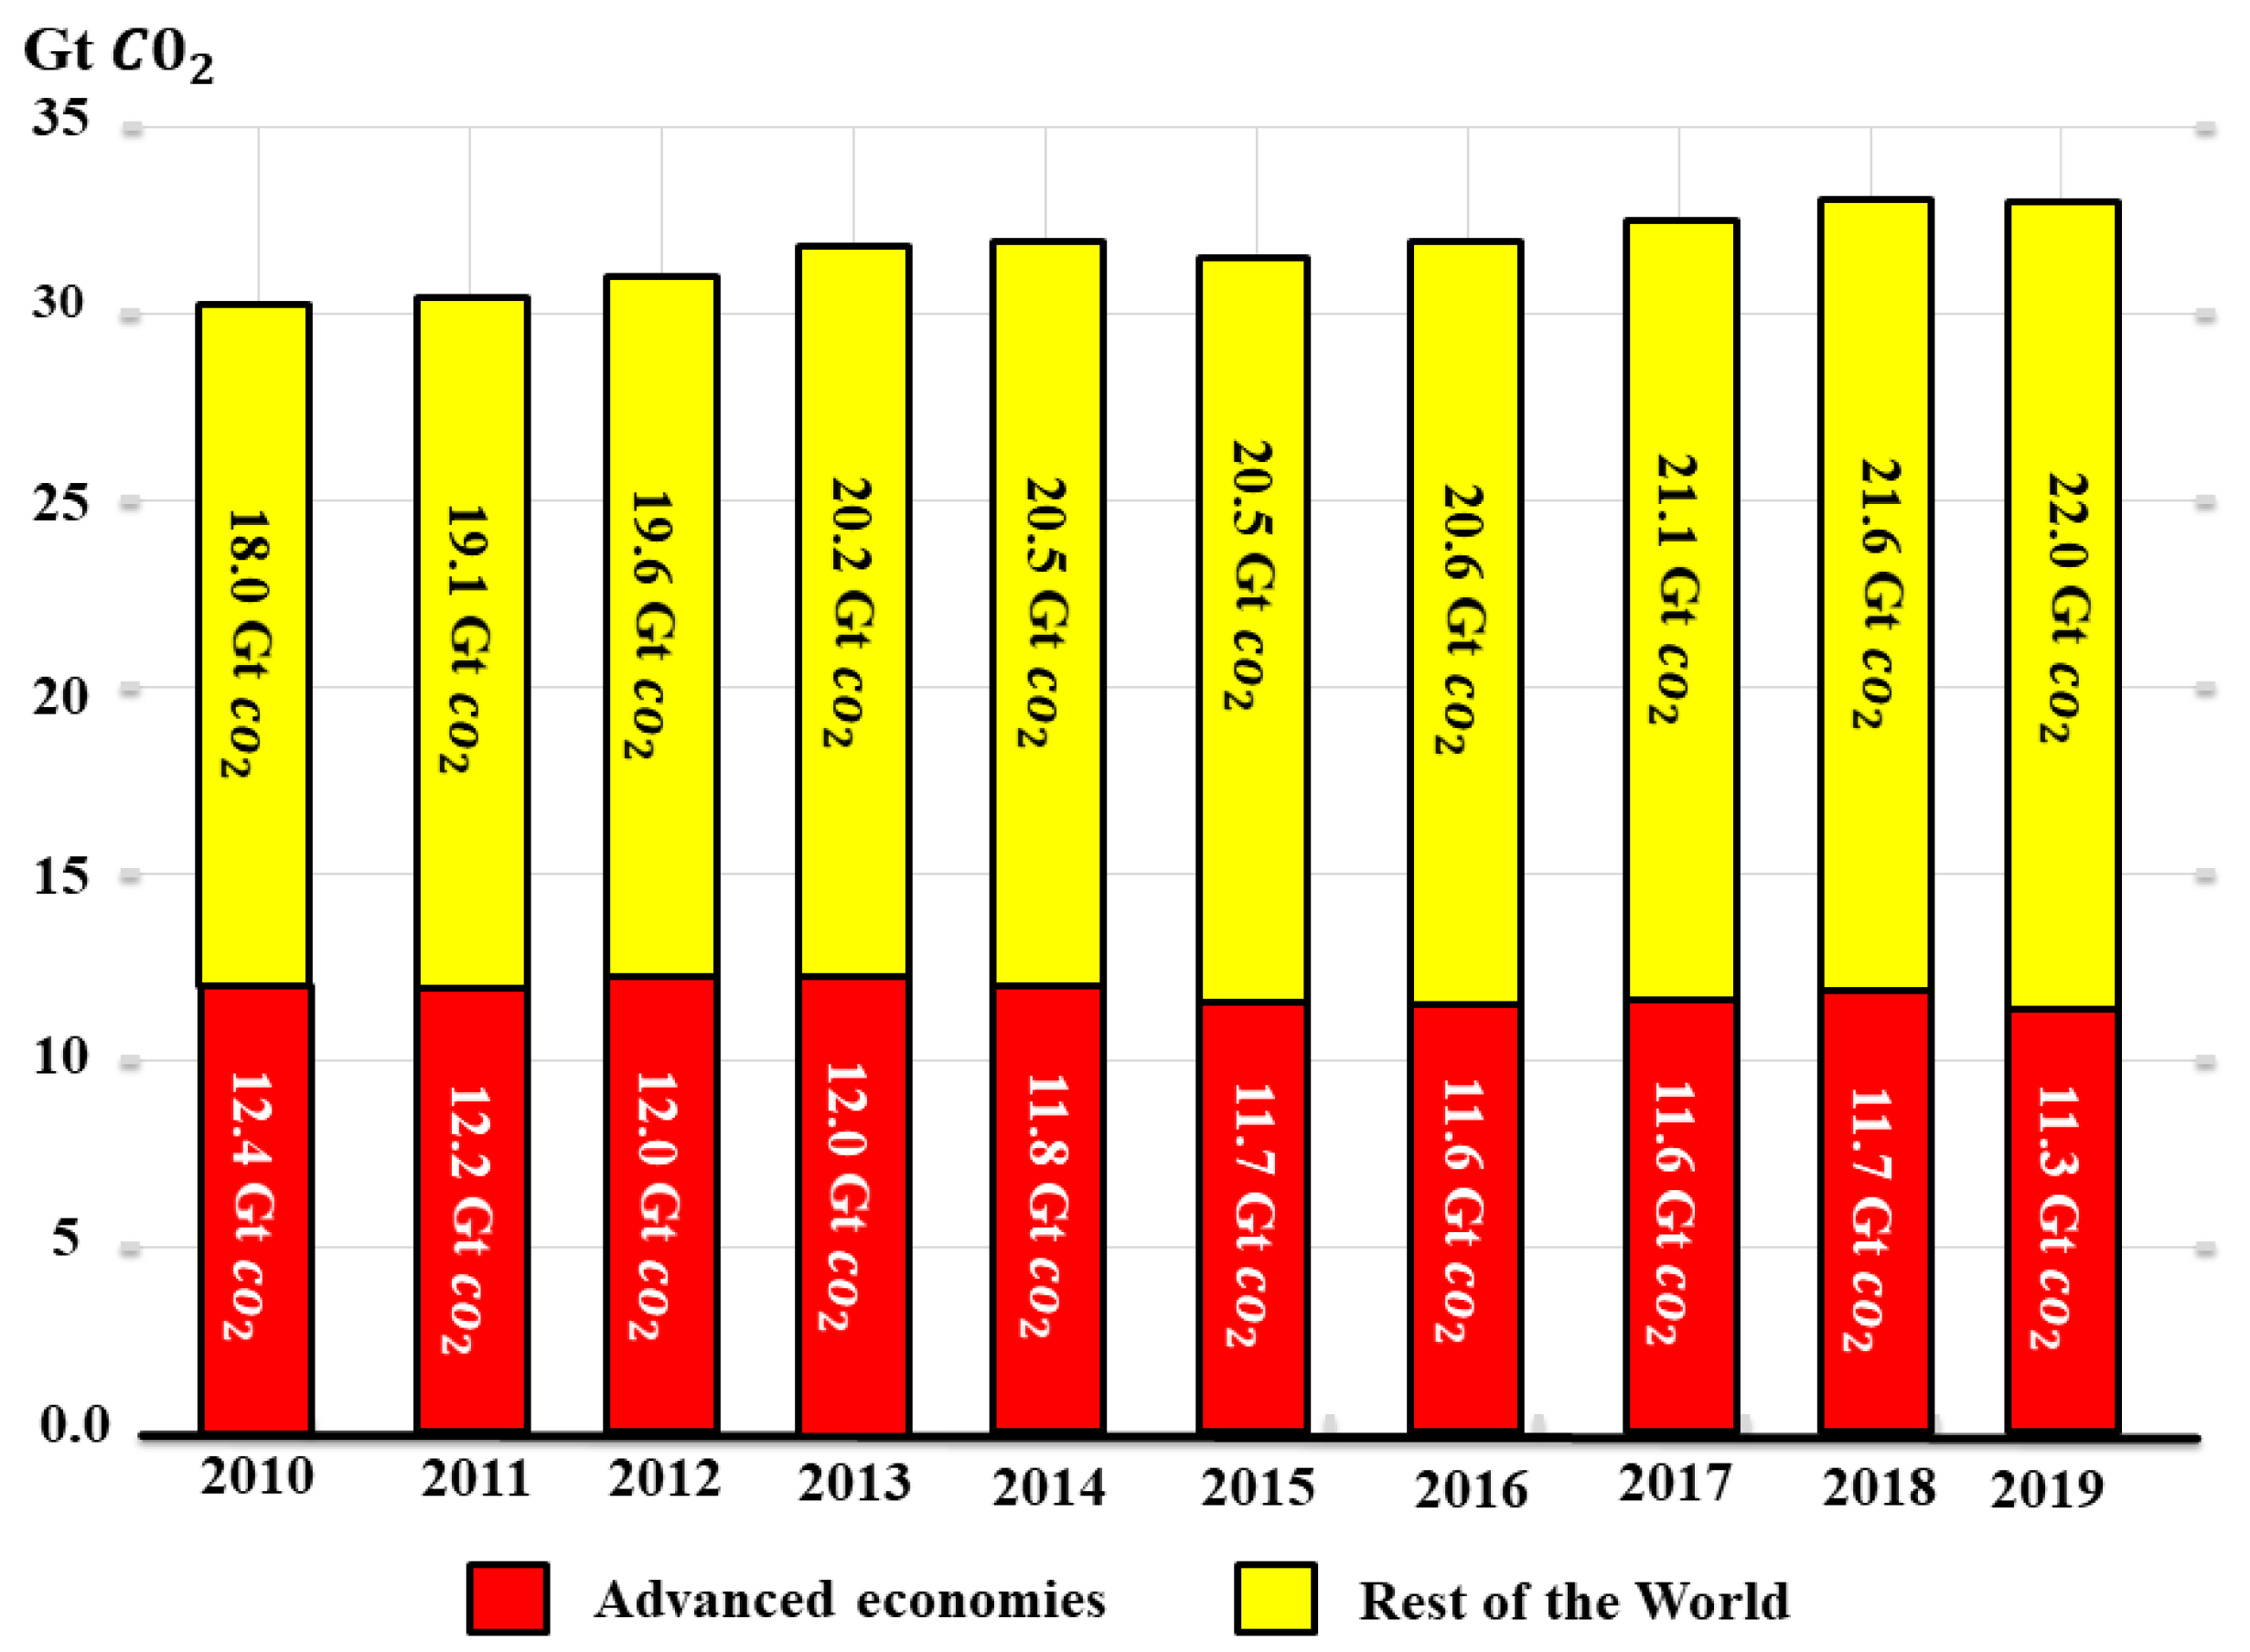
2. Relation between ESS and Carbon Emission

Nowadays, there is a growing consensus of competitive advantage between energy storage systems (ESSs) and carbon emission (CO2). ESS considerably benefits this area [10]. ESSs have both achieved great results interfacing with more renewable energy sources (RES). Attempts are being made to solve a multitude of problems like global warming, e.g., meeting an increasing demand for electric power, decreasing overdependence on fossil fuels for electrical power production, and decreasing the entire carbon footprint of electrical power production. For example, Germany is a central leader in the European energy transformation and looks to lead by setting ever more goals regarding energy. Owing to their high contribution to GHG, the industry sector in general and the electricity sector in particular are priorities. The energy economy accounted for 37.0% of GHG pollution in 2015, and the transport industry accounted for almost 18.0%. It is important to know that 85% total amount of GHG emissions have been caused by the energy sector [3]. In addition to that, Germany announced that renewable energy electricity generation accounted for 3% of the overall share of 1990, although by 2016 it accounted for 32% [3].
In this context, ESS technologies continue to grow, with strong performances in utilization, highly effective energy conversion, and environmental pollution control. Hence, ESS converter-based renewable energy (RE) systems such as fuel cell power technology, require using “clean” power production. On the other hand, utilizing diesel and gasoline in power plans can contribute dramatically to the issue of global emissions. Several fault scenarios can create an undesired voltage sag in DN that can lead to overheating and instability in feeders, decrease efficiency, and increase carbon emission. For this reason, ESS and an intelligent control system can mitigate PQ issues and GHG emissions at the same time. In this context, ESS technologies continue to grow, with strong performances in utilization, highly effective energy conversion, and environmental pollution control. Figure 2 clearly highlights the annual energy storage deployment by countries, 2013–2019.
Hence, ESS converter-based RE systems such as HFC power technology require using “clean” power production. On the other hand, utilizing diesel and gasoline in power plans can contribute dramatically to the issue of global emissions. Several fault scenarios can create an undesired voltage sag in DN that can lead to overheating and instability in feeders, decrease efficiency, high carbon emission. For this reason, ESS and an intelligent control system can mitigate PQ issues and GHG emissions at the same time. It is worthy to note that annual installations of energy storage (ES) technologies decreased in 2019. This point is a clear indication that installations of ES are likely to deteriorate unless something is done now. Moreover, grid-scale storage shows every indication of installations slowly dropped to 20%. However, there is another aspect of behind-the-meter storage which remains clear overall. To preserve its improvement, this can be achieved by consolidating a shift towards behind the meter storage. Events in 2019 pointed out how fragile the evolution in these technologies remains. Figure 3 illustrates energy-related CO2 emissions, 2010–2019.
Policy intervention is one of the main causes of fragile evolution. Furthermore, direct support or market creation is an important point that should be highlighted. This paper has pointed out the global energy-associated CO2 emissions caused by the power sector in advanced economies and the rest of the world from 2010 until 2019. The CO2 emissions in 2010 reached 30.4 Gt. The CO2 emissions in, 2011 increased by 31.3 Gt. Then, CO2 emissions in 2012 reached 31.6 Gt. CO2 emissions in 2013 rose to 32.2 Gt. CO2 emissions in 2014 were 32.3 Gt. Moreover, the CO2 emissions reached the same amount in 2016 and 2015 at 32.2 Gt. The CO2 emissions in 2017 were 32.7 Gt. The CO2 emissions in 2018 and 2019 reached up to 33.3 Gt. This outcome is majorly due to a sharp decline in CO2 caused by the power sector in advanced economies. Meanwhile, advanced economies experienced a further decline in their emissions by more than 3.2% (or 370 Mt). The power sector continues to be responsible for 85% of the decrease. Moderate weather plays a key role in several economies compared with 2018. this helps to decrease the number of emissions by 150 Mt. There are clear indications that weaker global economic growth has also played a role, reducing the growth in emissions in economies. This is further supported by an International Energy Agency (IEA) report on CO2 emissions from fuel combustion. In 2020, it is indicated that weaker global economic growth caused a decrease in emissions in emerging economies such as India [30]. There was an upward trend in emissions in 2019. It is suggested that clean energy transitions get more support to continue growing in the power sector. In this regard, the global power sector has slowly declined by 1.2% (or 170 Mt).

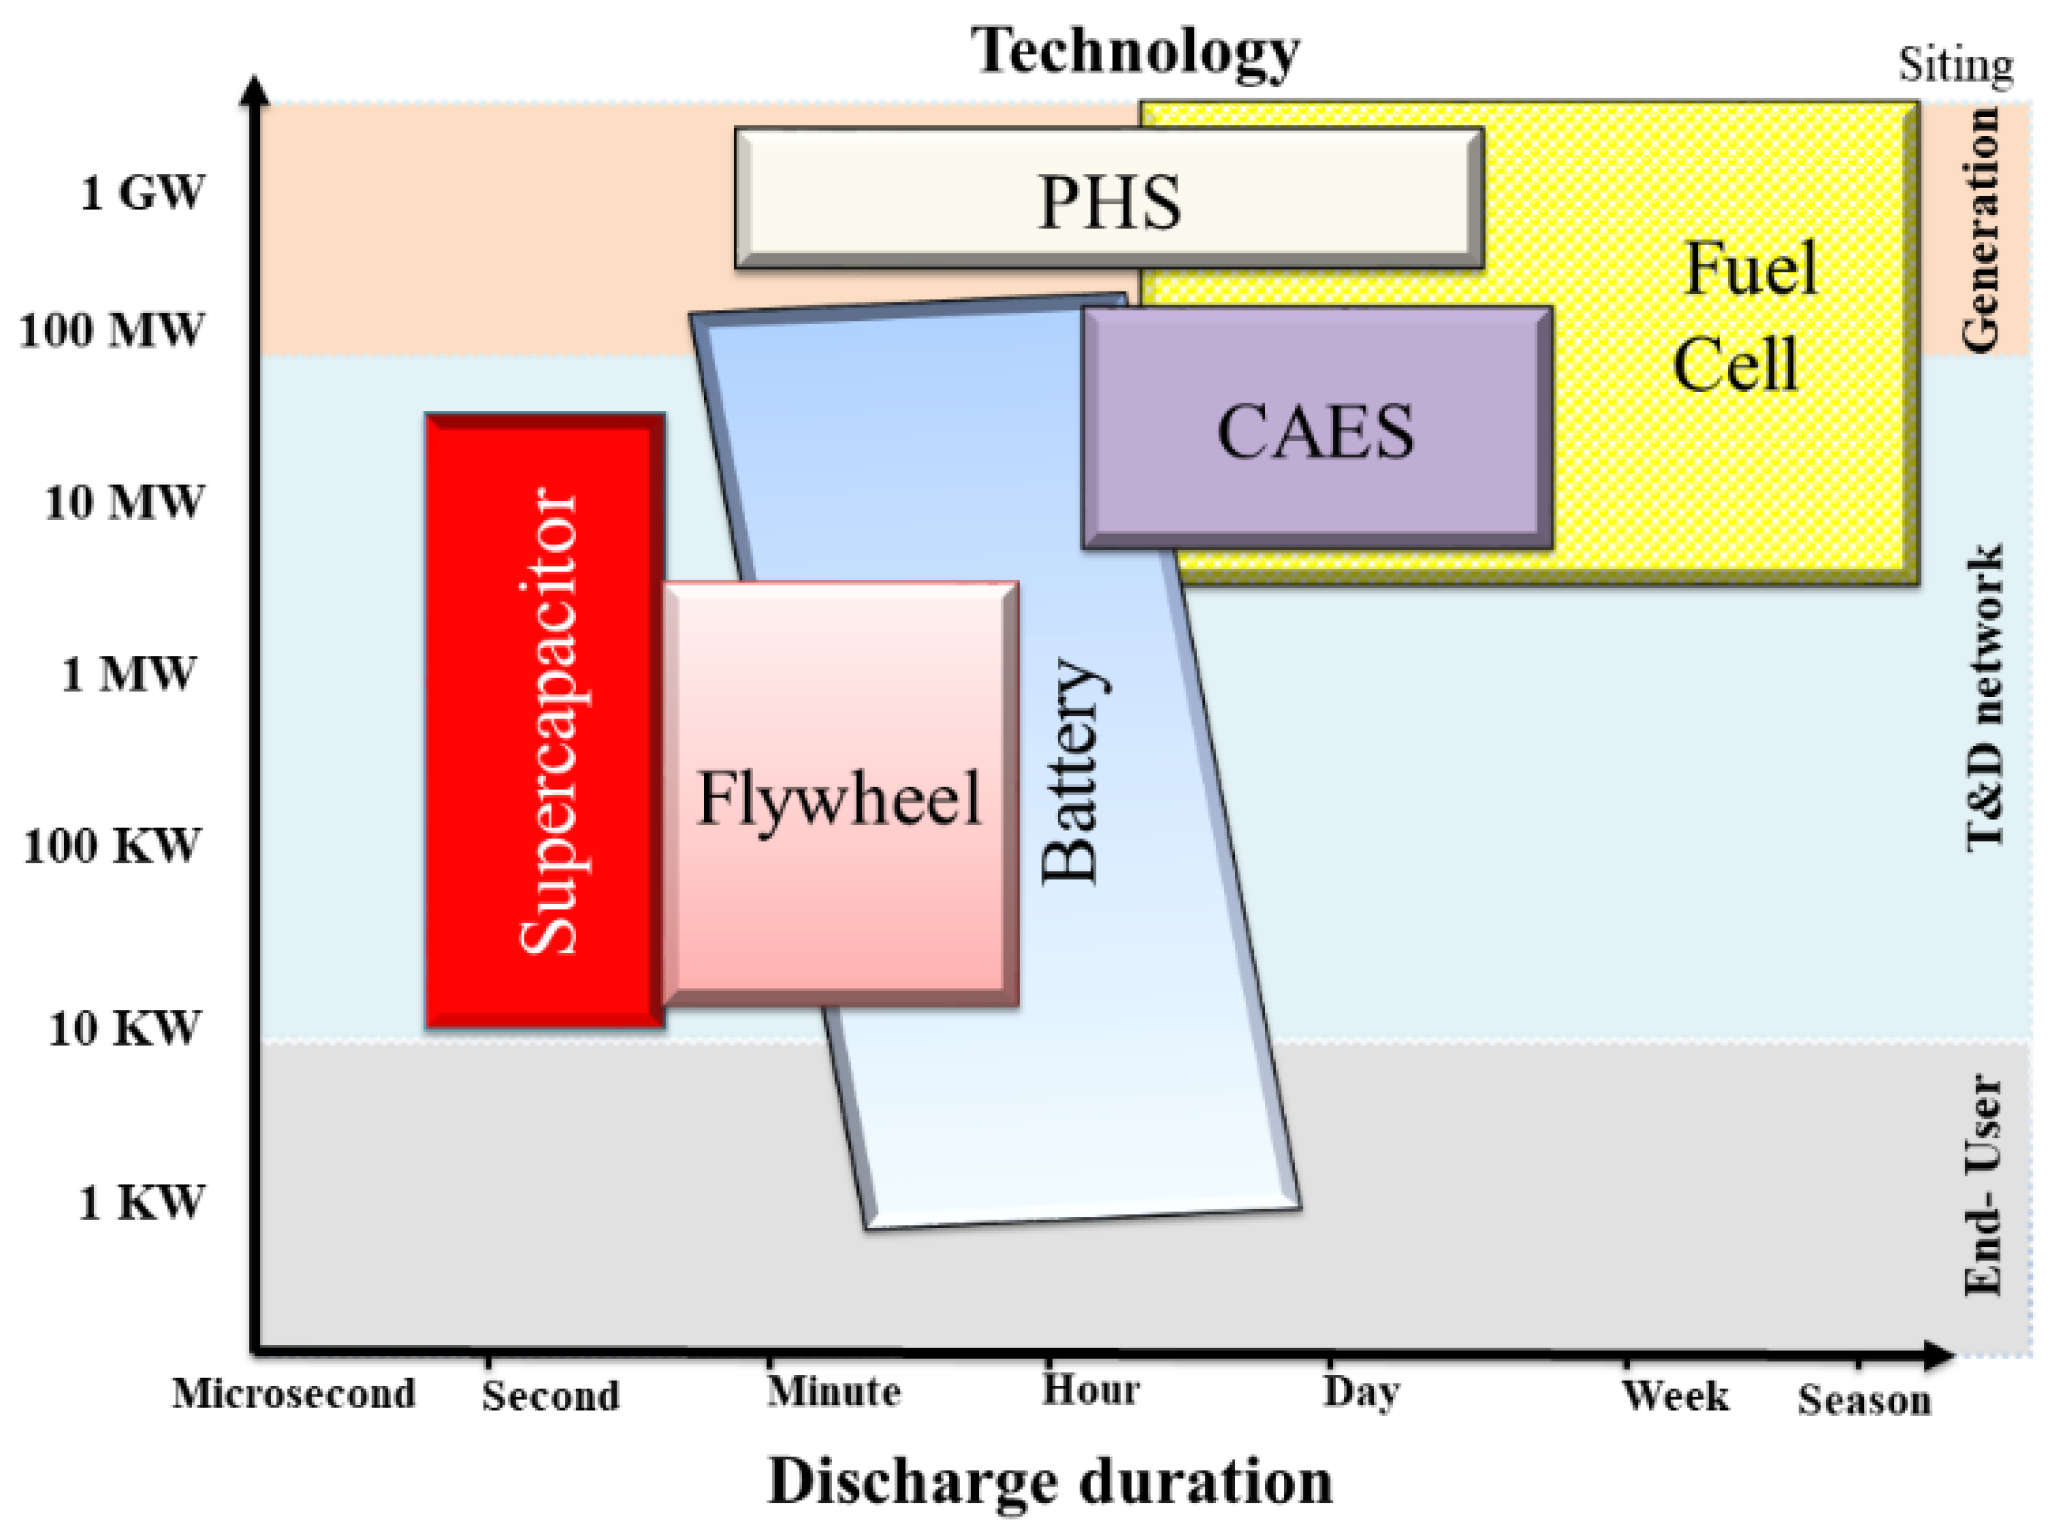
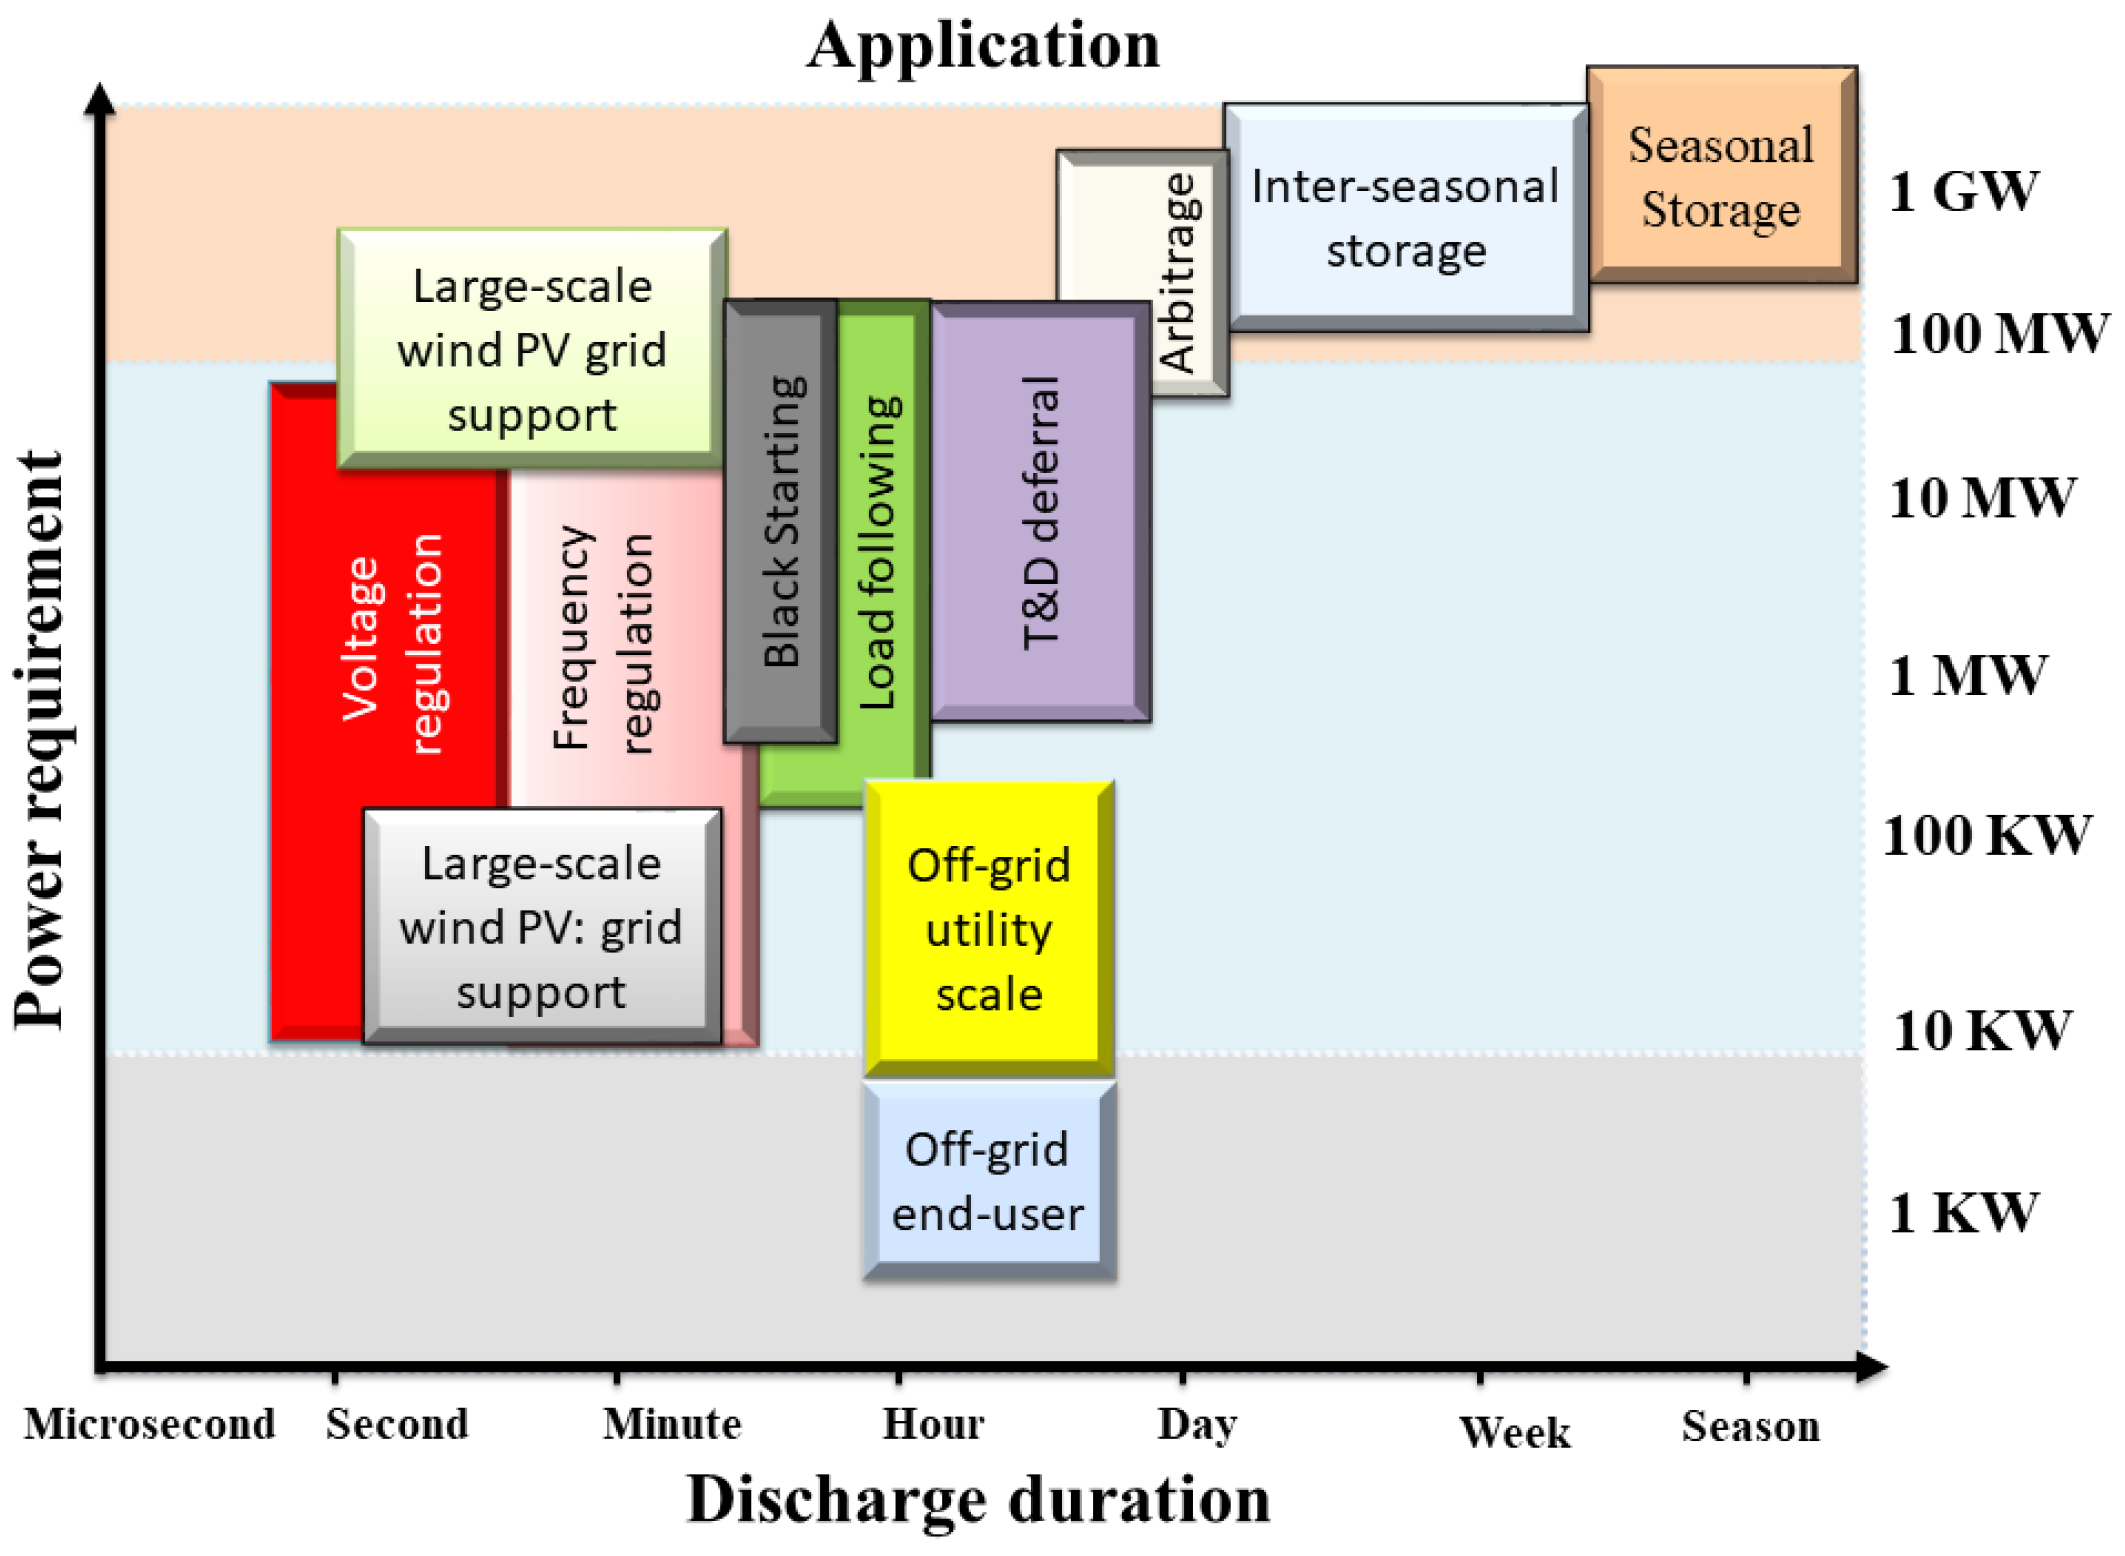
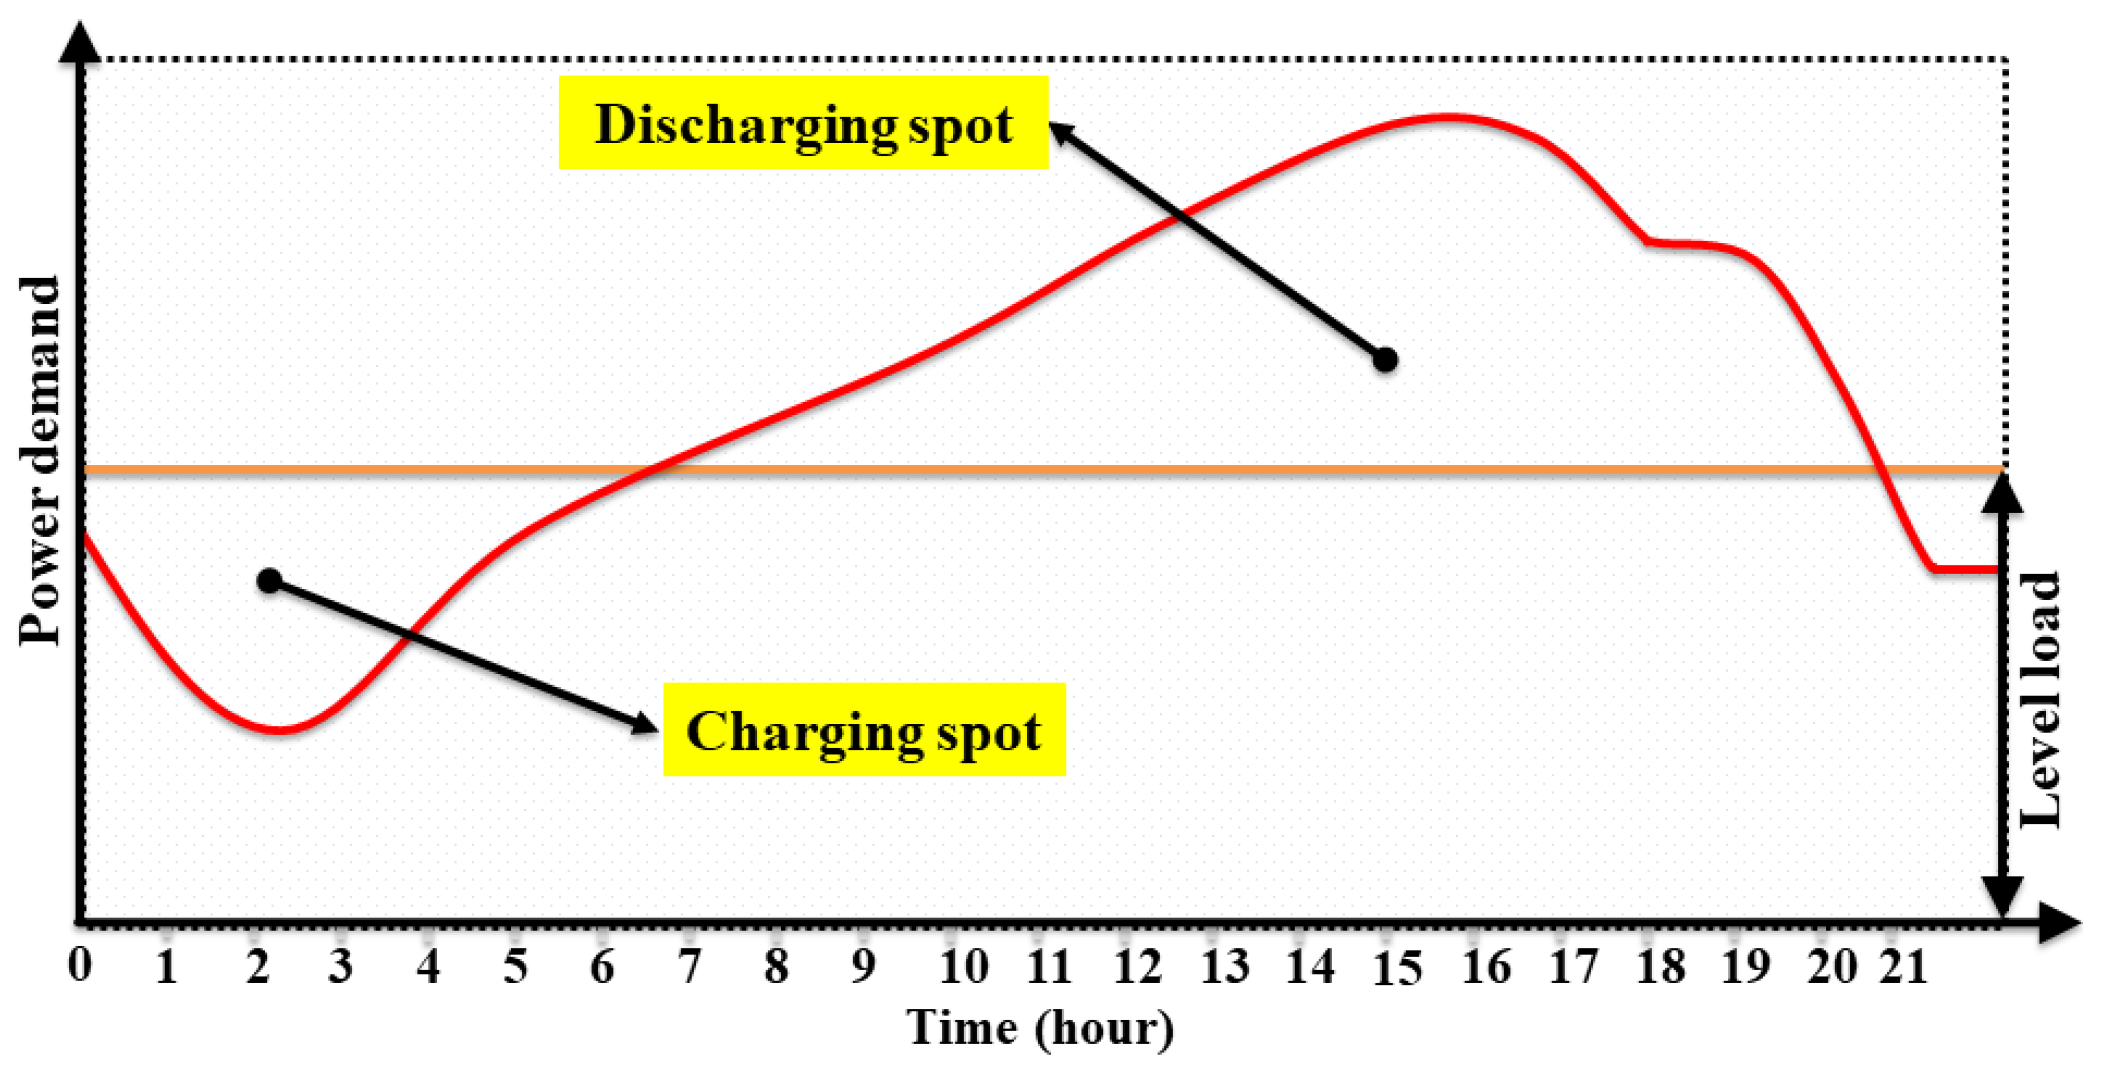
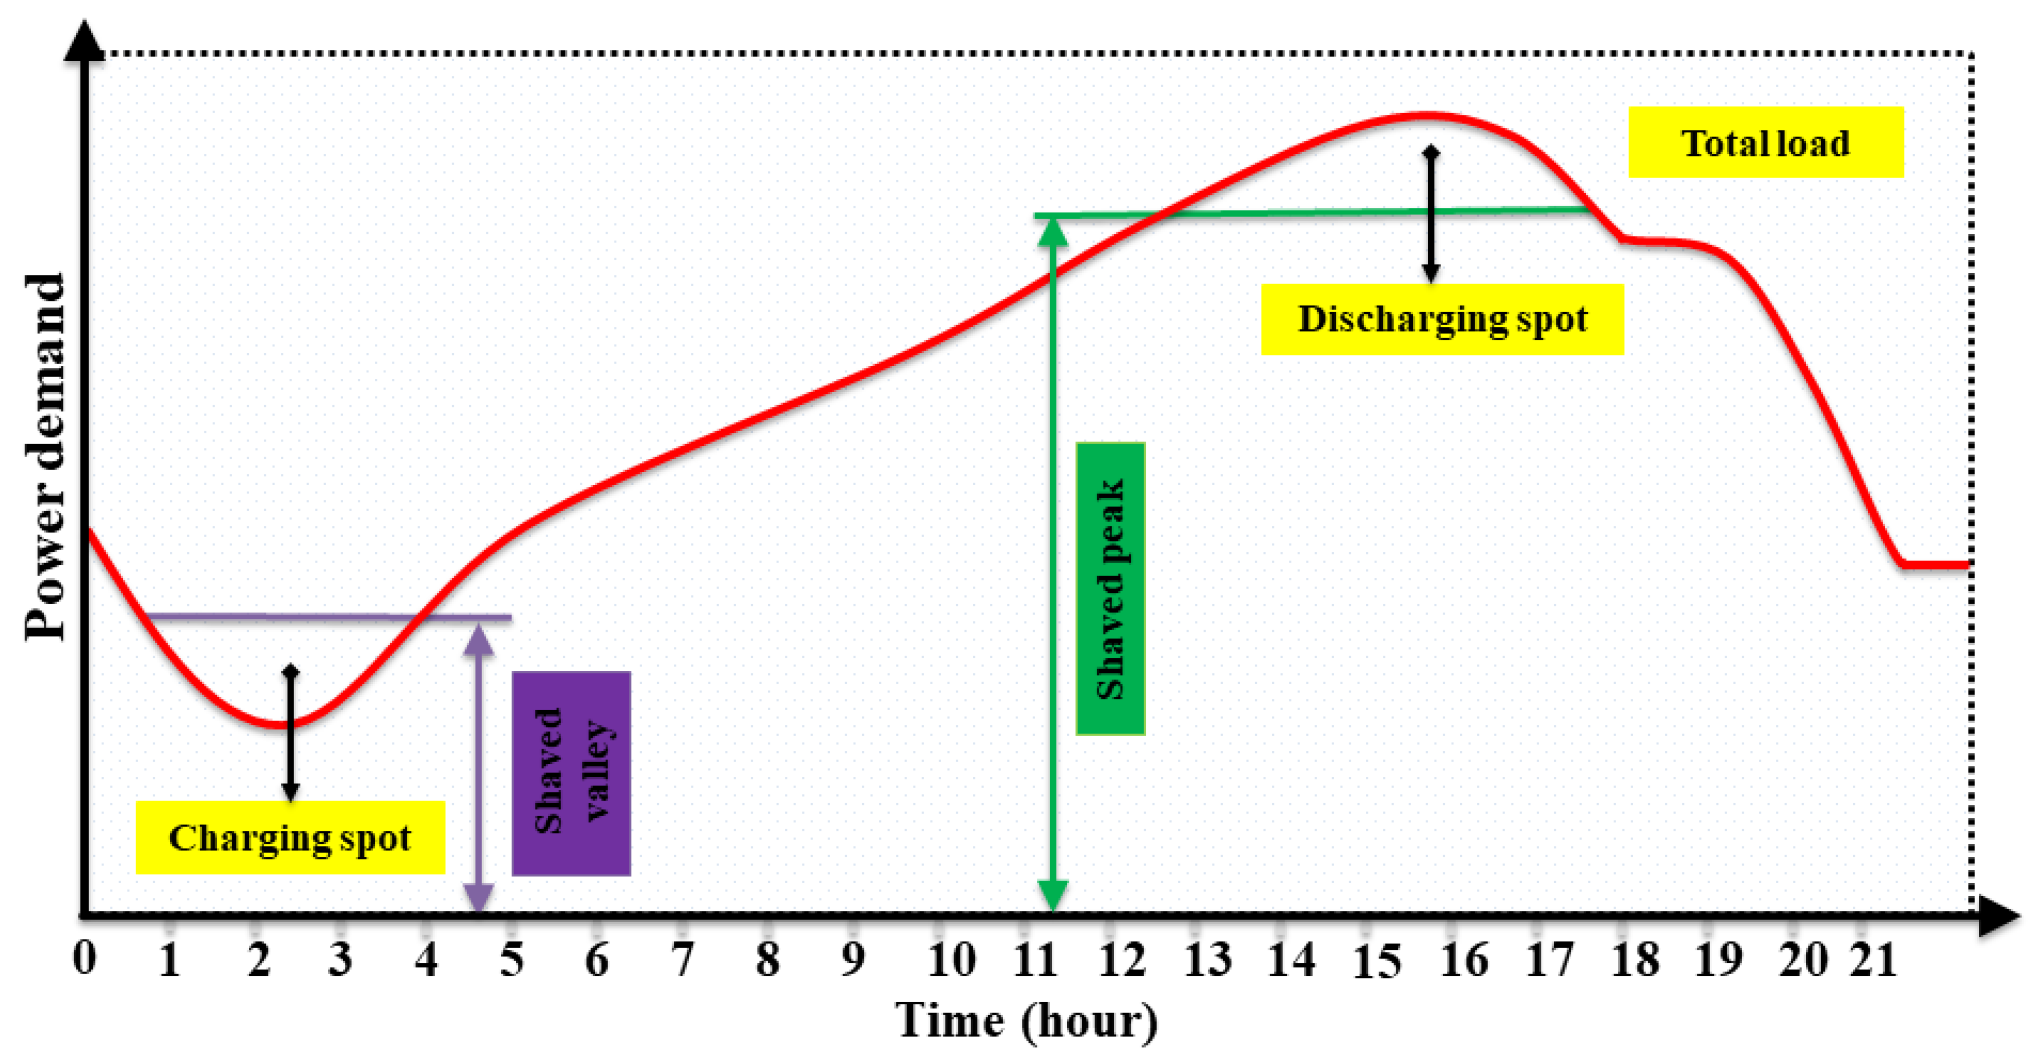
3. Applications and Technologies of ESS in Electric Power System

In this section, the DNS utilization of energy storage systems (ESS) settlements were classified according to their physical locations in the electric power system where these applications had been installed. In this context, ESS can be categorized into two broad sets. The first ESS categorized is in front of the meter and the second ESS categorized is behind the meter. Besides, ESS in front of the meter can be profoundly categorized according to the transmission network as well as a distribution network. On the other side, ESS behind the meter fundamentally takes place on the demand load which is known as the customer side. At this point, the customer side can be further classified into residential subsets as well as non-residential, including industrial and commercial. The approach to ESS behind the meter has been treated with an overly developed sense of importance recently.
For example, in 2018, the annual installed capacity of the energy storage system behind the meter was 1.90 GW, while 1.20 GW of annual installed capacity was reached by ESS installed in front of the meter. This section is essentially concerned with the benefit rate of services in the electric power system domain, such as ESS for voltage support, frequency response, and reliable service. Besides that, services of ESS can be classified based on the benefit of services into three groups, namely transmission network, distribution network, and customer side. Table 1 shows the service scope and the electric power system domain for the applicable ESS. It is illustrated that the power rating of the transmission network is (10~100 s) MW, power rating of DNS is (0.010~10) MW, and power rating of distribution network is (0.002~2) MW. Table 1 illustrates the categorization of ESS applications using the physical locations in the electric power system domain for ESS and the benefit of services.
In other words, it is also noteworthy to classify in the electric power system domain ESS applications based on operating principles for obtaining the benefit of hindsight. From this perspective of DNS, ESS is contributing hugely to the success of solving the issue of power quality events based on capacity resources, power regulation, and energy storage. Thus, each term has its physical characteristics. DN achievement the potential of ESS to ramp its power quickly and bidirectional more particularly voltage control, frequency regulation, and reduction of power fluctuations [10,29]. Besides that, the usage of energy arbitrage gainfully employed is dependent on ESS storing and releasing a huge amount of electrical power energy for financial beneficial impact [31]. Due to worldwide energy conservation, ESS plays a serious part in efficient and effective energy conversion as well as utilization [12]. The technology of ESS can be further categorized by size according to the power capacity of input and output and the discharge duration time. In this aspect, such elements as the annual number of cycles performance, round-trip efficiency productivity, and even self-discharge can be expected. The annual full-load hours can also have an impact on ESS. Moreover, the position of ESS and the response time of ESS are also other significant benchmarks. Fuel cell-based hydrogen is especially applicable to huge scale ES pursuance at the megawatt range, transmission, and distribution (T&D) network from 10 KW to 10 MW, covering hourly or even seasonal storage durations. On this point, Figure 4 presents the categorization of ESS technologies using the power capacity of income, outcome, and their discharge duration time. Figure 5 shows the categorization of ESS application based on the power capacity of income, outcome, and their discharge duration time.
On the other hand, despite these recent findings, the role of the capacity credit is regarded as the crucial factor in the capability of ESS. Capacity credit can be applied to postpone or even decrease the requirement for upgrading existing T&D network parts and generation, which are utilized to mitigate the power quality issue, supply peak demand, and maintain or sustain power system stability. However, the ESS is remarkably efficient and effective in shaving peak load applications in terms of high energy, its rapid response, and intrinsic bidirectional power flow. Figure 6 indicates the load leveling of the ESS application. Figure 7 describes the peak shaving of ESS application. The ESS was able to gain a competitive advantage over its rivals by absorbing excess energy over the network through minimal demand duration. therefore, the power injection to the DN within inquires demand duration. The load-leveling is a fundamental difference that makes an effort to flatten the entire load curve whereas peak shaving focuses the spotlight on decreasing the peak load as well as filling the load valley. The load leveling and peak shaving are considered rules for ESS to enquire about capacity credits.

4. Challenges of DNS

Conventional DNS structures are capable of accommodating the installation of the ESS such as HFC power technologies. Even though ESS can deeply affect several quantities of the entire power system, in particular the power flow of the system and the voltage profile. In this context, DNS still faces many challenges in terms of PQ, including voltage sag, source of voltage sag, effect of the voltage sags, system stability, network voltage level, fault levels, cables, and distribution lines. Conventional DNS structures are capable of accommodating the installation of the ESS such as HFC power technologies. However, ESS can deeply affect several quantities of the entire power system, in particular the power flow of the system and the voltage profile.

4.1. PQ Issues and the Challenge of ESSs
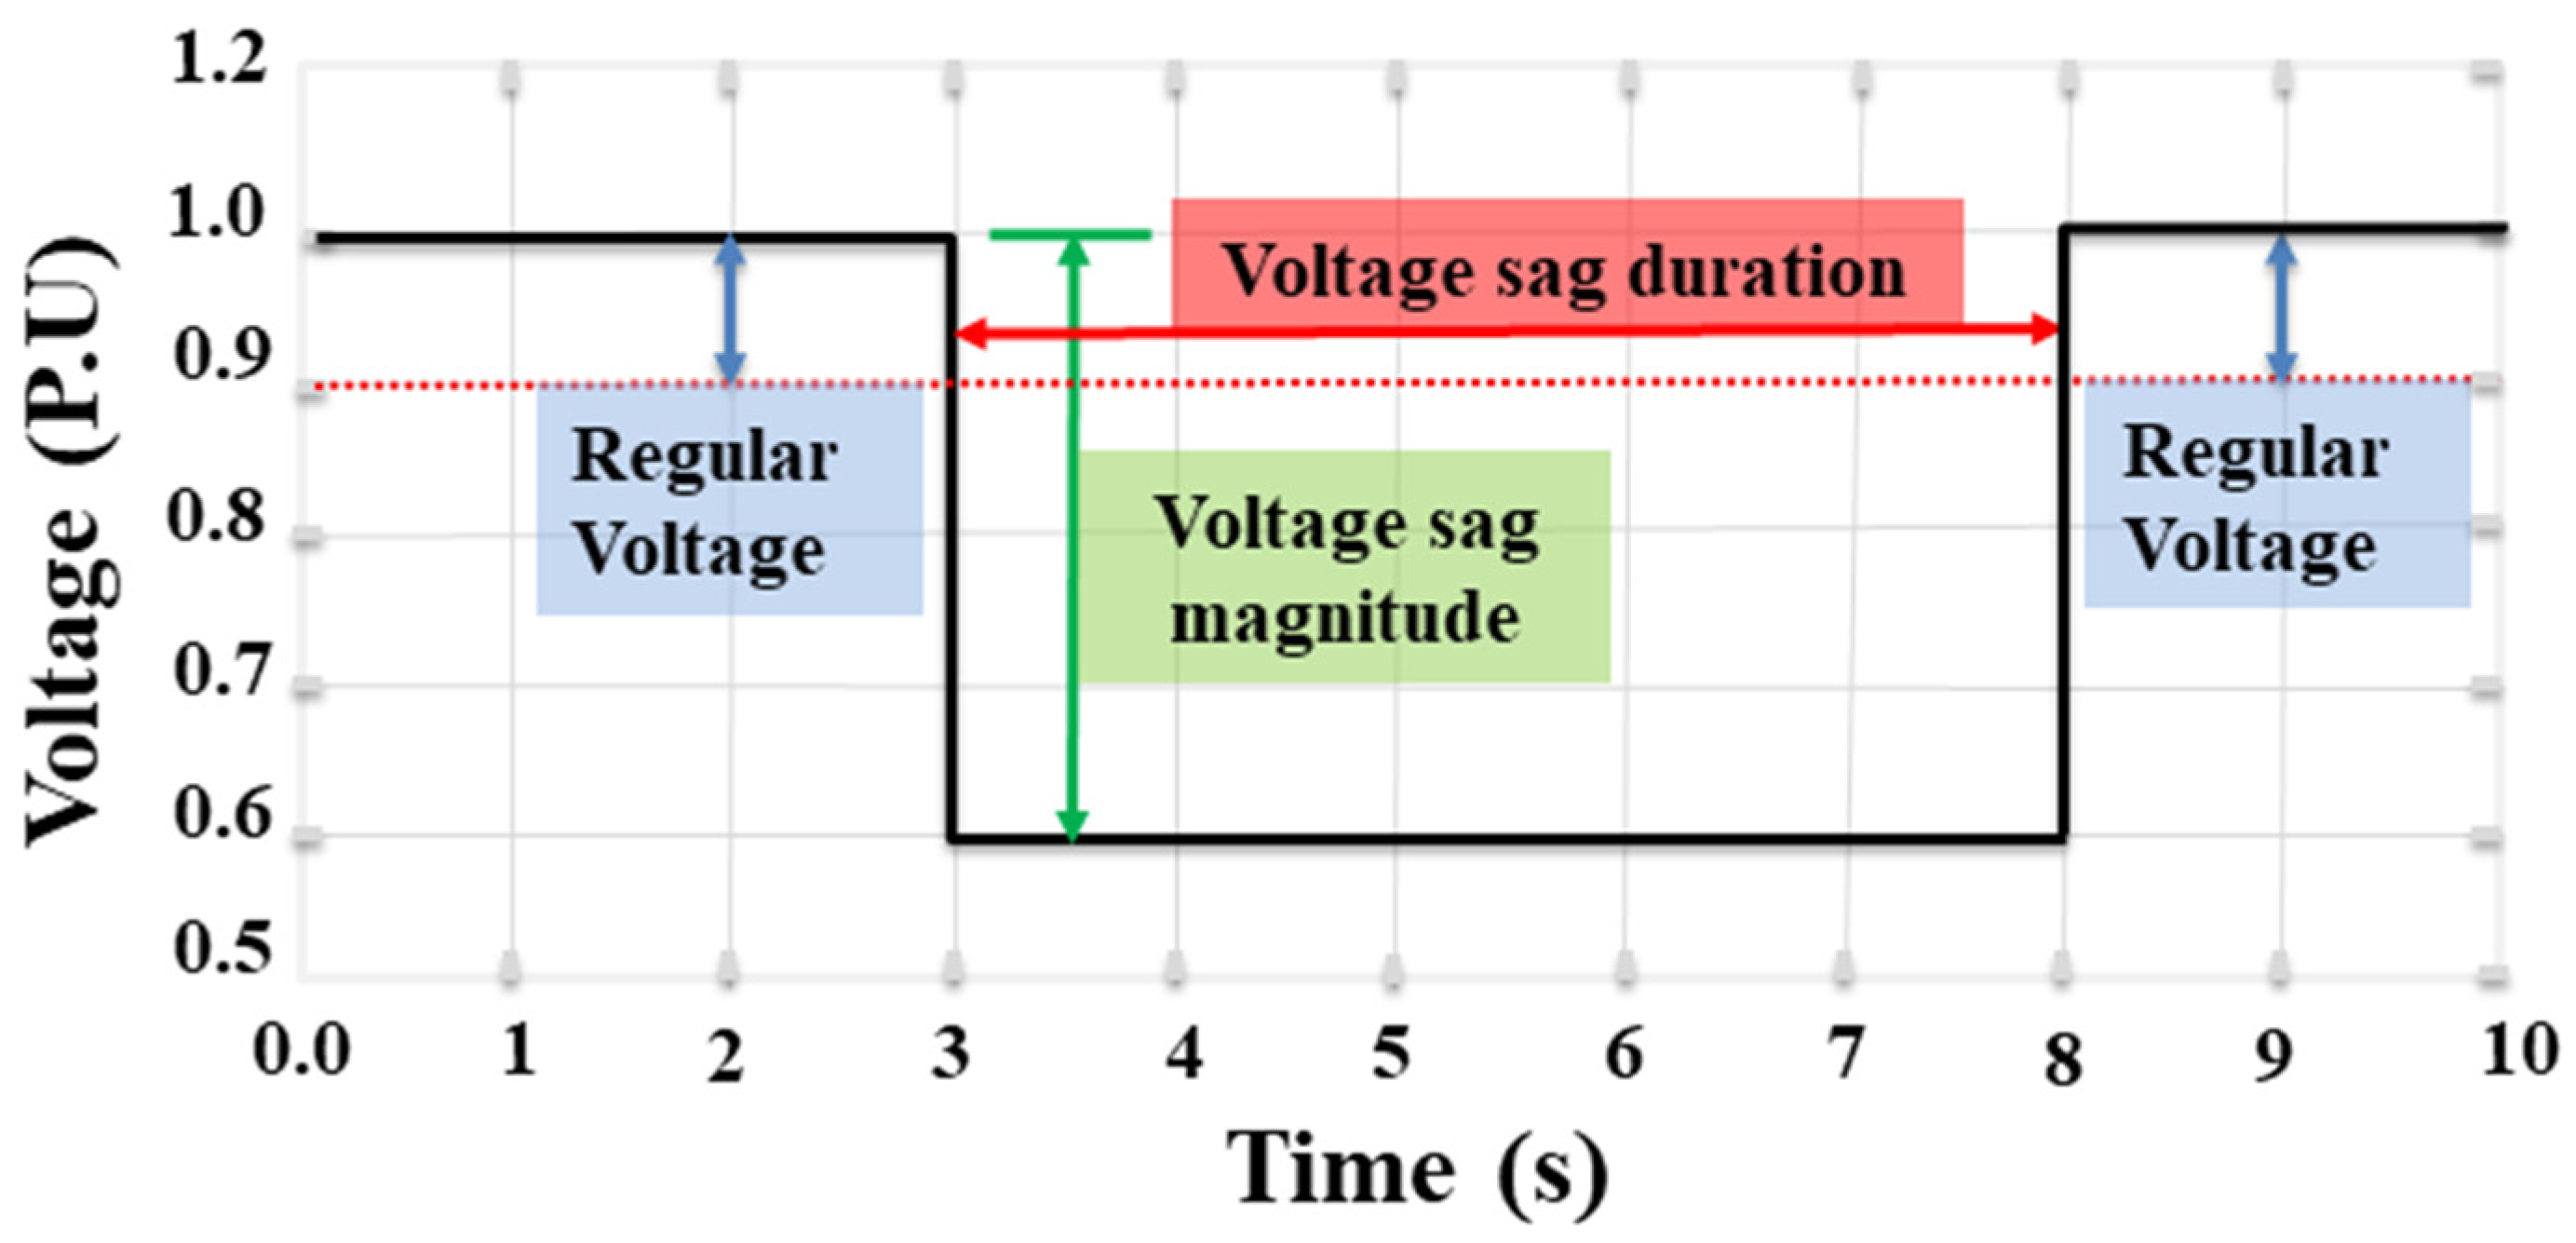
PQ requires the integration of technological solutions to their problems, including voltage sag, current disturbance, and harmonics and unbalancing [23,28,29]. A close look at the subject matter of PQ indicates the capability of the whole electrical system to help generate a perfect power energy supply which, in its purest form, requires symmetry, balance, and access to clear, noise-free sinusoidal wave appearance [30,31,32]. It is a common element forming stabilized compounds when both frequency as well as voltage have been taken into consideration Definitions of PQ are rapidly being introduced by the Standards of IEEE as well as IEC [33,34,35,36]. The failure of the power system was a direct result of the PQ issue. The transient phenomenon aimed at influencing the result of voltage sag on DNS and the upstream caused by short-circuits in power transmission feeder or distribution feeder [6,36]. The results also provide insights into a potential influx current engaged with the onset of massive machines, changes in stability on the load side, electrifying transformers, and exchanging operations in the power system [37,38,39]. Furthermore, the matter of voltage sag associated with PQ is often difficult to resolve and may require different solutions. The voltage sag plays a vital role in PQ and constitutes a significant disturbance in the PQ of the power system. Table 2 presents the most common PQ issues in DNS.
PQ was presented for consideration by 1100–2005 as the theory of powering and grounding sensitive electronic devices in a manner that is particularly appropriate for the operation of that DN’s equipment [38]. It is essential to mention that the IEEE 1159–2009 presents the voltage sag and voltage dig. This voltage sag phenomenon has been widely observed [37,39]. The power quality rapidly decomposes into its poor power on the DNS. PQ problems could cause some major damage to the power system by voltage sag which indicates the decrease in supply voltage magnitude and changes the amplitude of voltage [39,40,41,42]. The PQ issue focuses on voltage interruption over an extended period. A well-known problem with voltage interruption takes into account the period of time during a fault [43,44,45,46].

4.1.1. Voltage Sag

Mitigating voltage sag aims for a harmony of form and function in the PQ environment which affects the power system. The term voltage sag is defined according to IEEE 1159 that proved scientifically that such phenomena exist [6,46]. Voltage sag is a relative phenomenon of PQ in which the RMS value of the voltage magnitude drops below 0.9 (p.u.) in a period of time less than 60 s [6,45,46,47]. Figure 8 shows the voltage sag characteristics.
The IEEE 1159 proved scientifically that such phenomena affect the power system. It is supported by the fact that it played a major role in setting up the system. Voltage sag is when a short circuit takes place in the power systems, such as single-phase or three-phase fault [47,48,49]. There is increasing concern that voltage sag ideas are considered enormously important [50]. Given the fact that the concept of interruption does not mean voltage sag [51], the interruptions in the description refer to a consumer’s supply, lasting not more than 60 s. The purposes for this can have an adverse effect on the power quality, such as a short-time voltage decrease to a period of time less than 0.1 (p.u.). Under those circumstances, interruptions had the effect of discouraging the operation of automatic reclosing systems completely [52]. Although, to put it differently, what tends to happen is that the voltage sags occur at short circuit current out-flowing into a fault circumstance, but settle down in a period of time less than 0.9 (p.u.) [35,36,37].

4.1.2. Source of Voltage Sag

Voltage sags in terms of short-circuit faults can be the leading cause of voltage sag. They are considered an enormously important power quality issue that can be caused by short-circuiting faults when connecting to heavy loads in the electricity network [53]. Short-circuit faults show a statistically significant effect on DN, responsible for more than 70.0% of voltage sags. Short-circuit faults could have a negative effect on DN operation, operation overvoltage, poor design, installation equipment defects, and insulation material [51,52]. Subsequently, voltage sag duration will depend crucially on the period of time during which the fault scenario transpired. Voltage sags can be broadly categorized into three classes in terms of short-circuit faults. It is obvious that the symmetrical voltage sags are caused directly by a three-phase, two-phase, and single-phase short-circuit fault scenarios [54]. Moreover, voltage sag is the second leading cause of transformer energizing. While a transformer is embedded in the operation, the inrush current produced can be up to 8–10 times the assessed current due to the saturation effect of the core. It is important to mention that inrush current is referred to as a primary phase angle of the no-load transformer and can be one reason for voltage sag [47,53].

4.1.3. Effect of the Voltage Sags

Those fault scenarios might cause by three-phase fault, two-phase fault, and single-phase fault. The fault scenarios result from short circuits at the mainline on DNS. Moreover, the voltage becomes unbalanced, which damages the equipment [32]. Voltage sag is a risk facing the DNS. The ability of voltage sag to do a massive amount of damage rises as power quality issues become more complex and destructive power increases when the demand from commercial and industrial electrical equipment increases [45]. The consequence of imperfect PQ on the DNS may be voltage sag [32,51,54]. Voltage sags can be critical to the operation of a power plant, including a dimming of lighting systems, production rates fluctuate, equipment does not operate correctly, variable speed drives close down to prevent damage, relays, and contactors drop out. Voltage sags risk damaging electrical equipment and can entail significant economic implications [32,55,56,57].

4.2. Change on DNS Fault Level

In general terms, a fault is a state of the matter informed that cannot function correctly and effectively. From the DNS perspective, the fault is significantly related to an uncommon electric current state or unitability voltage [57,58]. From the failure statistics data, it is apparent that 80% of all customer interruptions are the leading cause of faults on DNS [59,60,61]. This is a condition required to control distribution faults in an effective and efficient approach to facilitate maintaining the quality of service by reducing the outage time [61]. In this regard, the quality of the electric power system supply can be clearly defined in terms of PQ [62]. Under the scope of DNS operation, accessibility in DNS is of vital importance to sustain reliability [62]. The fault has always been a high priority for DNS operators to guarantee high improvements in the efficiency and the quality of demand loads.

4.2.1. Power Converters

Power electronics converters are applied at large scale in the area of energy conversion. The semiconductors and the electrolytic capacitors are of most critical importance to elements of power converters in terms of size, performance, capacitor, and cost. It is determined that electrolytic capacitors frequently can have both positive and negative effects on the pulse width modulation (PWM) converters. Moreover, this is responsible for causing for more than 50% of failures [59]. In this regard, power switching tubes are particularly vulnerable devices in power electronic converters. The reason behind that is over-heating, over-voltage, and erroneous signal.

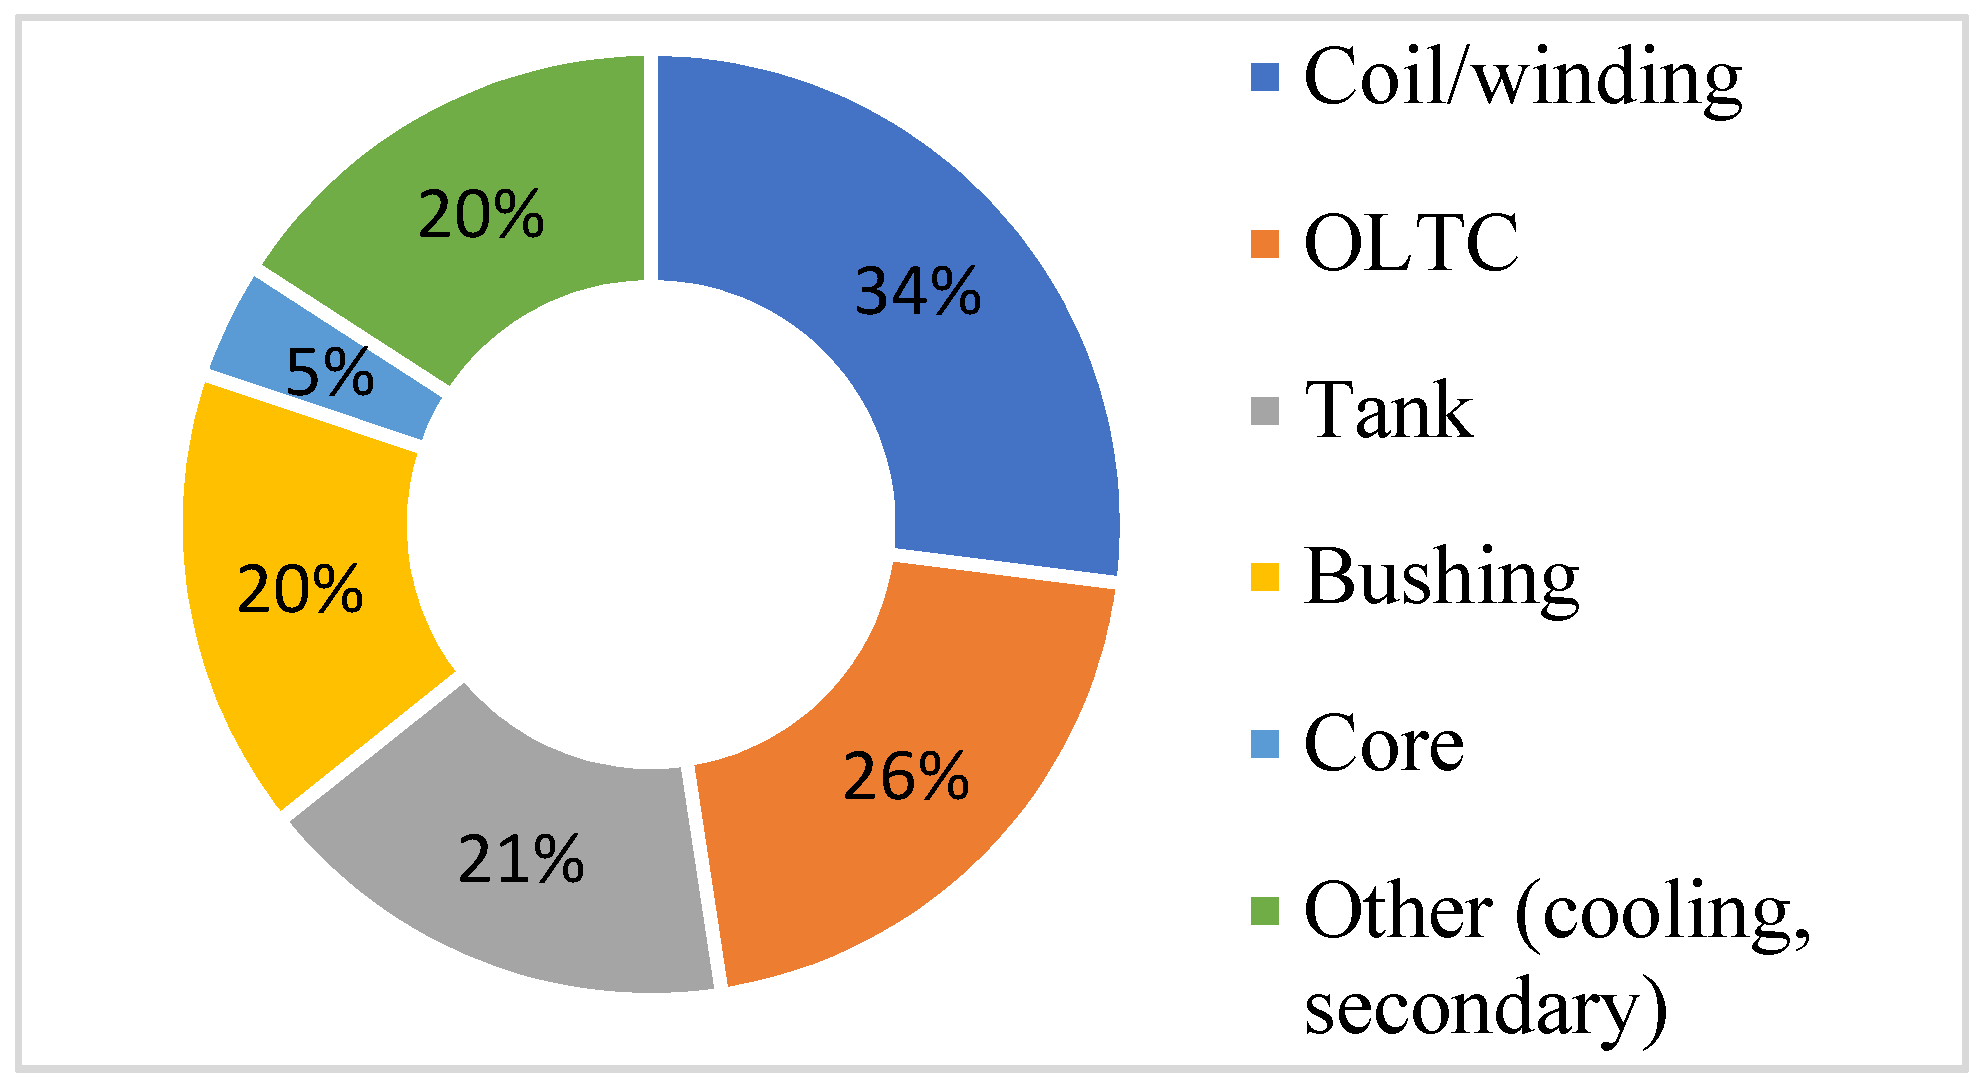
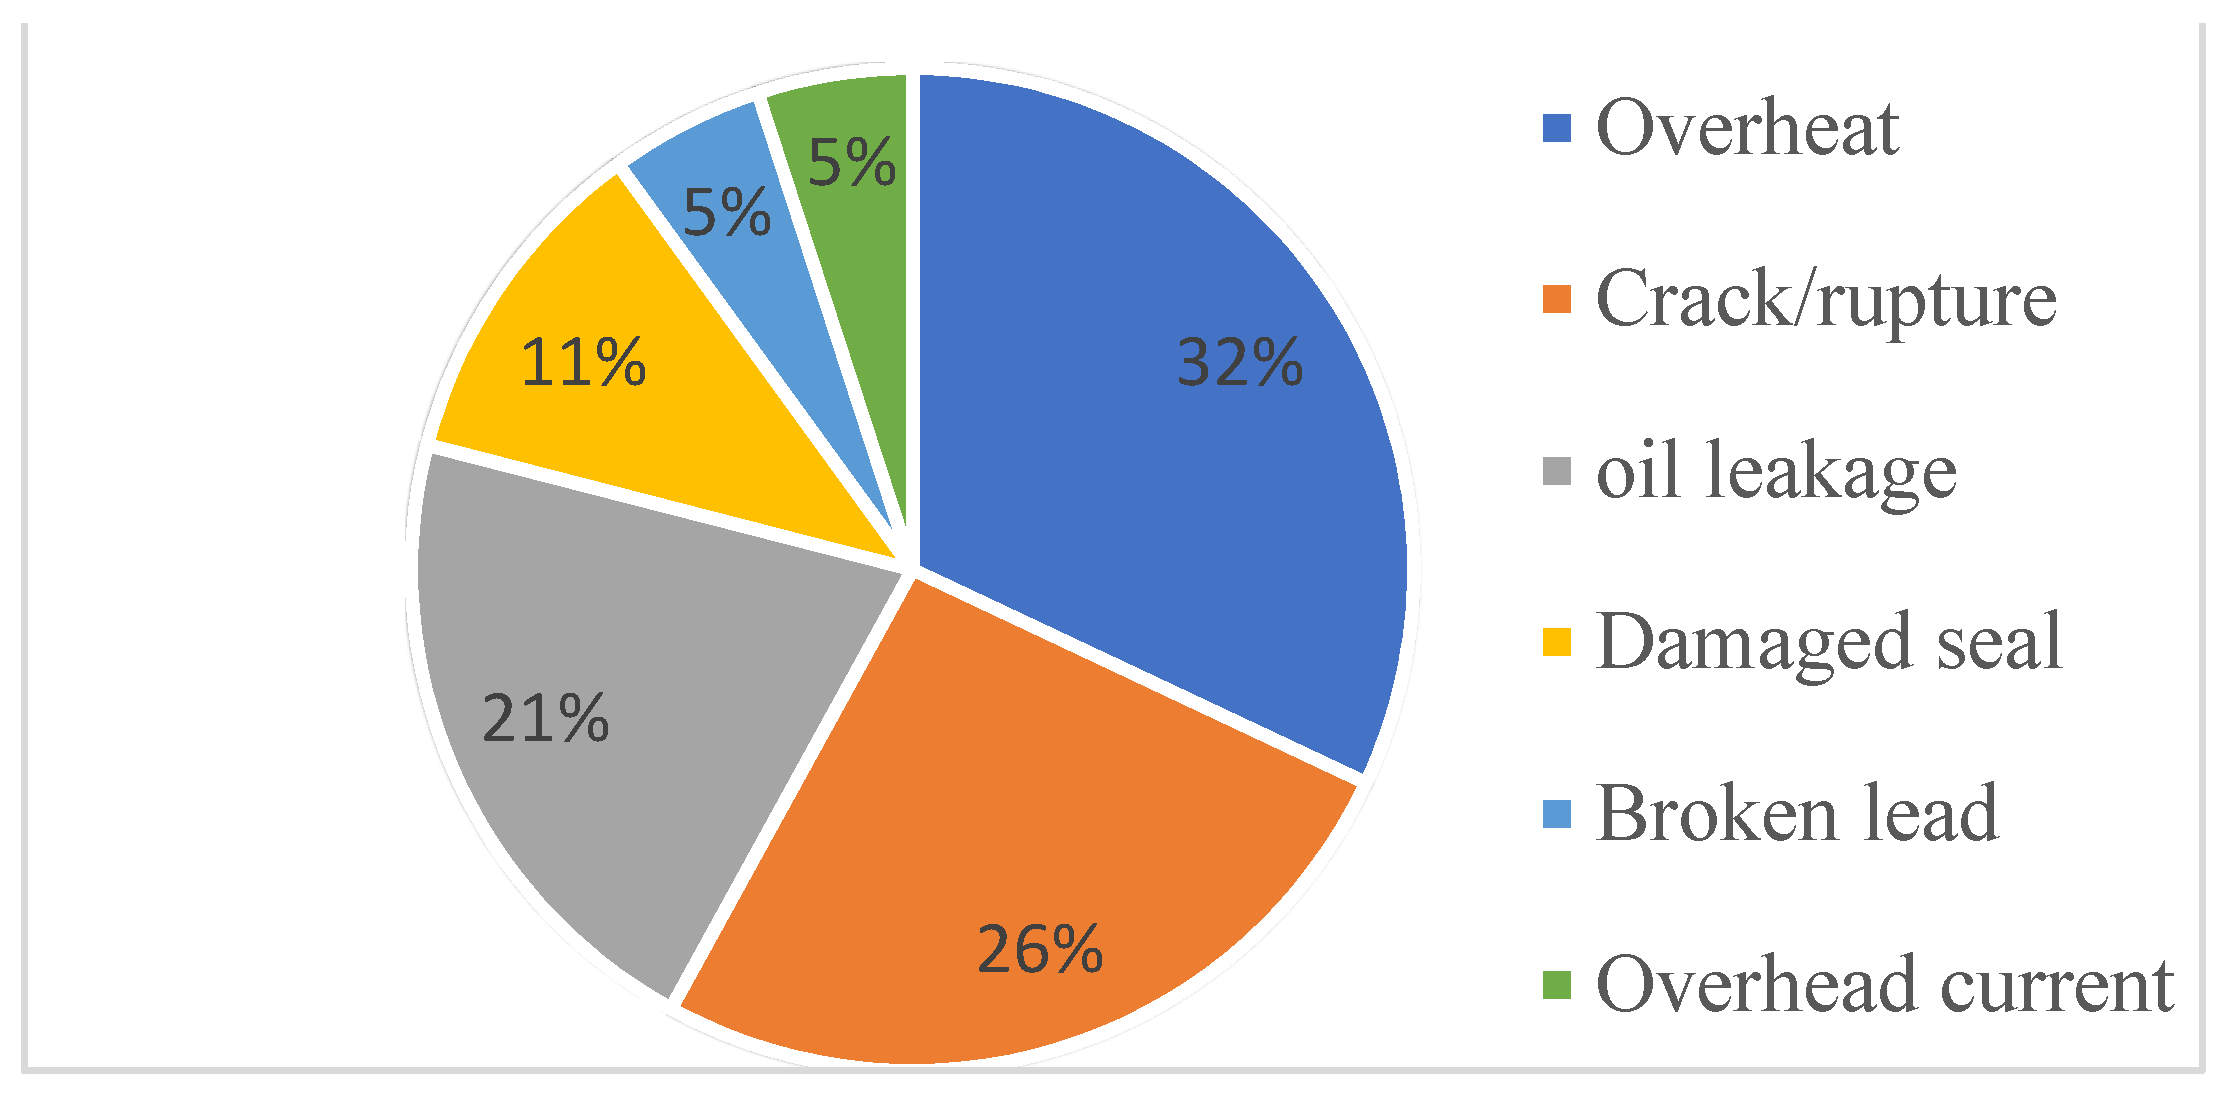
4.2.2. Power Transformer

The power transformer is essential and contains prohibitively expensive components [63]. The utility is designed to contain an enormous number of transformers with several sizes from a few kVA to several hundred MVA capacities in the overall electrical grid. Moreover, power transformers are highly reliable for sustained service from 30 years to 40 years of design life operation within “ideal operational states” [64]. However, some transformers have been in service for substantially longer than 50 years [64]. From a practical point of view, (winding and core) on-load tap changer, insulation (oil and paper), bushing, and tank are highly critical of the power transformer. These parts of the power transformer are constantly exposed to numerous operating stresses during their long-term service, which can contribute to a large degradation in the system [65]. Operational service-induced deterioration of these systems can cause serious failures resulting in severe financial losses and power outages for customers. Moreover, this is becoming costly and time-consuming to repair, requiring continuous efforts over a long period of time. It is significant therefore to consider how and why transformers of utility malfunction and their repair strategies. Bushing failure and frequent sources of transformer failures can be contributing to the percentage of all the causes depicted in Figure 9. Moreover, outages due to bushing problems are describing in Figure 10.

4.2.3. Conventional Energy Systems (CES)

In this section, conventional energy systems (CES) include electricity generating stations that are using fossil fuels as conventional systems, such as diesel, natural gas, and coal [59]. In developing countries, coal generating stations are being addressed as one of the essential parts of electrical utilities. Moreover, these coal generating stations represent the major sources of air pollutants as well as carbon emissions [66]. China, for example, demonstrated in a disclosure in 2015 that air pollutants, e.g., nitrogen oxide, sulfur dioxide, and the cloud of smoke and soot caused by coal generating stations, account for 29.80%, 28.41%, and 10.74%, respectively [66]. CES is used for the backup of green energy generation. Besides that, these diesel generators are being used to enable the production of renewable energy. It is important to mention the following faults that occur in diesel engines [59]. To begin with, fuel leakage is due to the growth and pollution of air created by small holes in the farms. Thus, the gas pressure rises and the combustion efficiency is decreased further. The next point is bearing failures. These faults are similar to those reported in external ball failures, due to increased mechanical stress, wear, as well as etching. Furthermore, the development of cracks represents the major cause for crankshaft faults. This is due to corrosion or poor mounting which can lead to decreased rotational energy production. If splitting occurs, the results of the loss climb to half of the shaft. In this context, the failures related to diesel generators cause a drop in their output, as current and voltage drops can be observed.

4.2.4. Voltage Stability

Voltage instability is a typical load-to-driven phenomenon mostly initiated by a weak DNS capability after a system disturbance such as the tripping of DNS feeders. Long-term voltage instability is dynamic by nature and emergency actions are triggered through the time evolution of the DNS. To solve this issue, a distribution flexible AC transmission system (FACTS) is an efficient modern technology that relies on the proven capability of this voltage stability [6,65]. D-STATCOM can quickly respond to the injection of reactive VAR to support the voltage stability of DNS [67,68,69].

4.2.5. Cables and Distribution Lines

Power cables play an essential feature in linking the generation sector and demand loads, concerning distribution lines as well as transmission lines. The DNS with overhead lines is vulnerable to failure because of weather disasters, such as floods and unpredictable events like fallen trees [70]. The underground cable gains a considerable advantage because it is only slightly affected by common environmental levels. Moreover, in urban areas and with underground shielded wires, a large part of the overhead lines is reformed. In DNS research, it is important to note that the overhead and underground cable systems have different technological characteristics. These factors have to be taken into consideration [71]. Moreover, the power system sector is one of the major growth areas and electrical utilities cannot afford to neglect the underground cable because of sizeable capacitance [70]. It is important to note that the gap between the neutral point and the conductor in underground cables can represent a negative effect, challenging the power system planners and operator system.

5. Benefits of HFC in DNS

In this section, the benefits of HFC lie beyond the scope of the paper. HFC has the potential to enhance the power quality issues such as mitigation voltage sag. Moreover, HFC has demonstrated the ability to shave the peak load by ES throughout the off-peak period and discharge the ES back to the feeders of the distribution network during peak time [72]. By applying HFC-ESS for this purpose, demand profiles can be flattened and load factors can help to improve the PQ. All associated investment costs and economic benefits of HFC are considered. This approach relied on the proven capability of this technology. Using HFC provides major benefits for the DNS that can be achieved from shaving the load demand: (i) HFC/ESS is well within its capabilities to generate peaking power. HFC/ESS has had no significant effect on the reduction in CO2 emissions. (ii) HFC/ESS has a significant impact on the system upgrading of DN against the well-being affected by the PQ issue. (iii) HFC/ESS has a significant impact on the system upgrading of DN against the well-being affected by the PQ issues including voltage sag. (iv) HFC/ESS played a significant role in reactive and active power support that can be used easily to maintain the level of voltage on the DNS. (v) The HFC/ESS is the key technology for the reliable and flexible energy integration of different renewable energy sources for various applications in power systems. (vi) The HFC/ESS offers a much greater degree of flexibility in static power electronic devices. (vii) HFC/ESS can be stored a large amount of energy.

6. Modeling

In this section, the paper discusses the mathematic D-STATCOM modeling impact of DNS and how hydrogen fuel cells (HFC) can use the technology. Considerable progress in HFC D-STATCOM has been made towards finding recovery for the voltage sag. HFC D-STATCOM is required to mitigate voltage sag on a distribution network. HFC D-STATCOM is a power device connected to the shunt. Its components are a voltage source converter (VSC), a filter in the output stage, and a coupling transformer. A VSC is used to convert hydrogen fuel cells into output voltages in AC phases. The voltages are generated in phase with each other using a coupling transformer and connected to the utility network, D-STATCOM using the HFC set of the magnitude and phase across the output of the shunt compensator, and both the active and reactive power are controlled. Figure 11 illustrates the difference between block diagrams and the location of HFC D-STATCOM.

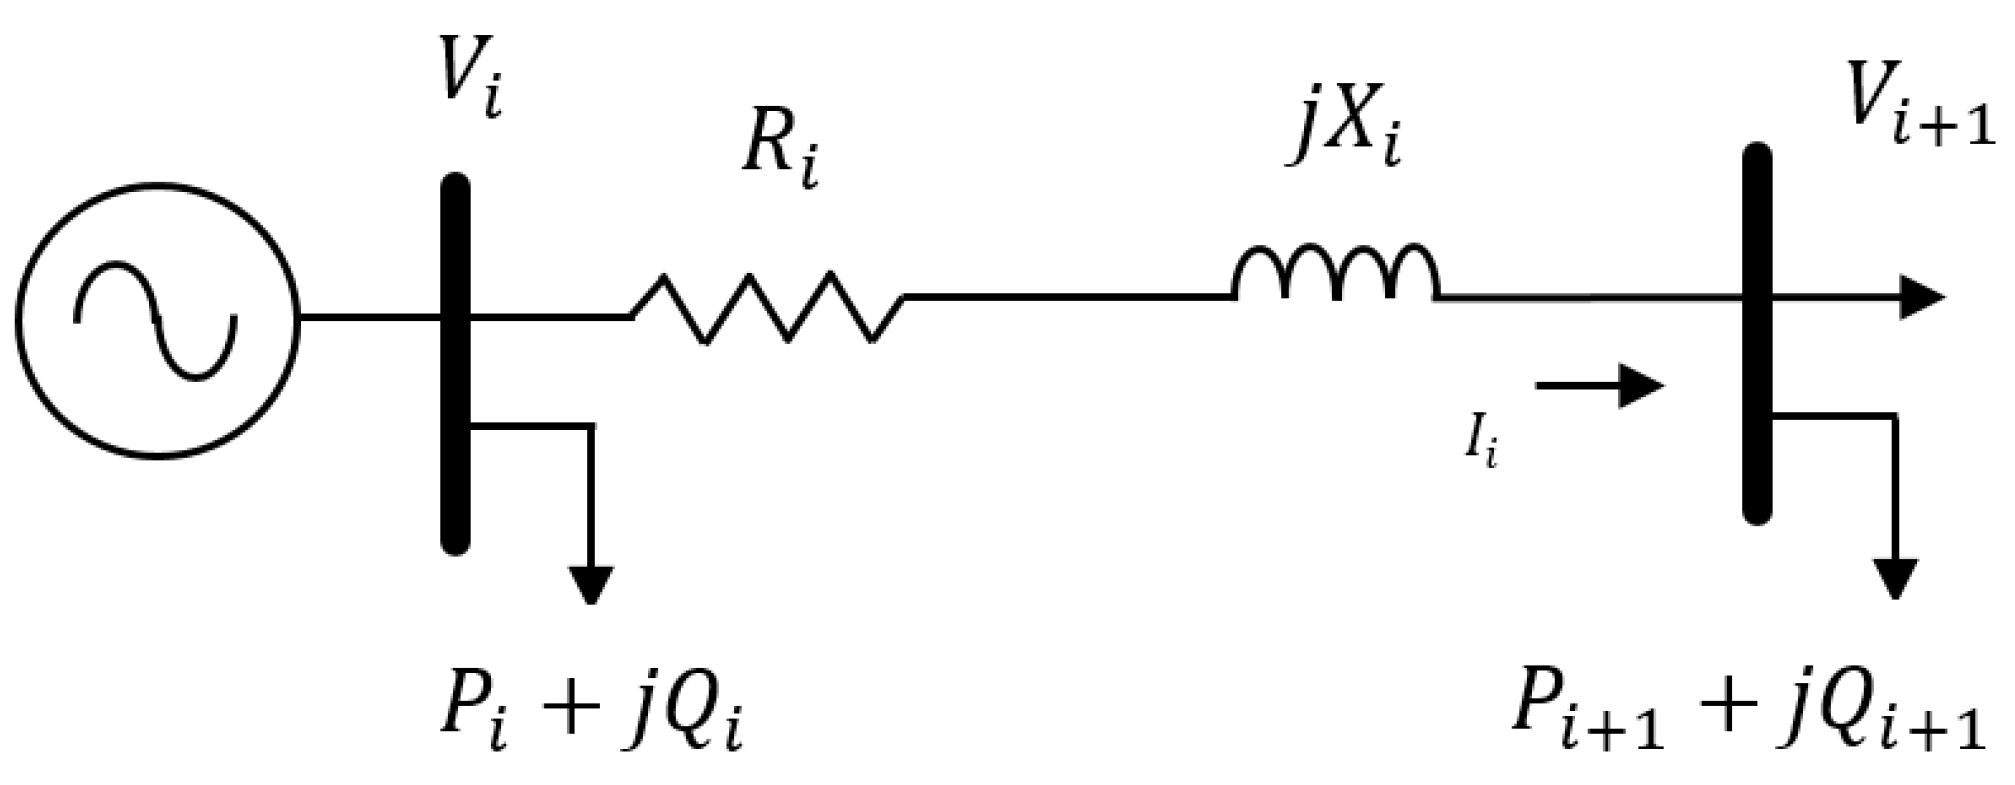
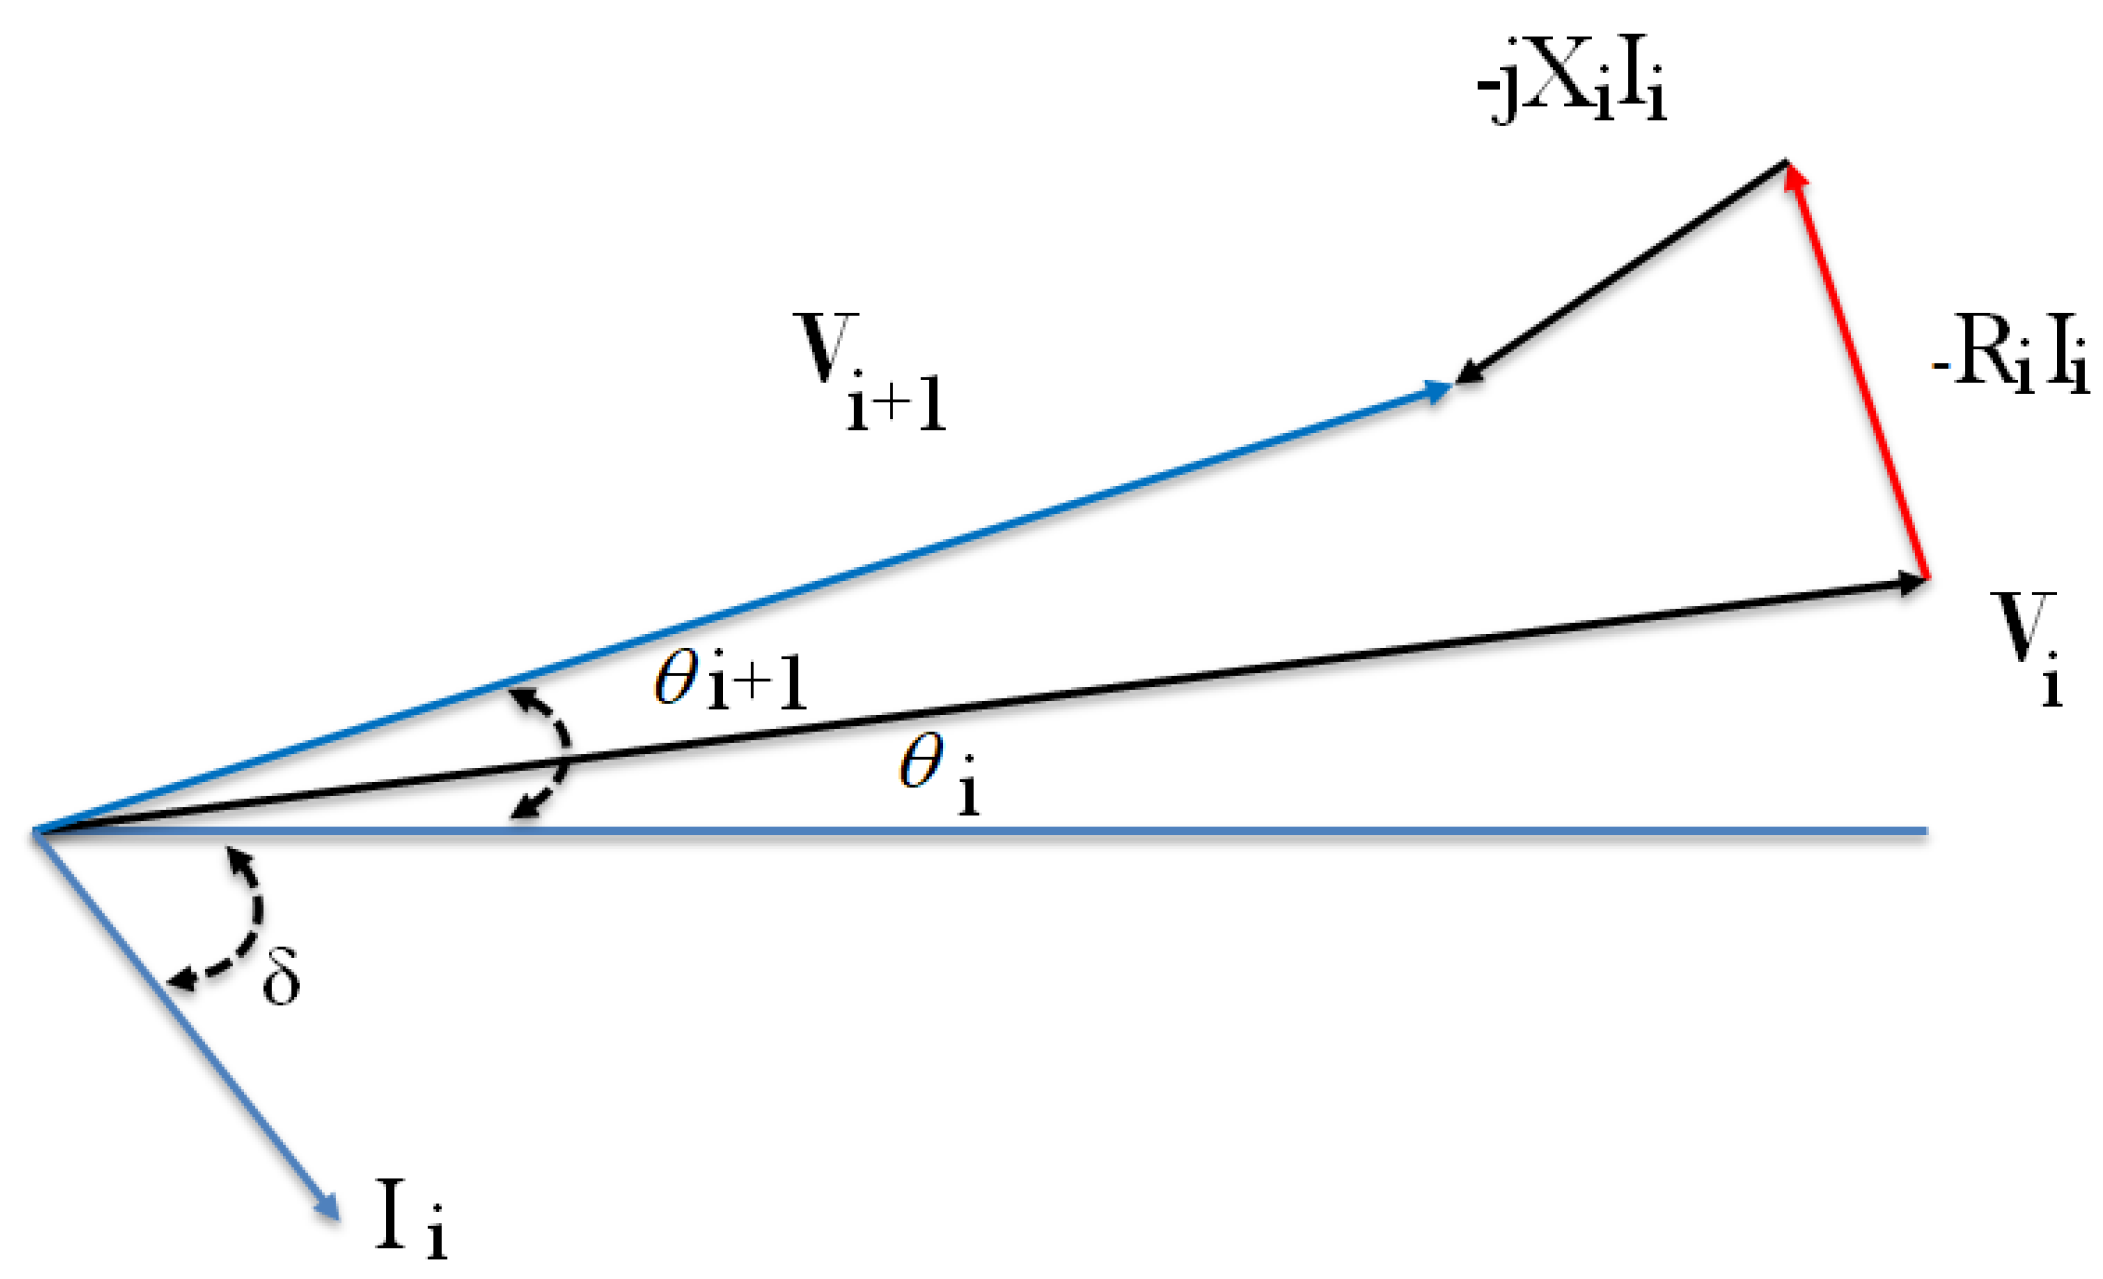
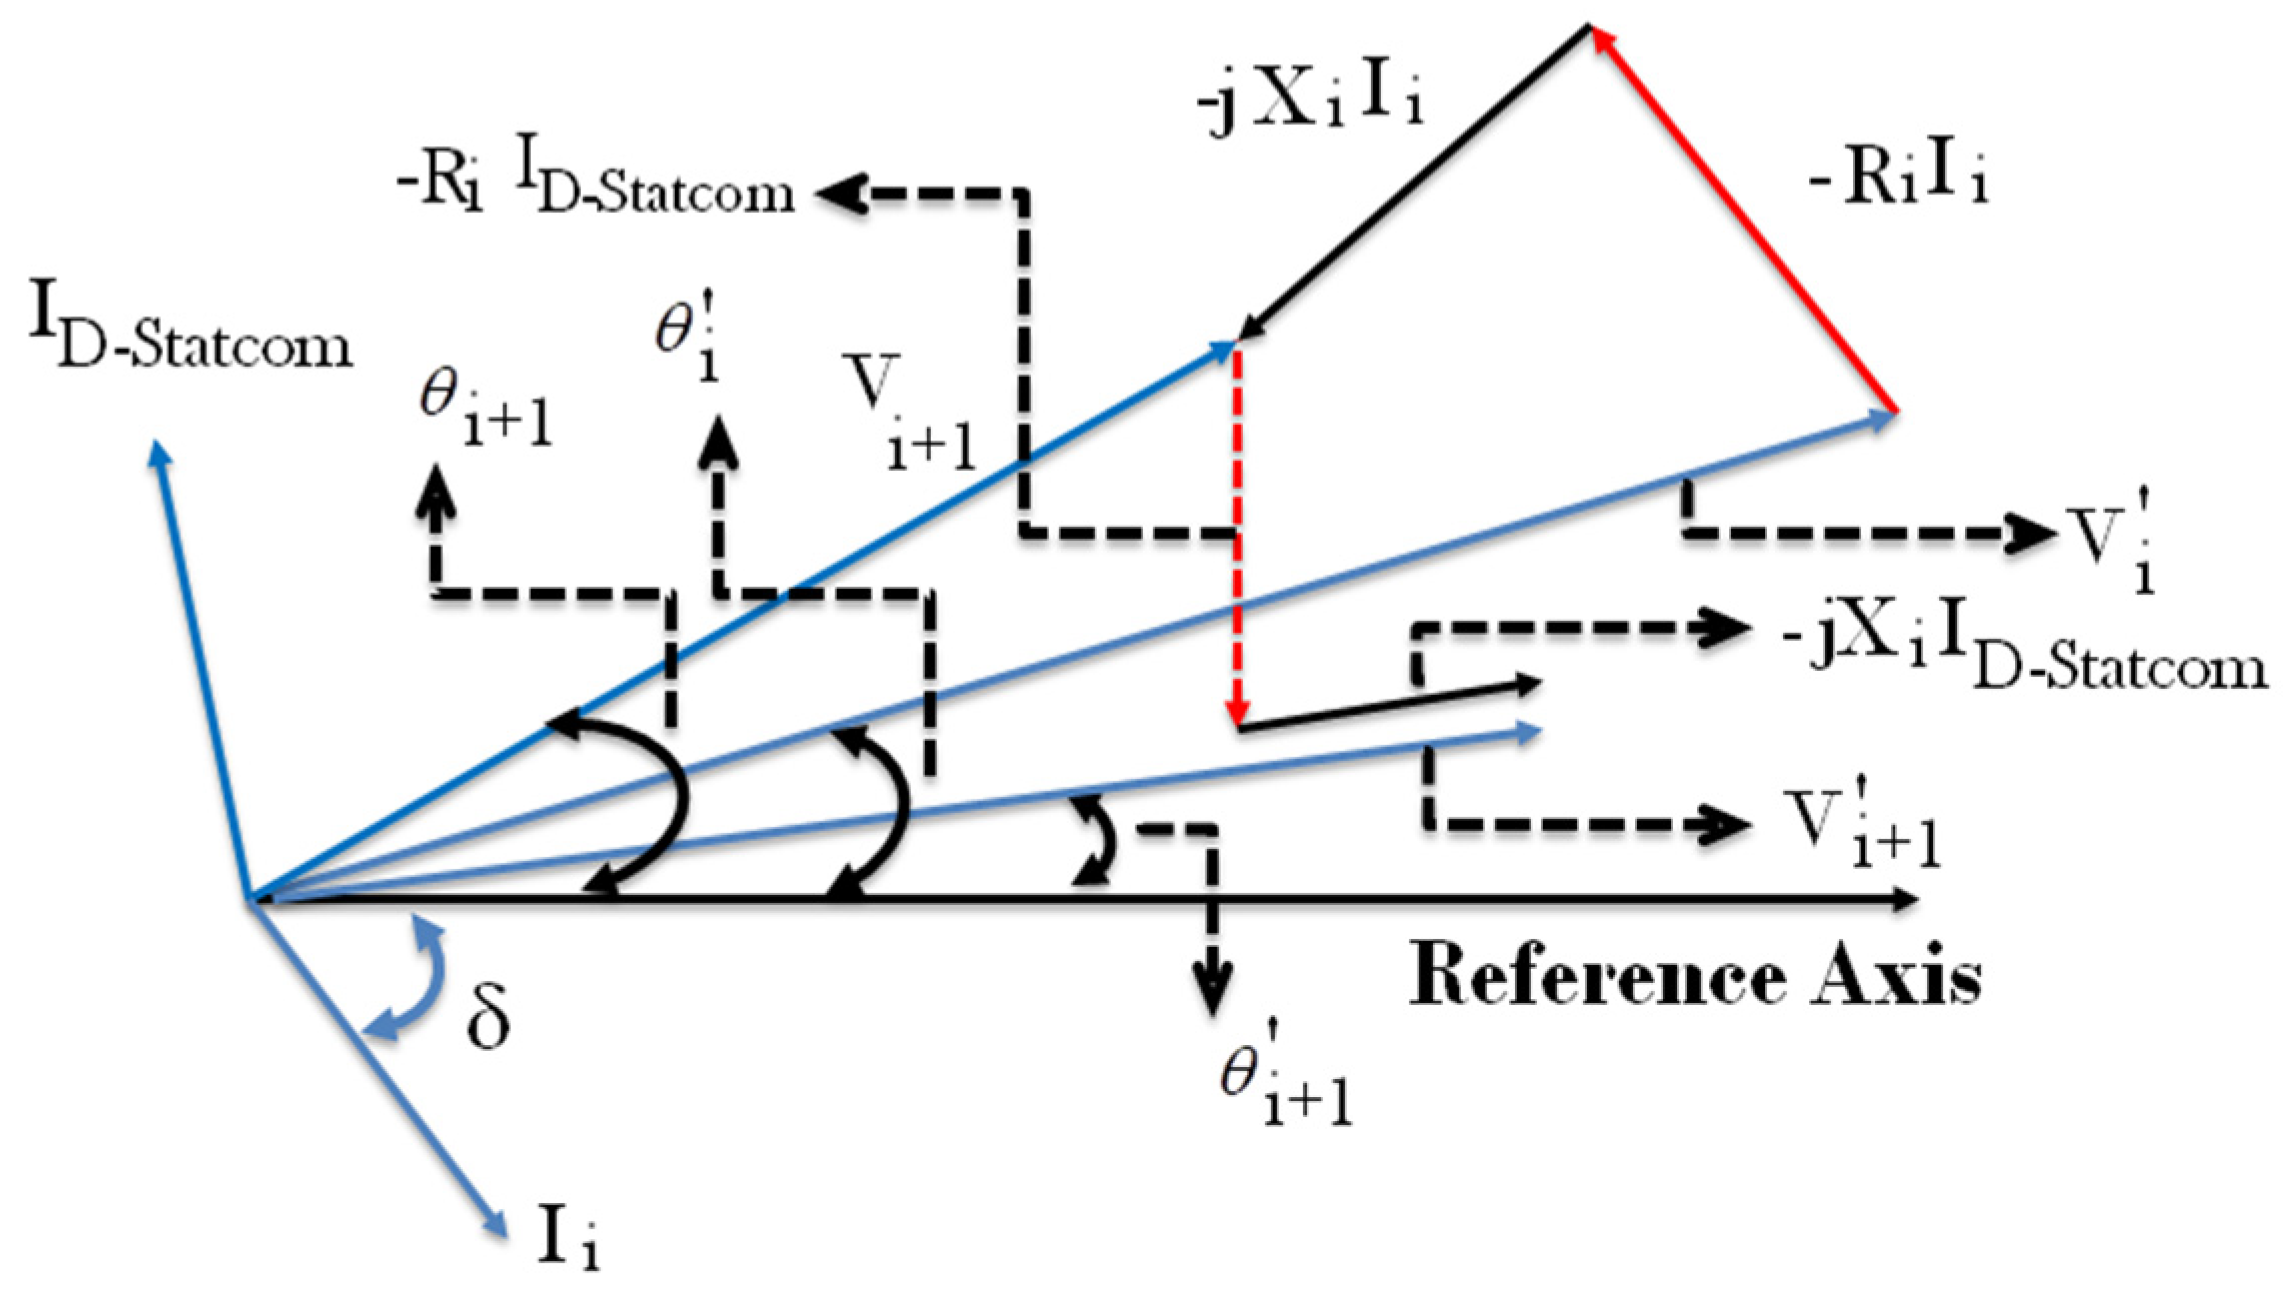
6.1. Modeling of D-STATCOM

Modeling plays an important role in the control system of D-STATCOM implementation that can be applied to simulate the expected process behavior of voltage and/or current via the D-STATCOM control system [73]. Thus, modeling is predominantly embedded in the controller. It has an effect on the controller and can be used in a progress model to anticipate the direct impact of control that was heightened by action. New techniques of D-STATCOM modeling and processes are generally required to meet distribution network goals [73]. It is up to the IEEE-1159 to prove scientifically that such phenomena affect the power system to determine the PQ planning of modeling is prepared and equipped to carry out the target of the voltage sag mitigation. Modeling affects the range of the HFC D-STATCOM capabilities to substitute active as well as reactive power concurrently. The process of the HFC D-STATCOM model proved to be effective in terms of response time and magnitude [74]. It is also minimizing the failures of DNS that has three-phase radial structures. Figure 12 presents a typical single-line diagram of two buses of DNS.
The exchange illustrates well the area where information modeling is expected to be applied, as shown in Equations (1)–(3).
V i + 1 θ i + 1 = V i θ i ( R i + j X i )   I i δ
where the complexity of the description is the impedance between of DNS feeder i and i + 1 is represented by R i + j X i demand loads interfaced in feeders i and i + 1 are known as P i + j Q i and P i + 1 + j Q i + 1 . Meanwhile, V i and V i + 1 are voltage feeders [75]. Information models help HFC D-STATCOM deal with the information being disseminated. Of note here is that, in both cases, the model was tested on a subset of the information object. Figure 13 presents the current and voltage phasor technique diagram.
I D - S T A T C O M = π 2 + θ i + 1
V i + 1 θ i + 1 = V i θ ` i ( I i δ + I H F C   D - S T A T C O M ( π 2 + θ i + 1 ) )
The efforts of the HFC D-STATCOM in this regard should be strengthened. As shown in Equations (4) and (5) by installing HFC D-STATCOM in feeder i + 1 , currents I i and I H F C   D - S T A T C O M the flow rate in the branch simultaneously [75]. Consequently, I H F C   D - S T A T C O M directly is protected in quadrature with consideration of the voltage. Figure 14 shows a phasor diagram of the voltage and current of the system.
By taking into consideration the real and imaginary sections is from Equation (1),
X = B ± Δ 2 A .
Equation (2) highlights that the variable X is calculated for I H F C   D - S T A T C O M and I H F C   D - S T A T C O M .
R i + 1 V i + 1 ( I H F C   D - S T A T C O M = 0   and   θ i + 1 = θ i + 1 )
A different actual and imagery calculation can be used to determine the current magnitude of HFC D-STATCOM The result indicates that X = B   ±   Δ 2 A is the correct solution of Equation (3). Thus, I H F C   D - S T A T C O M can be established as:
I H F C   D - S T A T C O M = π 2 + θ i + 1 =   π 2 + s i n 1 x
Actual part:
I ¯ H F C   D - S T A T C O M c o s ( θ i + 1 + 90 ° ) = ( V i ¯ R c o s θ i R 2 + X 2 + V i ¯ X s i n θ i R   2 + X 2 V i + 1 ¯   R c o s θ i R   2 + X   2 V i + 1 ¯   X s i n θ i + 1 R   2 + X   2 I ¯   i c o s   δ   )
Imaginary Part:
j I ¯ D - S T A T C O M s i n ( θ i + 1 + 90 ° ) = ( V i ¯   R s i n θ i R 2 + X 2 V i ¯   X c o s θ i R 2 + X 2   V i + 1 ¯   R s i n θ i R 2 + X 2 +   V i + 1 ¯   X c o s θ i + 1 R 2 + X 2 I ¯ i s i n   δ   )
Replacing the above parameters in Equations (5) and (6) after solving this equation, the magnitude of   I H F C   D - S T A T C O M is obtained. The equations to be solved are all the general form:
I ¯ D - S T A T C O M = [ K 1 s i n ( θ i δ ) 1 ] + K 2 s i n ( θ i + 1 + δ )
where K 1 = V ¯ i R 2 + X 2 , K 2 = A   s i n ( θ i + 1 + δ ) + B   c o s ( θ i + 1 δ ) . Therefore, this was a calculated attempt at the voltage of the coupling feeder and I H F C   D - S T A T C O M . Reactive power is injected into the feeder up to V i + 1 where it expands and provides insulation to DNS that can be written as:
j Q H F C D - S T A T C O M = ( V i + 1 θ i + 1 ) [ I H F C D - S T A T C O M [   π   2 + θ i + 1 ] ]  

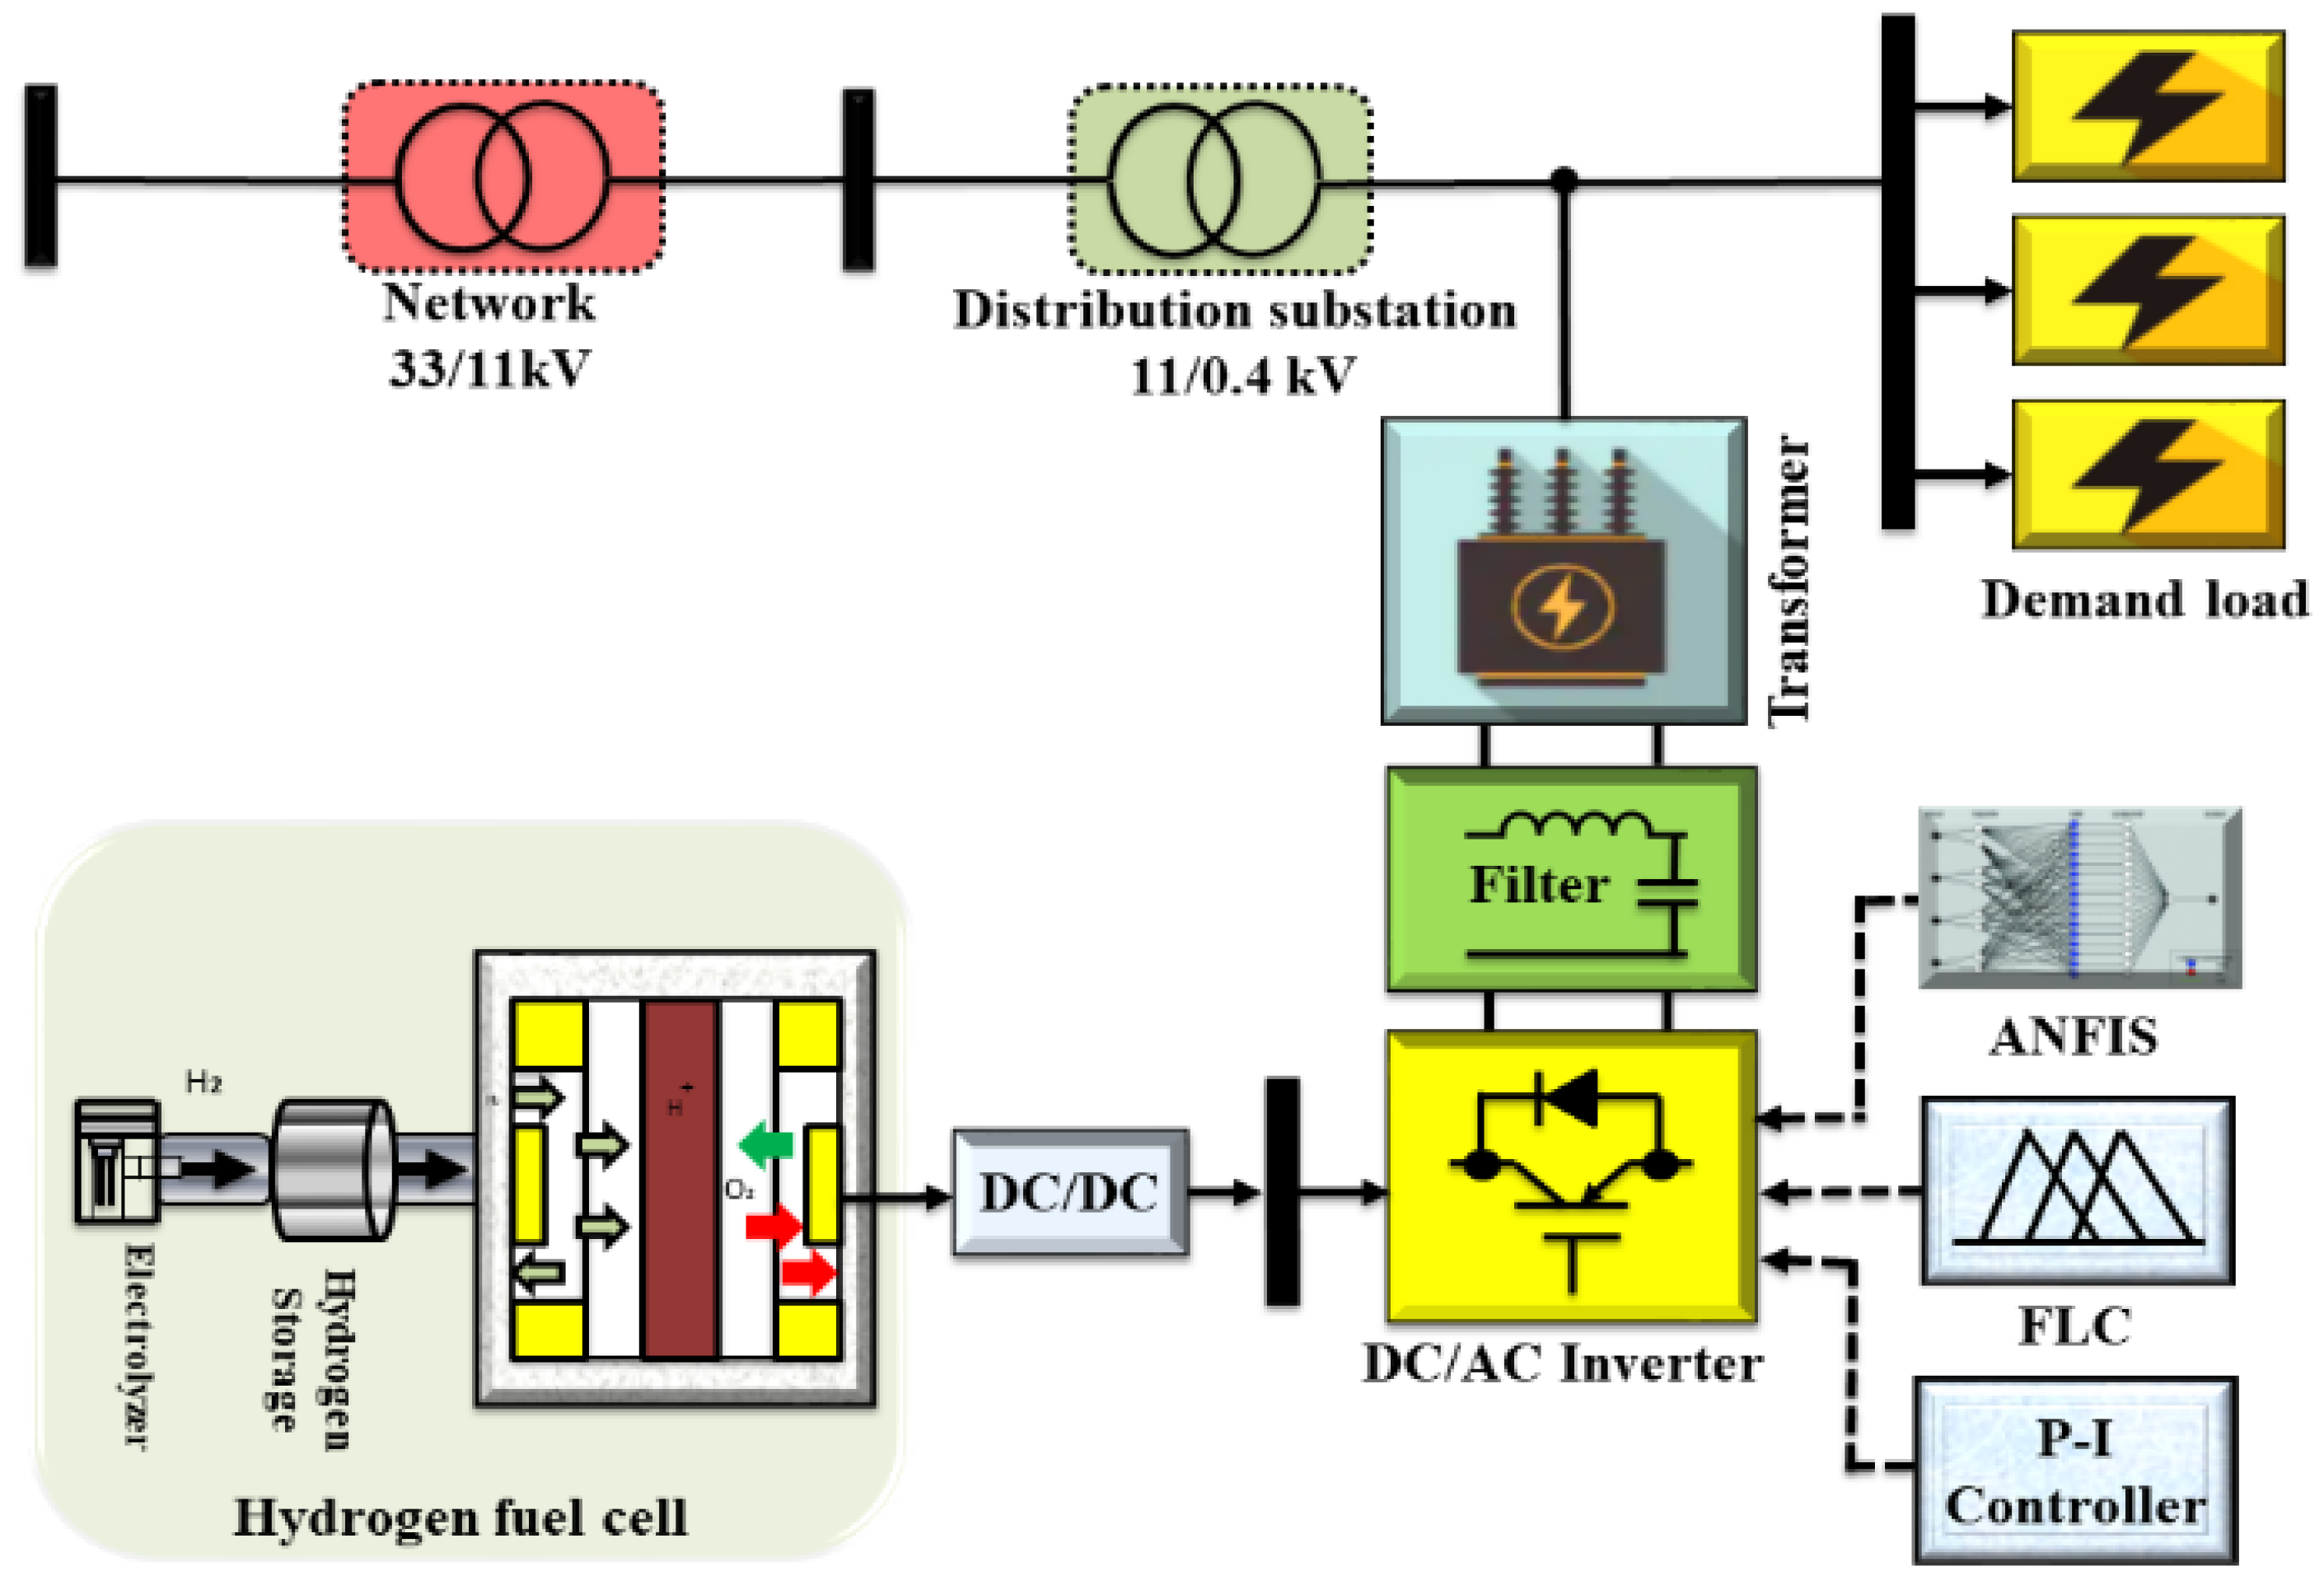
6.2. The System of HFC

HFC has led to improve efficiency performance at temperature 25 °C. The liquid water product has been demonstrated that the thermal combustion engines are effective [74,75,76,77]. Hydrogen fuel cell voltages E c e l l can be expressed as following Equation (11):
{ E c e l l = V O C V V a c t   V o h m V n e r n s t V f c = N f c × V c e l l E c e l l = E O C V η a c t   η o h m η n e r n s t
In Equation (11), E O C V refers to the open-circuit voltage. It reached less than the reversible cell potential (~1.2 V). As a consequence of slight electron conduction (by membranes) is a major cause of loss through internal currents and hydrogen crossover as well. Then,   η a c t   can be responsible for activation loss, which has a long-term effect on reactions taking place on the surface of electrodes.   η o h m drops more slowly and approximately linearly. This drop happens in an ideal HFC polarization curve and can lead to a loss of the ohm. The next term, η t r a n s , refers to the mass transport loss, especially when the voltage reduces quickly. Furthermore,   V f c is referred to as the voltage of the HFC stack. N f c is known as the number of cells in series as demonstrated in Equation (12).
{ V n e r n s t = Δ G z F + Δ S z F ( T f c T r e f ) + R F F C z F [ I n ( P H 2 ) + 1 z   I n   ( P o 2 ) ]   V a c t = ξ 1 + ξ 2 T f c + ξ 3 T f c I n   ( C o 2 ) + ξ 4 T f c I n   ( I f c ) V o h m = I f c R o h m = I f c ( R m + R c ) I f c ( r m l A + R c ) V c o m = B   I n   ( 1 J J m a x )
where Δ G = Gibbs free energy change, J/mol, ξ 1 = model coefficients, V, ξ 2 = model coefficients, V/°C, ξ 3 = model coefficients, Vc m 3   / ( mol   ° C ) , and ξ 4 = model coefficients, V/(A ° C ).

7. Control Techniques of HFC D-STATCOM
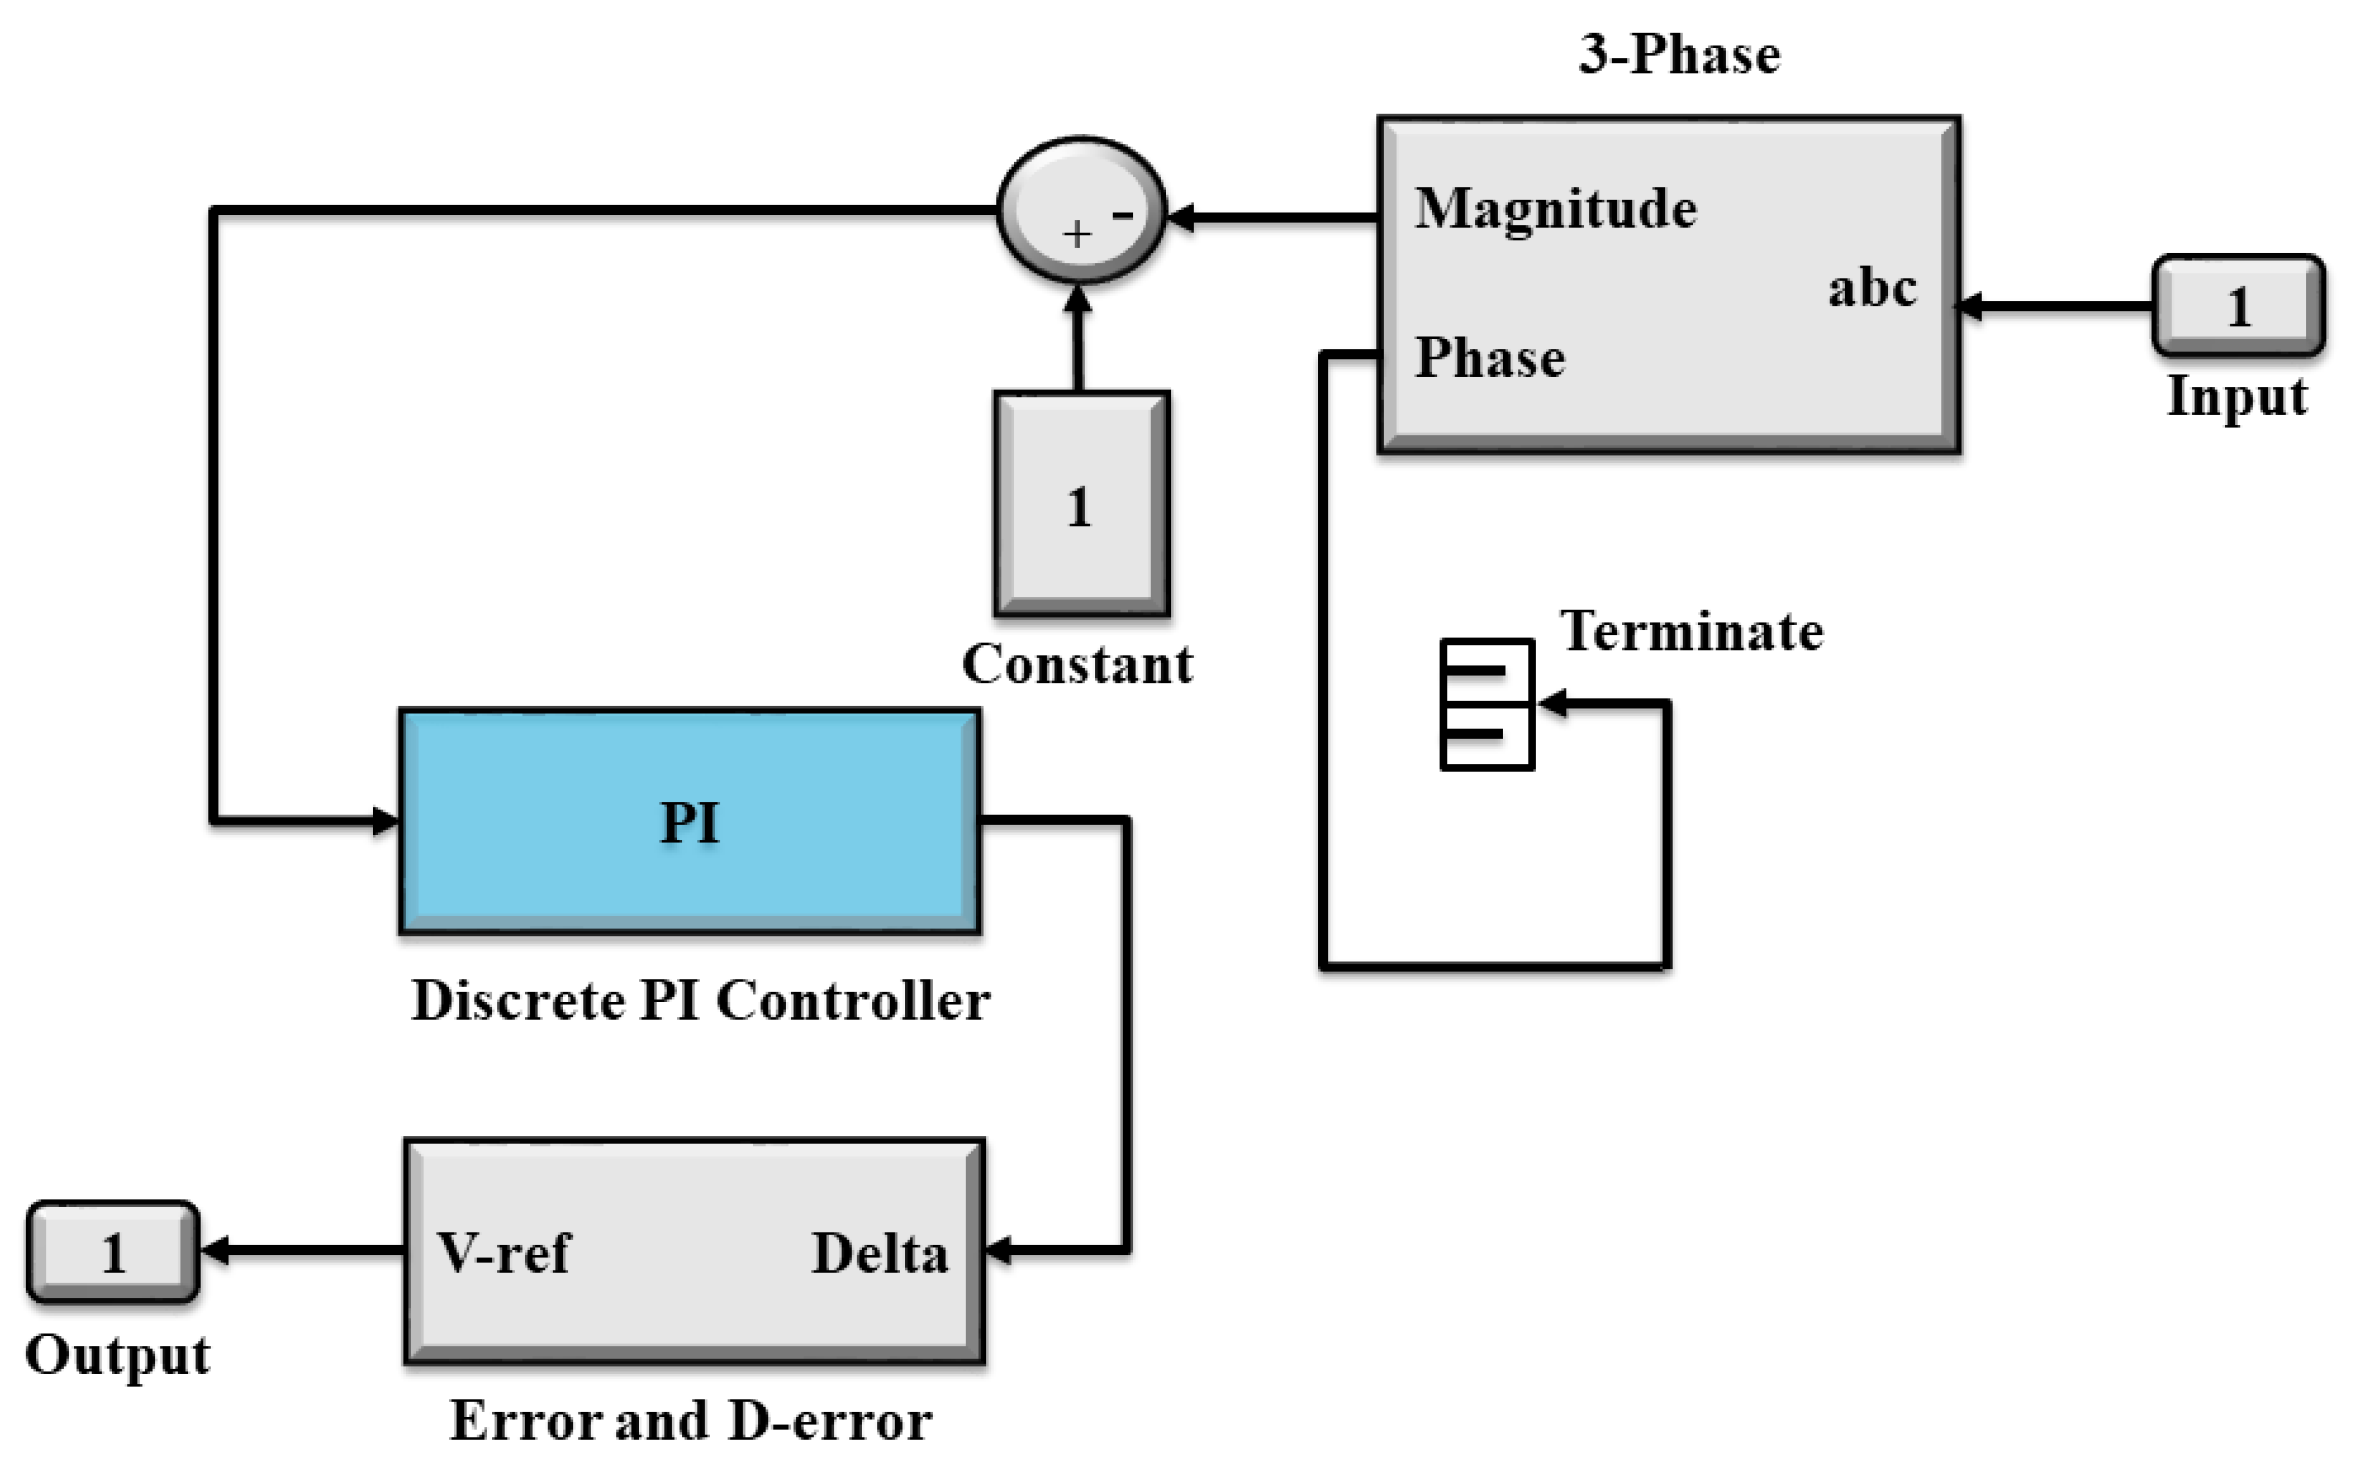
This section examined the input parameters for designing HFC D-STATCOM using P-I Controllers, Takagi–Sugeno fuzzy inference system (FIS), and an adaptive neuro-fuzzy inference system rule-based controller. In this paper, the controller of HFC D-STATCOM is used to measure the drop of voltage, line impedance, fault resistance, and load induction angles. HFC D-STATCOM injects voltage during fault scenarios to stabilize the power quality. Furthermore, HFC D-STATCOM systems such as DC-DC converter, filter, transformers, and controller unit are monitored to mitigate voltage sag in DNS.

7.1. P-I Controller

P-I controllers are well-designed to measure the input to the output voltage of the HFC D-STATCOM system and provide feedback to the controller system to inject the amount of voltage when the sag occurs. The P-I gain can occur at the HFC D-STATCOM due to an increase in output at the P-I controllers. The P-I controller parameter is designed to allow adjustments to achieve great performance during several fault scenarios. To illustrate this further, the hydrogen fuel cell D-STATCOM system is used to design the input parameter of the control strategy that aimed to detect the fault, evaluate the effectiveness of the different sag depth and phase shift, measure its voltage source, and reference voltages more accurately. All of these steps can lead to the enhanced efficiency of the system. Figure 15 illustrates the P-I controller of HFC D-STATCOM.
Park’s transformation is directly responsible the converts stationary frame into the rotating frame, which can be obtained by d q 0 components from over the demand load. Moreover, the d q parts are useful for the system to receive constructive feedback on their progress in particular the absence of zero sequence parts. Besides that, the reference q part sets about its task in determined as V q , r e f = 0   V . Furthermore, the d q part was calculated through the transformation. This is also significant compared with reference d q part. This d q part calculated by the transformation is compared with the reference d q component voltages to obtain information through the errors e d and e q . Figure 15, describes the converter to d q 0 parts. Both of V d and V d will automatically receive updates by a b c parts of the P-I controller. It is important to say that during typical status, the hydrogen fuel cell D-STATCOM is not required to inject any voltage in the DNS. Hence, generated reference voltages provided the input voltage source inverter controlled based on the pulse width modulator (PWM).

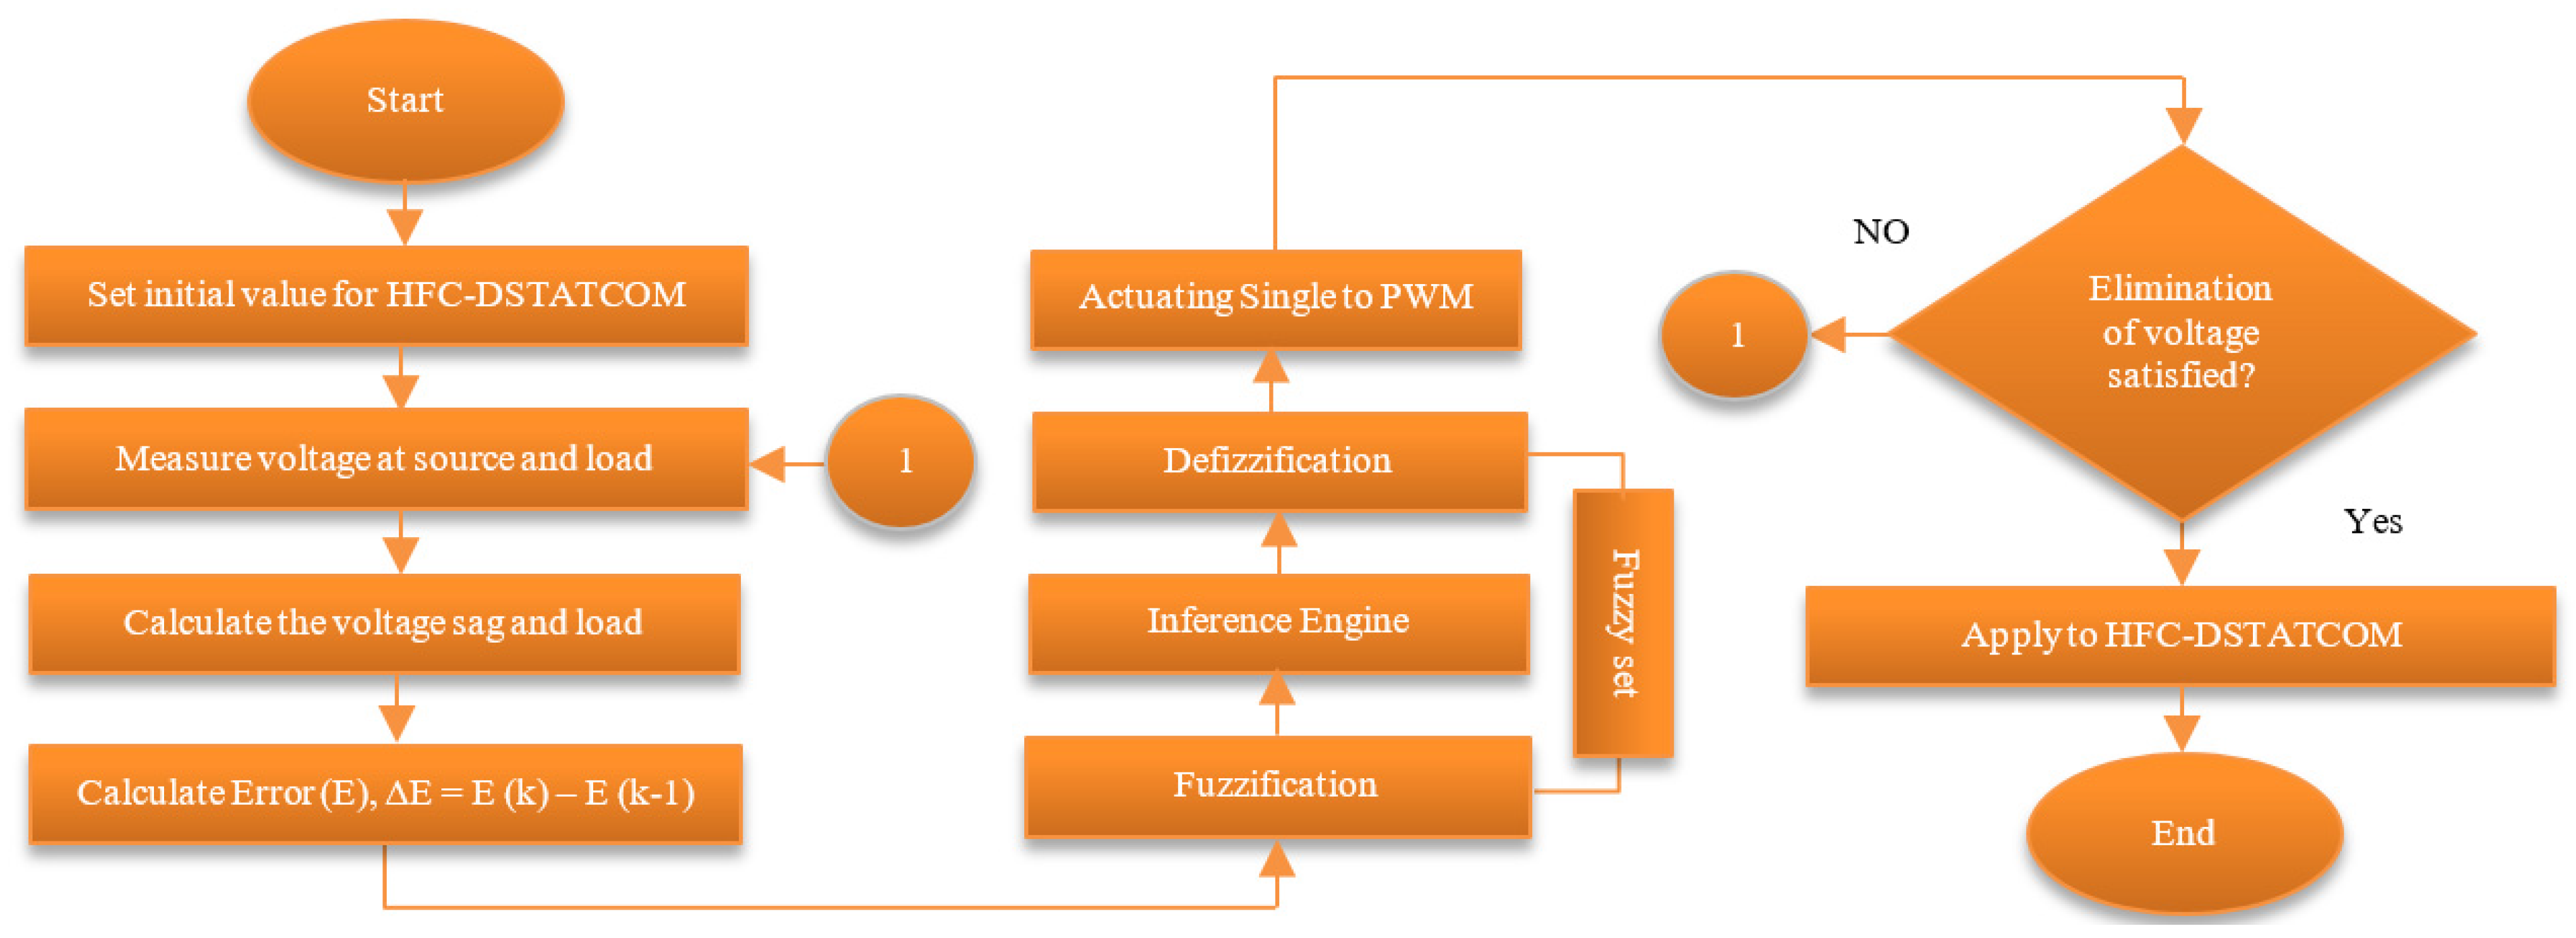
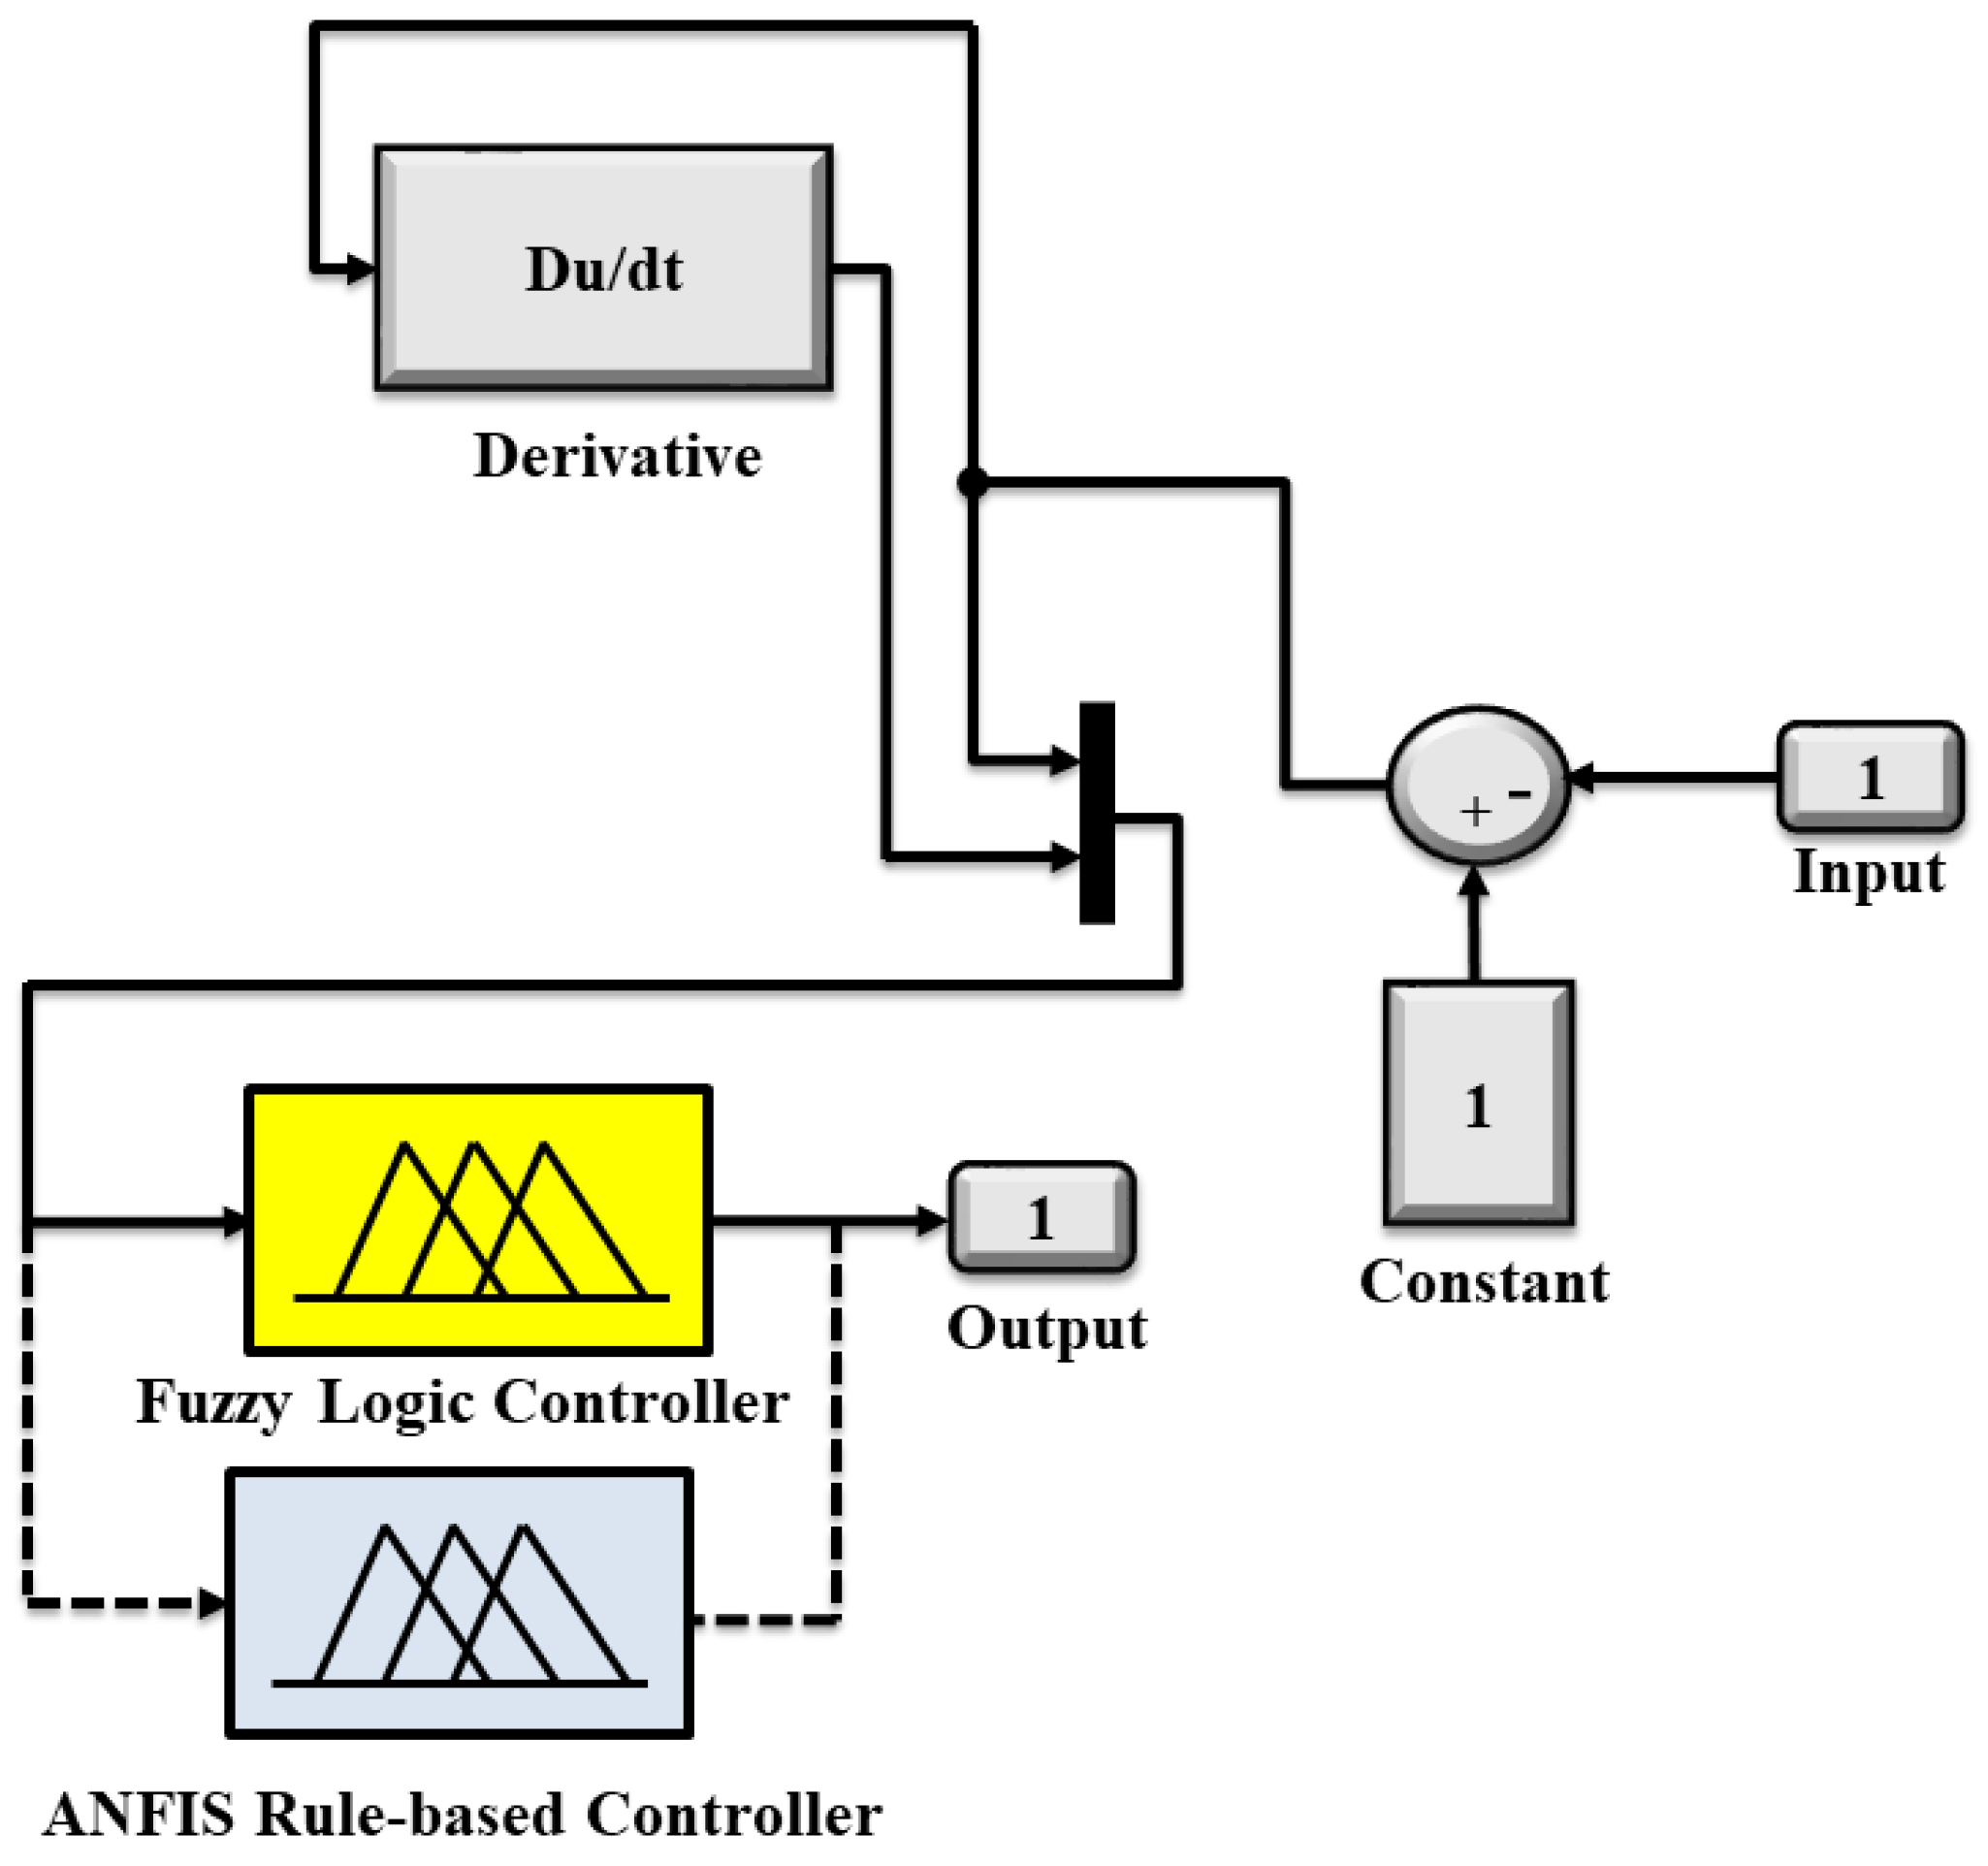
7.2. Takagi–Sugeno Fuzzy Inference System

The Takagi–Sugeno fuzzy inference system is one of the most significant intelligent control models composed of the fuzzy linguistic variable, fuzzy set, and fuzzy reasoning module. It is a powerful tool for analyzing various real-time applications and voltage sag problems without the need for mathematical modeling. It deals with an approximate model rather than the exact model which makes it very attractive with indecisive parameters. Figure 16 presents a flowchart of HFC D-STATCOM using the Takagi–Sugeno fuzzy inference system.
The Takagi–Sugeno fuzzy inference system responds depending upon its scaling factors. Hence, the selection of these parameters is essential while designing the controller for the HFC D-STATCOM. Besides, the Takagi–Sugeno fuzzy inference system takes the input as an error signal which is the difference between the output and input of the power system. The following steps are used for the fuzzy logic controller to mitigate the voltage sag using HFC D-STATCOM. It is important to mention that the shape of the fuzzy set is often dependent on the system and can be determined by the knowledge and control problem of the system. Besides, fuzzification is a process of converting crisp inputs into linguistic variables. These linguistic variables (fuzzy sets) are normalized into NB (Negative Big), NM (Negative Medium), NS (Negative Small), ZO (Zero), PS (Positive Small), PM (Positive Medium), PB (Positive Big), etc. which determines the quality of control in a fuzzy logic controller. If the numbers of linguistic variables increase, then the computation time and memory space also increase. Therefore, these variables must be chosen in such a way as to optimize the complexity and performance of selecting system parameters. Figure 17 illustrates the FLC and ANFIS of HFC D-STATCOM.
Furthermore, the knowledge base and rule base of the database contains the membership function for the fuzzy sets and the rule base. The type of membership function defines its degree. The fuzzy rule base plays an important role in determining the behavior of the system. The fuzzy rule base is a set of rules defined using linguistic variables for making a relationship between input-output. Fuzzy inference mechanism inputs and makes a decision based on the knowledge base to produce an output. On the other hand, defuzzification is a process of converting linguistic variables into crisp inputs. The crisp inputs are determined based on their membership function. A typical rule in a Takagi–Sugeno fuzzy inference system has the form z = a x + b y + c where a ,   b ,   c are tuned constants x ,   y denote the input variables and z denotes the output. An input datum is passed through the fuzzification process to form a fuzzy set. It converts the input quantity into a fuzzy set that can be inferred easily through an inference mechanism. The input signals are assigned to the membership functions. Linear output membership functions have been used in this paper where the values of these gains have been varied to obtain optimum performance. Two inputs used for the Takagi–Sugeno fuzzy inference system are the error in voltage e 1 = V d e c V d c   and the e 2 = change of error   e 1 . The two inputs are fuzzified using two fuzzy sets {P, N}. Figure 18 shows flowcharts of ANFIS.
In the other stage of the proposed design methodology, the ANFIS is a hybrid of those two techniques where ANN takes the role of input preparation for fuzzy logic (FL), and feedback teaches ANN to adapt inputs to FL. ANFIS is quick to overcome the complexities and robustness of the system by modeling its nonlinear function with acceptable precision. The capability of ANFIS in improving performance with a fast learning process fits as a solution where the change rates of nonlinearities are constant and quick solutions are needed. Moreover, for the tune the Sugeno-type fuzzy inference system using training data, ANFIS (training data) generates a single-output Sugeno fuzzy inference system (FIS) and tunes the system parameters using the specified input/output training data. The FIS object is automatically generated using grid partitioning. The training algorithm uses a backpropagation method to model the training data set. Besides, ANFIS allows for adjusting the number of training epochs and training error goals. The validation data should fully represent the features of the data the FIS is intended to model, while also being sufficiently different from the training data to test training generalization. Two rules can be expressed for the first order Sugeno FIS that is given by [78,79]:
  • Rule 1: If K 1 is A 1 and K 2 is B 1 ; then f 1 = p 1 k 1 + q 1 k 2 + r 1
  • Rule 2: If K 1 is A 2 and K 2 is B 2 ; then f 1 = p 2 k 1 + q 2 k 2 + r 2
where, p 1 , q 1 , r 1 , r 2 ,     p 1 ,   p 2 , q 1 ,   q 2 , and r 2 are linear parameters, and A 1 ,   B 1 , A 2 , and B 2 are nonlinear parameters. All nodes i in this layer are equipped with M F for input k to transfer to fuzzy respectable value as following Equation (13).
O i 1 = μ A i   ( k i ) ,   f o r   i = 1 , 2
where k i is the input to ith node, O i is membership grade of k i in fuzzy set   A i   . The prediction is between the firing strength of all signals from the fuzzy layer. The output of this layer is firing strength computed as the following Equation (14).
O i 2 = ω i = μ A i   ( k 1 )   μ B 1   ( k 2 ) ,   f o r   i = 1 , 2
In the normalization parameter, every node is fixed. Node i calculates the ratio of i rule firing strength in respect to the sum of all rules firing strength. The computed normalized firing strength is given by Equation (15).
O i 3 = ϖ i = ω i ω 1 + ω 2 ,   f o r   i = 1 , 2
They compute the values of the rule of the adaptive part as the following Equation (16).
O i 4 = ϖ i   f i = ϖ i     (   p i   k i   q i   k 2   + r 1   )
It consists of one single node of ANFIS which sums all outputs that give the final output as in Equation (17).
O i 5 = ϖ i f i = i ω i f i i ω i
Input parameters, such as p i , q i   , and r 1 are related to the first function of the input parameter. However, ANFIS provides additional training options to control the training step size. To train a fuzzy system using ANFIS, the fuzzy logic toolbox software uses a backpropagation algorithm. This training process tunes the membership function parameters of a FIS such that the system models input/output data. Validation data can have the ability to check the generalization capability of the trained fuzzy inference system.

8. Simulation Parameters

The simulation parameters required to design HFC D-STATCOM and DNS feeders are discussed. The data inputs are determined based on the measurements at the HFC D-STATCOM installation site. Table 3 shows the DNS parameters that will be used in the SIMULINK software.

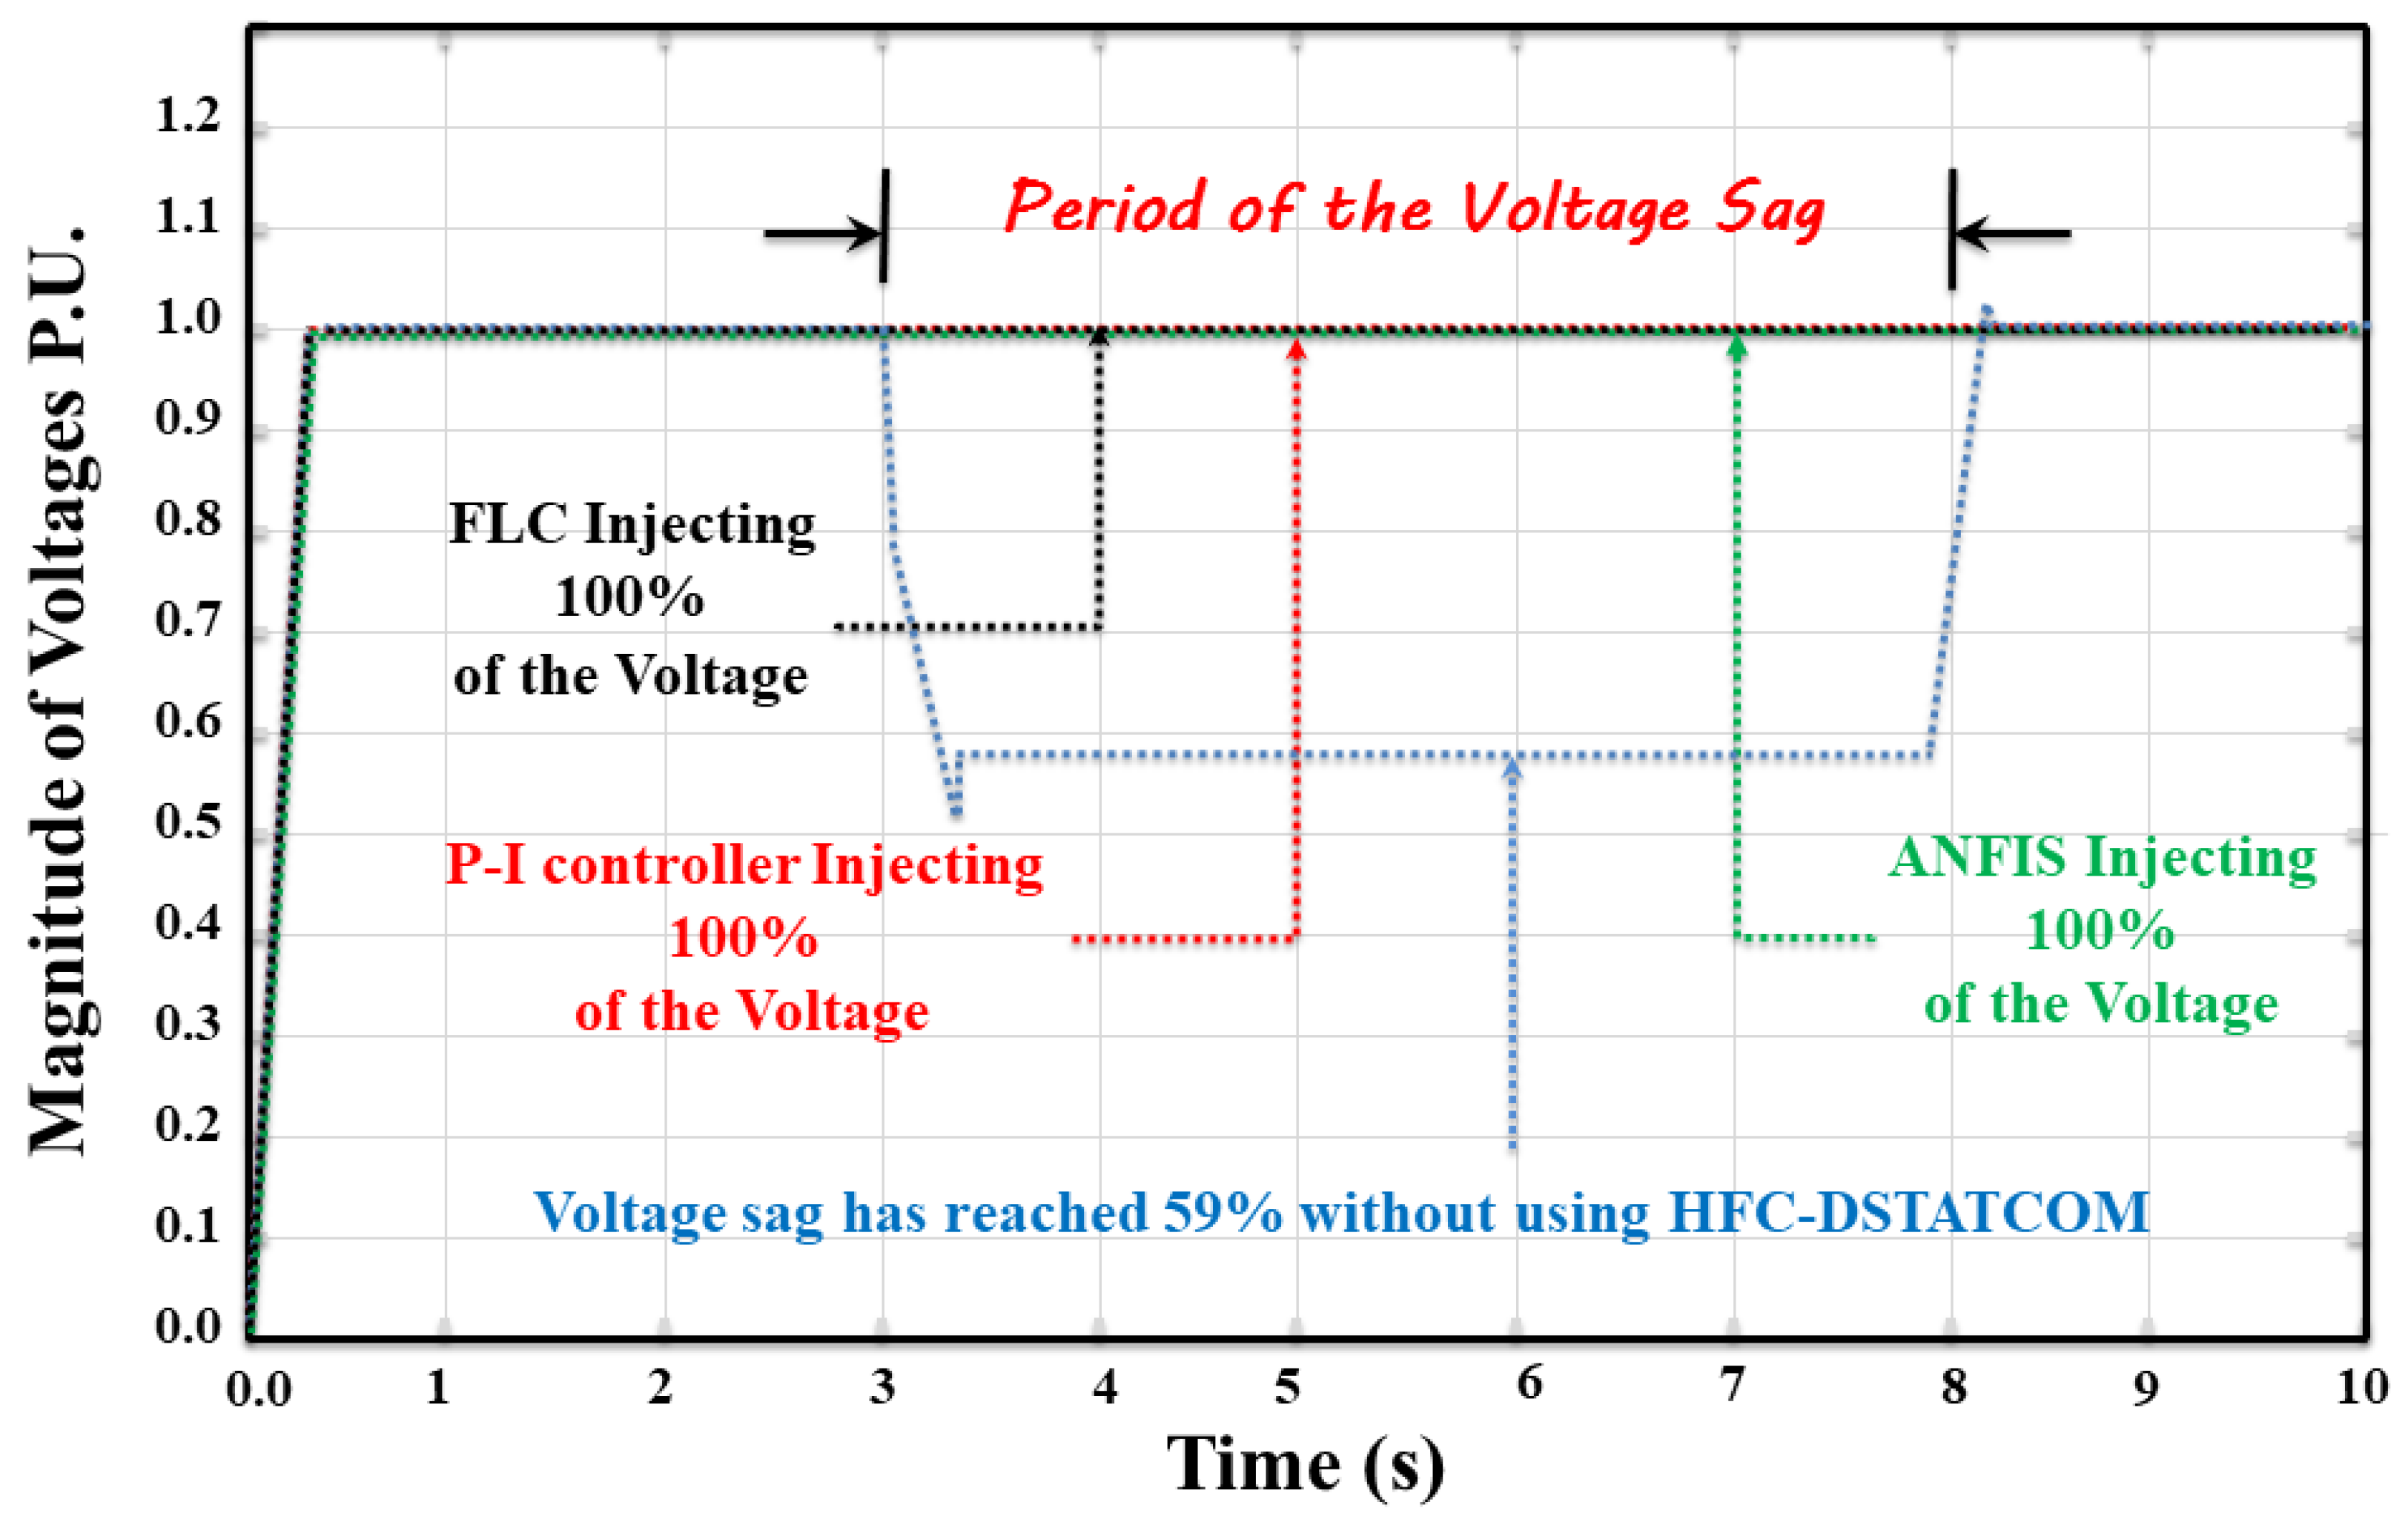
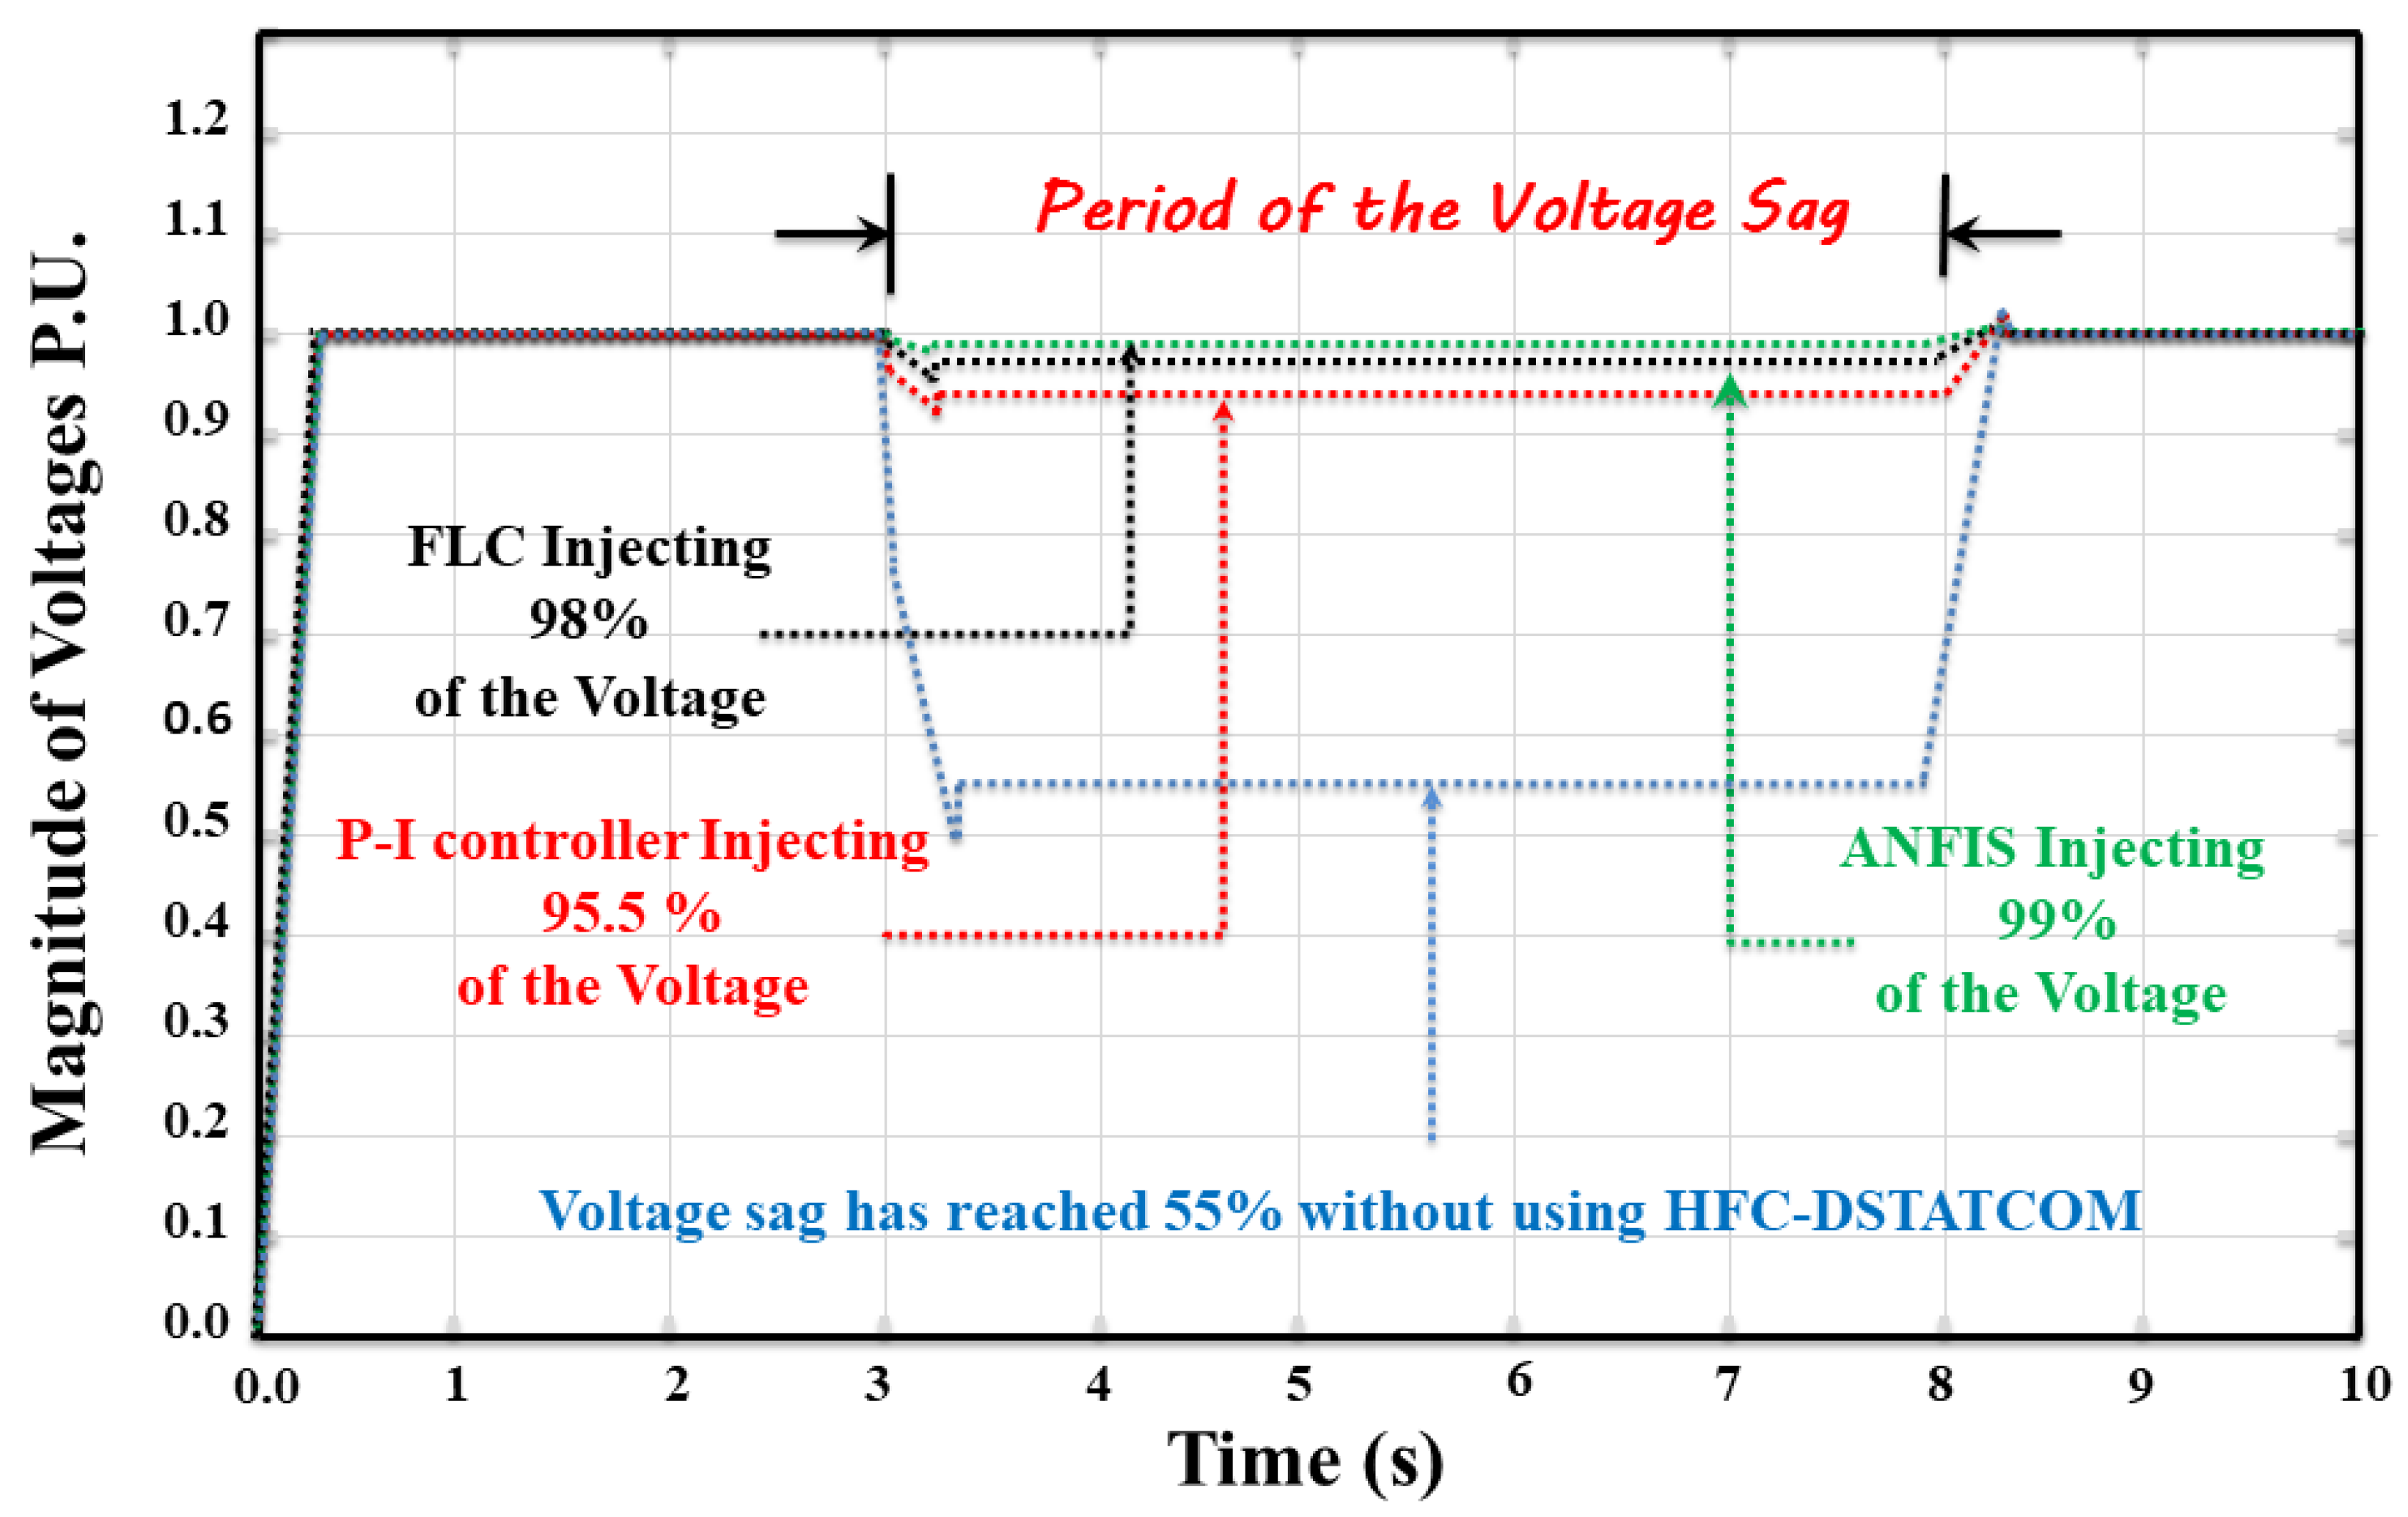
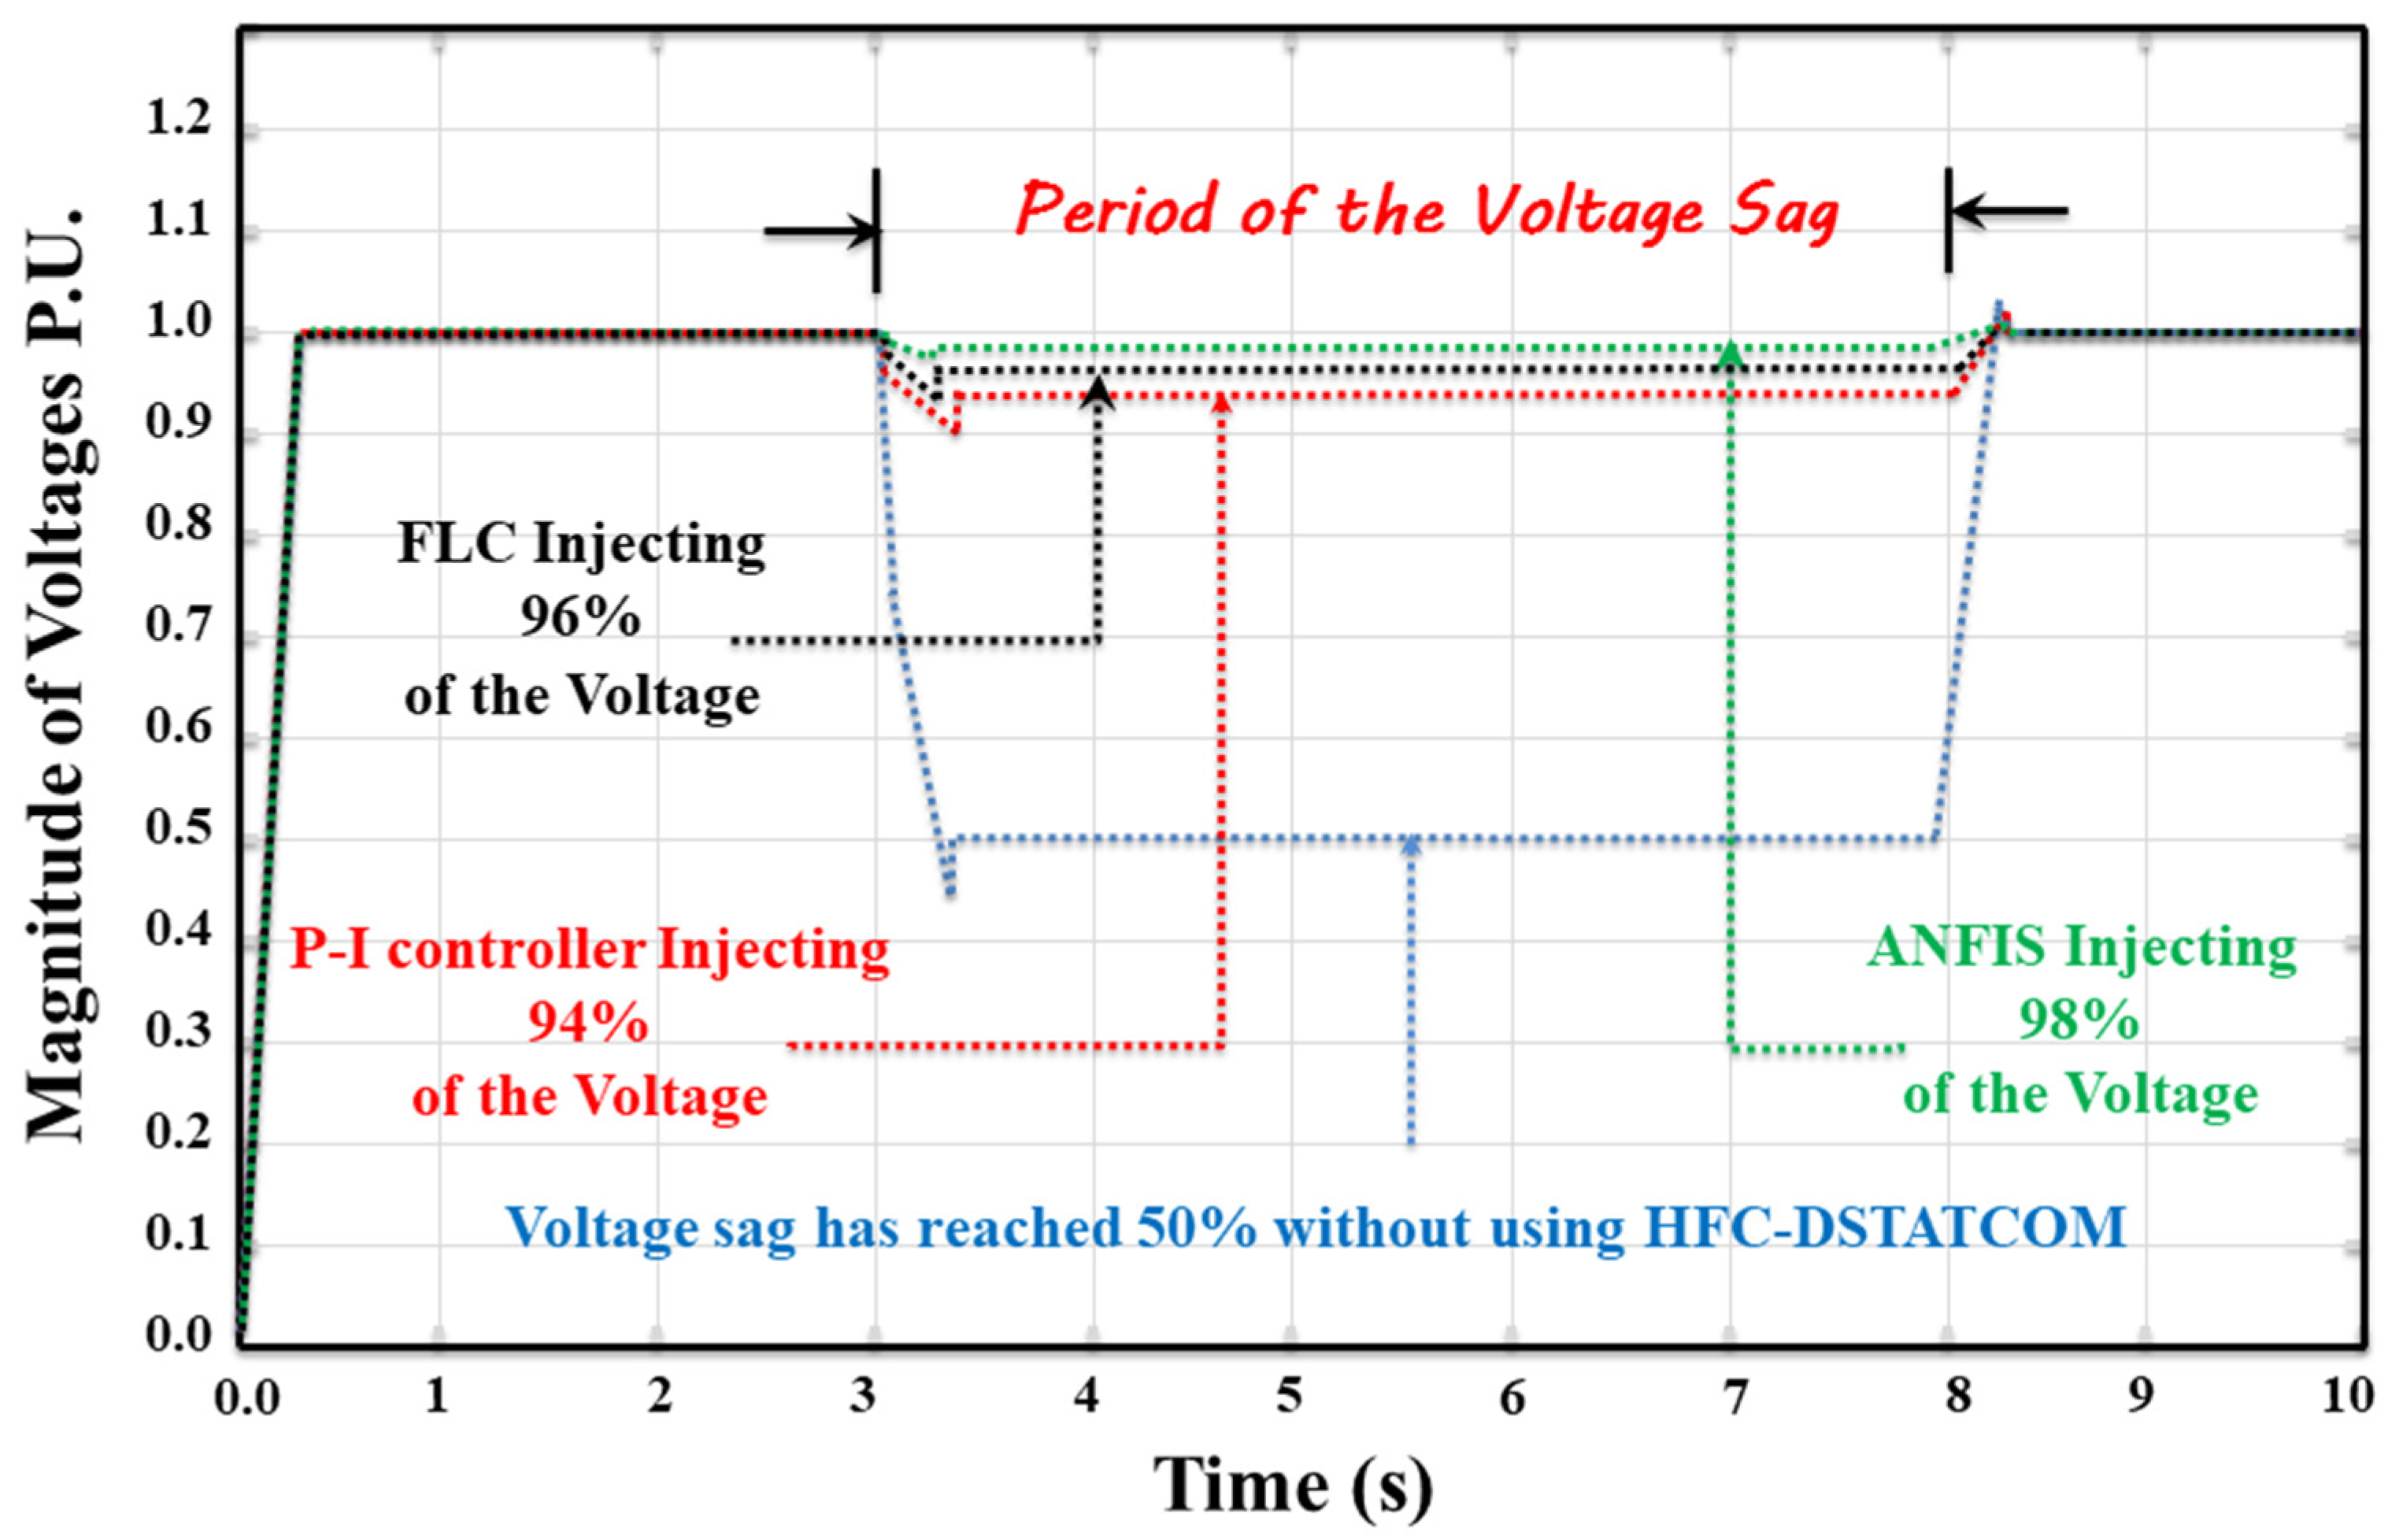
9. Result of Simulation

This paper discusses the result of HFC D-STATCOM using the P-I controller, FLC, and ANFIS throughout 33/11 kV DNS. Besides that, considering the performance with and without the installation of HFC D-STATCOM, the result is obtained by MATLAB Simulation. Figure 19 shows injection voltage by HFC D-STATCOM due to a single line-to-ground faults scenario.
The approaches controller shows that DNS voltage sag occurs from 0.3 s up to 0.8 s. The voltage sag has reached 0.59 (p.u). due to the two line-to-ground faults scenario. HFC D-STATCOM is utilized in the feeder and values of injection voltage reach 100% at a single line-to-ground faults scenario utilizing the P-I controller, FLC, and ANFIS. It is observed that the single line-to-ground of DNS has improved dramatically since the operation of the HFC D-STATCOM. Figure 20 illustrates the injection voltage by HFC D-STATCOM due to the double line-to-ground faults scenario.
Figure 20 shows that DNS voltage sag occurs from 0.3 s up to 0.8 s. The voltage sag has reached 0.55 p.u. due to the two line-to-ground faults scenario. HFC D-STATCOM applying ANFIS is utilized in the feeder and values of injection voltage reach 99% in the double line-to-ground faults scenario. Moreover, HFC D-STATCOM applying FLC is utilized in the feeder, and values of injection voltage reach 98% at double line-to-ground faults scenario. HFC D-STATCOM applying P-I controller is utilized in the feeder and values of injection voltage reach 96% at double line-to-ground faults scenario. The double line-to-ground of DNS has improved significantly since the high performance of the HFC D-STATCOM. Figure 21 illustrates the injection voltage by HFC D-STATCOM due to the three line-to-ground faults scenario.
Figure 21 illiterates that DNS voltage sag occurs from 0.3 s up to 0.8 s. HFC D-STATCOM applying ANFIS is utilized in the feeder and values of injection voltage reach 98% in the three line-to-ground faults scenario. Moreover, HFC D-STATCOM applying FLC is utilized in the feeder, and values of injection voltage reach 97% in the three line-to-ground faults scenario. HFC D-STATCOM applying P-I controller is utilized in the feeder and values of injection voltage reach 94.5% in the three line-to-ground faults scenario. It is found that three Line-to-Ground of DNS has enhanced significantly since the high operation of the HFC D-STATCOM. The paper aimed to identify effective strategies of HFC-DSTATCOM for dealing with voltage sag throughout 33/11 kV DNS. By all accounts, with the proven result, HFC-DSTATCOM is being actively considered as an advance in electrical engineering technology. Moreover, HFC-DSTATCOM is utilized in a distribution network system to enhance the feeder’s voltage and current imperfections caused by the operation of shunt units, respectively. In this paper, accurate modeling of HFC D-STATCOM and its integration in the P-I controller, FLC, and ANFIS is proposed. Hence, enhancement techniques are proposed in the operation of HFC D-STATCOM which utilizes the shunt unit to contribute to voltage sag compensation. The proposed approaches determine the reactive power injection of shunt units and provide strong potential to compensate the voltage sag by injection of series voltage such as reactive power injection. Under any of these scenarios, the proposed approaches are utilized with single line-to-ground, double line-to-ground, and three line-to-ground faults scenario. Results confirm that the performance of HFC-DSTATCOM in healthy and especially in voltage sag conditions is deeply improved. The proposed approaches can be utilized in designing the control strategy of HFC D-STATCOM. It can be concluded that there are several controller approaches to eliminate the voltage sag important for the improvement of the operation of DNS in terms of injection time as well as the magnitude of voltage. Future exploration into energy storage system techniques could be useful for finding further elimination techniques. The amount of power density and efficiency that can improve the DNS with several types of ESS is worth investigating.

10. Conclusions

This paper addresses the relation between ESS and carbon emissions in-depth. Annual energy storage deployment by countries, 2013–2019, and energy-related ( CO 2 ) emissions, 2010–2019, are illustrated in detail. In addition, the applications and technologies of ESS in electric power systems are deliberated, including a transmission network system, distribution network system, customer side. The categorization of ESS technologies and applications using the power capacity of income, outcome, and discharge duration time is illustrated in this paper. Moreover, load leveling and peak shaving have demonstrated the feasibility of ESS application. In this respect, one of the major topics to be investigated in this paper is the benefits of HFC in DNS. Challenges of DNS have been widely adopted in the field of PQ issues and challenges of ESSs, change in DNS fault level, conventional energy systems (CES), voltage stability, and cables and distribution lines. The paper also discusses the mathematic D-STATCOM modeling impact of DNS and the system of HFC power technology. The obtained results of the input parameters for HFC D-STATCOM using P-I Controllers, Takagi–Sugeno fuzzy inference system (FIS), and adaptive neuro-fuzzy inference system rule-based controller shows an effective performance to eliminate the voltage sag. In addition to that, it requires less space as bulky passive devices will be eventually eliminated. In this context, one of the most important traits for D-STATCOM technology delivery systems is that they must be inherently modular and relocatable. Moreover, D-STATCOM technology model is technically superior to its competitors in terms of performance due to low voltage conditions such as the reactive current that can be maintained in different fault scenarios. To sum up, HFC D-STATCOM applying ANFIS is utilized in the feeder and values of injection voltage reach 98% in the three line-to-ground faults scenario. Moreover, HFC D-STATCOM applying FLC is utilized in the feeder, and values of injection voltage reach 97% in the three line-to-ground faults scenario. HFC D-STATCOM applying P-I Controller is utilized in the feeder and values of injection voltage reach 94.5% in the three line-to-ground faults scenario. In the double line-to-ground faults scenario, HFC D-STATCOM applying ANFIS is utilized in the feeder and values of injection voltage reach 99%. Moreover, HFC D-STATCOM applying FLC is utilized in the feeder, and values of injection voltage reach 98% in the double line-to-ground faults scenario. HFC D-STATCOM applying P-I Controller is utilized in the feeder and values of injection voltage reach 96%. HFC D-STATCOM is utilized in the feeder and values of injection voltage reach 100% in a single line-to-ground faults scenario utilizing the P-I controller, FLC, and ANFIS, respectively.

Author Contributions

Author Contributions: M.M.K. contributed theoretical approaches, simulation, and preparing the article; M.R.A. and S.M.Z. contributed to supervision; M.R.A. and S.M.Z. contributed to article editing. All authors have read and agreed to the published version of the manuscript.

Funding

This research was funded by Fundamental Research Grant Scheme (FRGS) under a grant number of FRGS/1/2019/TK07/UNIMAP/03/2 from the Ministry of Higher Education Malaysia and the support from Faculty of Electrical Engineering Technology, Universiti Malaysia Perlis (UniMAP) for the FTKE Research Activities Fund.

Institutional Review Board Statement

Not applicable.

Informed Consent Statement

Not applicable.

Data Availability Statement

Not applicable.

Conflicts of Interest

The authors declare no conflict of interest.

References

  1. Khayrullina, A.G.; Blinov, D.; Borzenko, V. Novel kW scale hydrogen energy storage system utilizing fuel cell exhaust air for hydrogen desorption process from metal hydride reactor. Energy 2019, 183, 1244–1252. [Google Scholar] [CrossRef]
  2. Peker, M.; Kocaman, A.S.; Kara, B.Y. Benefits of transmission switching and energy storage in power systems with high renewable energy penetration. Appl. Energy 2018, 228, 1182–1197. [Google Scholar] [CrossRef]
  3. Bareiß, K.; de la Rúa, C.; Möckl, M.; Hamacher, T. Life cycle assessment of hydrogen from proton exchange membrane water electrolysis in future energy systems. Appl. Energy 2019, 237, 862–872. [Google Scholar] [CrossRef]
  4. Shulga, R.; Putilova, I. Multi-agent direct current systems using renewable energy sources and hydrogen fuel cells. Int. J. Hydrog. Energy 2020, 45, 6982–6993. [Google Scholar] [CrossRef]
  5. Koponen, J.; Ruuskanen, V.; Hehemann, M.; Rauls, E.; Kosonen, A.; Ahola, J.; Stolten, D. Effect of power quality on the design of proton exchange membrane water electrolysis systems. Appl. Energy 2020, 279, 115791. [Google Scholar] [CrossRef]
  6. Khaleel, M.M.; Adzman, M.R.; Zali, S.M.; Graisa, M.M. A Review of Fuel Cell to Distribution Network Interface Using D-FACTS: Technical Challenges and Interconnection Trends. Int. J. Electr. Electron. Eng. Telecommun. 2021, 10, 319–332. [Google Scholar] [CrossRef]
  7. Hannan, M.; Lipu, M.H.; Ker, P.J.; Begum, R.; Agelidis, V.G.; Blaabjerg, F. Power electronics contribution to renewable energy conversion addressing emission reduction: Applications, issues, and recommendations. Appl. Energy 2019, 251, 113404. [Google Scholar] [CrossRef]
  8. Bravo, R.; Ortiz, C.; Chacartegui, R.; Friedrich, D. Hybrid solar power plant with thermochemical energy storage: A multi-objective operational optimisation. Energy Convers. Manag. 2020, 205, 112421. [Google Scholar] [CrossRef]
  9. Hajiaghasi, S.; Salemnia, A.; Hamzeh, M. Hybrid energy storage system for microgrids applications: A review. J. Energy Storage 2019, 21, 543–570. [Google Scholar] [CrossRef]
  10. Cheng, M.; Sami, S.S.; Wu, J. Benefits of using virtual energy storage system for power system frequency response. Appl. Energy 2017, 194, 376–385. [Google Scholar] [CrossRef] [Green Version]
  11. Das, C.K.; Bass, O.; Mahmoud, T.S.; Kothapalli, G.; Mousavi, N.; Habibi, D.; Masoum, M.A. Optimal allocation of distributed energy storage systems to improve performance and power quality of distribution networks. Appl. Energy 2019, 252, 113468. [Google Scholar] [CrossRef]
  12. Koohi-Fayegh, S.; Rosen, M. A review of energy storage types, applications and recent developments. J. Energy Storage 2020, 27, 101047. [Google Scholar] [CrossRef]
  13. Inci, M.; Türksoy, Ö. Review of fuel cells to grid interface: Configurations, technical challenges and trends. J. Clean. Prod. 2019, 213, 1353–1370. [Google Scholar] [CrossRef]
  14. Alhassan, A.; Zhang, X.; Shen, H.; Xu, H. Power transmission line inspection robots: A review, trends and challenges for future research. Int. J. Electr. Power Energy Syst. 2020, 118, 105862. [Google Scholar] [CrossRef]
  15. Yang, L.; Cai, Z.; Li, C.; He, Q.; Ma, Y.; Guo, C. Numerical investigation of cycle performance in compressed air energy storage in aquifers. Appl. Energy 2020, 269, 115044. [Google Scholar] [CrossRef]
  16. Gupta, R.; Soini, M.C.; Patel, M.K.; Parra, D. Levelized cost of solar photovoltaics and wind supported by storage technologies to supply firm electricity. J. Energy Storage 2020, 27, 101027. [Google Scholar] [CrossRef]
  17. Gil-González, W.; Montoya, O.D. Active and reactive power conditioning using SMES devices with PMW-CSC: A feedback nonlinear control approach. Ain Shams Eng. J. 2019, 10, 369–378. [Google Scholar] [CrossRef]
  18. Mousavi G, S.M.; Faraji, F.; Majazi, A.; Al-Haddad, K. A comprehensive review of Flywheel Energy Storage System technology. Renew. Sustain. Energy Rev. 2017, 67, 477–490. [Google Scholar] [CrossRef]
  19. Gambôa, P.; Silva, J.F.; Pinto, S.; Margato, E. Input–Output Linearization and PI controllers for AC–AC matrix converter based Dynamic Voltage Restorers with Flywheel Energy Storage: A comparison. Electr. Power Syst. Res. 2019, 169, 214–228. [Google Scholar] [CrossRef]
  20. Eglitis, R.I.; Borstel, G. Towards a practical rechargeable 5 V Li ion battery. Phys. Status Solidi Appl. Mater. Sci. 2005, 202, R13–R15. [Google Scholar] [CrossRef]
  21. Eglitis, R. Ab initio calculations of Li2(Co, Mn)O8 solid solutions for rechargeable batteries. Int. J. Mod. Phys. B 2019, 33, 1–8. [Google Scholar] [CrossRef]
  22. Pelay, U.; Luo, L.; Fan, Y.; Stitou, D. Dynamic modeling and simulation of a concentrating solar power plant integrated with a thermochemical energy storage system. J. Energy Storage 2020, 28, 101164. [Google Scholar] [CrossRef]
  23. Das, C.K.; Bass, O.; Kothapalli, G.; Mahmoud, T.S.; Habibi, D. Overview of energy storage systems in distribution networks: Placement, sizing, operation, and power quality. Renew. Sustain. Energy Rev. 2018, 91, 1205–1230. [Google Scholar] [CrossRef]
  24. Shahnia, F.; Ami, S.M.; Ghosh, A. Circulating the reverse flowing surplus power generated by single-phase DERs among the three phases of the distribution lines. Int. J. Electr. Power Energy Syst. 2016, 76, 90–106. [Google Scholar] [CrossRef]
  25. Rohouma, W.; Balog, R.S.; Peerzada, A.A.; Begovic, M.M. D-STATCOM for harmonic mitigation in low voltage distribution network with high penetration of nonlinear loads. Renew. Energy 2020, 145, 1449–1464. [Google Scholar] [CrossRef]
  26. Mohammadi, Y.; Leborgne, R.C. Improved DR and CBM methods for finding relative location of voltage sag source at the PCC of distributed energy resources. Int. J. Electr. Power Energy Syst. 2020, 117, 105664. [Google Scholar] [CrossRef]
  27. Rajarajan, R.; Prakash, R. A reformed adaptive frequency passiveness control for unified power quality compensator with model parameter ability to improve power quality. Microprocess. Microsyst. 2020, 73, 102984. [Google Scholar] [CrossRef]
  28. Choi, W.; Lee, W.; Han, D.; Sarlioglu, B. New Configuration of Multifunctional Grid-Connected Inverter to Improve Both Current-Based and Voltage-Based Power Quality. IEEE Trans. Ind. Appl. 2018, 54, 6374–6382. [Google Scholar] [CrossRef]
  29. Al Hosani, K.; Nguyen, T.H.; Al Sayari, N. An improved control strategy of 3P4W DVR systems under unbalanced and distorted voltage conditions. Int. J. Electr. Power Energy Syst. 2018, 98, 233–242. [Google Scholar] [CrossRef]
  30. International Energy Agency. Statistics Report CO2 Emissions from Fuel Combustion; IEA: Paris, France, 2020. [Google Scholar]
  31. Liu, J.; Hu, C.; Kimber, A.; Wang, Z. Uses, Cost-Benefit Analysis, and Markets of Energy Storage Systems for Electric Grid Applications. J. Energy Storage 2020, 32, 101731. [Google Scholar] [CrossRef]
  32. Ye, J.; Gooi, H.B.; Wu, F. Optimal Design and Control Implementation of UPQC Based on Variable Phase Angle Control Method. IEEE Trans. Ind. Inform. 2018, 14, 3109–3123. [Google Scholar] [CrossRef]
  33. Ray, P.K.; Das, S.R.; Mohanty, A. Fuzzy-Controller-Designed-PV-Based Custom Power Device for Power Quality Enhancement. IEEE Trans. Energy Convers. 2019, 34, 405–414. [Google Scholar] [CrossRef]
  34. Sirjani, R.; Jordehi, A.R. Optimal placement and sizing of distribution static compensator (D-STATCOM) in electric distribution networks: A review. Renew. Sustain. Energy Rev. 2017, 77, 688–694. [Google Scholar] [CrossRef]
  35. Kharrazi, A.; Sreeram, V.; Mishra, Y. Assessment techniques of the impact of grid-tied rooftop photovoltaic generation on the power quality of low voltage distribution network—A review. Renew. Sustain. Energy Rev. 2020, 120, 109643. [Google Scholar] [CrossRef]
  36. Shah, P.; Hussain, I.; Singh, B. Single-Stage SECS Interfaced With Grid Using ISOGI-FLL-Based Control Algorithm. IEEE Trans. Ind. Appl. 2018, 55, 701–711. [Google Scholar] [CrossRef]
  37. Zheng, Z.; Xiao, X.; Chen, X.Y.; Huang, C.; Xu, J. Performance Evaluation of a MW-Class SMES-Based DVR System for Enhancing Transient Voltage Quality by Using d–q Transform Control. IEEE Trans. Appl. Supercond. 2018, 28, 1–5. [Google Scholar] [CrossRef]
  38. Hafezi, H.; Faranda, R. Dynamic Voltage Conditioner: A New Concept for Smart Low-Voltage Distribution Systems. IEEE Trans. Power Electron. 2018, 33, 7582–7590. [Google Scholar] [CrossRef]
  39. Liao, H.; Milanovic, J.V.; Rodrigues, M.A.; Shenfield, A. Voltage Sag Estimation in Sparsely Monitored Power Systems Based on Deep Learning and System Area Mapping. IEEE Trans. Power Deliv. 2018, 33, 3162–3172. [Google Scholar] [CrossRef]
  40. Gee, A.M.; Robinson, F.; Yuan, W. A Superconducting Magnetic Energy Storage-Emulator/Battery Supported Dynamic Voltage Restorer. IEEE Trans. Energy Convers. 2017, 32, 55–64. [Google Scholar] [CrossRef] [Green Version]
  41. Lopez, M.A.G.; De Vicuna, J.L.G.; Miret, J.; Castilla, M.; Guzman, R. Control Strategy for Grid-Connected Three-Phase Inverters During Voltage Sags to Meet Grid Codes and to Maximize Power Delivery Capability. IEEE Trans. Power Electron. 2018, 33, 9360–9374. [Google Scholar] [CrossRef] [Green Version]
  42. Naderi, Y.; Hosseini, S.H.; Zadeh, S.G.; Mohammadi-Ivatloo, B.; Vasquez, J.C.; Guerrero, J. An overview of power quality enhancement techniques applied to distributed generation in electrical distribution networks. Renew. Sustain. Energy Rev. 2018, 93, 201–214. [Google Scholar] [CrossRef] [Green Version]
  43. Sharma, A.; Rajpurohit, B.; Singh, S. A review on economics of power quality: Impact, assessment and mitigation. Renew. Sustain. Energy Rev. 2018, 88, 363–372. [Google Scholar] [CrossRef]
  44. Zheng, Z.-X.; Xiao, X.-Y.; Chen, X.Y.; Huang, C.-J.; Zhao, L.-H.; Li, C.-S. Performance Evaluation of a MW-Class SMES-BES DVR System for Mitigation of Voltage Quality Disturbances. IEEE Trans. Ind. Appl. 2018, 54, 3090–3099. [Google Scholar] [CrossRef]
  45. Bastos, A.F.; Lao, K.-W.; Todeschini, G.; Santoso, S. Accurate Identification of Point-on-Wave Inception and Recovery Instants of Voltage Sags and Swells. IEEE Trans. Power Deliv. 2019, 34, 551–560. [Google Scholar] [CrossRef] [Green Version]
  46. Biricik, S.; Komurcugil, H.; Tuyen, N.D.; Basu, M. Protection of Sensitive Loads Using Sliding Mode Controlled Three-Phase DVR With Adaptive Notch Filter. IEEE Trans. Ind. Electron. 2019, 66, 5465–5475. [Google Scholar] [CrossRef]
  47. Wang, J.; Xing, Y.; Wu, H.; Yang, T. A Novel Dual-DC-Port Dynamic Voltage Restorer With Reduced-Rating Integrated DC–DC Converter for Wide-Range Voltage Sag Compensation. IEEE Trans. Power Electron. 2019, 34, 7437–7449. [Google Scholar] [CrossRef]
  48. Shakeri, S.; Esmaeili, S.; Koochi, M.H.R. Determining accurate area of vulnerability for reliable voltage sag assessment considering wind turbine ride-through capability. Int. J. Electr. Power Energy Syst. 2020, 119, 105875. [Google Scholar] [CrossRef]
  49. Hasan, S.; Nair, A.R.; Bhattarai, R.; Kamalasadan, S.; Muttaqi, K.M. A Coordinated Optimal Feedback Control of Distributed Generators for Mitigation of Motor Starting Voltage Sags in Distribution Networks. IEEE Trans. Ind. Appl. 2020, 56, 864–875. [Google Scholar] [CrossRef]
  50. Mohammadi, Y.; Leborgne, R.C. A new approach for voltage sag source relative location in active distribution systems with the presence of inverter-based distributed generations. Electr. Power Syst. Res. 2020, 182, 106222. [Google Scholar] [CrossRef]
  51. Camacho, A.; Castilla, M.; Miret, J.; De Vicuna, L.G.; Andres, G.L.M. Control Strategy for Distribution Generation Inverters to Maximize the Voltage Support in the Lowest Phase During Voltage Sags. IEEE Trans. Ind. Electron. 2018, 65, 2346–2355. [Google Scholar] [CrossRef]
  52. Kang, T.; Choi, S.; Morsy, A.S.; Enjeti, P.N. Series Voltage Regulator for a Distribution Transformer to Compensate Voltage Sag/Swell. IEEE Trans. Ind. Electron. 2017, 64, 4501–4510. [Google Scholar] [CrossRef]
  53. Camarillo-Penaranda, J.R.; Ramos, G. Fault Classification and Voltage Sag Parameter Computation Using Voltage Ellipses. IEEE Trans. Ind. Appl. 2019, 55, 92–97. [Google Scholar] [CrossRef]
  54. Wei, P.; Xu, Y.; Wu, Y.; Li, C. Research on classification of voltage sag sources based on recorded events. CIRED Open Access Proc. J. 2017, 2017, 846–850. [Google Scholar] [CrossRef] [Green Version]
  55. Huchche, V.; Patne, N.R.; Junghare, A. Computation of Energy Loss in an Induction Motor During Unsymmetrical Voltage Sags—A Graphical Method. IEEE Trans. Ind. Inform. 2017, 14, 2023–2030. [Google Scholar] [CrossRef]
  56. Mosaad, M.I.; El-Raouf, M.O.A.; Al-Ahmar, M.A.; Bendary, F.M. Optimal PI controller of DVR to enhance the performance of hybrid power system feeding a remote area in Egypt. Sustain. Cities Soc. 2019, 47, 101469. [Google Scholar] [CrossRef]
  57. Raveendra, N.; Madhusudhan, V.; Laxmi, A.J. RFLSA control scheme for power quality disturbances mitigation in DSTATCOM with n-level inverter connected power systems. Energy Syst. 2019, 11, 753–778. [Google Scholar] [CrossRef]
  58. Varma, R.K.; Maleki, H. PV Solar System Control as STATCOM (PV-STATCOM) for Power Oscillation Damping. IEEE Trans. Sustain. Energy 2018, 10, 1793–1803. [Google Scholar] [CrossRef]
  59. Rivas, A.E.L.; Abrão, T. Faults in smart grid systems: Monitoring, detection and classification. Electr. Power Syst. Res. 2020, 189, 106602. [Google Scholar] [CrossRef]
  60. Yuan, C.; Liao, Y.; Kong, L.; Xiao, H. Fault diagnosis method of distribution network based on time sequence hierarchical fuzzy petri nets. Electr. Power Syst. Res. 2021, 191, 106870. [Google Scholar] [CrossRef]
  61. Bahmanyar, A.; Jamali, S. Fault location in active distribution networks using non-synchronized measurements. Int. J. Electr. Power Energy Syst. 2017, 93, 451–458. [Google Scholar] [CrossRef]
  62. Silos-Sanchez, A.; Villafafila-Robles, R.; Lloret-Gallego, P. Novel fault location algorithm for meshed distribution networks with DERs. Electr. Power Syst. Res. 2020, 181, 106182. [Google Scholar] [CrossRef]
  63. Singh, J.; Singh, S.; Singh, A. Distribution transformer failure modes, effects and criticality analysis (FMECA). Eng. Fail. Anal. 2019, 99, 180–191. [Google Scholar] [CrossRef]
  64. Murugan, R.; Ramasamy, R. Understanding the power transformer component failures for health index-based maintenance planning in electric utilities. Eng. Fail. Anal. 2019, 96, 274–288. [Google Scholar] [CrossRef]
  65. Aj, C.; Salam, M.; Rahman, Q.; Wen, F.; Ang, S.; Voon, W. Causes of transformer failures and diagnostic methods – A review. Renew. Sustain. Energy Rev. 2018, 82, 1442–1456. [Google Scholar] [CrossRef]
  66. Liu, R.; Dan, B.; Zhou, M.; Zhang, Y. Coordinating contracts for a wind-power equipment supply chain with joint efforts on quality improvement and maintenance services. J. Clean. Prod. 2020, 243, 118616. [Google Scholar] [CrossRef]
  67. Nascimento, S.D.; Gouvêa, M.M. Voltage Stability Enhancement in Power Systems with Automatic Facts Device Allocation. Energy Procedia 2017, 107, 60–67. [Google Scholar] [CrossRef]
  68. Hossain, E.; Perez, R.; Nasiri, A.; Bayindir, R. Stability improvement of microgrids in the presence of constant power loads. Int. J. Electr. Power Energy Syst. 2018, 96, 442–456. [Google Scholar] [CrossRef]
  69. Choudhury, S.; Bhowmik, P.; Rout, P.K. Economic load sharing in a D-STATCOM Integrated Islanded Microgrid based on Fuzzy Logic and Seeker Optimization Approach. Sustain. Cities Soc. 2018, 37, 57–69. [Google Scholar] [CrossRef]
  70. Baghban-Novin, S.; Mahzouni-Sani, M.; Hamidi, A.; Golshannavaz, S.; Nazarpour, D.; Siano, P. Investigating the impacts of feeder reforming and distributed generation on reactive power demand of distribution networks. Sustain. Energy Grids Netw. 2020, 22, 100350. [Google Scholar] [CrossRef]
  71. Khoshkbar-Sadigh, A.; Heydari, M.; Tedde, M.; Smedley, K.; Arghandeh, R.; Von Meier, A. A unified platform enabling power system circuit model data transfer among different software. In Proceedings of the 2015 IEEE Power Energy Society Innovative Smart Grid Technologies Conference (ISGT), Washington, DC, USA, 18–20 February 2015; pp. 1–5. [Google Scholar] [CrossRef] [Green Version]
  72. Ajanovic, A.; Hiesl, A.; Haas, R. On the role of storage for electricity in smart energy systems. Energy 2020, 200, 117473. [Google Scholar] [CrossRef]
  73. Wang, Z.; Yin, X.; Chen, Y.; Lai, J.; Li, L.; Qi, Z. DSTATCOM integrated with Y-y connection transformer for reactive power compensation. Int. J. Electr. Power Energy Syst. 2020, 117, 105721. [Google Scholar] [CrossRef]
  74. Yuvaraj, T.; Ravi, K.; Devabalaji, K. DSTATCOM allocation in distribution networks considering load variations using bat algorithm. Ain Shams Eng. J. 2017, 8, 391–403. [Google Scholar] [CrossRef] [Green Version]
  75. Sanam, J.; Ganguly, S.; Panda, A.K.; Hemanth, C. Optimization of Energy Loss Cost of Distribution Networks with the Optimal Placement and Sizing of DSTATCOM Using Differential Evolution Algorithm. Arab. J. Sci. Eng. 2017, 42, 2851–2865. [Google Scholar] [CrossRef]
  76. Chugh, S.; Chaudhari, C.; Sonkar, K.; Sharma, A.; Kapur, G.; Ramakumar, S. Experimental and modelling studies of low temperature PEMFC performance. Int. J. Hydrog. Energy 2020, 45, 8866–8874. [Google Scholar] [CrossRef]
  77. Ou, K.; Yuan, W.-W.; Choi, M.; Yang, S.; Jung, S.; Kim, Y.-B. Optimized power management based on adaptive-PMP algorithm for a stationary PEM fuel cell/battery hybrid system. Int. J. Hydrog. Energy 2018, 43, 15433–15444. [Google Scholar] [CrossRef]
  78. Kong, L.; Yu, J.; Cai, G. Modeling, control and simulation of a photovoltaic /hydrogen/ supercapacitor hybrid power generation system for grid-connected applications. Int. J. Hydrog. Energy 2019, 44, 25129–25144. [Google Scholar] [CrossRef]
  79. Kordestani, M.; Zanj, A.; Orchard, M.; Saif, M. A Modular Fault Diagnosis and Prognosis Method for Hydro-Control Valve System Based on Redundancy in Multisensor Data Information. IEEE Trans. Reliab. 2018, 68, 330–341. [Google Scholar] [CrossRef]
  80. Chi, X.; Quan, S.; Chen, J.; Wang, Y.X.; He, H. Proton exchange membrane fuel cell-powered bidirectional DC motor control based on adaptive sliding-mode technique with neural network estimation. Int. J. Hydrog. Energy 2020, 45, 20282–20292. [Google Scholar] [CrossRef]
Figure 1. The classification of ESS technologies [6].
Energies 14 07073 g001
Figure 2. Annual energy storage deployment by countries, 2013–2019 [30].
Energies 14 07073 g002
Figure 3. Energy-related CO2 emissions, 2010–2019 [30].
Energies 14 07073 g003
Figure 4. The categorization of ESS technologies using the power capacity of income, outcome, and discharge duration time.
Energies 14 07073 g004
Figure 5. The categorization of ESS applications is based on the power capacity of input and output and their discharge duration time.
Energies 14 07073 g005
Figure 6. Load leveling of ESS application [31].
Energies 14 07073 g006
Figure 7. Peak shaving of ESS application [31].
Energies 14 07073 g007
Figure 8. The voltage sag characteristics.
Energies 14 07073 g008
Figure 9. Common sources of transformer failures [65].
Energies 14 07073 g009
Figure 10. Outages due to bushing problems [65].
Energies 14 07073 g010
Figure 11. The block diagrams and the location of HFC D-STATCOM.
Energies 14 07073 g011
Figure 12. Single-line technique diagram of DNS feeder of [75].
Energies 14 07073 g012
Figure 13. The current and voltage phasor technique diagram [75].
Energies 14 07073 g013
Figure 14. HFC D-STATCOM Phasor technique structure installation in feeder i + 1 .
Energies 14 07073 g014
Figure 15. The P-I controller of HFC D-STATCOM.
Energies 14 07073 g015
Figure 16. Flowchart of Takagi–Sugeno fuzzy inference system.
Energies 14 07073 g016
Figure 17. The FLC and ANFIS of HFC D-STATCOM.
Energies 14 07073 g017
Figure 18. Flowcharts of ANFIS.
Energies 14 07073 g018
Figure 19. Injection voltage by HFC D-STATCOM due to Single Line-to-Ground Faults Scenario.
Energies 14 07073 g019
Figure 20. The injection voltage by HFC D-STATCOM due to the two Line-to-Ground Faults Scenario.
Energies 14 07073 g020
Figure 21. Illustrates the injection voltage by HFC D-STATCOM due to the Three Line-to-Ground Faults Scenario.
Energies 14 07073 g021
Table 1. Categorization of ESS applications using the physical locations in the electric power system domain for ESS and the benefit of services. Adapted with permission from ref. [31]. Copyright 2020. Elsevier.
Services BenefitElectric Power System DomainTransmission Network SystemDistribution Network SystemCustomer Side
Power Rating(10~100 s) MW(0.010~10) MW(0.002~2) MW
Transmission Network
System
Transmission deferralX
Voltage support
Inertia
Frequency response
Black start
Distribution Network
System
Distribution deferralXX
Voltage SagX
Voltage spikeX
Voltage UnbalanceX
NoiseX
Harmonic distortionX
Reliability serviceX
Micro-gridX
Customer SideBill reductionXX
Backup powerXX
Table 2. The most common power quality issues in DNS [39,40,41,42,43].
IssueDefinitionCausesRole ESS?
Voltage sag When   V r m s   >   90.0 %   V n o m < 10% to for 0.50 cycle to 60 s.Large motor start-ups
Customer’s installation faults
Poor system maintenance
System faults
Yes
Voltage swell When   V r m s   >   V n o m from 10% up to 80% for 0.5 cycle to 60 s.Badly designed power sources
Load switching
Defectively regulated transformers
Badly designed power sources
Yes
Variable fluctuation Repeated   fluctuations   in   V r m s   from   90 %   up   to   110 %   of   V n o m Leading cause of frequent switching
The root cause of welding plants
Determine the cause arc furnaces
Yes
Voltage spikes/surges Abrupt   alterations   of   voltage   rate   for   several   μ s   to   a   little   m s Disconnecting heavy loads. Yes
Long interruptions while electrical power supply interruptions occur for > 1 s or 2 s duration of timePoor coordination of protection devices
Failure in equipment and fire
Yes
HarmonicThe voltage or current waveform frequencies are multiple fundamental such as non-sinusoidal waveforms.The immediate cause of system resonance
Non-linear loads utilized of tool generating non-sinusoidal currents
Yes
V r m s refers to RMS voltage, V n o m knows as nominal voltage, μs knows as micro-seconds, ns i s   refers to nano-second.
Table 3. Simulation parameters of DNS and HFC [80].
System QuantitiesUnitRatings
Voltage sourcekV33/11
Voltage lineV230
Rated power of HFC kW50
Model   coefficients   ξ 1 V0.9632
Model   coefficients   ξ 2 V / ° C −0.00291
Model   coefficients   ξ 3 Vcm 3 / ( mol   ° C ) 6.99 10 5
Model   coefficients   ξ 4 V / ( A ° C ) 1.75 10 4
Contact   resistances   R c 0.00029
Number of cells in series-100
Line FrequencyHz50
Series Transformer Turns Ratio-1:1
IGBT generator-3-arm bridge (6 pulses)
Line ImpedanceH, Ω0.005, 0.001
Load Resistance180
Load InductanceH0.1926
Publisher’s Note: MDPI stays neutral with regard to jurisdictional claims in published maps and institutional affiliations.

