1. Introduction
In December 2019, a novel coronavirus SARS-CoV-2 (severe acute respiratory syndrome) was exposed to the world, later named COVID-19. It is a newly identified infectious disease belonging to the coronavirus family, spreads through person-to-person contact [
1]. The WHO (World Health Organization) has declared the virus outbreak a pandemic on 11 March 2020 because of its quick spread and contagious nature. The list of abbreviations is presented in
Table 1. As of August 2021, the total number of infected people worldwide reached 211,746,699, out of which 4,431,960 deaths were reported, and 189,493,324 patients were recovered [
2].
Researchers from the medicine domain worldwide worked incessantly and produced a handful of vaccines, which are approved by National regulatory authorities and WHO for emergency use [
3]. WHO has approved seven vaccines for emergency use; mRNA by Moderna, BioNTech by Pfizer, Janssen by Johnson and Johnson, AstraZeneca by the University of Oxford, Covishield by Serum Institute of India, Sinopharm by Beijing Institute of Biological Products, and Sinovac-CoronaVac by Sinovac, giving the green light for these vaccines to be rolled out globally as they have the potential to reduce the possibility of getting infected by COVID-19 virus [
4]. Since December 2020, 24.3% of the world population is fully vaccinated, while 32.3% has received at least one dose of the COVID-19 vaccine. Meanwhile, only 1.4% population of low-income countries have received at least one dose of the vaccine [
5]. However, some side effects of these vaccines have been reported that typically last for several days. Therefore, the only effective prevention technique is social distancing and self-isolation.
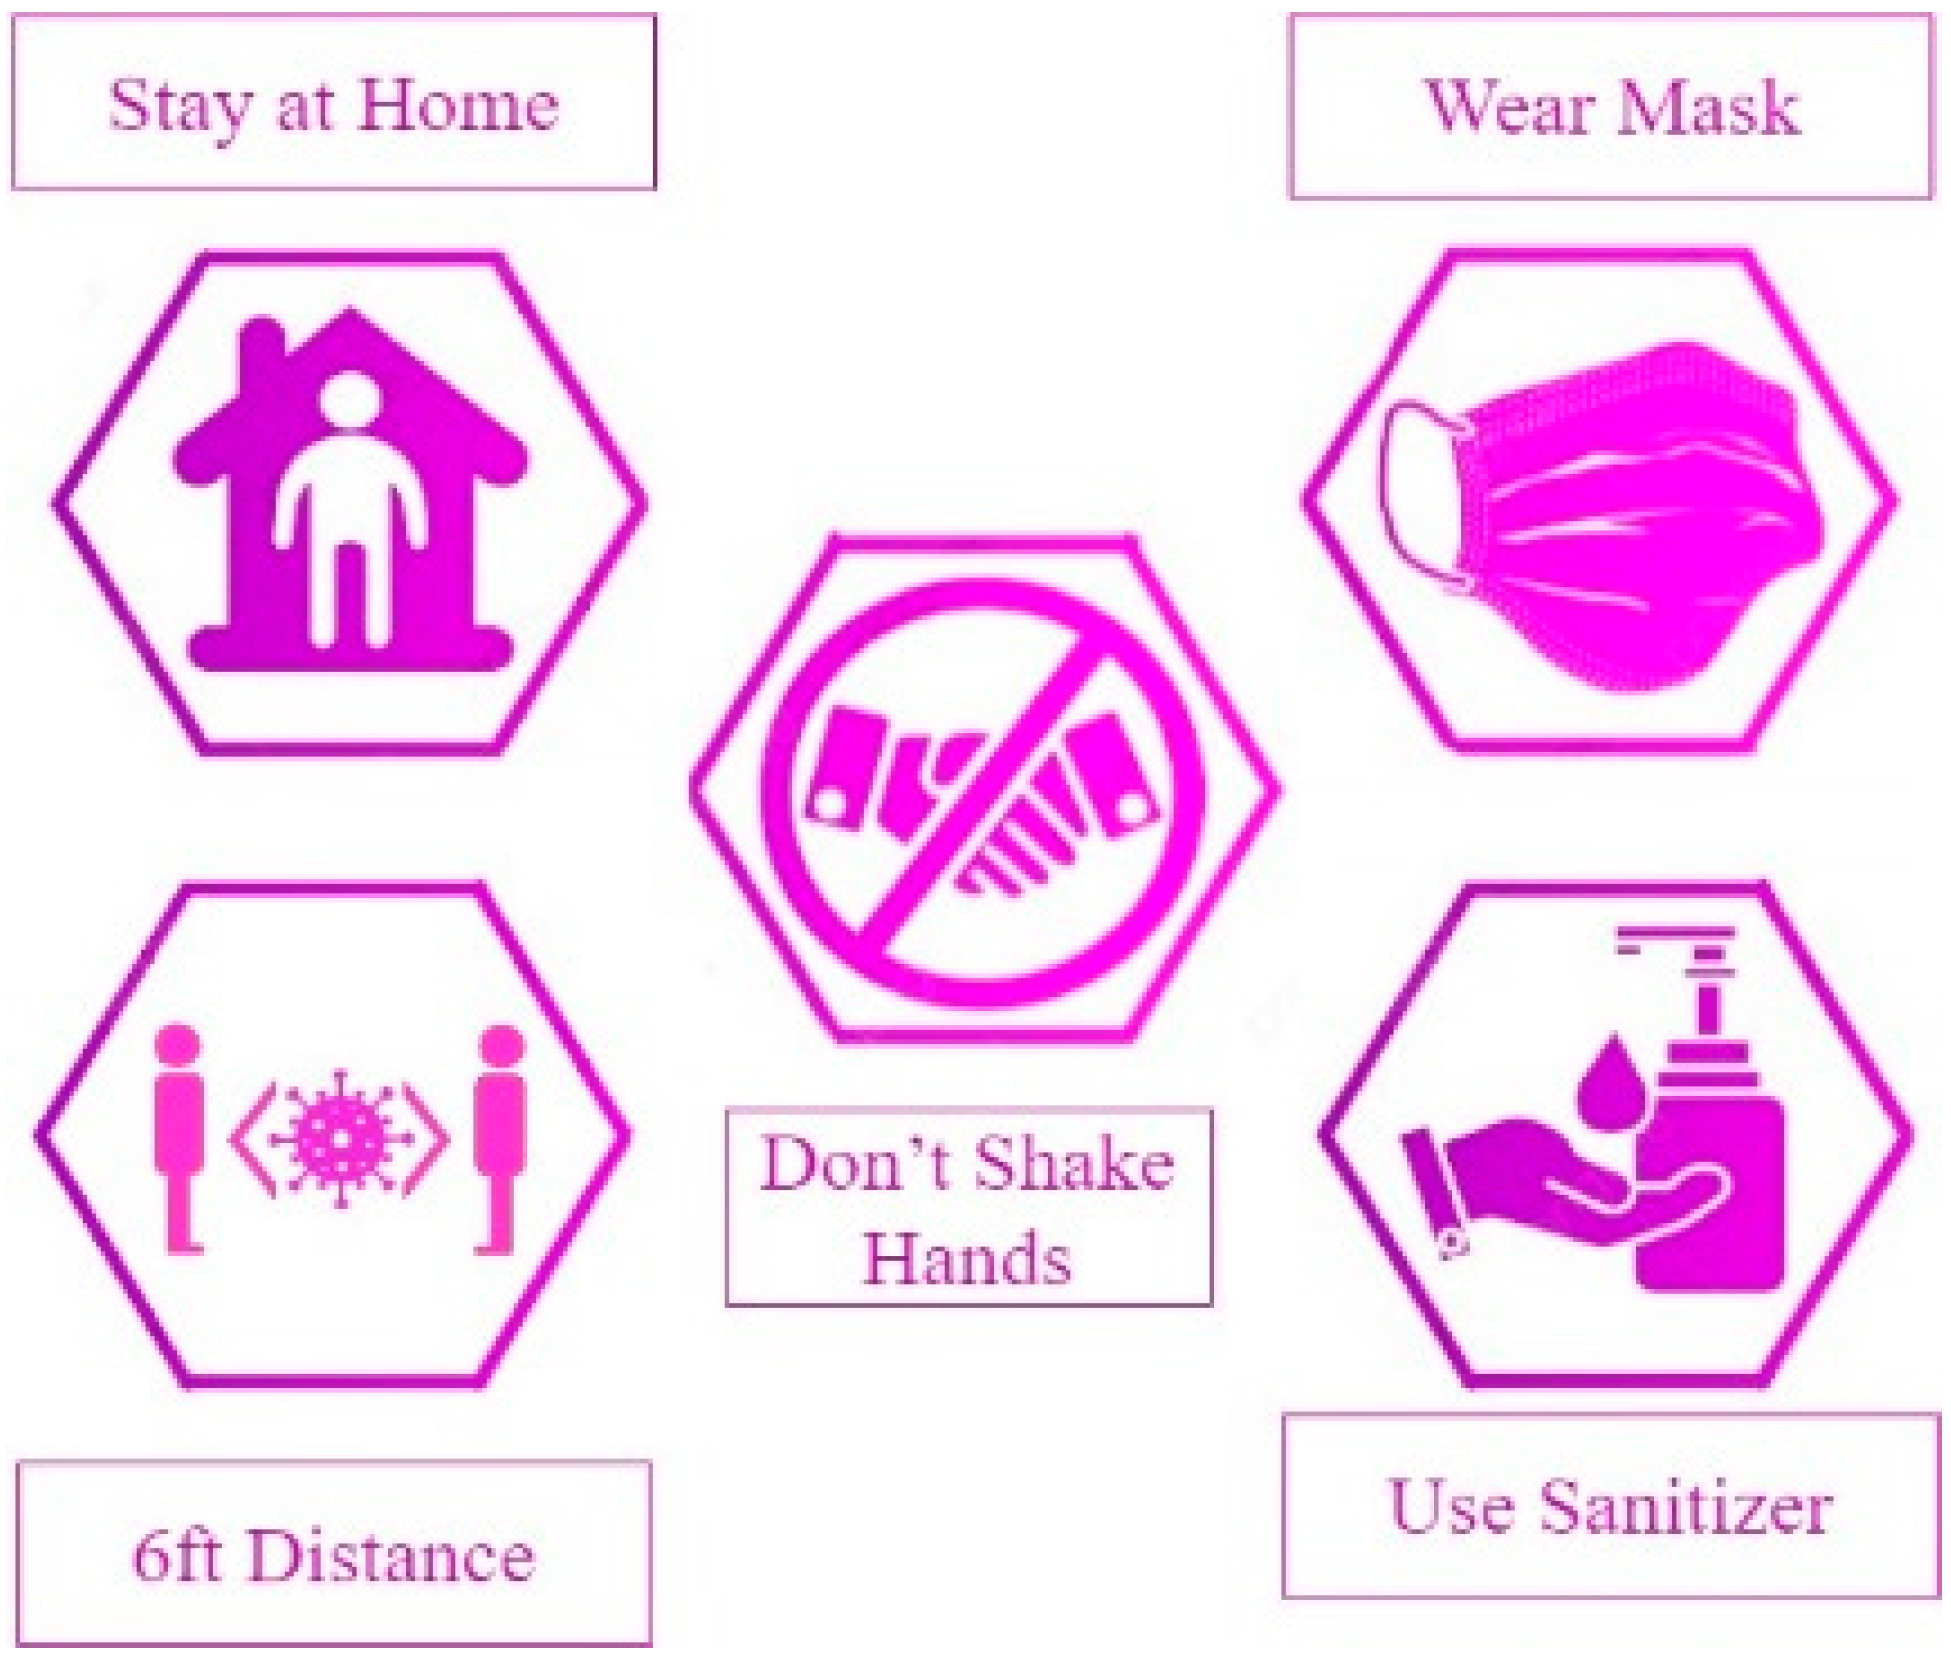
Henceforth, countries worldwide following the lockdown strategies and adopted work from home policies to control virus spread. WHO-recommended Standard Operating Procedures (SOPs) [
6] are illustrated in
Figure 1. Regardless of strict social distancing policies, within six months, the second wave of COVID-19 was observed globally, followed by the third and fourth waves due to easing the restrictions [
7]. The fourth pandemic wave is considered the deadliest wave as it grips the world with rising cases of the highly transmissible Delta variant.
Moreover, the even more challenging thing is that no clear symptoms were observed after the third and fourth waves. The earlier symptoms were fever, shortness of breath, dry cough, and a loss of smell and taste. After the subsequent waves, Diarrhea, fatigue, chest tightness, and sore throat were added to the list [
8]. However, most patients are asymptomatic, which is a severe threat to the world because they are hard to detect and capable of spreading infection without knowing.
The prevention of transmission is best achieved by detecting the suspected cases quickly, rapid testing, and self-quarantine. Quick detection and proper monitoring are essential for both healthcare professionals and other people to avoid disease contamination [
9]. In recent literature, IoT-enabled frameworks are suggested to detect and monitor COVID-19 cases with wearable sensors. These frameworks are useful for identifying and monitoring potential COVID-19 patients and keeping track of their health. However, such solutions seem impractical for detecting the suspects out of the masses as they are expensive in nature and require several resources. Therefore, there is a dire need to orchestrate a framework that needs less human intervention and a minimal number of associated sensors to detect the symptom of the disease. This research work aims to design a cheap, reliable, and effective IoT-based framework by utilizing minimal resources that the masses could use.
This paper is organized in sections as follows.
Section 2 provides the literature review of the state of the artwork.
Section 3 discusses the proposed real-time rule-based Fuzzy Logic classifier for COVID-19 Detection (FLCD).
Section 4 focuses on the implementation of FLCD and explains the experimental setup.
Section 5 focused on the result discussion. Finally, the conclusion is presented in
Section 6.
2. Literature Review
IoT technologies are showing promising performance in dealing with COVID-19 pandemic and lockdown situations. IoT-enabled smart wearable devices and mobile applications have been developed and used to tackle this challenging problem [
10,
11]. This technology helps in quick diagnosis, real-time patient monitoring, and controlling the spread of the disease. Moreover, these systems help track patients’ health conditions and ensure that all infected people are quarantined [
12]. In addition, they enable the healthcare staff to virtually monitor the patients and keep track of their health records. By using such systems, the patient can directly contact his physician or doctor for consultation without getting in-person contact with them.
COVID-19 symptoms have been monitored by wearable devices such as EasyBand [
13], IoT-Q-Band [
14], smart helmet [
10], smartwatch [
15], wearable non-invasive thermometer [
16], wrist-worn Heart Rate (HR) monitoring band [
17], or SpO
2 wearable measurement device [
18]. Giorgio Quer et al. [
19] explored how sensor data collected over time help in detecting COVID-19 by developing a smartphone application to collect data from smartwatches, activity trackers, self-reported symptoms, and individuals’ test results. A passive monitoring strategy is used to differentiate negative and positive symptomatic patients, enhancing the ability to detect the cluster prior to more spread.
Rajeesh Kumar et al. [
20] worked on detecting and monitoring asymptomatic COVID-19 patients using IoT-based sensors. A pulse oximeter sensor is utilized for monitoring the nonstop estimation of blood vessel hemoglobin oxygen immersion, a thermopile infrared sensor for monitoring the core body temperature, a blood pressure sensor for recognizing circulatory strain, and a heartbeat sensor for monitoring HR. Vu Ngoc Quy et al. [
21] proposed a piezoresistive sensor-based wearable watch-type device to monitor the HR. The watch is comfortably worn on the wrist, and it monitors the HR in real-time. Highly sensitive sensors are utilized in this device which is appropriate for bio force and bio pressure measurement.
A wrist-worn sensor device based on photoplethysmography (PPG) signals for the monitoring of HR, Heart Rate Variability(HRV), and SpO
2 was proposed by D. Jarchi et al. [
22]. The authors applied the plethysmography process with two wavelength channels to exhibit the results in a real-time monitoring device. Zheng et al. [
23] recommended the use of wearable devices that can be placed on the chest to estimate respiration rate. Likewise, the respiratory monitoring devices that can be placed on the skin were addressed by M. Chu et al. [
24]. Dai et al. [
25] discussed a polyelectrolyte humidity sensor, a specific type of humidity sensor that can be mounted to a facial mask that is commonly used during the outbreak of the COVID-19 disease. Charlton et al. [
26] suggested a method for respiratory rate estimation via Electrocardiogram (ECG) and PPG sensors to improve the precision of the estimation.
Digital technologies, AI, and IoT-based solutions are provided to assist government officials in ensuring social distancing practices. The state-of-the-art work varies from drone-based crowd monitoring [
27] to GPS-based patient localization [
28], and automated crowd observation [
29], IoT biometric architecture [
30], and they have been showing a promising role in observing and restricting people to maintain social distance.
IoT-enabled frameworks have employed wearable and non-wearable sensor nodes to collect real-time symptom data to quickly identify potential COVID-19 patients. For wearable sensor technology, researchers have proposed the usage of several sensors to collect symptom data. At the same time, other researchers have only used one or two sensors, focusing on only one or two symptoms while ignoring other vital symptoms essential to get a reliable result. These IoT-based models bear many shortcomings due to their limited functionalities. There are almost 15 COVID-19 symptoms that are considered for accurately diagnosing COVID-19. If a separate sensor is employed for every symptom, 15 sensors are required altogether, which is a costly and impractical solution. On the other hand, using only one or two sensors and ignoring all other vital signs for COVID-19 detection generates ineffective and unreliable results. To get a reliable and authentic verdict, it is important to consider more symptoms altogether.
Henceforth, all these solutions have effectively detected COVID-19 cases, have shown promising results and helped the healthcare staff combat COVID-19 so far. However, now that the world is dealing with the fourth wave, these models have become depleted. Amid the COVID-19 fourth wave, there are a high number of asymptomatic patients, which are difficult to detect, as most people do not show any symptoms until the situation worsens [
31]. In most of the state-of-the-art work conducted, pulse oximetry for SpO2 and HR monitoring and polyelectrolyte humidity sensor for RR monitoring are not utilized in combinations that are the basic sensors to detect asymptomatic patients [
18,
22]. If the readings from these sensors are assigned proper weights and then fused together, better detection and prevention can be achieved in terms of precision, accuracy, error rate, and recall. Therefore, it is essential to develop an IoT-based framework that can quickly and automatically detect both symptomatic and asymptomatic COVID-19 patients by employing especially humidity sensor and pulse oximetry all together for asymptomatic patients in combination with a thermistor and motion sensors for symptomatic patients. An effective IoT model that employs cheaper sensors to detect maximum vital symptoms and provides a cheaper solution that can be implemented on the masses is the need of the hour.
3. Rule-Based Fuzzy Logic Classifier for COVID-19 Detection (FLCD)
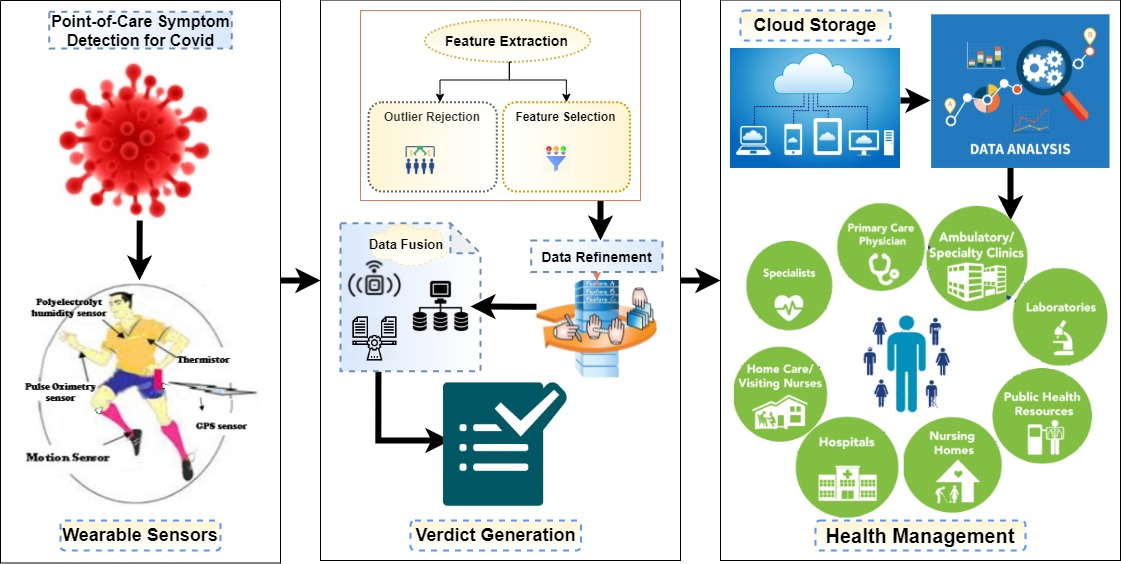
The overall design of FLCD is illustrated in
Figure 2. Due to the increased number of asymptomatic patients, their detection has become more important [
15]. The proposed model is focused on detecting asymptomatic patients. Here, we present the idea of how to detect the asymptomatic patient with the help of observing the vital signs using wearable sensors.
The respiratory rate is the topmost important parameter in detecting COVID-19 infection because the virus has a significant impact on the lungs. COVID-19 depicts an inflammation of the lower respiratory tract that involves continuous coughing, shortness of breath, and lung tissue disease. Hence, continuous and real-time monitoring of the respiratory system is essential for timely detection, tracking of the current situation, progression, and treatment response of infected patients. Any abnormality in the respiratory system can help predict the disease before the onset of the visible symptoms [
32]. The other two basic and vital signs to detect asymptomatic suspects are the level of oxygen saturation (SpO
2) and the HR. Monitoring of heart activity is vital to get insight into the onset of symptoms. Similarly, it can affect SpO
2 to a great extent. In COVID-19 infected patients, the SpO
2 is critical for controlling disease progression and severity.
3.1. Functionalities and Workflow of FLCD
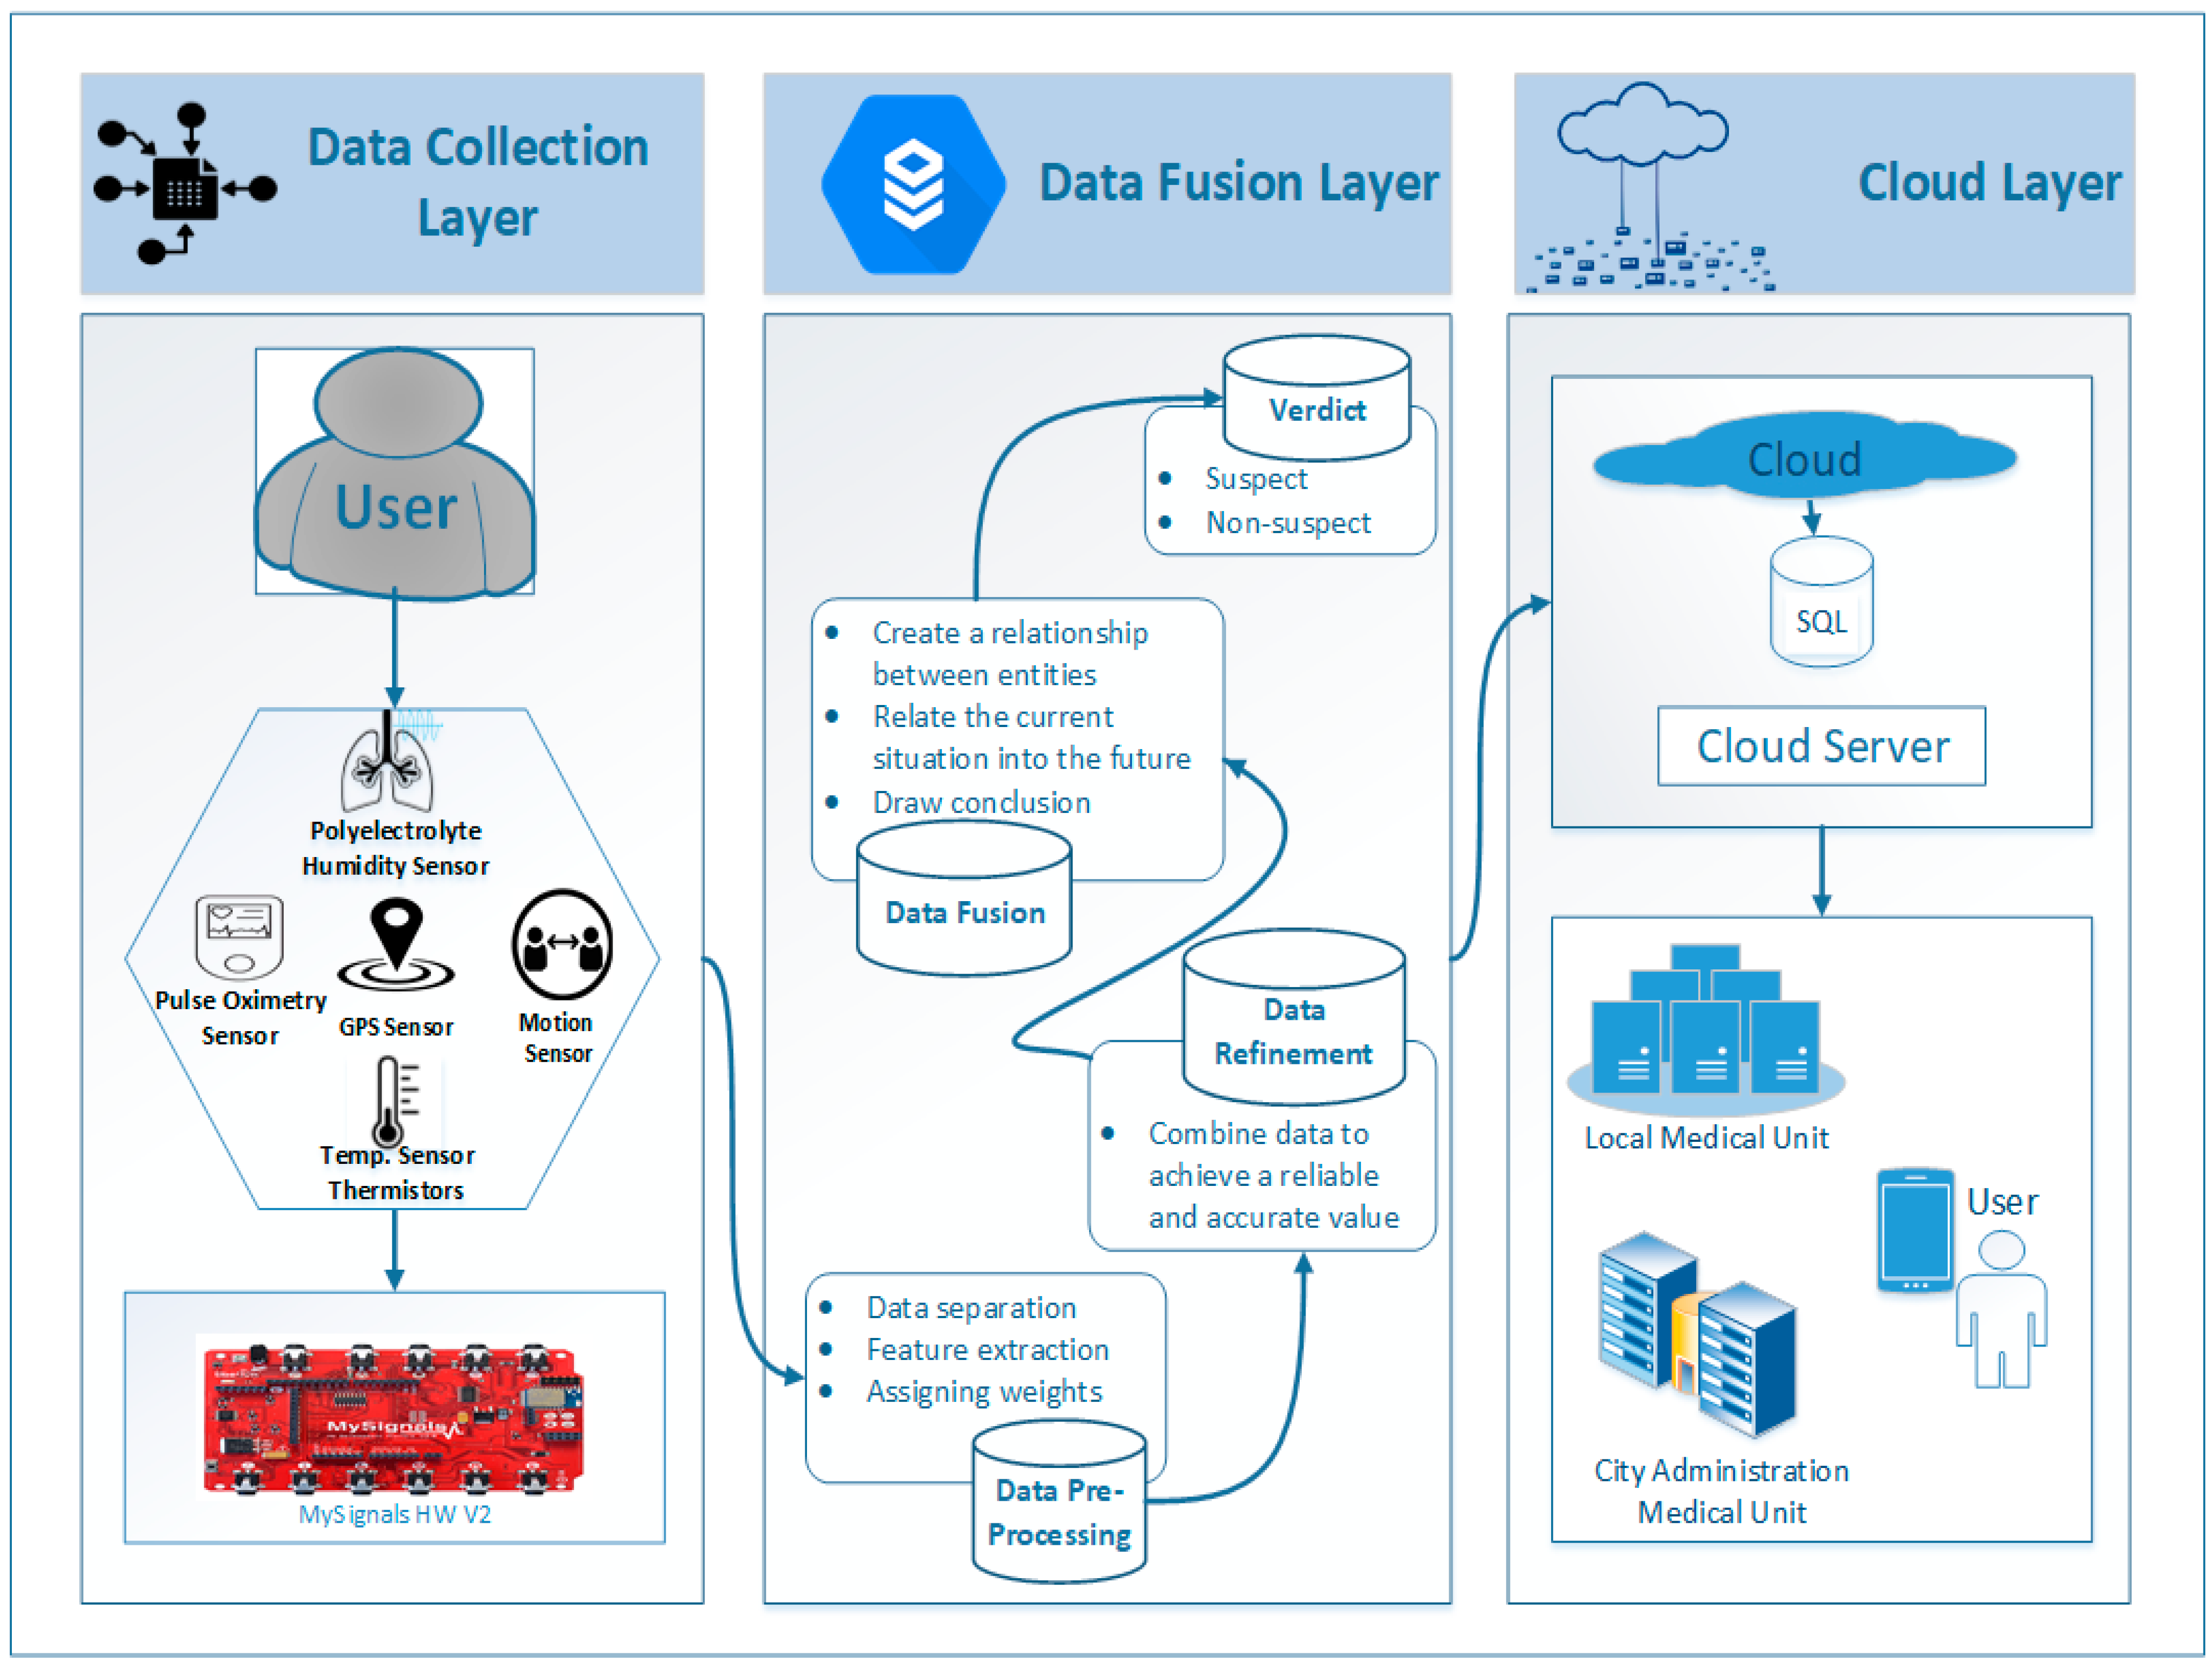
The proposed FLCD comprises three layers, i.e., data collection layer, data fusion layer, and cloud layer. In the data collection layer, raw data related to symptoms are first collected from sensors. Feature extraction and weight assignment to each sensor datum are done in the data pre-processing pipeline. The pre-processed dataset is then passed through the fusion algorithm that is used to normalize the data for in-memory or edge processing. After data analysis, a verdict is provided that explicitly tells whether a person is a COVID-19 mildly infected, seriously infected, or in a critical situation, or not infected by the virus at all. Data collected from sensors with generated verdicts are stored in the cloud database, accessible for users, local medical units (hospital/doctors), and city administration medical units. This data helps the user keep track of his symptoms and take precautionary measures to protect himself from virus contamination. It enables the doctor to decide what necessary actions need to be taken for the person. The city administration can predict the spread of the virus and keep track of the whole city’s population and make decisions about the lockdown.
3.1.1. Data Collection Layer
By employing a set of wearable sensors on the user’s body, this layer aims to collect real-time symptom data. To monitor the COVID-19 related symptoms, four wearable sensors are employed: a polyelectrolyte humidity sensor to monitor the respiratory rate [
33], a thermistor sensor to monitor the core body temperature [
16], a pulse oximetry to monitor the SpO
2 and the HR simultaneously [
34], a GPS sensor to track the person’s visited locations [
28], and a motion sensor to monitor the social distance [
35]. A motion sensor can detect a person coming in close contact with other people. The state-of-the-art work has focused on monitoring the social distance with CCTV cameras’ image processing [
36] or drone-based crowd surveillance [
27]. To the best of our knowledge, motion-based sensors capable of detecting humans are not yet used in any proposed social distance monitoring model. The motion sensor can detect the human presence within a specific limit. It emits ultrasonic sound waves that reflect off humans and other objects and bounces back to its original emission point. If the wave is disturbed by any object, the senor triggers and generates an alarm to indicate the presence of the person or moving object in the restricted area. Therefore, a motion sensor can play a vital role to monitor a person whether he came in close contact with another person or whether he has violated the social distancing policy and help make a reliable decision.
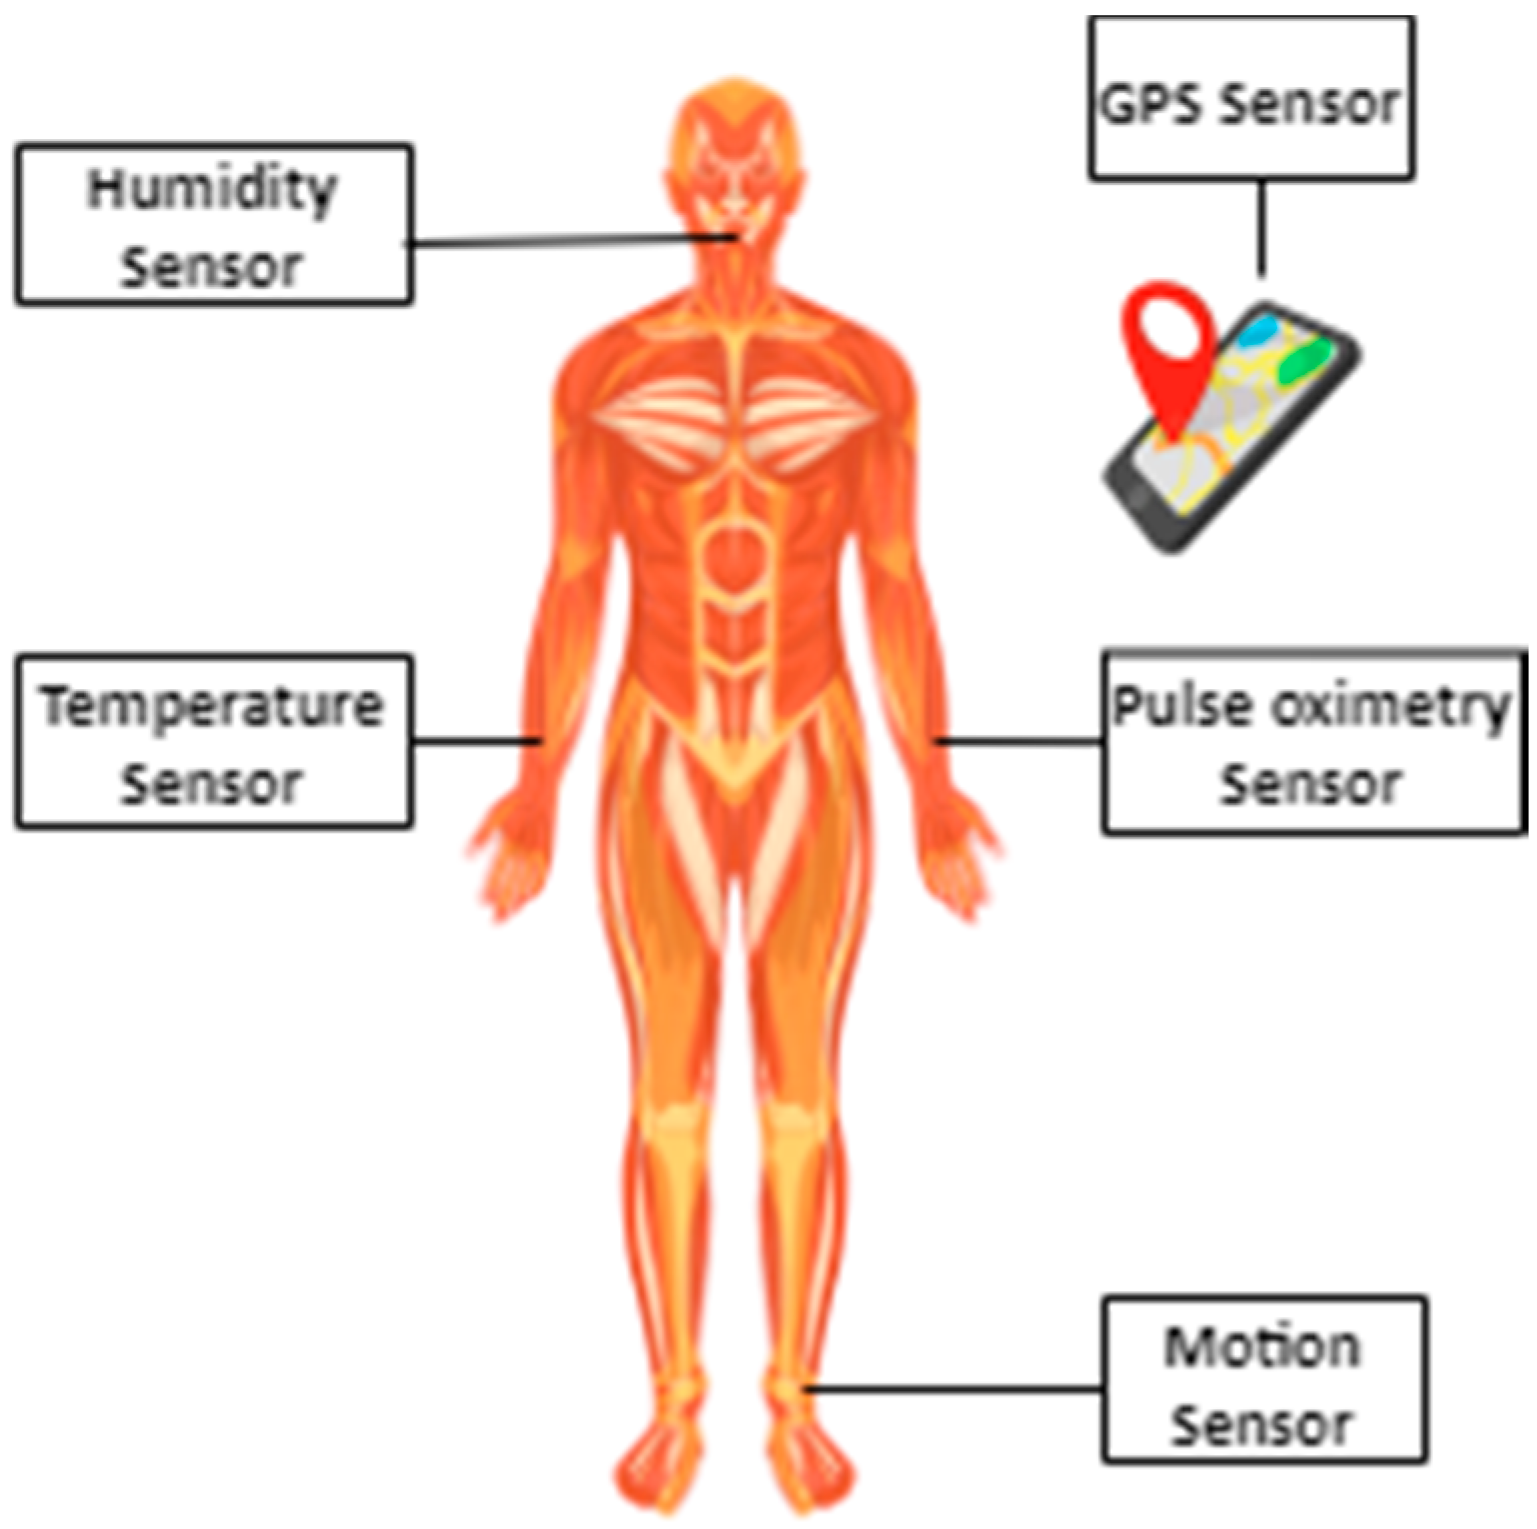
To measure the vital symptoms of a person wearing sensors, MySignals HW V2 is used [
37]. MySignals is a development platform for medical devices and E-Health applications. It supports various biomedical sensors to monitor biomedical parameters, i.e., respiratory rate, heart rate, blood pressure, body temperature, and ECG signal. To handle different sensors, it relies on the Atmega 328 (Arduino UNO) microcontroller and enables smart devices to communicate with it through the BLE module and built-in Wi-Fi. An illustration of sensors attached to the body is presented in
Figure 3. A temperature sensor, pulse oximetry, motion sensor, and humidity sensor are wearable sensors attached to the body, while the GPS sensor is available in the mobile phone. However, the cheapest solution is to utilize the sensor available in the mobile phone. Wearable sensors may create a feasibility issue; however, all these sensors are available in a modern smartphone. The user can easily check the temperature, heart rate, oxygen saturation, and respiratory rate with mobile phone sensors and motion sensor can monitor the social distancing, while GPS sensor available in the phone is used in both cases.
3.1.2. Data Fusion Layer
The fusion layer consists of four phases, i.e., data pre-processing, data refinement, data fusion, and verdict generation. In the data pre-processing phase, features are extracted, i.e., Location, Time, Temperature, Heart Rate, Respiratory Rate, SpO
2, and Social Distance. The extracted features are separated from irrelevant data and assigned weights. In the data fusion phase, the weighted features are passed through the rule-based fuzzy logic classifier to normalize the data so that a verdict can be made. Edge processing is used because the proposed framework works on real-time data that requires minimal convergence time and minimal computational resources [
38]. After fusing the data, it is compared with a threshold value, and if the fused value is beyond the threshold value, a mild, serious, or critical verdict is produced that indicates a particular user is a suspect of COVID-19. If the fused value is under the threshold value, a normal verdict is produced, which suggests that a person is not a suspect of COVID-19.
3.1.3. Cloud Layer
Table 2 is created in the cloud database to store the data for one user. The ‘UserID’ is the ID of a particular user; ‘time’ represents the time at which the reading is taken; ‘loc’ is the current location; ‘temp’ represents the value of body temperature; ‘spo2’ is the value of SpO
2; ‘hrt’ represents the value of heart rate; ‘rr’ represents the value of respiratory rate; ‘socd’ represents the value of social distancing measured at time ‘time’; ‘vv’ is the verdict value; lastly, ‘fv’ is the final verdict.
3.2. Analytical Modeling
The analytical model is based on statistical computation and analysis. The wearable sensors sense the user’s vital signs continuously for 15 min and are recorded in
Table 2. The normal to critical range for body temperature is between 95.5 to 106 °F [
39]. The statistical mode of the continuously measured temperature values is computed. The mode is computed because it represents the most repeated value as core body temperature does not change repeatedly and remains the same at a constant pace [
40]. The range for SpO
2 is 95 to 100% blood oxygen saturation level [
39]. The average of SpO
2 values is computed because it can change continuously due to several reasons, i.e., running, speed walking, low oxygen in the environment, etc.; therefore, the correct value can only be known by taking the average.
Similarly, the range of heartbeat is 60 to 100 beats per minute [
39]. Like SpO
2, the heart rate may vary due to several reasons; hence, calculating the average can give the correct value. The range of respiratory rate is 12 to 16 breaths per minute [
39]. The median respiration value is taken so that the middle value can be chosen. The normal range for social distancing specified by WHO is 6 ft or 1.8 m [
41]. The ‘AND’ function is applied to the values, and all the computed values are stored in
Table 3. After computing the values for each sensor data, a weight is assigned to them, and the weighted values are provided to the Rule-Based Fuzzy Logic (RBFL) classifier to generate a possible verdict.
4. FLCD System Implementation and Experimental Setup
The proposed FLCD system is based on a real-time symptom data collection and processing mechanism, which needs to collect the COVID-19 symptom data in real-time from wearable sensors and pass it on to our model. However, for experimentation and testing purposes, a dataset as an input in the form of symptom data (temperature, respiratory rate, heart rate, Spo2, social distancing) of both positive and negative cases of COVID-19 is used. Once the model is trained on the dataset, then it will be able to receive new cases for classification. The model decides whether a person is infected with COVID-19 or not by providing a tentative verdict.
4.1. Dataset Description
A synthetic dataset of 5000 entries is generated for the selected five symptoms: temperature, heart rate, respiratory rate, SpO
2, and social distancing to produce the outcomes introduced in this paper. A limited number of COVID-19 symptom datasets are available, which is why a minimum amount of work has been done on symptoms analysis. Moreover, COVID-19 symptoms are changing over time; each wave adds new symptoms to the list [
8]. However, the major and common symptoms for detecting both symptomatic and asymptomatic patients remain the same. Therefore, a dataset of 5000 entries of confirmed COVID-19 positive and negative cases is produced using the normal and critical ranges defined by WHO for each selected symptom. Because of the little number of accessible datasets, cross-validation is utilized to validate the classification model. The process of generating the dataset is given in Algorithm 1. WHO has defined the normal as well as critical range for each COVID-19 symptom. The symptom value range for each selected feature is distributed in four categories: normal, mild, serious, and critical, and assigned the values provided by WHO [
39]. To generate the dataset values, each selected feature has assigned the normal to critical values, respectively, and a random number is generated against each category. Moreover, the threshold value is assigned to each category: normal, mild, serious, and critical, so the verdict value is generated accordingly.
| Algorithm 1. Dataset generation. |
![Energies 14 07023 i001]() |
4.2. Experimental Setup
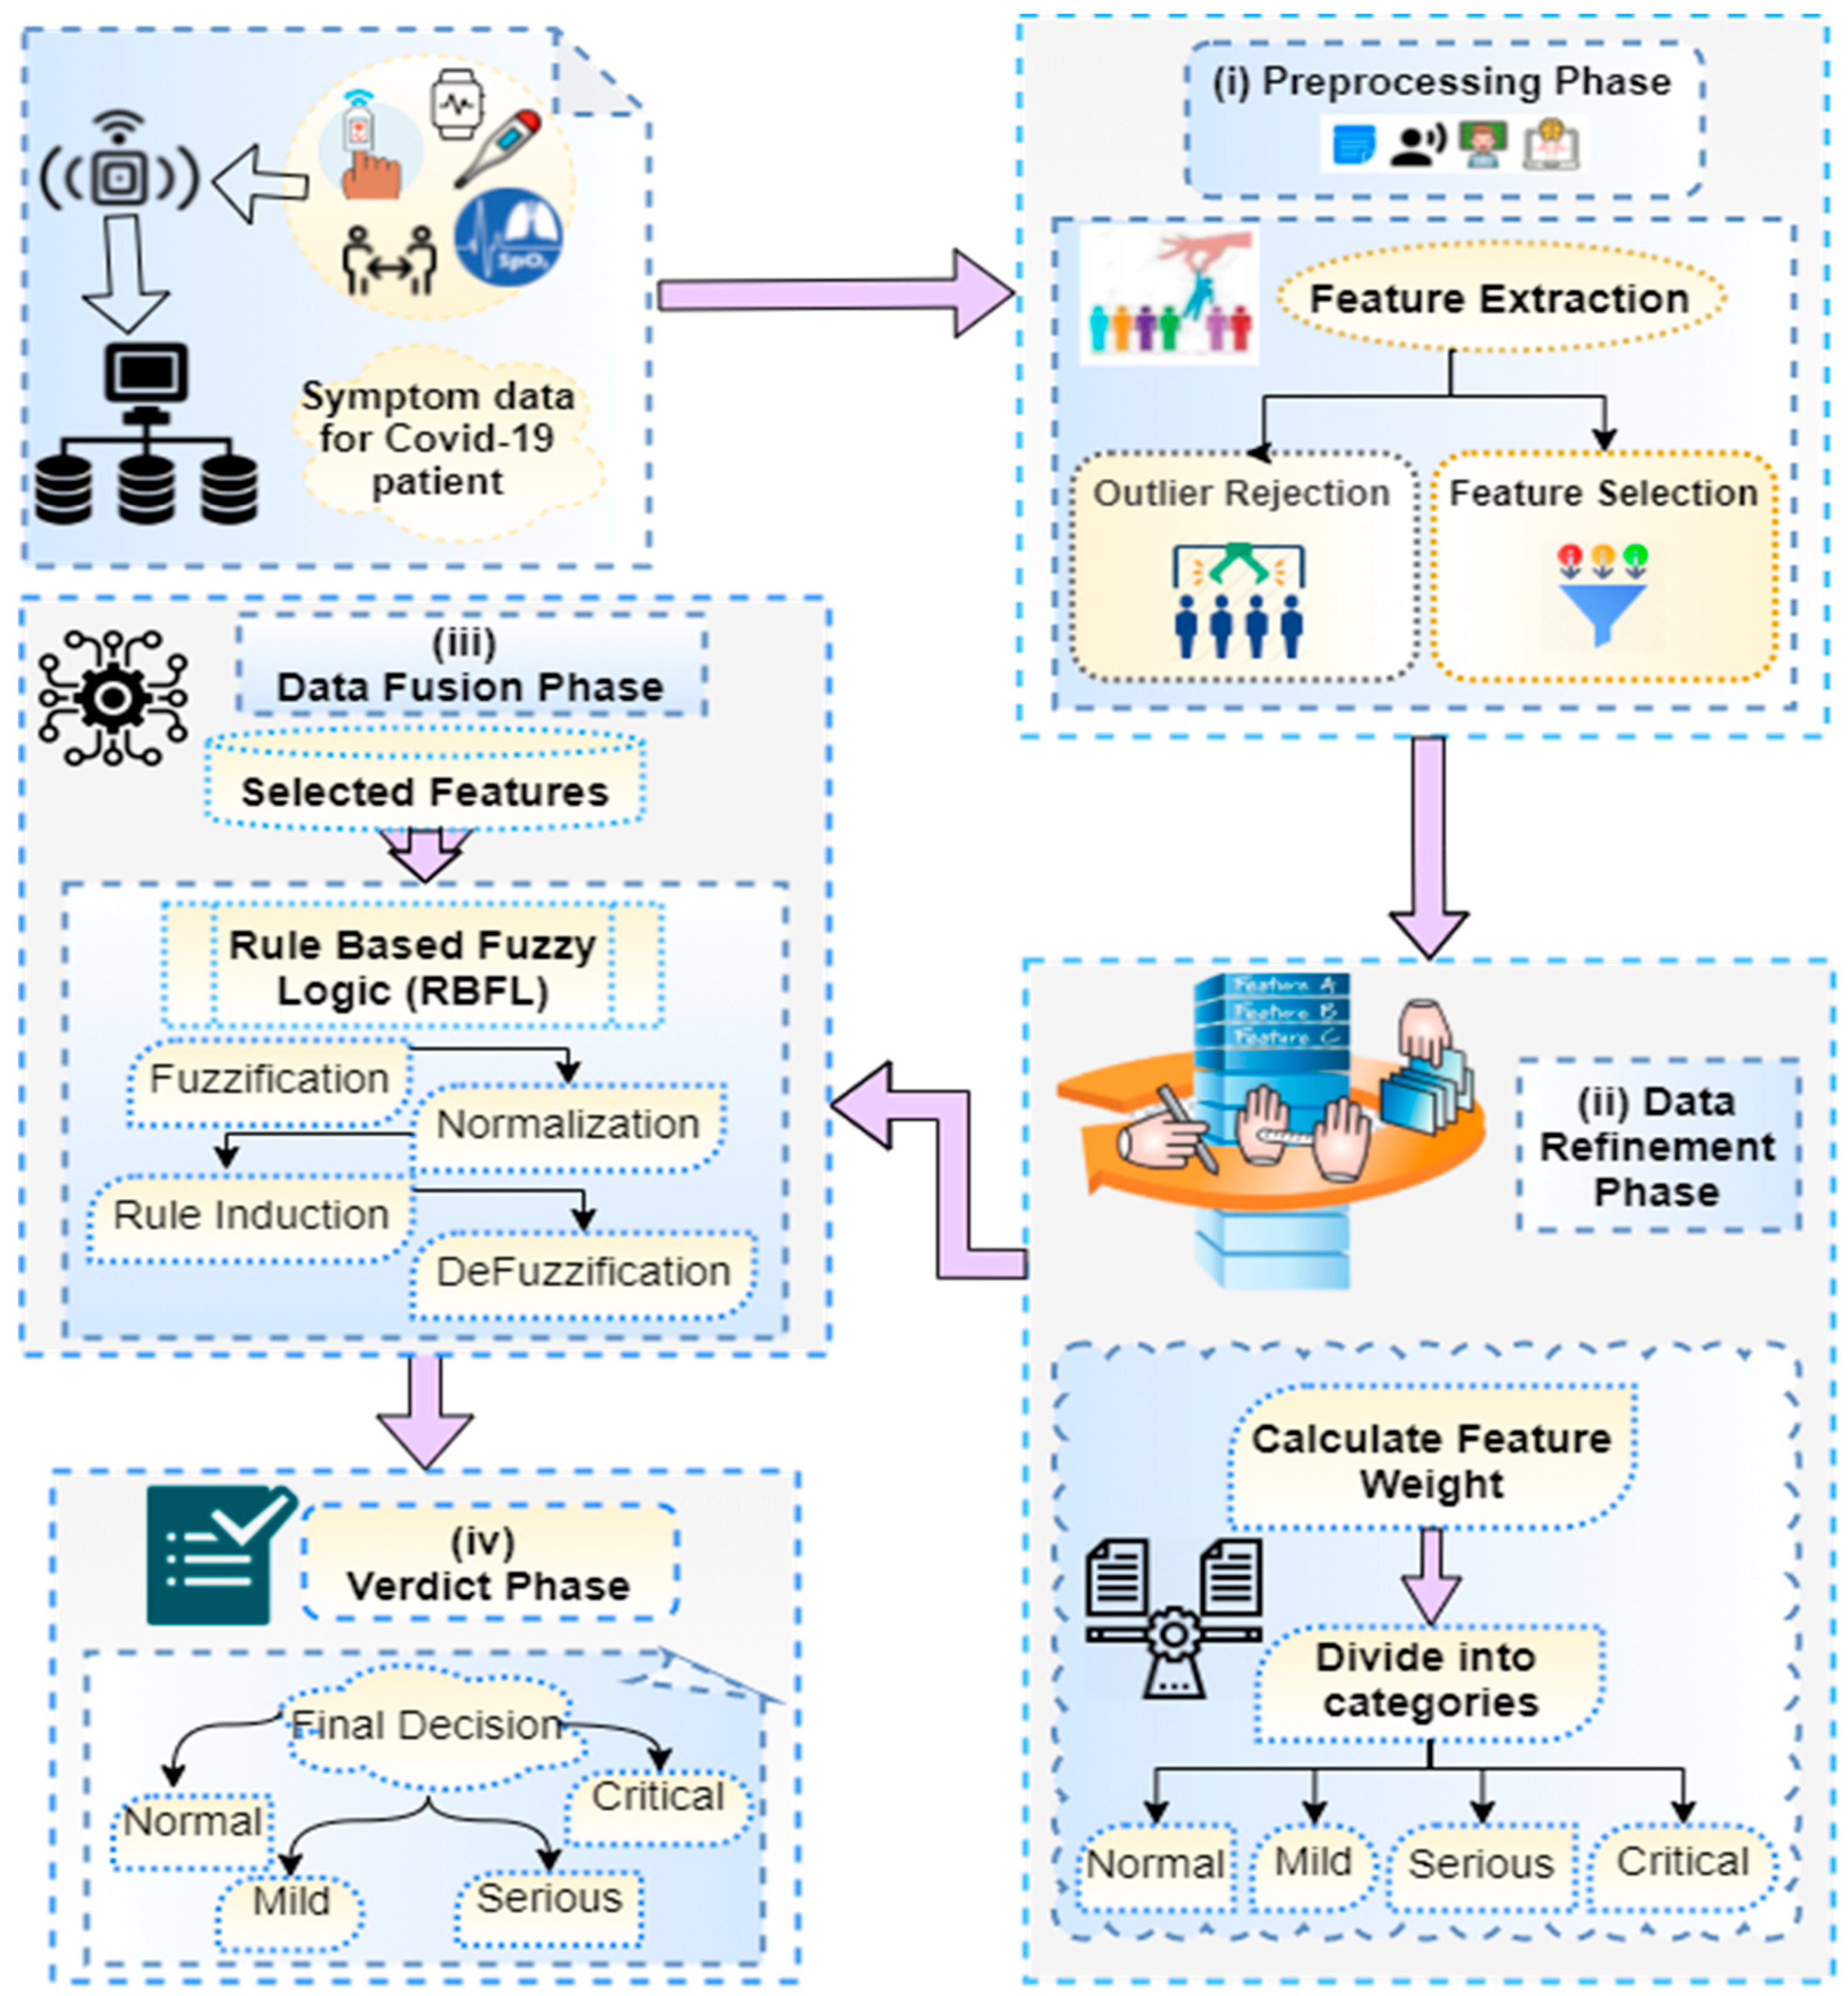
The illustration in
Figure 4 demonstrates the four sequential phases of the framework’s data fusion layer in detail, which are (i) the pre-processing phase, (ii) the data refinement phase, (iii) the data fusion phase, and (iv) the verdict phase. The following subsection depicts each phase in detail.
4.2.1. Pre-Processing Phase
The purpose of the pre-processing phase is to extract the COVID-19 suspect’s data by utilizing data mining techniques [
42]. Data mining techniques are used to provide a meaningful pattern within the data. To accomplish this task, two steps are performed: (i) outlier rejection and (ii) feature selection. Initially, symptom features are filtered out from the input dataset. While the feature selection procedure may improve the accuracy of a healthcare system, the training dataset may include many unusual details, which may limit the effectiveness of the classification method. As a result, the outlier rejection process is important for the classifier to learn accurately and produce reliable outcomes. Outlier rejection methods are generally classified into two groups: spatial outlier and classic outlier approach [
43,
44]. In this paper, a Genetic Algorithm technique has been used to perform outlier rejection [
44].
Moreover, it is essential to choose the most effective feature to detect COVID-19 in real-time. Therefore, the basics of the pre-processing phase is the feature filtering module. Feature selection is the procedure of choosing only specific features that contribute the most to diagnosing the problem and rejecting those which have little contribution. It does not just reduce the classification time but also keeps the size of the prediction model small. The irrelevant features can reduce the accuracy of the model and make it learn based on irrelevant features, so it is better to ignore them [
43,
44]. The feature selection phases reduce the number of input variables, which results in reducing the model complexity, minimizing the computational cost, and improving the model performance.
For feature selection, two methods are generally used: wrapper and filter [
45]. The wrapper function evaluates the features based on the classification performance of a classifier. This method provides accurate and reliable results; however, it is expensive. On the other hand, feature selection works independently of the machine learning mechanism. It selects the features based on many statistical test results correlating with the outcome variables. However, they are less accurate compared to wrapper functions but faster to compute. Since accuracy and reliability are essential in medical diagnostic systems, the employed feature selection module in the pre-processing phase relies on the wrapper functions to calculate the weights [
46]. The relatively long computation time in the wrapper function for calculating the weights has no impact on the model’s efficiency, as it occurs only once. The K-Nearest Neighbor (KNN) classifier is used to implement the feature selection and weight calculation module. The symptom feature weight can be classified by Equation (1).
where
w(
xi) is the weight of the feature
xi, n is total number of symptoms,
f(+
xi) indicates the accuracy of the model when feature
xi is included alongside all other features, and
f(−
xi) indicates the accuracy of the model when feature
xi is excluded.
Table 4 illustrates the impact of a feature
f(
xi) on the model’s accuracy and its corresponding weight. If including
f(
xi) improves the model’s accuracy, it should be included, and if including
f(
xi) decreases the model’s accuracy, it should be excluded. The weight of a feature
w(
xi) is calculated using Equation (1), corresponding to feature
f(
xi). For illustration, if mistakenly a user ID is included as an input feature, the model is falsely trained by concluding that COVID-19 is diagnosed by the user ID, which ultimately reduces the model’s accuracy. After going through the pre-processing phase, five features are added, which are Temperature, SpO
2, Heart Rate, Respiratory Rate, and Social Distancing.
4.2.2. Data Refinement Phase
The selected features in the pre-processing phase are then refined. The data refinement is based on two factors: (i) the total feature weight and (ii) the feature’s amount of convergence to other features. The selected features and their corresponding weights are distributed in each category. As presented in
Table 5, the feature weight is divided into four categories: normal, mild, serious, and critical. For dividing the total weight into four categories, a mathematical function is performed, as illustrated in Algorithm 2.
| Algorithm 2. The mathematical process of weight distribution among each category. |
![Energies 14 07023 i002]() |
The total weights are divided into each category according to the seriousness of the disease. The weights assigned to the final verdict value are computed by simply taking the sum of a specific category, for instance, the sum of the critical category is 3 + 6 + 0.5 + 5 + 1 = 15.5, and the sum of the serious category is 2 + 4 + 0.3 + 3 + 1 = 10.3, so the minimum threshold for the critical category is 10.3 and the maximum threshold is 15.5.
Table 6 shows the range of verdict value for each category in which the sum of the weights of all symptoms lies.
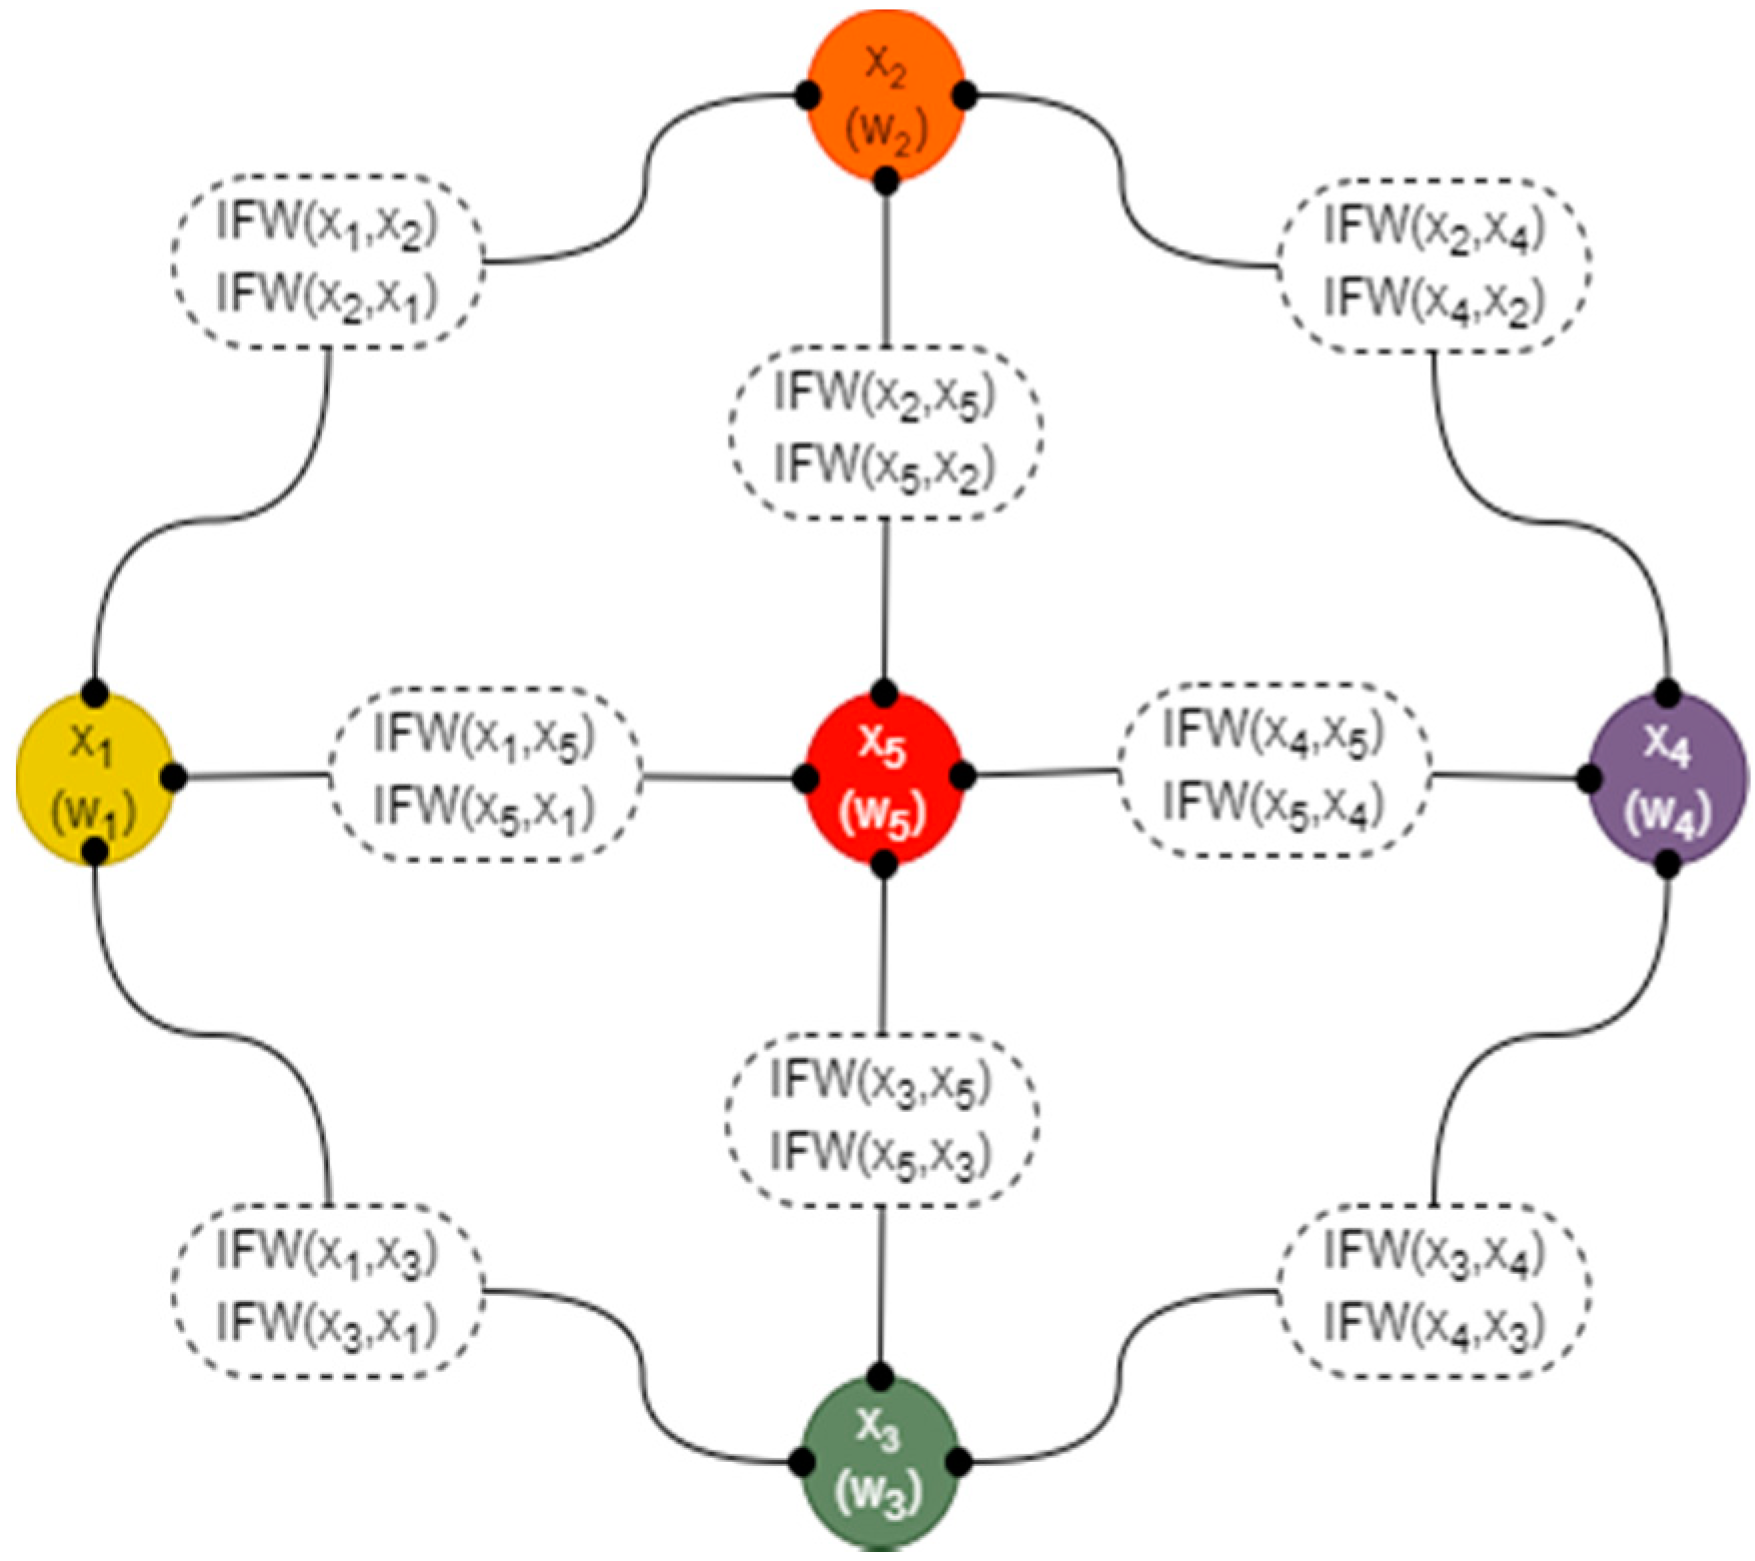
Feature ranking is accomplished by using the Feature Connectivity Graph (FCG) [
47]. An undirected partially connected FCG graph can be used to show the feature weights and the strength of the connection between each feature and its friends. Just like all other graphs, FCG graphs are also represented as FCG = (V, E), where V represents the nodes, and E represents edges.
Figure 5 presents the FCG by considering the feature set X = (x
1, x
2, x
3, x
4, x
5) and weights set W = (w
1, w
2, w
3, w
4, w
5). The relationship between nodes is the weight matrix represented by the Inter Feature Weight (IFW).
IFW (xi, xj), where x represents the features, i and j represent the edge between two features, and IFW (xi, xj) is the weight between xi and xj. Calculating IFW guarantees the minimum classification time and maximum classification accuracy, and it will not have any effect on the overall computation time as it is computed only once in the pre-processing phase.
4.2.3. Data Fusion Phase
The data fusion phase employs the RBFL to get a reliable and accurate verdict. In the classification process, it is a good idea to gather input from a variety of sources, as this not only cuts down on training time but also improves the classification model’s performance. Fuzzy logic is a mathematical technique of reasoning that resembles human reasoning [
48]. The fuzzy methods are immensely used in medical applications and disease diagnosis, and they have shown effective performance in handling ambiguous and imprecise information prevalent in medical diagnosis [
47]. The fuzzy logic reasoning process is often simple and robust, which results in saving computer power. It also has a shorter developmental time than conventional methods, especially for online diagnose applications. It is an easy-to-implement, flexible, and convenient method for uncertain or approximate reasoning [
48].
Medical experts’ employee fuzzy logic for making diagnostic decisions depending on perception, capability, knowledge, experience, and familiarity of the medical scientist. Amidst COVID-19, following a certain diagnostic technique without any error is not easy. For that matter, fuzzy logic provides a powerful way of thinking to deal with imprecision and uncertainty [
49]. The uncertainty interval not only gives a confidential description of the detection findings, but it also gives double the detection process control limits, resulting in less false positive and false negative and a more successful technique for diagnosing COVID-19 patients. A fuzzy models-based medical diagnosis system is built on a foundation of information, observation, and experience from medical specialists. [
50]. Such algorithms are perfect for predicting and monitoring COVID-19, as contagious diseases produce uncertain data that is hard to analyze and make a final estimation. The rule-based fuzzy logic is implemented through four steps: (i) fuzzification, (ii) normalization, (iii) rule induction, and (iv) defuzzification. Each step is discussed in detail in the following subsections.
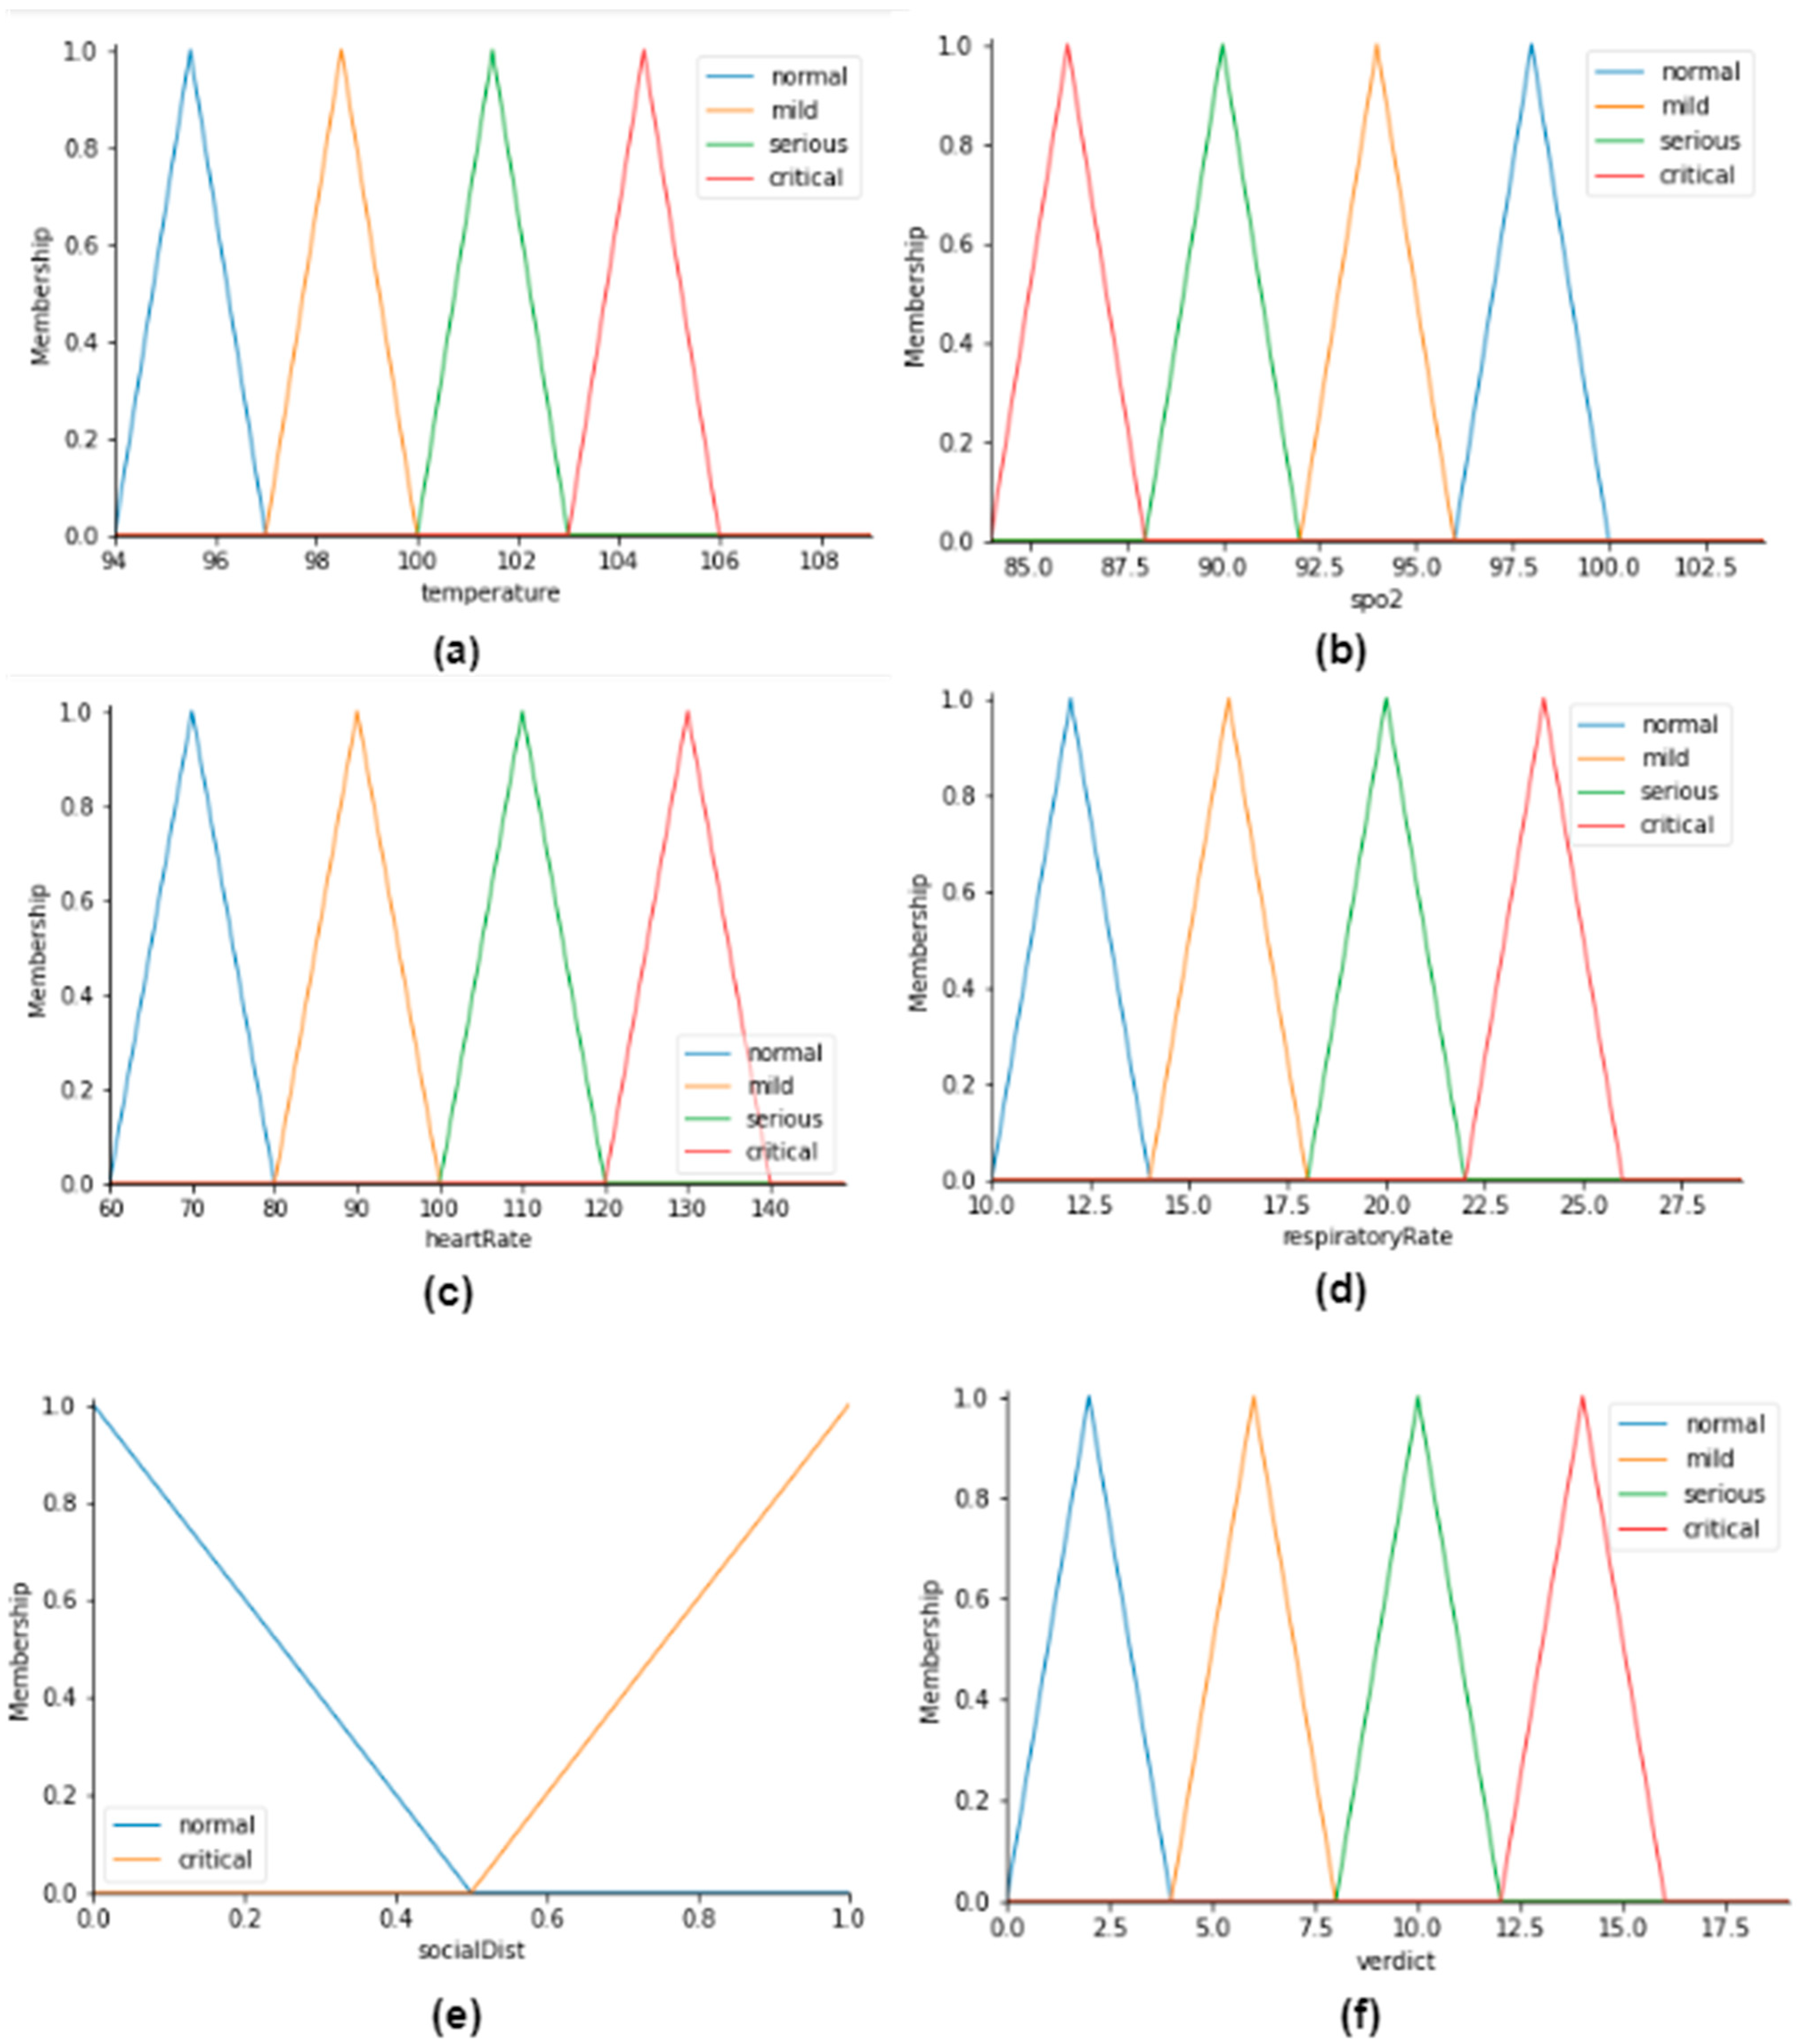
Fuzzification
Fuzzification is the process of decomposing a set of inputs into multiple fuzzy sets. It is a step that uses the membership function to decide the degree to which input data belong to the corresponding fuzzy set [
49]. During the fuzzification phase, the employed fuzzy set input values to be tested are transformed into membership grades termed as ‘normal’, ‘mild’, ‘serious’, and ‘critical’. A membership function is employed for each fuzzy set that returns a value between 0.0 and 1.0.
Figure 6 demonstrates the membership functions for the selected five fuzzy sets and one verdict set.
To deal with uncertainty, two types of fuzzy inference systems are used: Type-1 Fuzzy Logic System (T1 FLSs) and Type-2 Fuzzy Logic System (T2 FLSs). T1 FLSs deals with linguistic uncertainty caused by vague and ambiguous meanings of words. Although T1 FLSs are reliable, there are dynamic uncertainties, such as the uncertainty about the measurements used to activate the model and about the training data required to adjust the fuzzy system, which can cause a deteriorated performance. Due to the deterioration, T1 FLSs employ specific T1 fuzzy membership functions. Furthermore, after the design process is finished, the specifications of these membership functions are fixed. On the contrary, T2 FLSs can be used in a variety of engineering fields, where these models are employed to deal with dynamic uncertainties. When faced with dynamic uncertainties, T2 FLSs outperform T1 FLSs. The main difference between T1 and T2 fuzzy systems depends on the membership degree model of independent fuzzy sets. These membership degrees are fuzzy sets themselves; hence, T2 FLSs are employed in our model to deal with the dynamic uncertainties effectively.
Normalization
The output received from fuzzification phases is multiplied with the feature weight calculated in the pre-processing phases. For illustration,
w(
x) is multiplied by
φ(
x), which provides ranked membership values and is represented by
μ(
x), where
w(
x) represents the set of feature weights, and
φ(
x) represents the set of fuzzified crisp values. Hence,
μ(
x) =
w(
x) ×
φ(
x). The ranked membership value for every fuzzy set is normalized to get the value between 0.0 and 1.0.
represents the normalized membership value for each member in fuzzy set
μ(
x) and is calculated by Equation (2).
where
μ(
x) is the ranked membership value for the fuzzy input set X,
μ(ω) is the ranked membership value for the fuzzy set ω, and
is the normalized membership value for a fuzzy set X.
Rule Induction
The output generated in the normalization phases becomes the input for the rule induction phase. The general format for fuzzy rules is in the form: if
(A is X) AND (B is Y),
THEN (C is Z). Therefore, the considered form of the fuzzy rule for the selected five features is as follow:
where
A,
B,
C,
D, and
E represent the input variables, i.e., temp, rr, socd, hrt, and SpO
2. Additionally,
U,
V,
W,
X, and
Y represent the corresponding linguistic terms, i.e., normal, mild, serious, and critical, and Z represents the rule output against F, which is COVID-19.
Table 7 presents the 10 rules out of 512 rules that have been computed against the fuzzy set X, in which ‘n’ refers to ‘normal’, ‘m’ refers to ‘mild’, ‘s’ refers to ‘serious’, and ‘c’ refers to ‘critical’. The total number of rules that need to be generated is decided on the basic number of inputs against each symptom. For illustration, four inputs are available for temperature, which means 4
1 that is 4, so the resultant rules for individual temperature would be 4. That total number of rules are computed by the formula: The total number of rules =
, where n is the number of inputs, and m is the number of symptoms. Four inputs are available for the four symptoms, temp, hrt, rr, and spo2, and two inputs are available for socd. Therefore, 4
4 × 2
1 = 512.
For illustration, the first rule in
Table 7 indicates
Similarly, the last rule in the fuzzy set indicates
The step-by-step process to automatically generate the 512 rules is demonstrated in Algorithm 3. The fuzzy rule induction phase follows the four different techniques, namely: sum-dot, drastic product, max-product, and min-max. This paper employees the min-max technique, which uses a min operator for the conjunction in the rule premises and for the implication function [
49]. Conversely, the max operator is used for aggregation. The min-max composition of the inference rule is defined by Equation (3), which yields Equation (4).
| Algorithm 3. Rule Automation. |
![Energies 14 07023 i003]() |
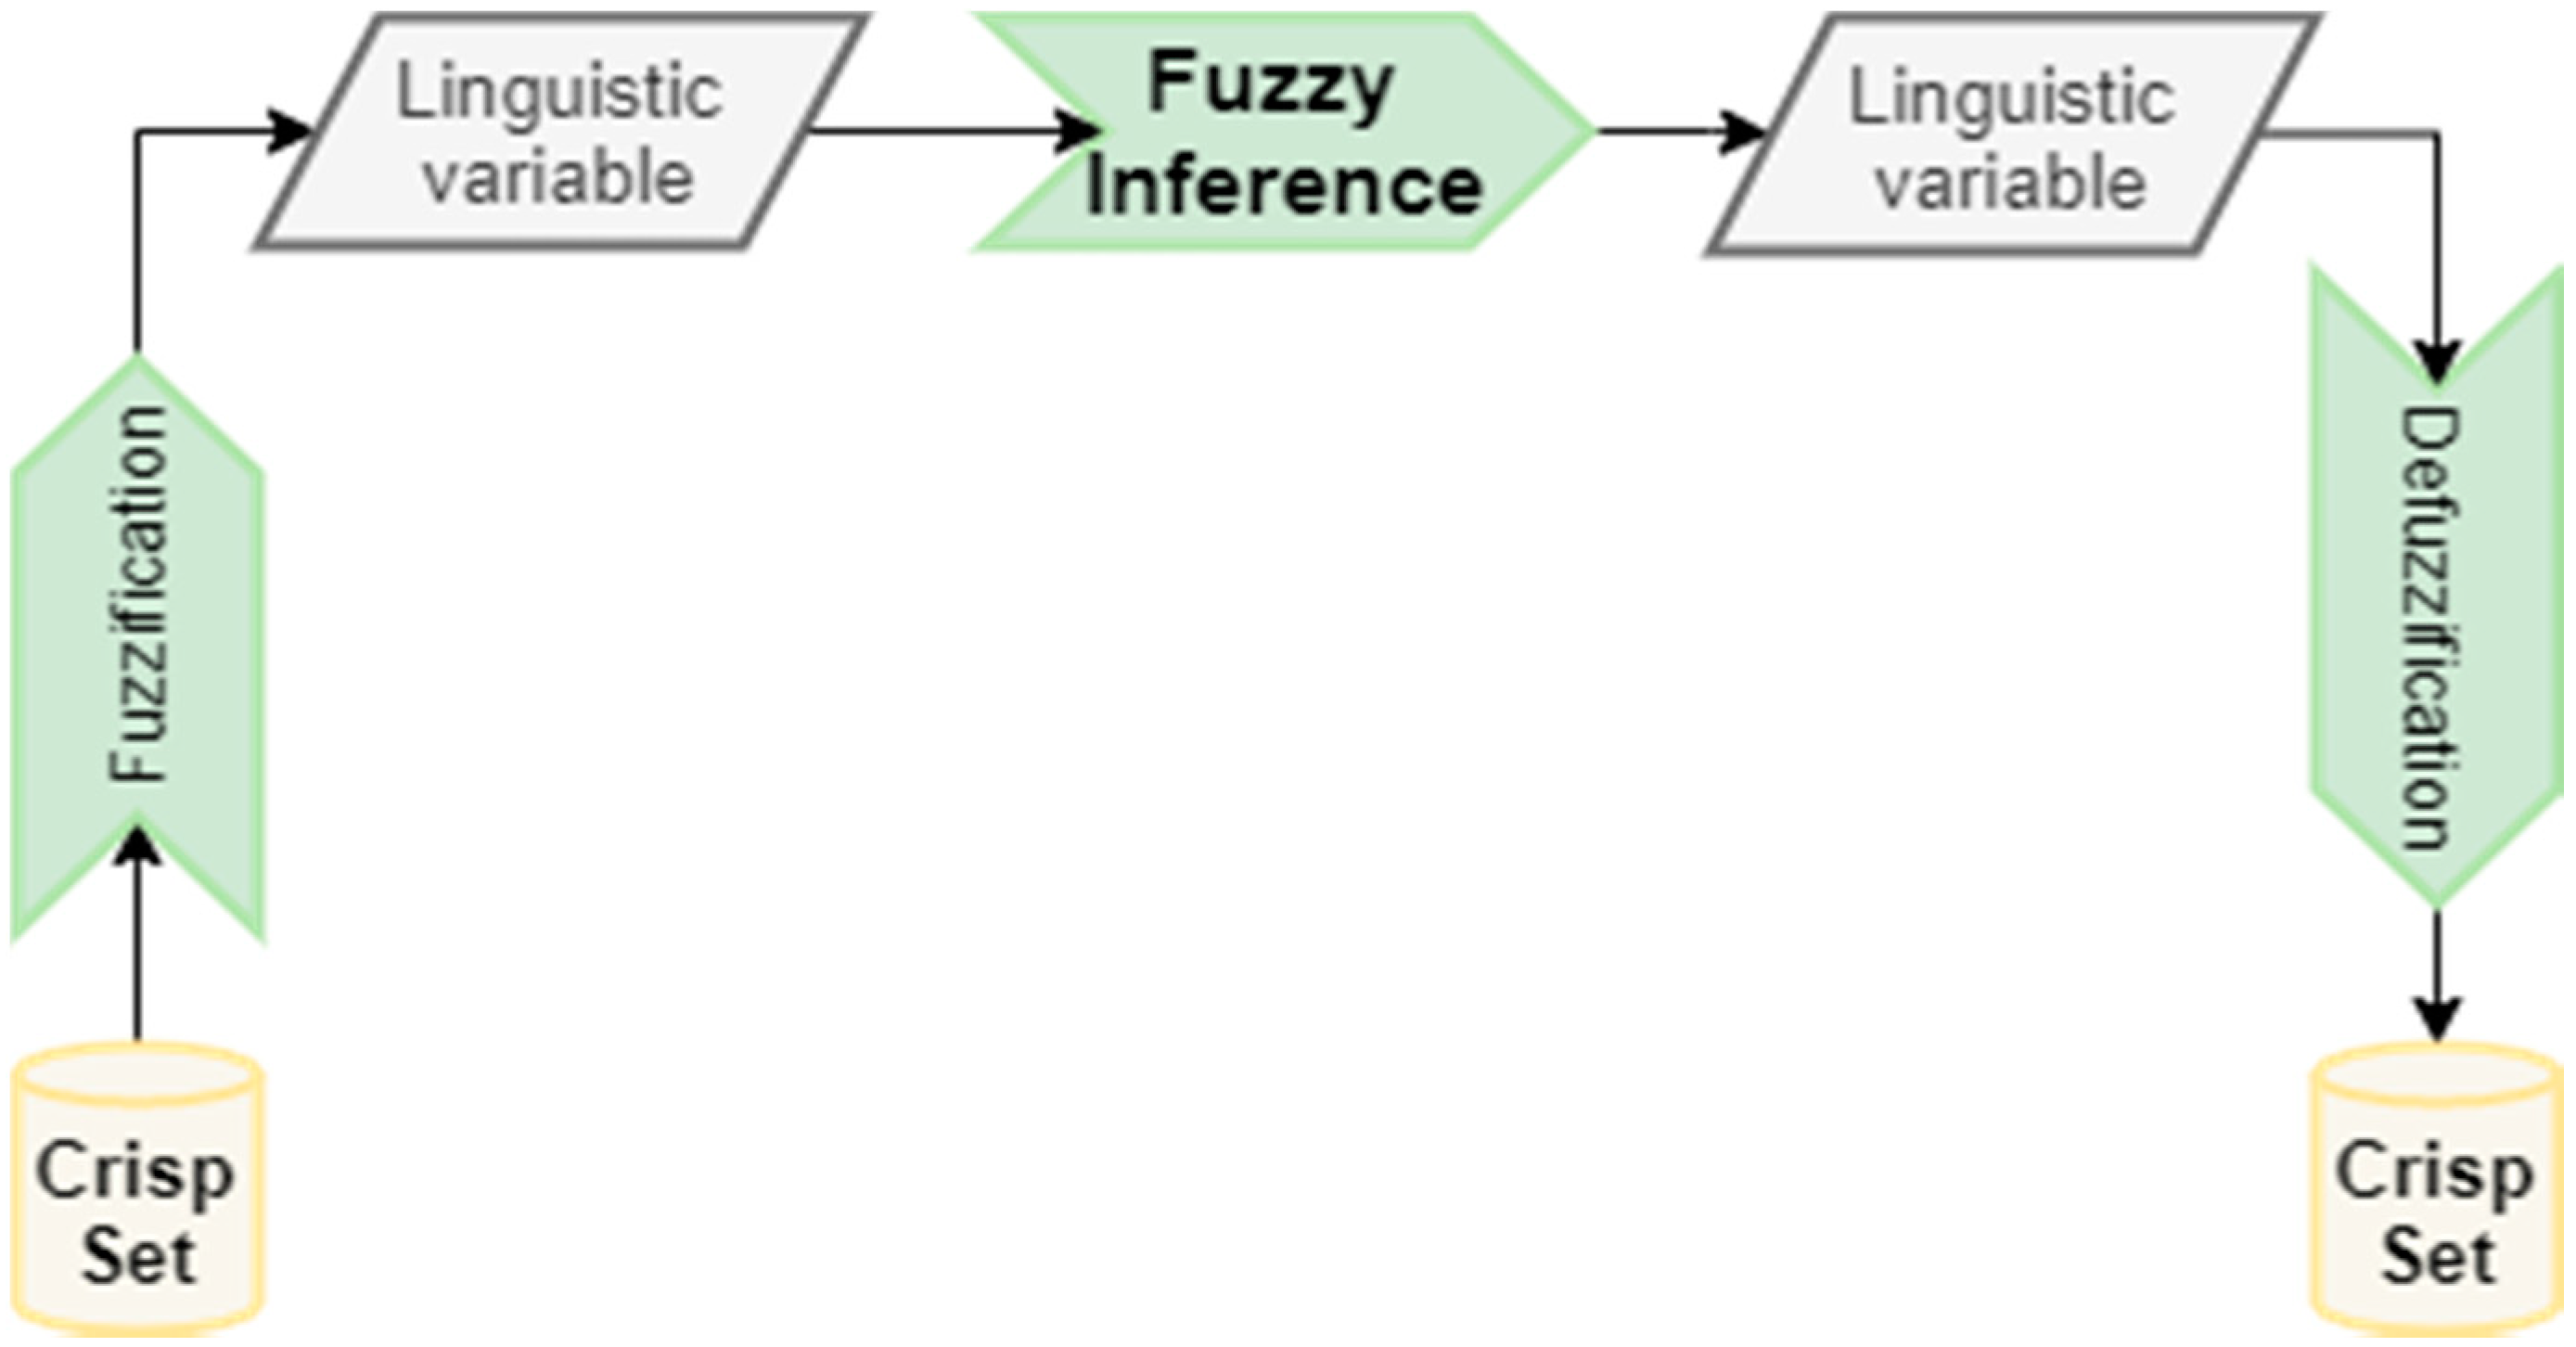
Defuzzification
Now, the output generated from the rule induction phase is defuzzified. Crisps values, which are the output of the inference engine, are mostly needed for real-life applications. Therefore, it is essential to defuzzify the output of the fuzzy rules. Defuzzification is the process of mapping the fuzzy inference set into a crisp set and producing a quantifiable result in a crisp set provided fuzzy sets and the corresponding membership degree. The complete process of the fuzzy inference system is shown in
Figure 7. The two most popular methods for defuzzification are the Center of Gravity (COG) and Middle of Maxima (MOM) [
49]. In this paper, the COG defuzzification method is used to convert the aggregated fuzzy set into a crisp output value. For illustration, suppose a person p
i whose input parameters are temp
i, rr
i, socd
i, hrt
i, and spo2
i. The defuzzification process combines the evidence from the selected features and converts them into a crisp value that indicates the person’s diagnosis value by the verdict value vv(p
i).
Verdict Phase
The final verdict (fv) value indicates whether a person is a COVID-19 patient or not. The final verdict is provided based on the verdict value calculated in the previous phase. The initial belonging score needs to be identified for an input case (p
i) from the crisp diagnosed value calculated in the defuzzification phase to classify it into each class label. A threshold value is assigned to each verdict category, and when the specific threshold is met, the respective verdict is generated. For illustration, if a person’s symptoms lie in the following range, temp = normal, hrt = mild, rr = serious, spo2 = critical, and socd = serious, then the generated verdict is serious. Calculating the crisp verdict value and diagnostic constant is challenging; therefore, they are carried out experimentally. First, a training dataset is prepared, which comprises an equal number of COVID-19 positive and negative cases. The features, i.e., temp, hrt, rr, spo2, and socd, are extracted for each case. The corresponding verdict value is then calculated for each case by following the procedure illustrated in the previous subsections. The process of calculating the verdict value is demonstrated in Algorithm 4.
| Algorithm 4. Complete process of FLCD. |
![Energies 14 07023 i004]() |
4.3. FLCD System Model Testing
In this subsection, the proposed model is tested, and the results are presented in
Table 8. In this work, the RBFL classifier is employed, and Google Colab [
50] software is used to implement and run the algorithm on the dataset. To evaluate the performance of the RBFL classifier, five performance matrices are used: error rate, sensitivity/recall, specificity, precision, and accuracy. Moreover, micro- and macro-average values are also calculated. The proposed FLCD system successfully achieved 95% accuracy rate, while the error rate is 2.52%, sensitivity/recall is 93.35%, specificity is 98.06%, and precision is 94.73%. The micro-average (precision) is 98.28%, and the macro-average (precision) is 98.06%, while the micro-average (recall) and macro-average (recall) is 94.84% and 93.35%, respectively.
5. Results and Discussion
In this chapter, the results computed by our FLCD system are discussed, and to argue the effectiveness of FLCD system, it is compared with the five machine learning classifiers, namely Support Vector Machine (SVM), Decision Table, Naïve Bayes, K-Nearest Neighbor (KNN), and Logistic regression. The results are presented in
Table 9.
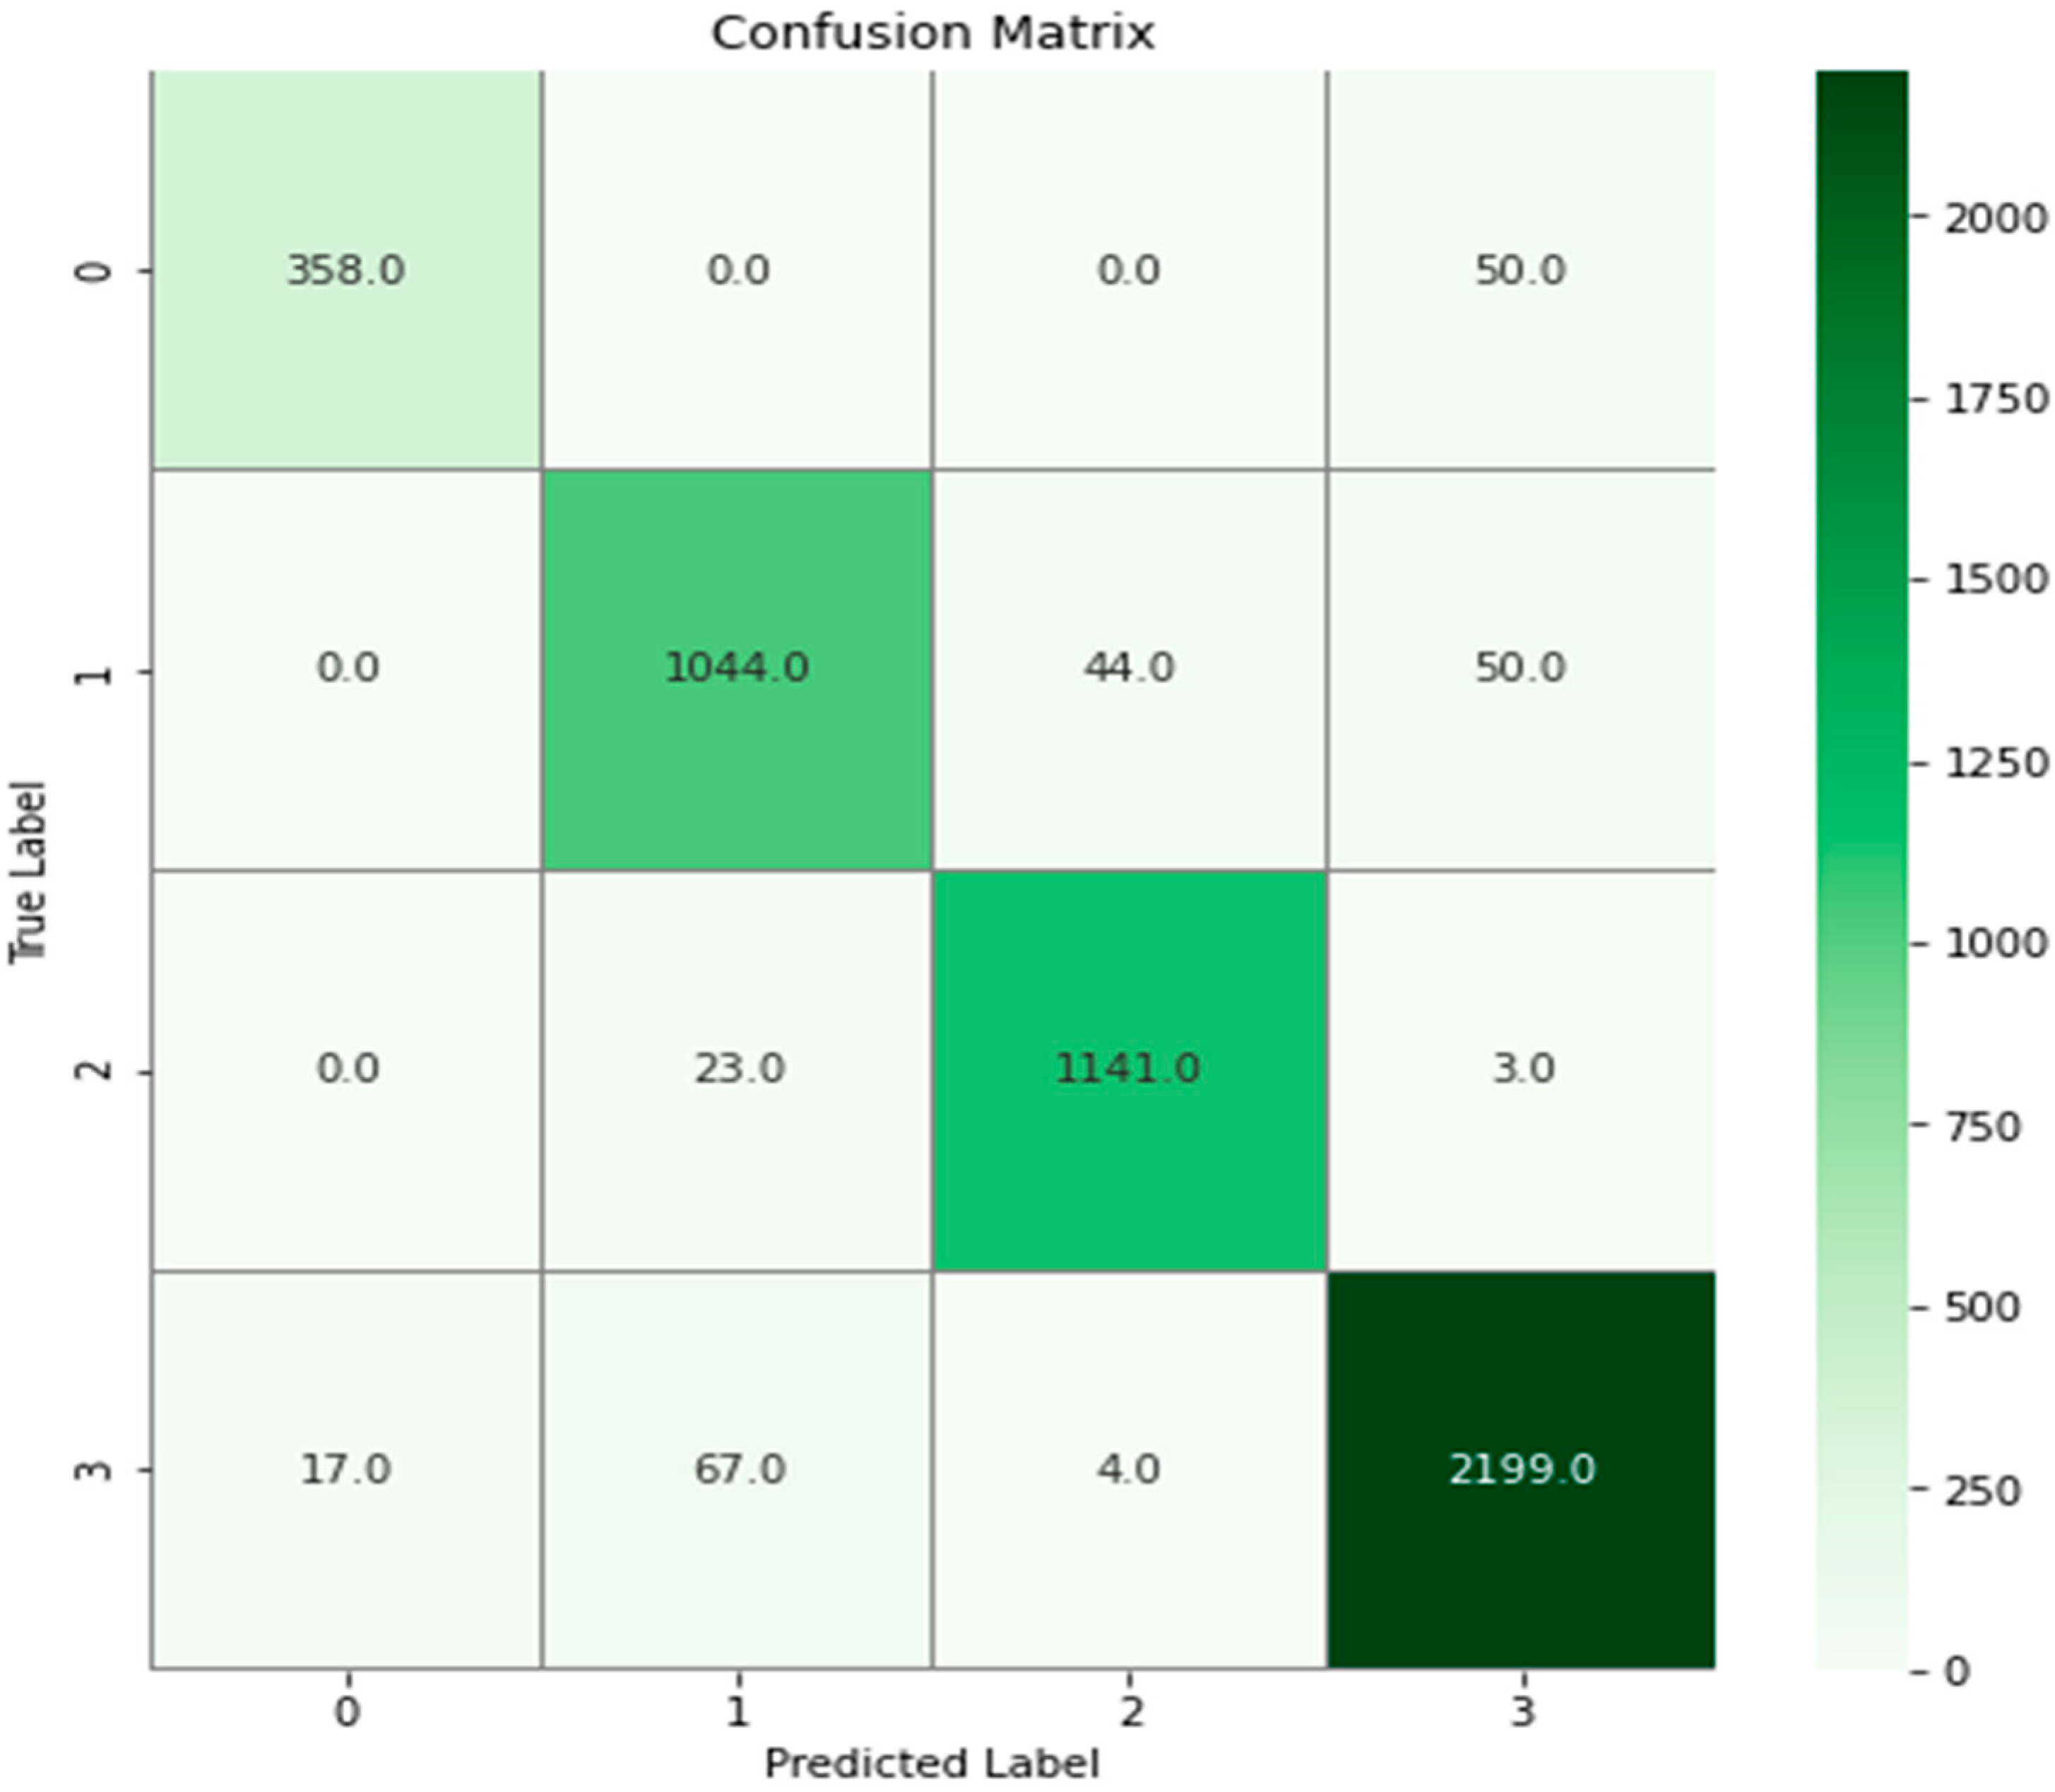
5.1. Confusion Matrix
To calculate the performance matrices, a confusion matrix is applied, which is presented in
Figure 8. The confusion matrix is usually used to see the performance of a binary class; however, it can also be used to analyze the performance of a multiclass supervised learning problem by creating a multiclass matrix. In this case, four classes are available, so a 4-by-4 matrix is created: 4 × 4 = 16 values representing True Positive (TP), False Positive (FP), True Negative (TN), and False Negative (FN). Each column in the matrix shows the instances in the computed and predicted classes, while each row in the matrix shows the instances in the true or actual classes. A list of values is then computed from the confusion matrix for the given classifier, which includes precision, accuracy, misclassification rate, and prevalence.
5.2. Performance Comparison
In
Table 9, the summary of the performance comparison is presented. According to the compared results, the proposed FLCD system has outperformed the existing machine learning classifiers. It has shown better performance against the best performed SVM, and Decision Table machine learning algorithms used in the state-of-the-art work. The main reason behind the better performance is that the proposed framework does not depend on the original features, but it depends on the most effective features selected using the Wrapper method. The mathematical computation in the pre-processing phases helped the classifier to detect COVID-19 symptomatic and asymptomatic patients quickly and accurately and eventually increased the accuracy of the model. Therefore, the FLCD system is much better than the existing machine learning models according to the performance matrix, accuracy, error rate, precision, specificity, and recall. Moreover, it has been proven to be a safe decision-making framework as it is simple, flexible, and capable of handling inaccurate and missing data for diagnosing a COVID-19 suspect. Consequently, it lessens the burden of healthcare staff and provides them a cost-effective and reliable health care system and protect them from becoming overwhelmed.
The FLCD system has the potential to reduce the effect of infectious COVID-19 virus, as well as reducing the death rate by detecting cases early. This approach also allows following up on patients and recovered cases and to obtain a better understanding of the virus. Moreover, we can have a proactive rather than reactive approach, which means we can predict the disease way before the onset of visible symptoms and generate an alarm to alert the person to take precautionary measures beforehand. Furthermore, it provides a cheaper solution based on personal sufficiency despite waiting for government officials to install costly applications, such as smart city cameras and Drone surveillance systems for mask detection and observing social distancing along with a huge and complex digital infrastructure. The remote monitoring of a patient during the 14-day isolation period and after recovery is also made possible with FLCD.
6. Limitation and Future Work
An unprecedented catastrophe, such as the COVID-19 pandemic, pushes us to reconsider the role of technology in the healthcare services industry. The outbreak of the COVID-19 virus instigates the need to discuss the importance of privately and publicly funded research before an unexpected disaster to overcome the shortcomings of existing healthcare management systems. Funding allows the researchers to perform new experiments and design new models capable of dealing with unexpected virus catastrophes.
Moreover, it prompts discussion about the need for the desired types of datasets required for research and combating the deadliest viruses. COVID-19 is a contagious disease, but the more fretting aspect of the pandemic is that it changes over time; every new wave brings new and severe symptoms, which is why a limited number of datasets are available. The available datasets are either X-ray images or CT scans of the chest. No dataset specifically consists of symptom data available to work on, which is considered the biggest limitation for this research work.
Furthermore, limitations, including data availability and privacy and unexpected uncertainties on the parameters, must be addressed immediately. The datasets need to be freely and openly available so that there is no hindrance to the research. However, this may create data confidentiality, authenticity, and integrity problems.
During COVID-19, using a certain diagnostic technique without any error is not easy. Any data generated in real-time has some uncertainties, including both random and systematic errors. Therefore, it is essential to use any learning system that can effectively deal with such uncertainties. When dealing with the fuzzy system, epistemic uncertainty exists due to a lack of data or knowledge. Therefore, it is important to interpret the uncertainty rather than following the statistical approach. One of the most difficult aspects of disease diagnosis is the element of uncertainty. Hence, further research into the input uncertainty can be added to this study in future work. This can improve the performance of the overall system.
7. Conclusions
The COVID-19 virus has spread rapidly and is still threatening the lives of millions of people worldwide. Therefore, a quick and early diagnosis of a COVID-19 suspect becomes vital to control the spread and cure the infection. In this work, an IoT-enabled suspect detection and patient monitoring framework using rule-based fuzzy logic technique is proposed for a quick and accurate diagnosis and to reduce the impact of the contagious COVID-19 virus. The proposed rule-based Fuzzy Logic classifier for the COVID-19 Detection (FLCD) system consists of three layers, namely: the data collection layer, data fusion layer, and cloud layer. The data collection layer collects symptom data through wearable sensors; the data fusion layer pre-processes and filters the data to generate a verdict. Lastly, the data and computed verdict is stored in the cloud layer so that it can be accessible to everyone, including the user, healthcare staff, and local medical centers.
The experimental results showed that the proposed FLCD system is effective in diagnosing a COVID-19 suspect and providing an accurate identification of potential COVID-19 cases compared to existing methods in terms of precision, accuracy, recall, error rate, specificity, and F-score. The FLCD system acquired 95% accuracy and a minimum of a 2.52% error rate with 94.73% precision, 93.35% recall, and 98.06% specificity. The results of the FLCD model are compared with Decisions Tree, KNN, SVM, Naïve Bayes, and Logistic regression machine learning algorithms. By comparing the results, it is proved that FLCD performed better than all aforementioned ML algorithms.


