
Sea Wave Energy. A Review of the Current Technologies and Perspectives


Abstract
:
1. Introduction
2. Definitions
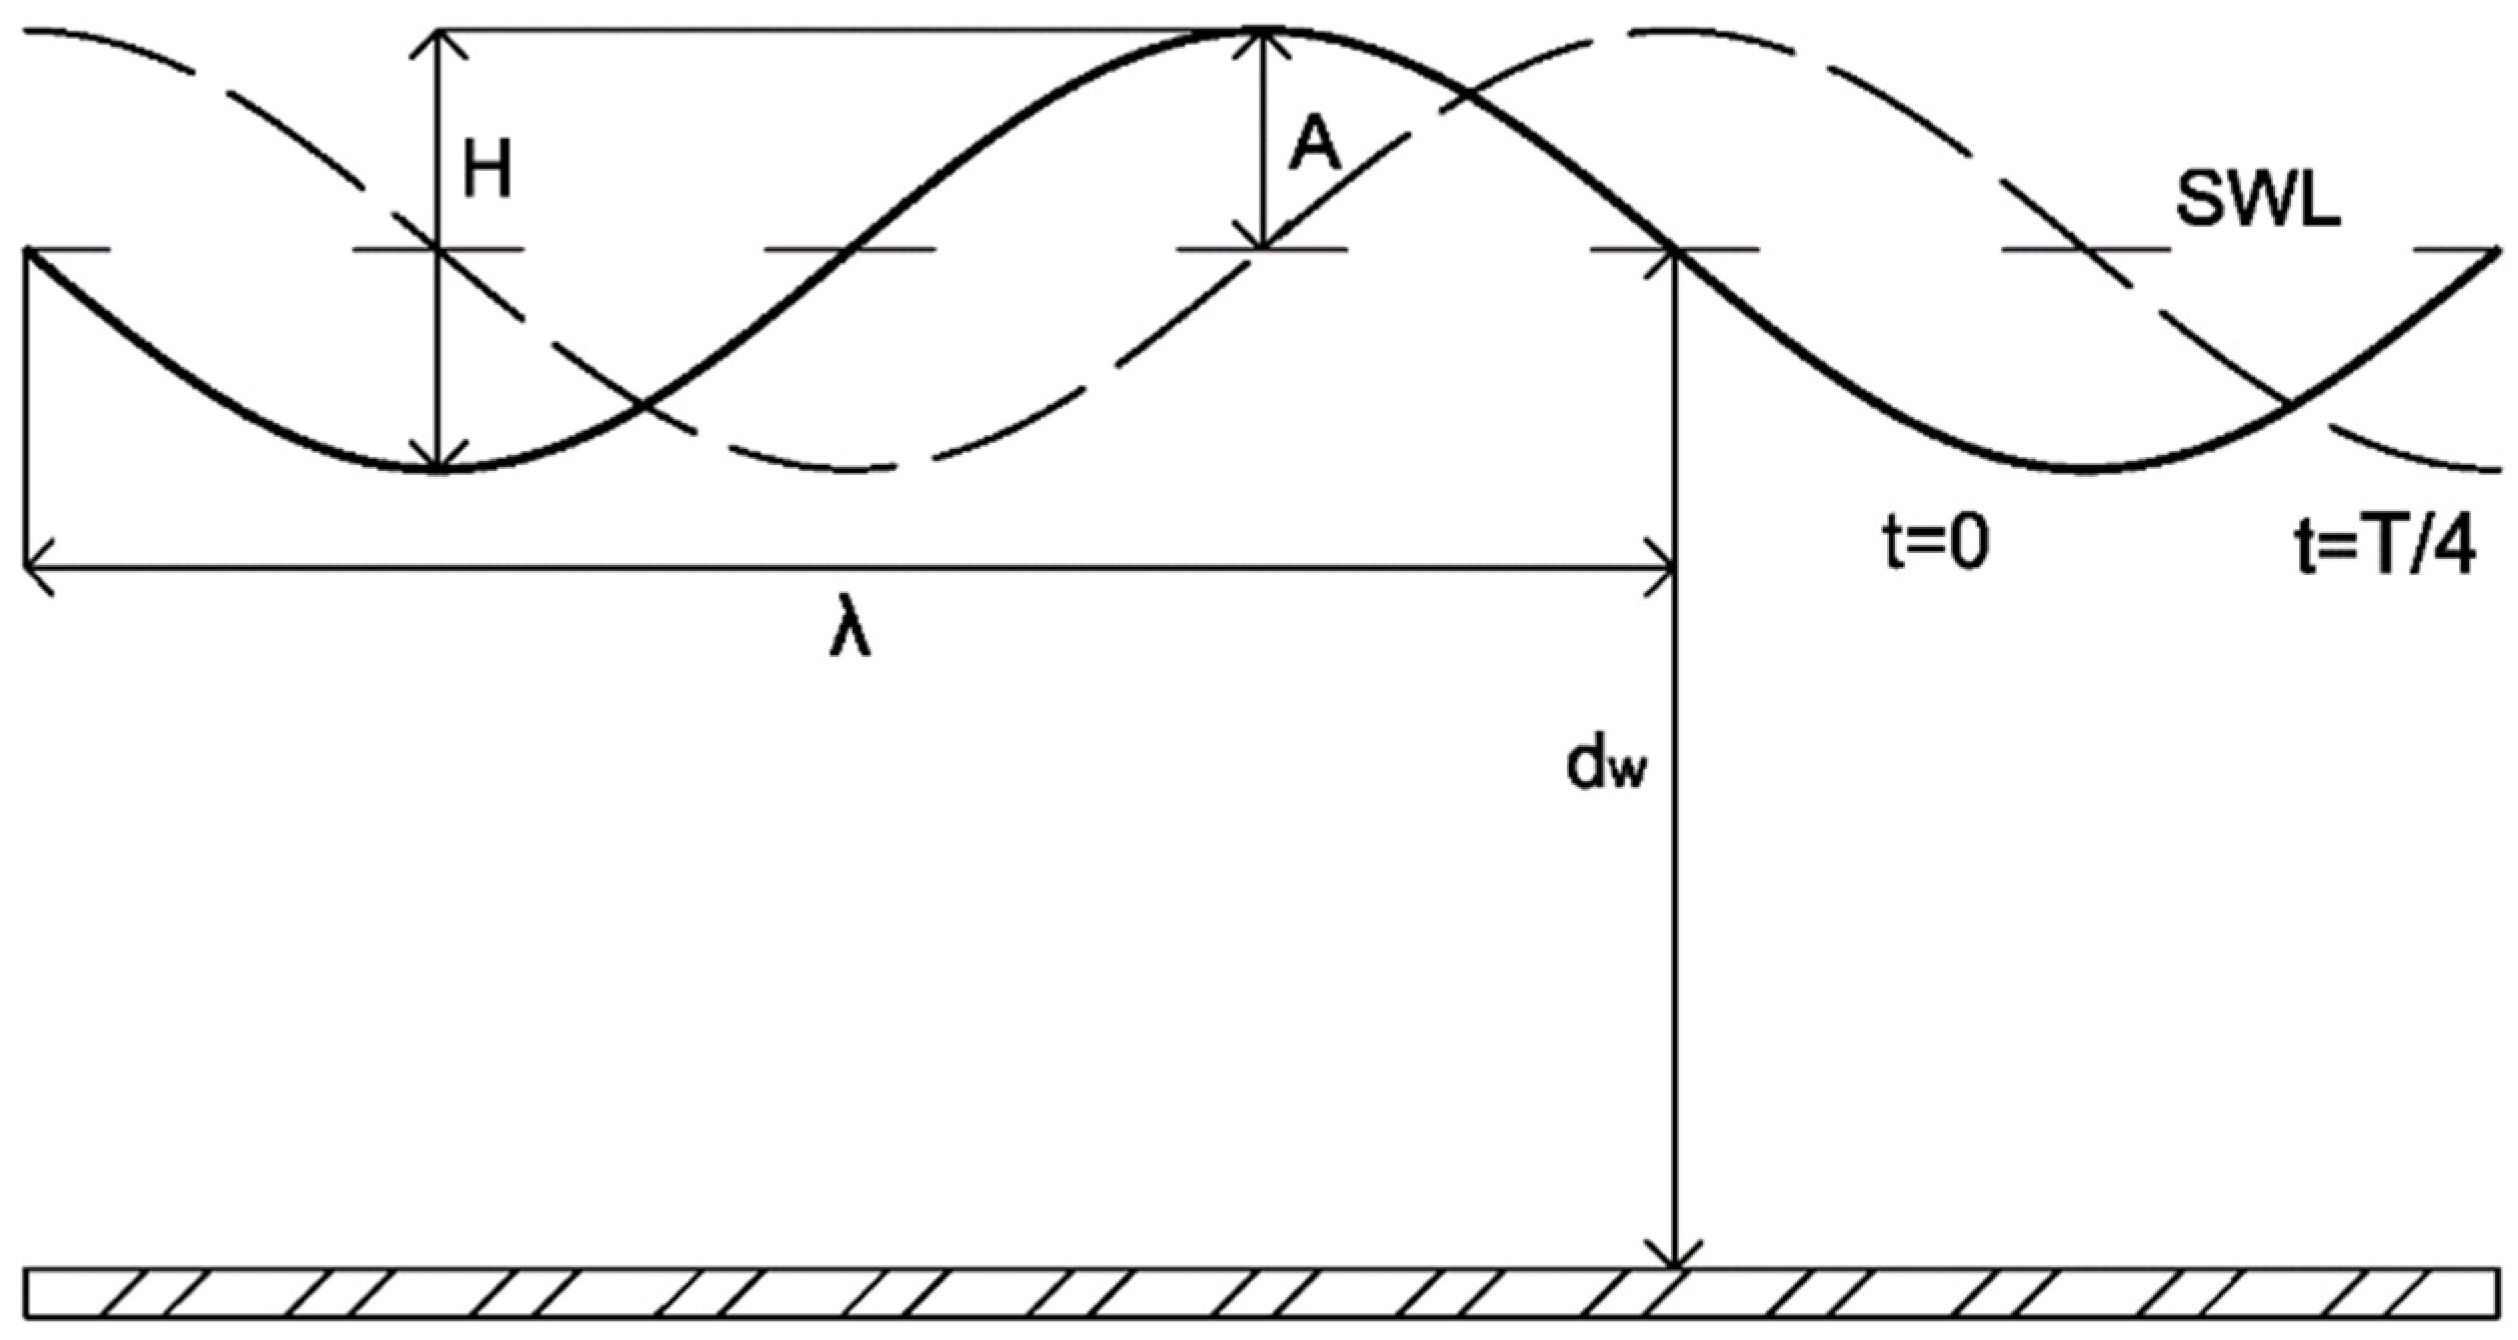
- Peak amplitude, i.e., the difference between the peak and the Surface Water Level (SWL). This definition is commonly used in the electronics sector.
- Peak-to-peak, i.e., the difference between the crest (the highest value during the oscillation) to the trough (the lowest one).
- Mean wave represents the average value of all measured waves in the measuring period.
- Wave one-tenth is the mean wave height of the highest tenth of the waves.
- Maximum wave height is the maximum value measured in the site. It is relevant to design structures that are exposed to sea waves.
- Shallow water or long wave if
- Intermediate water if
- Deep water or short wave
- Capillary waves (), generated by wind and restored by surface tension
- Ultra-gravity waved () generated by wind and restored by surface tension and gravity
- Gravity waves () generated by wind and restored by gravity
- Infra-gravity waves (), caused by wind and atmospheric pressure gradients and restored by gravity
- Long-period waves (seiches, storm surges, tsunamis, with a period ), caused by atmospheric pressure gradients and earthquake and restored by gravity
- Ordinary tidal waves (), due to the gravitational attraction of celestial bodies (moon and sun) and restored by gravity and Coriolis force
- Trans-tidal waves (), due to storms and gravitational attraction and restored by gravity and Coriolis force.
3. State of Art
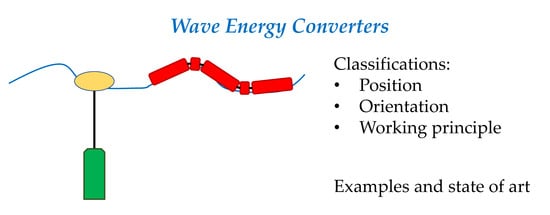
- Attenuators, these systems are oriented parallel to the wave direction. Since the device has a length of the same order as the wavelength, it adapts its shape to the wave profile, extracting energy from sea waves.
- Point absorbers, these systems work independently of wave direction due to their small sizes in comparison with the wavelength.
- Terminators, these systems are oriented perpendicular to the direction of wave propagation. Sea wave ends on the device, transferring its energy.
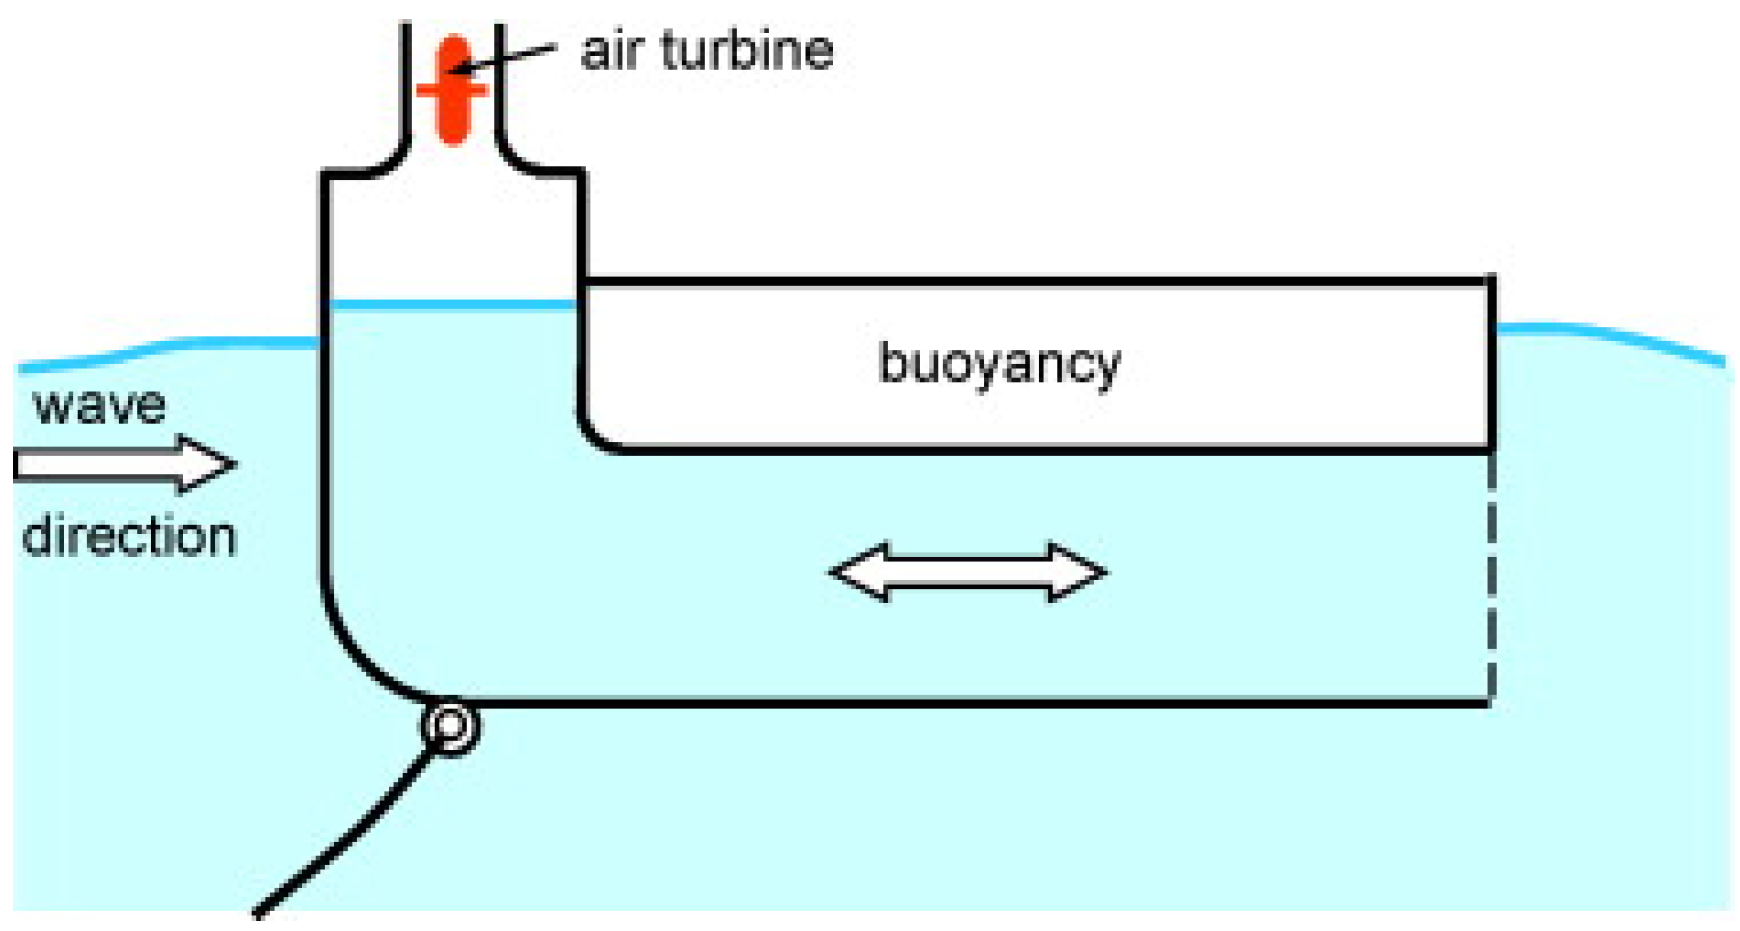
- Oscillating water column. In this system, sea wave enters inside a chamber open to the atmosphere. Inside the chamber, sea wave produces a vertical water oscillation. The air inside the chamber is pressurized and depressurized by the water oscillation, producing a bidirectional airflow usable to run special wind turbines. The system can be installed on the coastline or integrated into a floating device.
- Wave-activated bodies. In this case, the sea wave produces relative motions on the systems, running the energy converters. This kind of system can be assembled in several configurations to produce a rotation or a translation. About the installation, there are floating systems and submerged ones.
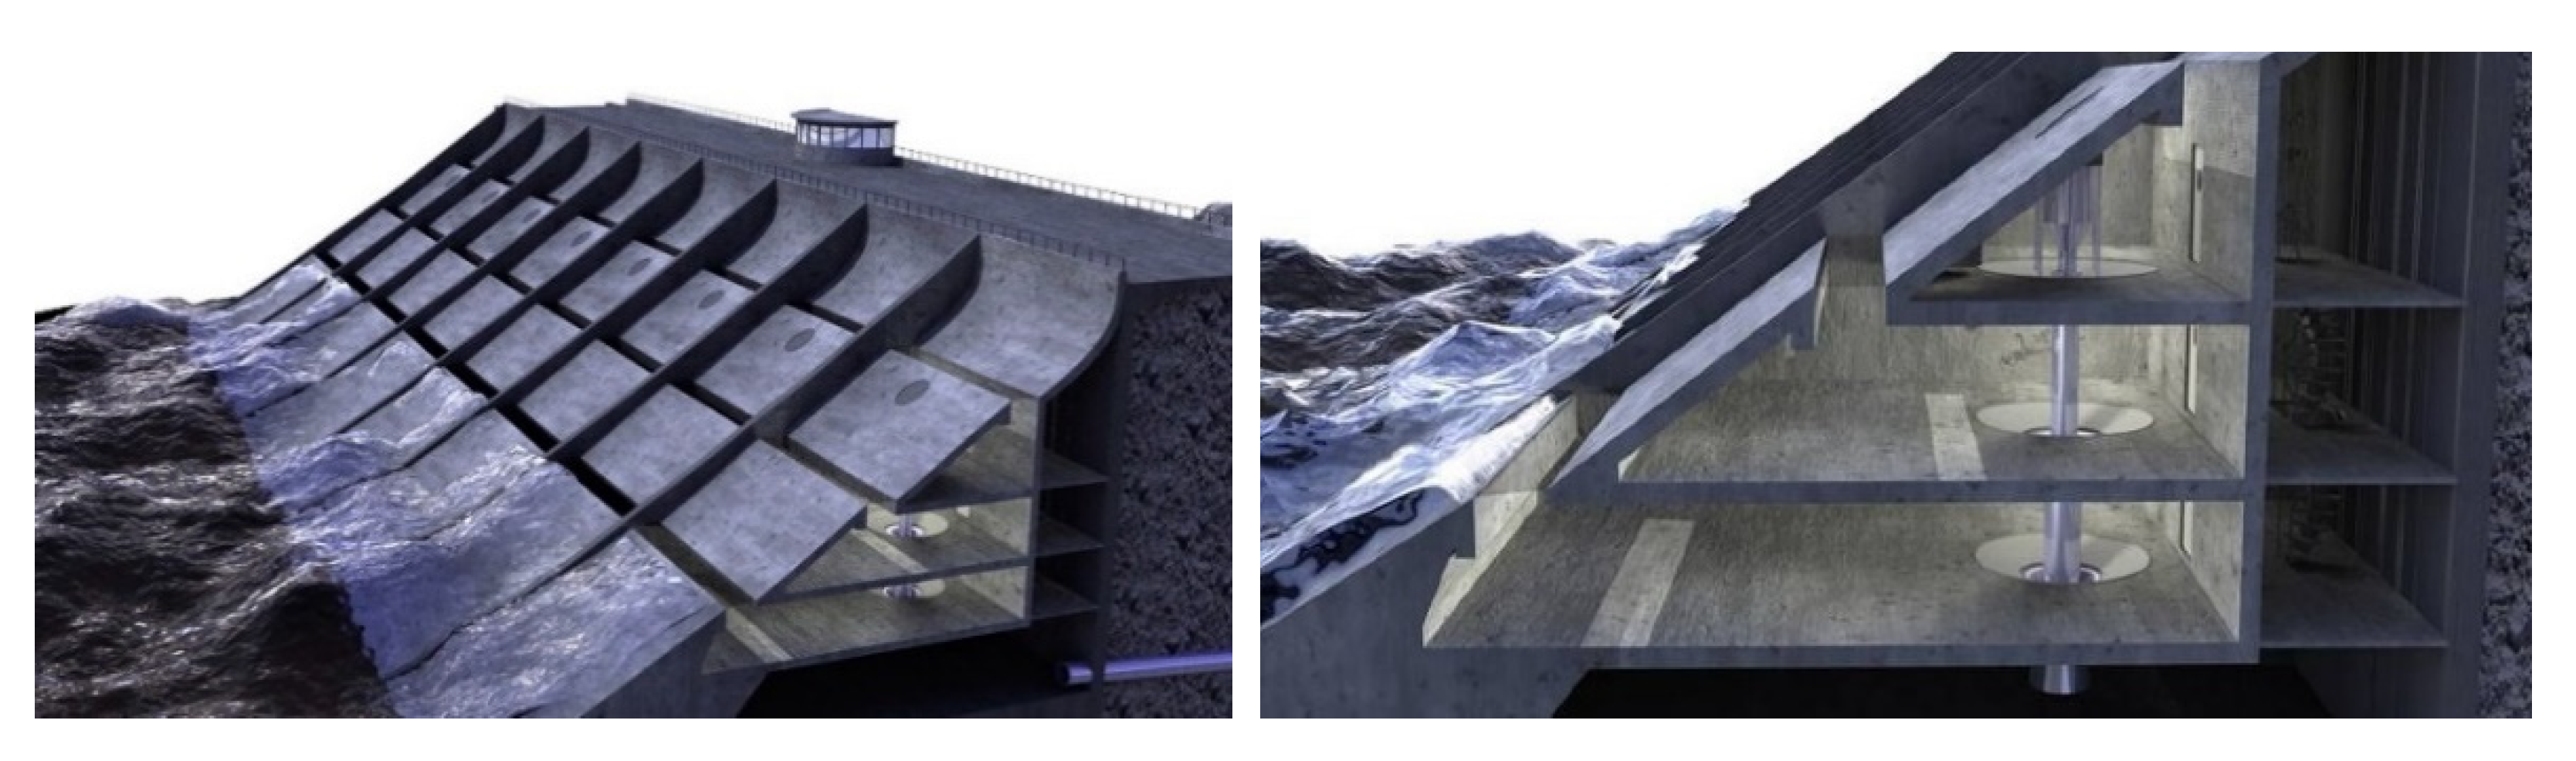
- Overtopping devices. In this case, seawater is conveyed in a reservoir, using a ramp to convert the kinetic energy of sea waves into potential energy. The water is consequently spilled from the reservoir and used to produce electricity, using a low-head hydro turbine.
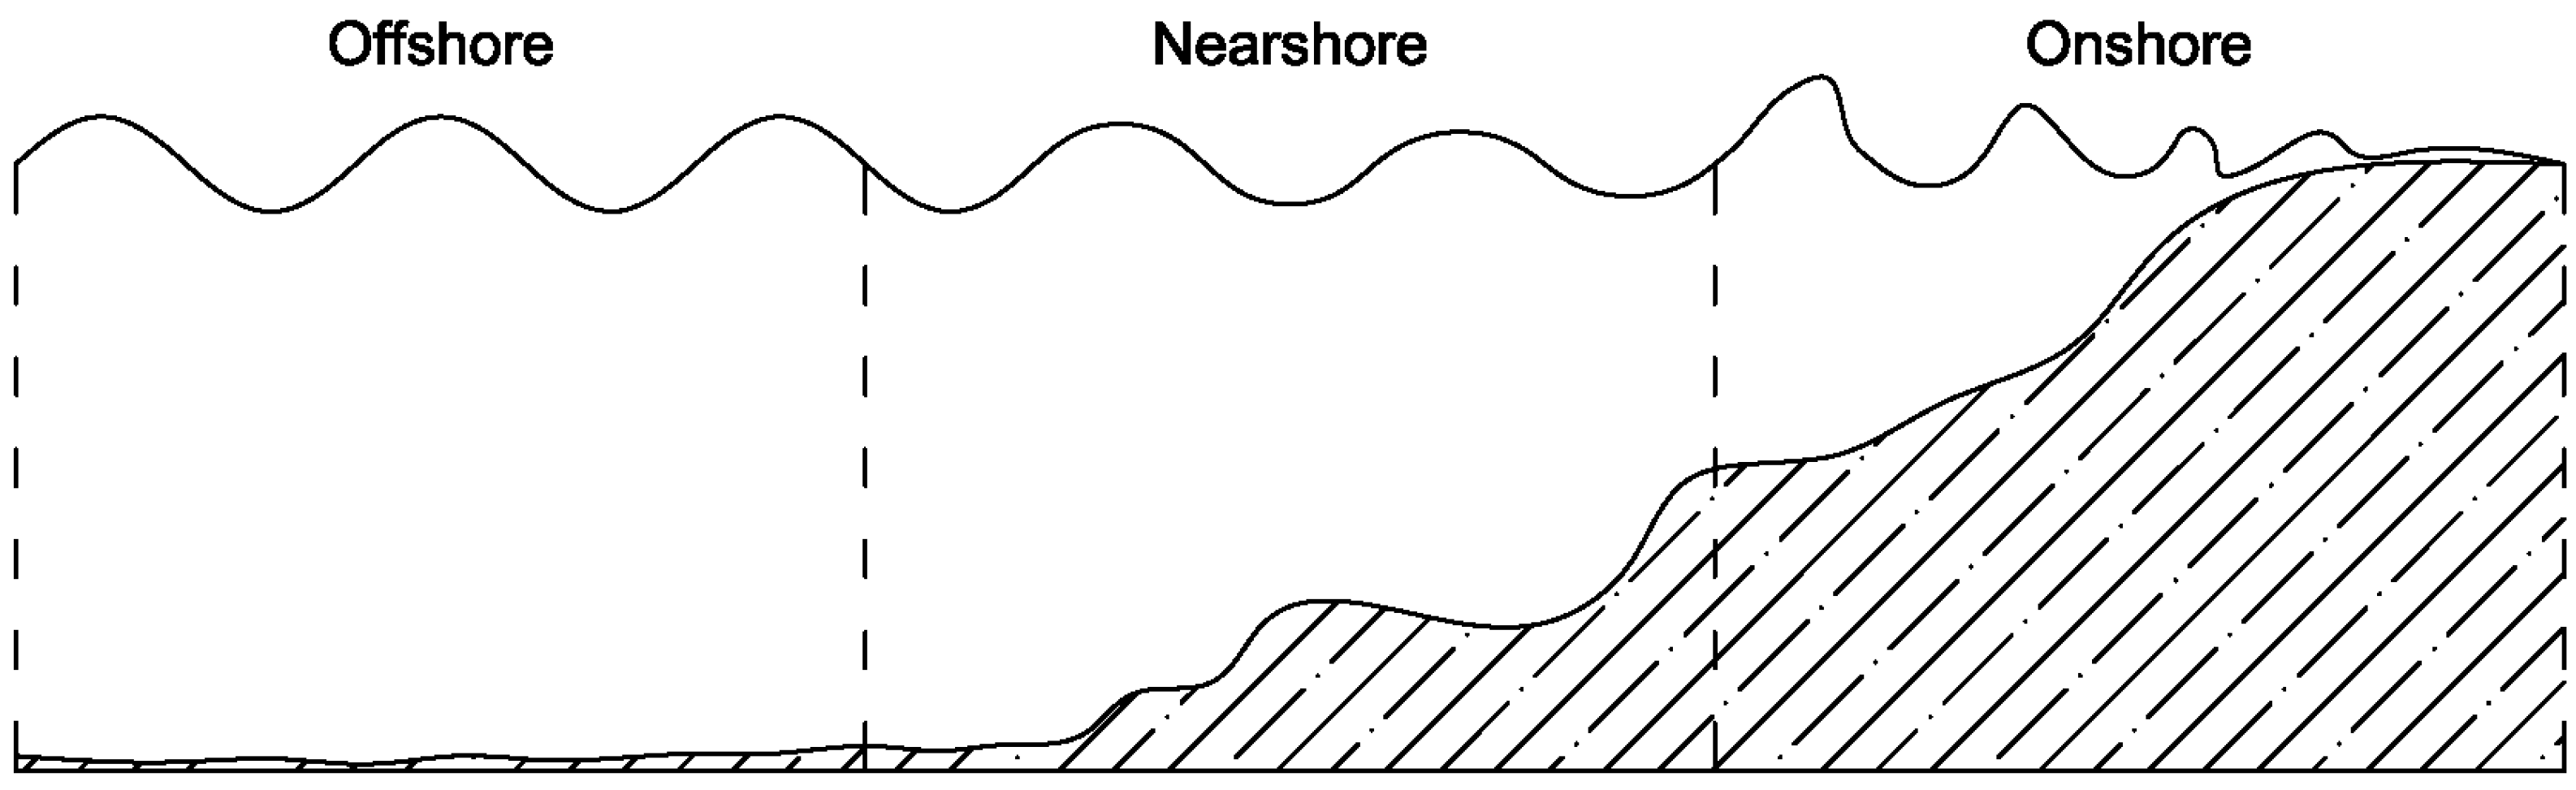
- Onshore. In this case, the system is directly fixed on the mainland, simplifying the maintenance and the installation of the device.
- Nearshore. It represents the transition region between the shoreline and the effective offshore area. In this zone, sea wave energy starts to be dissipated by the seabed. In simple terms, the nearshore region starts where the water depth is about half of the wavelength and ends where the depth is one-twentieth of wavelength.
- Offshore, the region where the sea wave phenomenon is practically not influenced by the seabed. In this area, waves are strong and regular.
3.1. Oscillating Water Column
3.2. Wave-Activated Body
3.2.1. Single-Body Heaving Buoys
3.2.2. Two-Body Heaving Buoys
3.2.3. Fully Submerged Heaving Systems
3.2.4. Pitching Devices
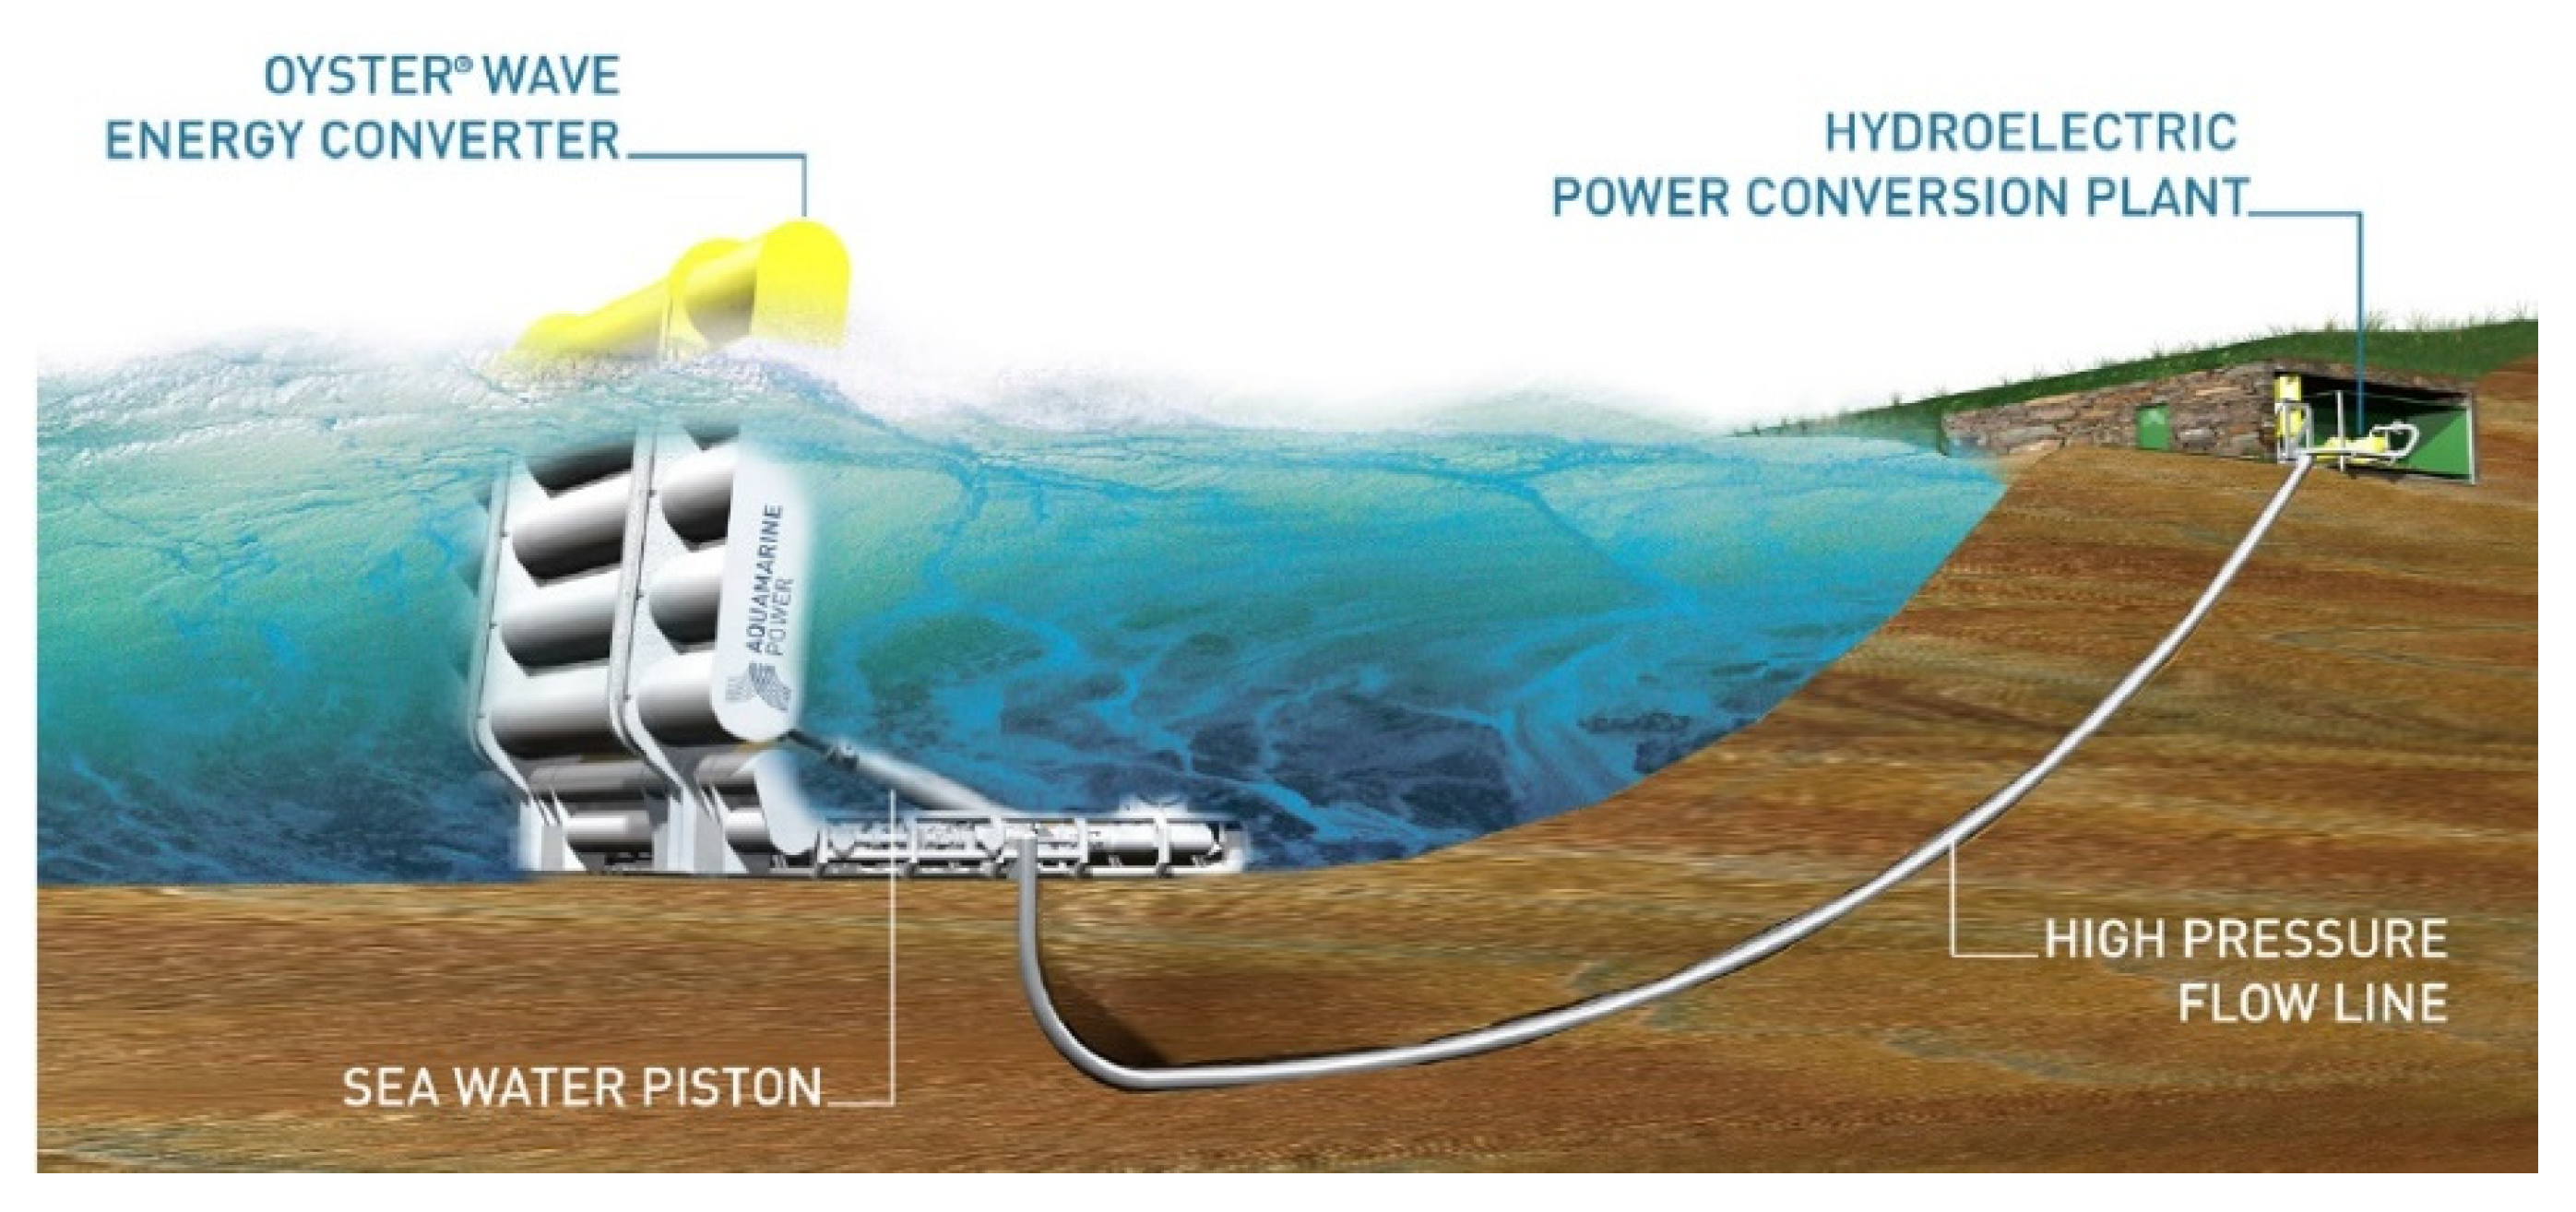
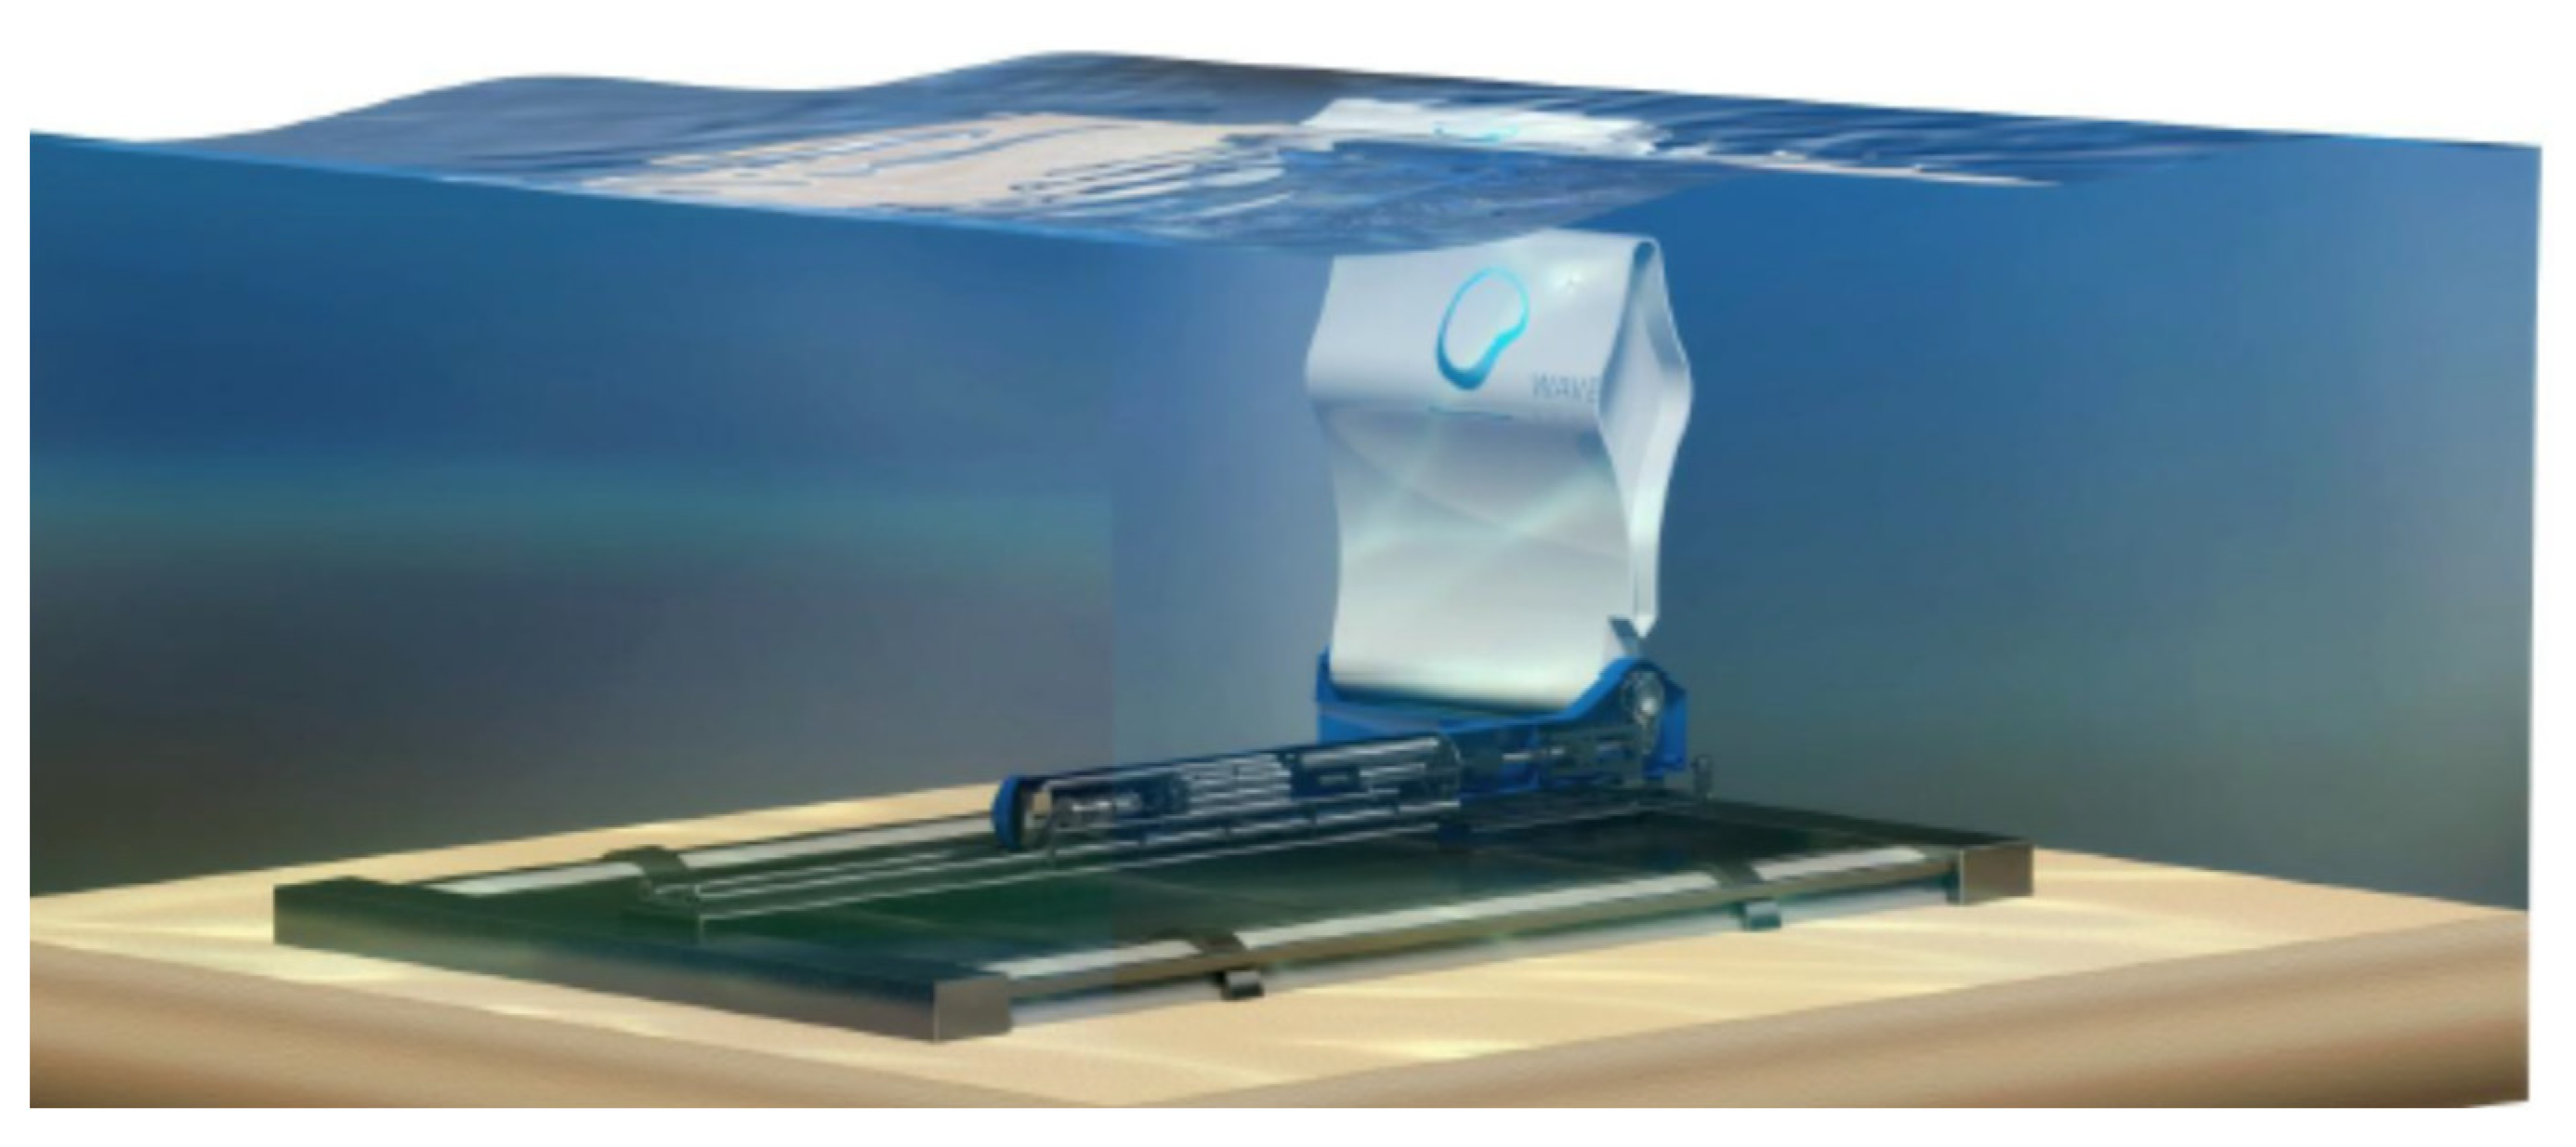
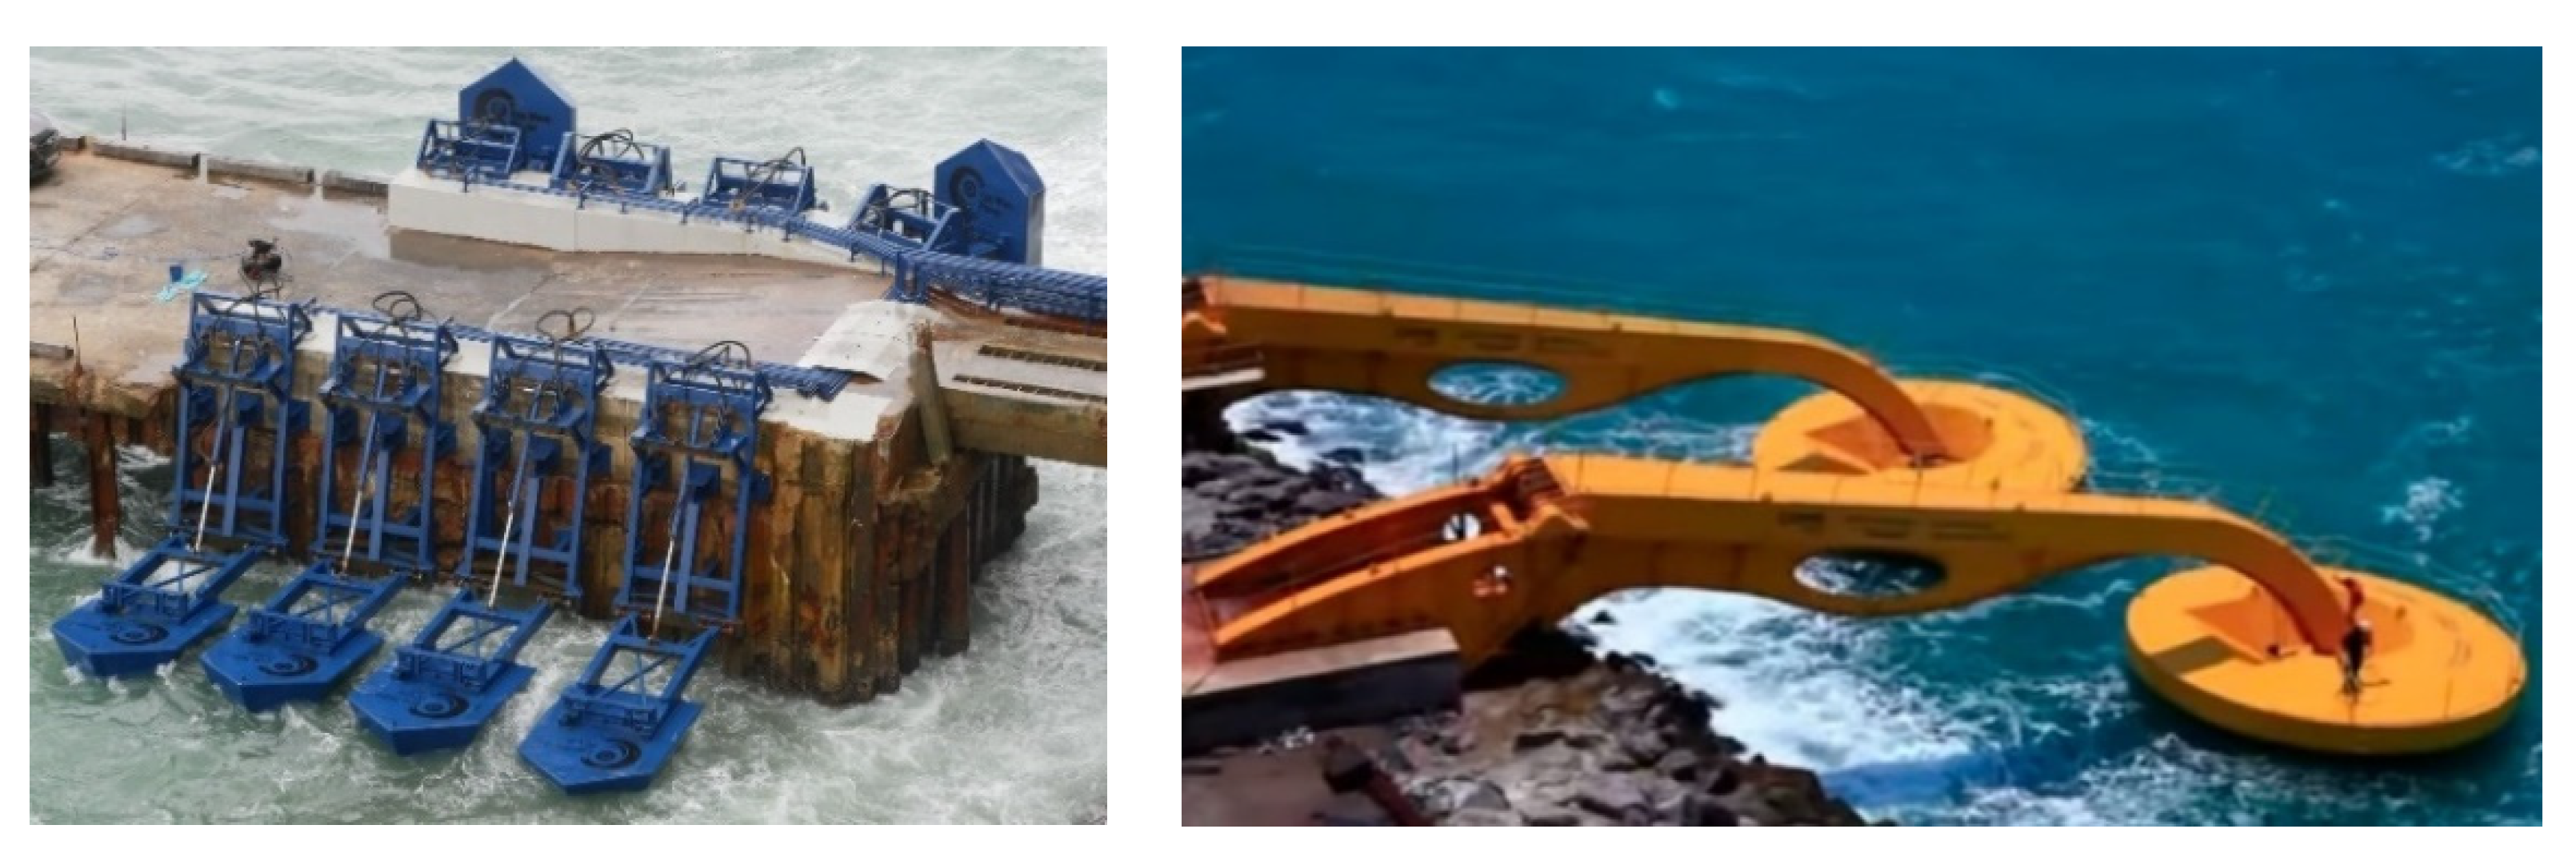
3.2.5. Bottom-Hinged Systems
3.2.6. Many-Body System
3.3. Overtopping Devices
4. Conclusions
Author Contributions
Funding
Acknowledgments
Conflicts of Interest
References
- Saquib Maqsood, M.; Prasad Padhi, B. Ocean Energy: An Insight. In Proceedings of the National Seminar on Sustainable Future, through Leadership & Technology, Bhubaneswar, India, 3–4 March 2017; pp. 59–64. [Google Scholar]
- World Energy Council. World Energy Resources; World Energy Council: London, UK, 2016; Volume 1. [Google Scholar]
- Cascajo, R.; García, E.; Quiles, E.; Correcher, A.; Morant, F. Integration of marine wave energy converters into seaports: A case study in the port of Valencia. Energies 2019, 12, 787. [Google Scholar] [CrossRef] [Green Version]
- Barstow, S.; Mørk, G.; Mollison, D.; Cruz, J. The Wave Energy Resource. In Ocean Wave Energy; Springer: Berlin/Heidelberg, Germany, 2008; pp. 93–132. ISBN 978-3-540-74894-6/978-3-540-74895-3. [Google Scholar]
- Neill, S.P.; Angeloudis, A.; Robins, P.E.; Walkington, I.; Ward, S.L.; Masters, I.; Lewis, M.J.; Piano, M.; Avdis, A.; Piggott, M.D.; et al. Tidal range energy resource and optimization—Past perspectives and future challenges. Renew. Energy 2018, 127, 763–778. [Google Scholar] [CrossRef]
- Yang, X.; Haas, K.A.; Fritz, H.M. Evaluating the potential for energy extraction from turbines in the gulf stream system. Renew. Energy 2014, 72, 12–21. [Google Scholar] [CrossRef] [Green Version]
- Guo, J.; Zhang, Z.; Xia, C.; Guo, B.; Yuan, Y. Topographic–baroclinic instability and formation of Kuroshio current loop. Dyn. Atmos. Ocean. 2018, 81, 15–29. [Google Scholar] [CrossRef]
- Krug, M.; Schilperoort, D.; Collard, F.; Hansen, M.W.; Rouault, M. Signature of the Agulhas Current in high resolution satellite derived wind fields. Remote Sens. Environ. 2018, 217, 340–351. [Google Scholar] [CrossRef]
- Tinaikar, A. Ocean thermal energy conversion. Int. J. Energy Power Eng. 2013, 2, 143–146. [Google Scholar] [CrossRef] [Green Version]
- World Energy Council. World Energy Resources: Marine Energy 2016; World Energy Council: London, UK, 2016; p. 79. [Google Scholar]
- Asian Development Bank. Wave Energy Conversion and Ocean Thermal Energy Conversion Potential in Developing Member Countries; Asian Development Bank: Mandaluyong City, Philippines, 2014; ISBN 978-92-9254-530-7. [Google Scholar]
- Helfer, F.; Lemckert, C.; Anissimov, Y.G. Osmotic power with Pressure Retarded Osmosis: Theory, performance and trends—A review. J. Memb. Sci. 2014, 453, 337–358. [Google Scholar] [CrossRef] [Green Version]
- Curto, D.; Franzitta, V.; Guercio, A. A review of the water desalination technologies. Appl. Sci. 2021, 11, 670. [Google Scholar] [CrossRef]
- Laing, A.; Gemmill, W.; Magnusson, A.; Burroughs, L.; Reistad, M.; Khandekar, M.; Holthuijsen, L.; Ewing, J.; Carter, D. Guide to Wave Analysis and Forecasting; World Meteorological Organization: Geneva, Switzerland, 1998; Volume 1998, ISBN 9263127026. [Google Scholar]
- Holthuijsen, L.H. Waves in Oceanic and Coastal Waters; Cambridge University Press: New York, NY, USA, 2007; ISBN 978-0-511-27021-5. [Google Scholar]
- Pecher, A.; Kofoed, J.P. (Eds.) Handbook of Ocean Wave Energy; Ocean Engineering & Oceanography; Springer International Publishing: Cham, Switzerland, 2017; Volume 7, ISBN 978-3-319-39888-4. [Google Scholar]
- Mackay, E.B.L. Resource Assessment for Wave Energy. In Comprehensive Renewable Energy; Elsevier: Amsterdam, The Netherlands, 2012; Volume 8, pp. 11–77. ISBN 9780080878720. [Google Scholar]
- Arena, F.; Laface, V.; Malara, G.; Romolo, A.; Viviano, A.; Fiamma, V.; Sannino, G.; Carillo, A. Wave climate analysis for the design of wave energy harvesters in the Mediterranean Sea. Renew. Energy 2015, 77, 125–141. [Google Scholar] [CrossRef]
- Reguero, B.G.; Losada, I.J.; Méndez, F.J. A global wave power resource and its seasonal, interannual and long-term variability. Appl. Energy 2015, 148, 366–380. [Google Scholar] [CrossRef]
- Mork, G.; Barstow, S.; Kabuth, A.; Pontes, M.T. Assessing the Global Wave Energy Potential. In Proceedings of the ASME 2010 29th International Conference on Ocean, Offshore and Arctic Engineering, Shanghai, China, 6–11 June 2010; Volume 3, pp. 447–454. [Google Scholar]
- Sierra, J.P.; Mösso, C.; González-Marco, D. Wave energy resource assessment in Menorca (Spain). Renew. Energy 2014, 71, 51–60. [Google Scholar] [CrossRef]
- Cornett, A. A global wave energy resource assessment. In Proceedings of the 18th International Offshore and Polar Engineering Conference, Vancouver, BC, Canada, 6–11 July 2008; ISOPE-2008-TPC-579. pp. 1–9. [Google Scholar]
- Sierra, J.P.; Martín, C.; Mösso, C.; Mestres, M.; Jebbad, R. Wave energy potential along the Atlantic coast of Morocco. Renew. Energy 2016, 96, 20–32. [Google Scholar] [CrossRef]
- Krogstad, H.E.; Arntsen, Ø.A. Linear Wave Theory: Part A: Regular Waves; Norwegian University of Science and Technology: Trondheim, Norway, 2000. [Google Scholar]
- Gunn, K.; Stock-Williams, C. Quantifying the global wave power resource. Renew. Energy 2012, 44, 296–304. [Google Scholar] [CrossRef]
- McCabe, A.P.; Aggidis, G.A. Optimum mean power output of a point-absorber wave energy converter in irregular waves. Proc. Inst. Mech. Eng. Part A J. Power Energy 2009, 223, 773–781. [Google Scholar] [CrossRef]
- Toffoli, A.; Bitner-Gregersen, E.M. Types of Ocean Surface Waves, Wave Classification. Encycl. Marit. Offshore Eng. 2017, 1–8. [Google Scholar] [CrossRef]
- Iuppa, C.; Cavallaro, L.; Vicinanza, D.; Foti, E. Investigation of suitable sites for wave energy converters around Sicily (Italy). Ocean Sci. 2015, 11, 543–557. [Google Scholar] [CrossRef] [Green Version]
- Monteforte, M.; Lo Re, C.; Ferreri, G.B.B. Wave energy assessment in Sicily (Italy). Renew. Energy 2015, 78, 276–287. [Google Scholar] [CrossRef]
- Mattiazzo, G.; Giorcelli, E.; Poggi, D.; Sannino, G.; Carillo, A. Progettazione di un Sistema di Produzione di Energia da Moto Ondoso in Scala Reale; ENEA: Rome, Italy, 2013. [Google Scholar]
- Franzitta, V.; Catrini, P.; Curto, D. Wave Energy Assessment along Sicilian Coastline, Based on DEIM Point Absorber. Energies 2017, 10, 376. [Google Scholar] [CrossRef] [Green Version]
- Falcão, A.F.d.O. Wave energy utilization: A review of the technologies. Renew. Sustain. Energy Rev. 2010, 14, 899–918. [Google Scholar] [CrossRef]
- Rusu, E. Evaluation of the Wave Energy Conversion Efficiency in Various Coastal Environments. Energies 2014, 7, 4002–4018. [Google Scholar] [CrossRef] [Green Version]
- Curto, D.; Neugebauer, S.; Viola, A.; Traverso, M.; Franzitta, V.; Trapanese, M. First Life Cycle Impact Considerations of Two Wave Energy Converters. In Proceedings of the 2018 OCEANS—MTS/IEEE Kobe Techno-Oceans (OTO), Kobe, Japan, 28–31 May 2018; pp. 1–5. [Google Scholar]
- Clément, A.; McCullen, P.; Falcão, A.; Fiorentino, A.; Gardner, F.; Hammarlund, K.; Lemonis, G.; Lewis, T.; Nielsen, K.; Petroncini, S.; et al. Wave energy in Europe: Current status and perspectives. Renew. Sustain. Energy Rev. 2002, 6, 405–431. [Google Scholar] [CrossRef]
- Curto, D.; Viola, A.; Franzitta, V.; Trapanese, M.; Cardona, F. A New Solution for Sea Wave Energy Harvesting, the Proposal of an Ironless Linear Generator. J. Mar. Sci. Eng. 2020, 8, 93. [Google Scholar] [CrossRef] [Green Version]
- Aderinto, T.; Li, H. Ocean Wave energy converters: Status and challenges. Energies 2018, 11, 1250. [Google Scholar] [CrossRef] [Green Version]
- Liberti, L.; Carillo, A.; Sannino, G. Wave energy resource assessment in the Mediterranean, the Italian perspective. Renew. Energy 2013, 50, 938–949. [Google Scholar] [CrossRef]
- Wang, L.; Isberg, J.; Tedeschi, E. Review of control strategies for wave energy conversion systems and their validation: The wave-to-wire approach. Renew. Sustain. Energy Rev. 2018, 81, 366–379. [Google Scholar] [CrossRef]
- Curto, D.; Franzitta, V.; Trapanese, M. Designing an innovative system for sea wave utilization. In Proceedings of the OCEANS 2018 MTS/IEEE Charleston, Charleston, SC, USA, 22–25 October 2018; pp. 1–6. [Google Scholar]
- Zhao, X.L.; Ning, D.Z.; Zou, Q.P.; Qiao, D.S.; Cai, S.Q. Hybrid floating breakwater-WEC system: A review. Ocean Eng. 2019, 186, 106126. [Google Scholar] [CrossRef]
- Bhattacharyya, R.; McCormick, M.E. Wave Power Activities in Northern Europe. In Wave Energy Conversion; Elsevier Science: Amsterdam, The Netherlands, 2003; pp. 95–123. [Google Scholar]
- Malmo, O.; Reitan, A. Development of the Kvaerner Multiresonant OWC. In Hydrodynamics of Ocean Wave-Energy Utilization; Springer: Berlin/Heidelberg, Germany, 1986; pp. 57–67. ISBN 978-3-642-82668-9. [Google Scholar]
- Maurya, A.K.; Singh, S.P. Assessment of Ocean Wave Energy Converters for Indian Coastal Region. IETE Tech. Rev. 2020, 37, 476–488. [Google Scholar] [CrossRef]
- Ravindran, M.; Koola, P.M. Energy from sea waves—The Indian wave energy programme. Curr. Sci. 1991, 60, 676–680. [Google Scholar]
- Khan, J.; Bhuyan, G.S. Ocean Energy: Global Technology Development Status; Report prepared by Powertech Labs for the IEA-OES; International Renewable Energy Agency: Abu Dhabi, United Arab Emirates, 2009. [Google Scholar]
- Agence Française De Développement; Indian Renewable Energy Development Agency Limited. Study on Tidal & Waves Energy in India: Survey on the Potential & Proposition of a Roadmap; AFD: Paris, France; IREDA: New Delhi, India, 2014.
- Leijon, J.; Boström, C. Freshwater production from the motion of ocean waves—A review. Desalination 2018, 435, 161–171. [Google Scholar] [CrossRef]
- Thiruvenkatasamy, K.; Neelamani, S. On the efficiency of wave energy caissons in array. Appl. Ocean Res. 1997, 19, 61–72. [Google Scholar] [CrossRef]
- Falcão, A.F.O.; Henriques, J.C.C. Oscillating-water-column wave energy converters and air turbines: A review. Renew. Energy 2016, 85, 1391–1424. [Google Scholar] [CrossRef]
- Whittaker, T.J.T.; Beattie, W.; Folley, M.; Boake, C.; Wright, A.; Osterried, M. The Limpet Wave Power Project—The First Years of Operation. Renew. Energy 2004, 1–8. [Google Scholar]
- Tethys. Pico Oscillating Water Column. Available online: https://tethys.pnnl.gov/annex-iv-sites/pico-oscillating-water-column (accessed on 30 August 2021).
- Lacasa, M.C.; Esteban, M.D.; López-Gutiérrez, J.S.; Negro, V.; Zang, Z. Feasibility study of the installation of wave energy converters in existing breakwaters in the north of Spain. Appl. Sci. 2019, 9, 5225. [Google Scholar] [CrossRef] [Green Version]
- Tethys. Mutriku Wave Power Plant. Available online: https://tethys.pnnl.gov/annex-iv-sites/mutriku-wave-power-plant (accessed on 30 August 2021).
- Mouffe, L.; De Rouck, J.; Verbrugghe, T.; Ranjitkar, G.; Obermann, E.; Wei, P.; Nielsen, K.; Magagna, D.; Soede, M.; De Roeck, Y.-H.; et al. Annual Report: An Overview of Ocean Energy Activities in 2017; IEA: Paris, France, 2017. [Google Scholar]
- Korea Institute of Ocean Science and Technology KIOST. Yongsoo OWC. Available online: https://openei.org/wiki/PRIMRE/Databases/Technology_Database/Devices/Yongsoo_OWC (accessed on 5 October 2021).
- Garanovic, A. Wave Swell Energy Deploys UniWave200 off Tasmania. Available online: https://www.offshore-energy.biz/wave-swell-energy-deploys-uniwave200-off-tasmania/ (accessed on 5 October 2021).
- Wave Swell Energy Ltd. WAVE SWELL. Available online: https://www.waveswell.com/ (accessed on 5 October 2021).
- Masuda, Y.; Yamazaki, T.; Outa, Y.; McCormick, M. Study of Backward Bent Duct Buoy. In Proceedings of the OCEANS ’87, Washington, DC, USA, 28 September–1 October 1987; pp. 384–389. [Google Scholar]
- Portillo, J.C.C.; Reis, P.F.; Henriques, J.C.C.; Gato, L.M.C.; Falcão, A.F.O. Backward bent-duct buoy or frontward bent-duct buoy? Review, assessment and optimisation. Renew. Sustain. Energy Rev. 2019, 112, 353–368. [Google Scholar] [CrossRef]
- DTI. Near Shore Floating Oscillating Wave Column: Prototype Development and Evaluation; DTI: Makati, Philippines, 2004.
- Parkin, P.; Payne, G.S.; Taylor, J.R.M. Numerical simulation and tank tests of the free-floating Sloped IPS Buoy. In Proceedings of the 5th European Wave Energy Conference, Cork, Ireland, 17–20 September 2003. [Google Scholar]
- Falcão, A.F.O.; Henriques, J.C.C.; Cândido, J.J. Dynamics and optimization of the OWC spar buoy wave energy converter. Renew. Energy 2012, 48, 369–381. [Google Scholar] [CrossRef]
- JAMSTEC. JAMSTEC Gallery. Mighty Whale. Available online: http://www.jamstec.go.jp/gallery/j/research/system/images/system_002_l.jpg (accessed on 6 August 2019).
- Wu, B.; Chen, T.; Jiang, J.; Li, G.; Zhang, Y.; Ye, Y. Economic assessment of wave power boat based on the performance of “Mighty Whale” and BBDB. Renew. Sustain. Energy Rev. 2018, 81, 946–953. [Google Scholar] [CrossRef]
- OES-Environmental. Mighty Whale. Available online: https://tethys.pnnl.gov/project-sites/mighty-whale (accessed on 6 October 2021).
- Washio, Y.; Osawa, H.; Ogata, T. The open sea tests of the offshore floating type wave power device “Mighty Whale”—characteristics of wave energy absorption and power generation. In Proceedings of the MTS/IEEE Oceans 2001—An Ocean Odyssey. Conference Proceedings (IEEE Cat. No.01CH37295), Honolulu, HI, USA, 5–8 November 2001; Marine Technology Society: Washington, DC, USA, 2002; Volume 1, pp. 579–585. [Google Scholar]
- Vicinanza, D.; Margheritini, L.; Kofoed, J.P.; Buccino, M. The SSG Wave Energy Converter: Performance, Status and Recent Developments. Energies 2012, 5, 193–226. [Google Scholar] [CrossRef] [Green Version]
- Yemm, R.; Pizer, D.; Retzler, C.; Henderson, R. Pelamis: Experience from concept to connection. Philos. Trans. R. Soc. A Math. Phys. Eng. Sci. 2012, 370, 365–380. [Google Scholar] [CrossRef] [Green Version]
- Poullikkas, A. Technology Prospects of Wave Power Systems. Electron. J. Energy Environ. 2014, 2, 47–69. [Google Scholar]
- Leijon, M.; Boström, C.; Danielsson, O.; Gustafsson, S.; Haikonen, K.; Langhamer, O.; Strömstedt, E.; Stålberg, M.; Sundberg, J.; Svensson, O.; et al. Wave energy from the North Sea: Experiences from the lysekil research site. Surv. Geophys. 2008, 29, 221–240. [Google Scholar] [CrossRef] [Green Version]
- Tarrant, K.; Meskell, C. Investigation on parametrically excited motions of point absorbers in regular waves. Ocean Eng. 2016, 111, 67–81. [Google Scholar] [CrossRef]
- Patel, S. Ocean Power Technologies Deploys Commercial PowerBuoy with Energy Storage. Available online: https://www.powermag.com/ocean-power-technologies-deploys-commercial-powerbuoy-energy-storage/ (accessed on 30 August 2021).
- Globe News Wire. Ocean Power Technologies Successfully Deploys APB350 PowerBuoy Off the Coast of Atlantic City, New Jersey; Ocean Power Technologies: Princeton, NJ, USA, 2015. [Google Scholar]
- Frangoul, A. In Scotland, Wave Energy Device Reaches Critical Milestone, Gears up for Testing. CNBC. Available online: https://www.cnbc.com/2021/06/25/wave-energy-device-reaches-critical-milestone-gears-up-for-testing-.html (accessed on 25 June 2021).
- Blackledge, J.; Coyle, E.; Kearney, D.; McGuirk, R.; Norton, B. Estimation of wave energy from wind velocity. Eng. Lett. 2013, 21, 158–170. [Google Scholar]
- Alfarsi, H. CETO System: Clean Electricity and Water Desalination Using Ocean Waves. Profolus. Available online: https://www.profolus.com/topics/ceto-system-clean-electricity-water-desalination-oceanic-waves/ (accessed on 28 May 2021).
- Hastie, H. Resurfacing: Collapsed WA wave energy company wants $5m for a rebirth. The Sydney Morning Herald. Available online: https://www.smh.com.au/topic/cce-cf (accessed on 17 April 2019).
- ARENA. Carnegie CETO 6 Technology. Available online: https://arena.gov.au/projects/carnegie-ceto-6-technology/ (accessed on 6 October 2021).
- Falnes, J. A review of wave-energy extraction. Mar. Struct. 2007, 20, 185–201. [Google Scholar] [CrossRef]
- Salter’s Nodding Duck. Available online: https://baonguyen1994.wordpress.com/introduction-to-wave-energy/ocean-wave-technologies/terminators/salters-nodding-duck/ (accessed on 9 August 2019).
- Thomson, R.C.; Chick, J.P.; Harrison, G.P. An LCA of the Pelamis wave energy converter. Int. J. Life Cycle Assess. 2019, 24, 51–63. [Google Scholar] [CrossRef] [PubMed] [Green Version]
- Wikipedia. Pelamis Wave Energy Converter. Available online: https://en.wikipedia.org/wiki/Pelamis_Wave_Energy_Converter (accessed on 30 August 2021).
- EMEC. Pelamis. Available online: http://www.emec.org.uk/about-us/wave-clients/pelamis-wave-power/ (accessed on 12 October 2021).
- Wang, L.G.; Ringwood, J.V. Control-informed ballast and geometric optimisation of a three-body hinge-barge wave energy converter using two-layer optimisation. Renew. Energy 2021, 171, 1159–1170. [Google Scholar] [CrossRef]
- Evans, P. Oyster Ocean Power System to Provide 1 GW by 2020. Available online: https://newatlas.com/oyster-ocean-power-system/11180/ (accessed on 12 October 2021).
- Poenaru, V.; Scurtu, I.C.; Dumitrache, C.L.; Popa, A. Review of wave energy harvesters. J. Phys. Conf. Ser. 2019, 1297, 012028. [Google Scholar] [CrossRef] [Green Version]
- EMEC. AQUAMARINE POWER. Available online: http://www.emec.org.uk/about-us/wave-clients/aquamarine-power/ (accessed on 12 October 2021).
- AW Energy. WAVEROLLER. Available online: https://aw-energy.com/waveroller/ (accessed on 30 August 2021).
- OES-Environmental. SURGE WaveRoller. Available online: https://tethys.pnnl.gov/project-sites/surge-waveroller (accessed on 6 October 2021).
- Energy Innovation Cluster. WAVESTAR. Available online: https://wavepartnership.dk/wavestar-0 (accessed on 30 August 2021).
- Jordan Wavestar-002. Available online: https://www.neozone.org/ecologie-planete/wavestar-la-centrale-electrique-qui-utilise-la-houle-pour-produire-de-lenergie/attachment/wavestar-002/ (accessed on 30 August 2021).
- Eco Wave Power. Photos. Available online: https://www.ecowavepower.com/gallery/photos/ (accessed on 30 August 2021).
- Zuini, P.; Cepellos, M. Startup usa ondas do mar para gerar energia. Pequenas Empresas & Grandes Negozios. 28 July 2015. Available online: https://revistapegn.globo.com/Banco-de-ideias/noticia/2015/07/startup-usa-ondas-do-mar-para-gerar-energia.html (accessed on 2 October 2021).
- Ocean Power Technologies. PB3 POWERBUOY. Available online: https://oceanpowertechnologies.com/pb3-powerbuoy/ (accessed on 6 October 2021).
- Kanellos, M. Pelamis Wave Power Jettisons Its CEO, Rough Waters Ahead? Green Light. Available online: https://web.archive.org/web/20091003125522/http://www.greentechmedia.com/green-light/post/pelamis-wave-power-jettisons-its-ceo-rough-waters-ahead (accessed on 29 September 2009).
- Ecthelion. Norwave Wave Power Plant. Available online: https://sketchfab.com/3d-models/norwave-wave-power-plant-482851fc4c8041d99d456289c01dc764 (accessed on 12 October 2021).
- Bak, P.; Peter, J.; Frigaard, P.; Kofoed, J.P.; Knapp, W.; Department of Civil Engineering Aalborg University; Technical University of Munich. Wave Dragon: Wave power plant using low-head turbines. In Proceedings of the Hidroenergia 04: International Conference and Exhibition on Small Hydropower General, Falkenberg, Sweden, 17–19 June 2004. [Google Scholar]
- Tedd, J.; Kofoed, J.P. Measurements of overtopping flow time series on the Wave Dragon, wave energy converter. Renew. Energy 2009, 34, 711–717. [Google Scholar] [CrossRef]
- Buccino, M.; Banfi, D.; Vicinanza, D.; Calabrese, M.; Del Giudice, G.; Carravetta, A. Non breaking wave forces at the front face of Seawave Slotcone Generators. Energies 2012, 5, 4779–4803. [Google Scholar] [CrossRef]
- Shintake, T. OIST Wave Energy Project. Available online: https://groups.oist.jp/qwmu/oist-wave-energy-project (accessed on 2 October 2021).


| Ocean Energy | Capacity (GW) | Potential Generation (TWh/y) |
|---|---|---|
| Tide | 90 | 800 |
| Marine currents | 5000 | 50,000 |
| Osmotic salinity | 20 | 2000 |
| OTEC | 1000 | 10,000 |
| Sea wave | 1000–9000 | 8000–80,000 |
| Code | Characteristics | |
|---|---|---|
| 0 | 0 | Calm (glassy) |
| 1 | <0.1 | Calm (rippled) |
| 2 | 0.1–0.5 | Smooth (wavelets) |
| 3 | 0.5–1.25 | Slight |
| 4 | 1.5–2.5 | Moderate |
| 5 | 2.5–4 | Rough |
| 6 | 4–6 | Very rough |
| 7 | 6–9 | High |
| 8 | 9–14 | Very high |
| 9 | >14 | Phenomenal |
| Project | Country | Position | Inst. | Power | Status | Note | Ref. |
|---|---|---|---|---|---|---|---|
| Kværner Brug’s OWC | Toftesfallen (Norway) | Fixed Onshore | 1985 | 500 kW | Decommissioned | Damaged by a severe storm in 1988. 29 MWh produced. | [32,42,43,44] |
| Vizhinjam OWC | Trivandrum (Kerala, India) | Fixed Nearshore | 1990 | 150 kW | Decommissioned in 2011 | Production under the expectation, with high variability. Inactive for a long period. | [45,46,47] |
| Limpet | Islay (Scotland, UK) | Fixed Onshore | 2000 | 500 kW | Decommissioned in 2012 | High level of noise. The attenuation causes malfunctions. | [50,51] |
| Pico OWC | Pico Island (Azores, Portugal) | Fixed Onshore | 1999 | 400 kW | The project concluded in 2018 | Malfunction due to the Wells turbine and its supports. | [50,52] |
| Mutriku plant | Mutriku (Spain) | Fixed Onshore (harbor integrated) | 2011 | 296 kW | Operating | Total electrical production 2.1 GWh (end of September 2020) | [53,54] |
| REWEC3 | Civitavecchia (Italy) | Fixed Onshore (harbor integrated) | 2016 | 2.5 MW | Operating | Annual production between 500 and 800 MWh/y | [3,37,55] |
| Yongsoo plant | Jeju Island (Republic of Korea) | Fixed Offshore (1 km to the coastline) | 2016 | 500 kW | Operating | Adoption of two impulse turbines, connected to different generators | [3,56] |
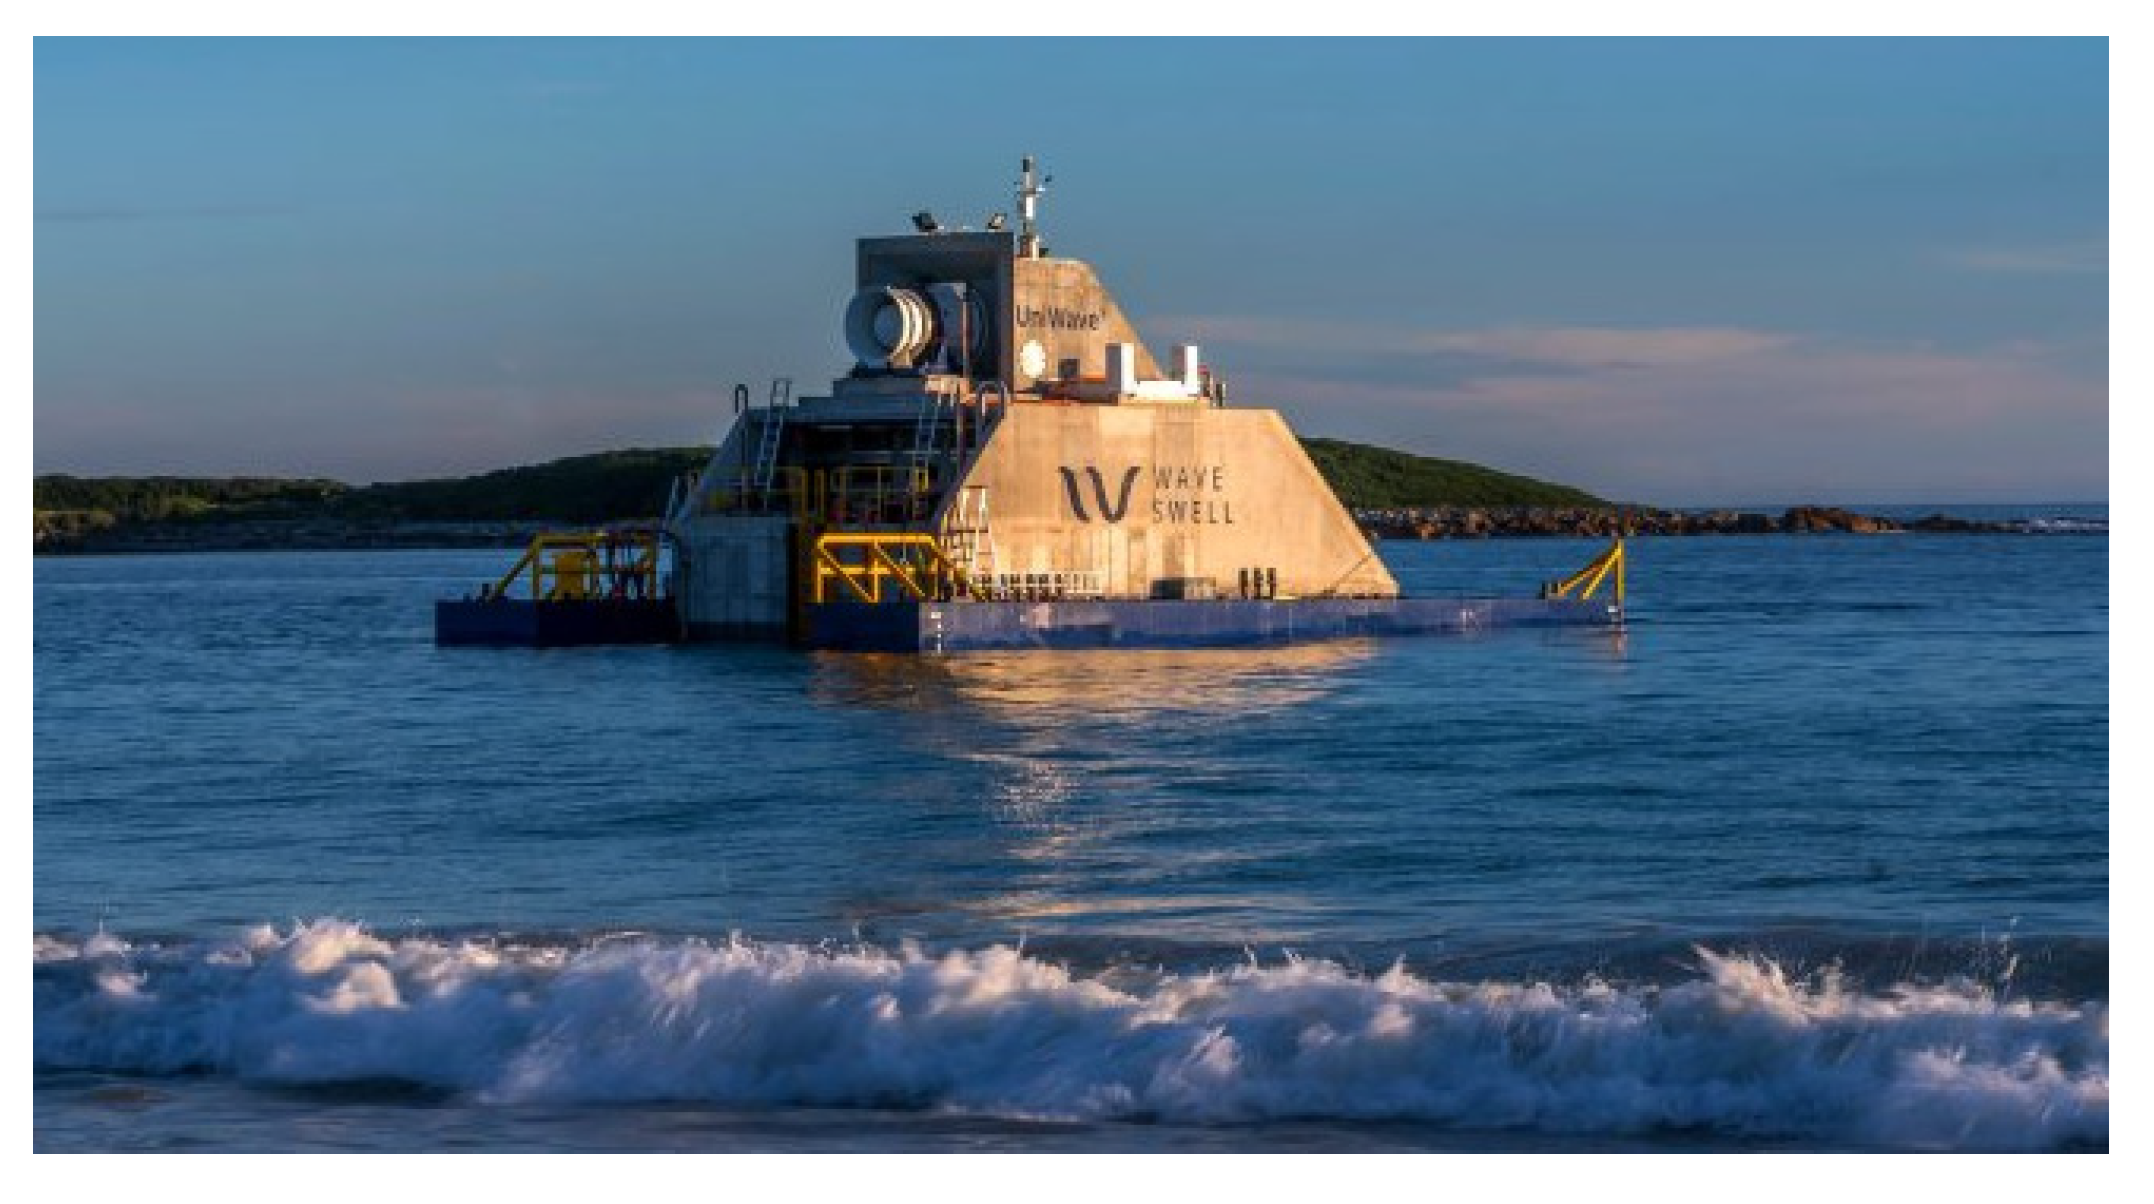
| Wave Swell | King Island (Tasmania, Australia) | Fixed Nearshore (100 m to the coastline) | 2019 | 200 kW | Operating | The device will test for a year | [57,58] |
| Backward Bent-Duct Buoy | Japan | Floating | 1960–70 | Concept | [32,59,60] | ||
| Sloped IPS Buoy | Edinburgh (UK) | Floating | 1970–80 | Concept | [61,62] | ||
| Spar Buoy | Portugal | Floating | 2000–15 | Concept | [61,63] | ||
| Mighty Whale | Gokasho Bay (Japan) | Floating Offshore (1.5 km to the coastline) | 1998 | 120 kW | Decommissioned in 2002 | [64,65,66,67] |
| Project | Country | Position | Inst. | Power | Status | Note | Ref. |
|---|---|---|---|---|---|---|---|
| Lysekil Project | Lysekil (Sweden) | Offshore (2 km to the coastline) | 2006 | 30 kW (10 kW each) | Operating | Currently operating and enlarged with 2 WEC (June 2009) | [32,70,71] |
| Wavebob | Galway Bay (Ireland) | Offshore | 1999 | Prototype scale 1:4 | Decommissioned in 2015 | In 2013 end of the funding | [32,72] |
| Powerbuoy | Atlantic City (New Jersey, USA) | Offshore (22.5 km to the coastline) | 2005 | Up to 7.5 kW | Operating | Upgrade in 2020 with photovoltaic panels | [32,70,73,74,95] |
| Archimedes Wave Swing | Portugal | Offshore | 2004 | Pilot plant | Decommissioned | Available upgrade up to 16 kW | [32,75,76] |
| CETO 6 | Albany, Western Australia | Offshore | 2014 | 1.5 MW | Discontinued | Project discontinued on 31 October 2019 | [77,78,79] |
| Salter’s Nodding Duck | Edinburgh (UK) | Nearshore | 1970–1980 | Concept | [80,81] | ||
| Pelamis P1 | Aguçadoura, Portugal | Offshore (5 km to the coastline) | 23 September 2008 | Three devices (750 kW each) 2.25 MW | Decommissioned November 2008 | Worked only for two months due to technical failures on bearings. Financial problems blocked the activities | [32,96] |
| Oyster 2 | EMEC Orkney (UK) | Nearshore | 2012 | 800 kW | Decommissioned | The plant worked until 2015 when the company ceased trading | [86,87,88] |
| Waveroller | Järvenpää (Finland) | Nearshore (0.3–2 km from the shore) | 2015 | 350 kW | Project ended | The project ended in October 2013, leaving the device in situ for monitoring | [89,90] |
| Wavestar | Hanstholm (Denmark) | Nearshore (300 m from the shore) | 2009 | 600 kW | Decommissioned | The plant was taken down in 2013 | [32,91,92] |
| Eco Wave | Gibraltar | Onshore | 2016 | 100 kW | Operating | [3,93] | |
| Seahorse | Pecem (Brazil) | Onshore | 2012 | 50 kW | Operating | [3,94] |
| Project | Country | Position | Inst. | Power | Status | Note | Ref. |
|---|---|---|---|---|---|---|---|
| Tapchan | Toftestallen (Norway) | Onshore (3 m above sea level) | 1985 | 350 kW | Decommissioned in 1991 | Damaged by a storm in1988 | [32,97] |
| Wave Dragon | Nissum Bredning (Denmark) | Nearshore | 2003 | 20 kW (scale 1:4.5) | Decommissioned | [32,70,99] | |
| Seawave slot-cone generator | Norway | Onshore | Planned but not realized | [3,100] | |||
| OIST-WEC | Kandooma Island (Maldives) | Nearshore | 2018 | 8 kW | Operating | [101] |
Publisher’s Note: MDPI stays neutral with regard to jurisdictional claims in published maps and institutional affiliations. |
© 2021 by the authors. Licensee MDPI, Basel, Switzerland. This article is an open access article distributed under the terms and conditions of the Creative Commons Attribution (CC BY) license (https://creativecommons.org/licenses/by/4.0/).
Share and Cite
Curto, D.; Franzitta, V.; Guercio, A. Sea Wave Energy. A Review of the Current Technologies and Perspectives. Energies 2021, 14, 6604. https://doi.org/10.3390/en14206604
Curto D, Franzitta V, Guercio A. Sea Wave Energy. A Review of the Current Technologies and Perspectives. Energies. 2021; 14(20):6604. https://doi.org/10.3390/en14206604
Chicago/Turabian StyleCurto, Domenico, Vincenzo Franzitta, and Andrea Guercio. 2021. "Sea Wave Energy. A Review of the Current Technologies and Perspectives" Energies 14, no. 20: 6604. https://doi.org/10.3390/en14206604