1. Introduction
Proton exchange membrane fuel cell (PEMFC) is one of the most suitable candidates for replacing internal combustion engine (ICE) due to its high power density, zero emissions, and low operation temperature [
1]. However, if the fuel of fuel cell vehicle (FCV), hydrogen, is produced from fossil fuel or by-products, it will inevitably contain some impurities, such as N
2 [
2], CO [
2,
3,
4,
5], H
2S [
5,
6,
7,
8,
9], CO
2 [
5,
7,
8,
9,
10], SO
2 [
11], and/or NH
3 [
5,
12,
13,
14,
15,
16], etc. These impurities have potential negative influences on the performance of PEMFC.
Among the impurities, ammonia (NH
3) is a common contaminant not only in the hydrogen-rich fuel stream [
12] but also in ambient air in some special places, such as heavy traffic tunnels and the livestock industry. At least four different research groups have published papers regarding the ammonia contamination of PEMFC [
13,
14,
15,
16]. Uribe, F.A et al. [
13], Soto, H.J et al. [
14], Gomez, Y.A et al. [
15], and Halseid, R et al. [
16] focused on studying the poisoning of cells in operation and recovery after exposure to ammonia in H
2. The poisoning mechanism was only partly identified.
Uribe, F.A et al. [
13] found that the cell resistance measured by high frequency resistance (HFR) was more than doubled when the cell was exposed to 30 ppm NH
3 in H
2 for 15 h. Exposure to 30 ppm ammonia for about 1 h resulted in performance loss, which was recoverable in about 18 h. Extended exposure to 30 ppm NH
3 for 17 h was not fully recoverable within 4 days of operation on pure H
2. Through a cyclic voltammetry (CV) test, no electrochemically active adsorbed contaminant could be identified on either the anode or the cathode. It was suggested that the observed performance loss was due to a loss of proton conductivity in the anode catalyst layer.
In the work of Soto, H.J et al. [
14], the cell resistance was monitored by an automated current interrupt technique. Exposure to 200 ppm NH
3 in H
2 for 10 h increased the measured cell resistance by about 35%, much less than that observed by Uribe, who used a lower concentration of NH
3. CVs recorded on the anode did not reveal any electrochemically active species. Soto, similarly to Uribe, suggested that ammonium interfered primarily with the anode. Gomez, Y.A et al. [
15] also found that 200 ppm NH
3 in H
2 rapidly decreases the voltage of the fuel cell. The cell voltage at a constant current density of 0.1 A/cm
2 decreases from 0.83 V to 0.54 V during a 100 min period, resulting in a total voltage decay of 290 mV.
Halseid, R et al. [
16] found that the poisoning of PEMFCs by NH
3 would take 24 h or more to reach a steady state with 10 ppm NH
3 in H
2. In some cases, no steady state was reached during the experiment. The performance loss was in most cases reversible, but only after operation on high-purity H
2 for several days. The introduction of 1 ppm NH
3 resulted in significant performance loss. The performance loss was higher than could be explained by the observed increase in ohmic resistance in the cell. There is also a significant effect of ammonium on the ORR on the cathode.
In the present work, five different concentrations of NH
3 in air were added to the cathode of a cell, and four different concentrations of NH
3 in H
2 were added to the anode. Effects of NH
3 on both the anode and the cathode were studied over a long period (40 h on cathode and more than 100 h on anode) of durability tests. Uribe, F.A et al. [
13], Soto, H.J et al. [
14], and Gomez, Y.A et al. [
15] studied the effect of relatively high contamination levels (200 ppm, 13–130 ppm, and 200–1000 ppm, respectively). Halseid, R et al. [
16] studied FCs contaminated with lower levels of NH
3 in the H
2 (1–20 ppm). In this work, we studied even lower concentrations of NH
3 in H
2, such as 0.25–10 ppm.
The change in cell impedance was investigated by electrochemical impedance spectroscopy (EIS) tests. To reveal change in electrochemically active species of a cell poisoning with NH3, CV tests were carried out. Furthermore, a tolerant limit of NH3 in H2 for fuel cells (FCs) was suggested from experimental data of the durability tests.
3. Results and Discussion
3.1. Effect of NH3 on the Cathode
A typical cell response to exposure to air containing five different concentrations of NH
3 ranging from 1.0 to 100 ppm is shown in
Figure 2. The cell was operated galvanostatically at 500 mA/cm
2 and allowed to stabilize before NH
3 was added to air for 30–40 h. Each concentration of ammonia introduction was continued until the cell voltage dropped to a stable value.
It can be noticed that the cell performance decreased instantaneously when NH3 was added to the cathode, and the cell voltage drop rate increased with the concentration of NH3. It can be also found that the cell voltage decreases operating with neat air as the running time increases because of the unstable and unsuitable operation conditions, unbalanced thermos-water management, slowly but certainly proceeding material aging process. However, in the V-t curve of 1.0 ppm of NH3, the cell voltage dropped from 0.734 V to 0.712 V in 30 h, and in that of 100 ppm of NH3, the cell voltage dropped to 0.415 V in 1 h.
Figure 3 shows that the cell voltage at the constant current changes with different tests. It can be seen that the cell voltage rapidly decreases after adding the NH
3. After turning off the NH
3 addition, we carried out the following tests: V-I test, operating with neat air, and CV scan. The cell voltage had little change after the V-I test but recovered to 0.620 V after operating with neat air for 1.5 h. However, through CV scanning, the cell voltage could be recovered to 0.720 V, with a recovery rate of 98.2%.
When the cell voltage dropped to a stable state after poisoning with NH
3, the addition of NH
3 was turned off, and then a V-I test was carried out. The V-I test results were shown in
Figure 4. It can be seen that the polarization loss is closely linked with the NH
3 concentration, and the influence is much more severe when the concentration of NH
3 is above 5.0 ppm. Moreover, the cell could no longer work efficiently at the current density of 900 mA/cm
2, if the NH
3 concentration was 5.0 ppm. Similarly, the cell would lose its work ability at 700 mA/cm
2 under the effect of 20 ppm of NH
3, and at 600 mA/cm
2 under the effect of 100 ppm of NH
3.
3.2. Effect of NH3 on the Anode
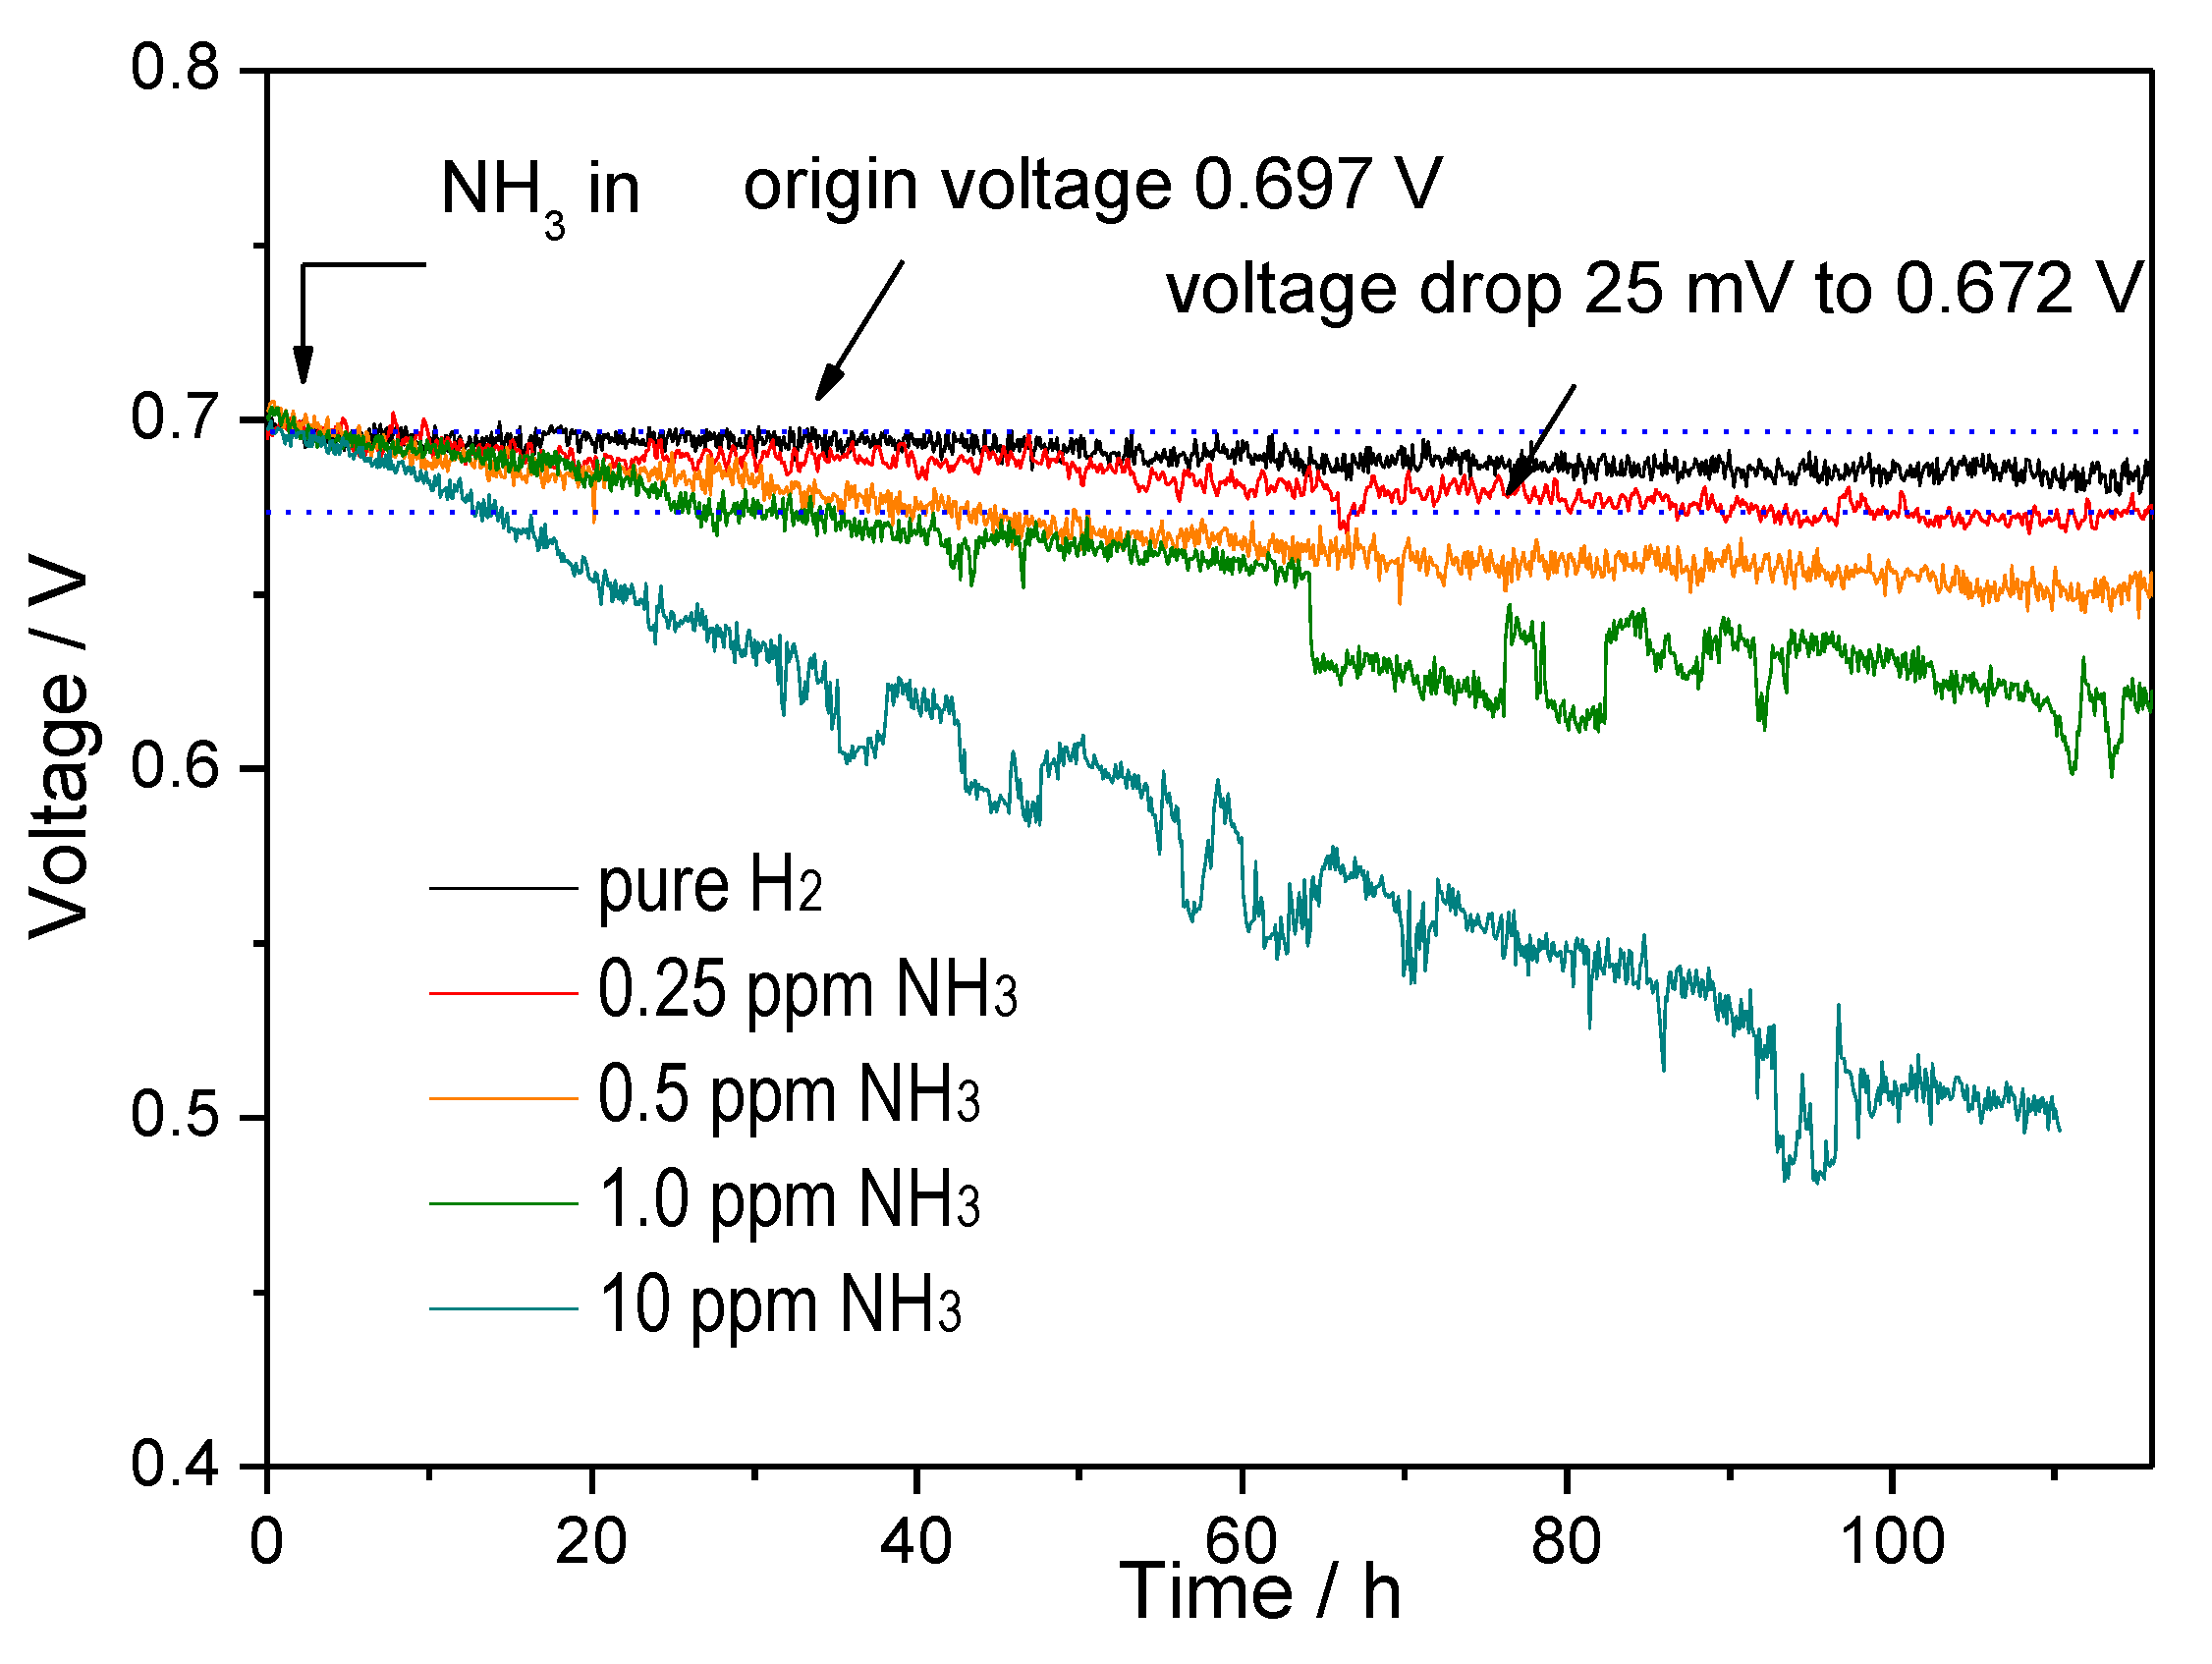
In
Figure 5, the results of contamination of a cell with four different concentrations of NH
3 in fuel are shown. The cell was discharged at 500 mA/cm
2 and the addition of NH
3 was continued for more than 100 h.
It can be seen that, in each curve, the voltage drop rate remained approximately constant with the addition of NH
3. For the same reason as operating with neat air, the voltage with pure H
2 also decreases. However, the voltage would fluctuate occasionally, which could be attributed to the adsorption of NH
3 in the membrane. When NH
3 was adsorbed in the membrane, reaction between NH
3 and H
+ took place (R1), and ammonium would be formed, which would reduce the acidity and proton conductivity of the membrane [
17]. In that case, the transfer of proton would be blocked. Simultaneously, NH
3 would be swept by H
2 and H
2O stream intermittently. The adsorption and desorption of NH
3 cost the fluctuation of cell voltage, which is chemisorption.
The voltage drop rate increased with the NH3 concentration. For example, in the curve of 0.25 ppm of NH3, the voltage drop from 0.697 V to 0.67 V in 100 h, the voltage drop rate is 0.27 mV/h. In the curve of other concentrations, the voltage drop rates are 0.54 mV/h for 0.5 ppm of NH3, 0.8 mV/h for 1.0 ppm of NH3, and 2.0 mV/h for 10 ppm of NH3.
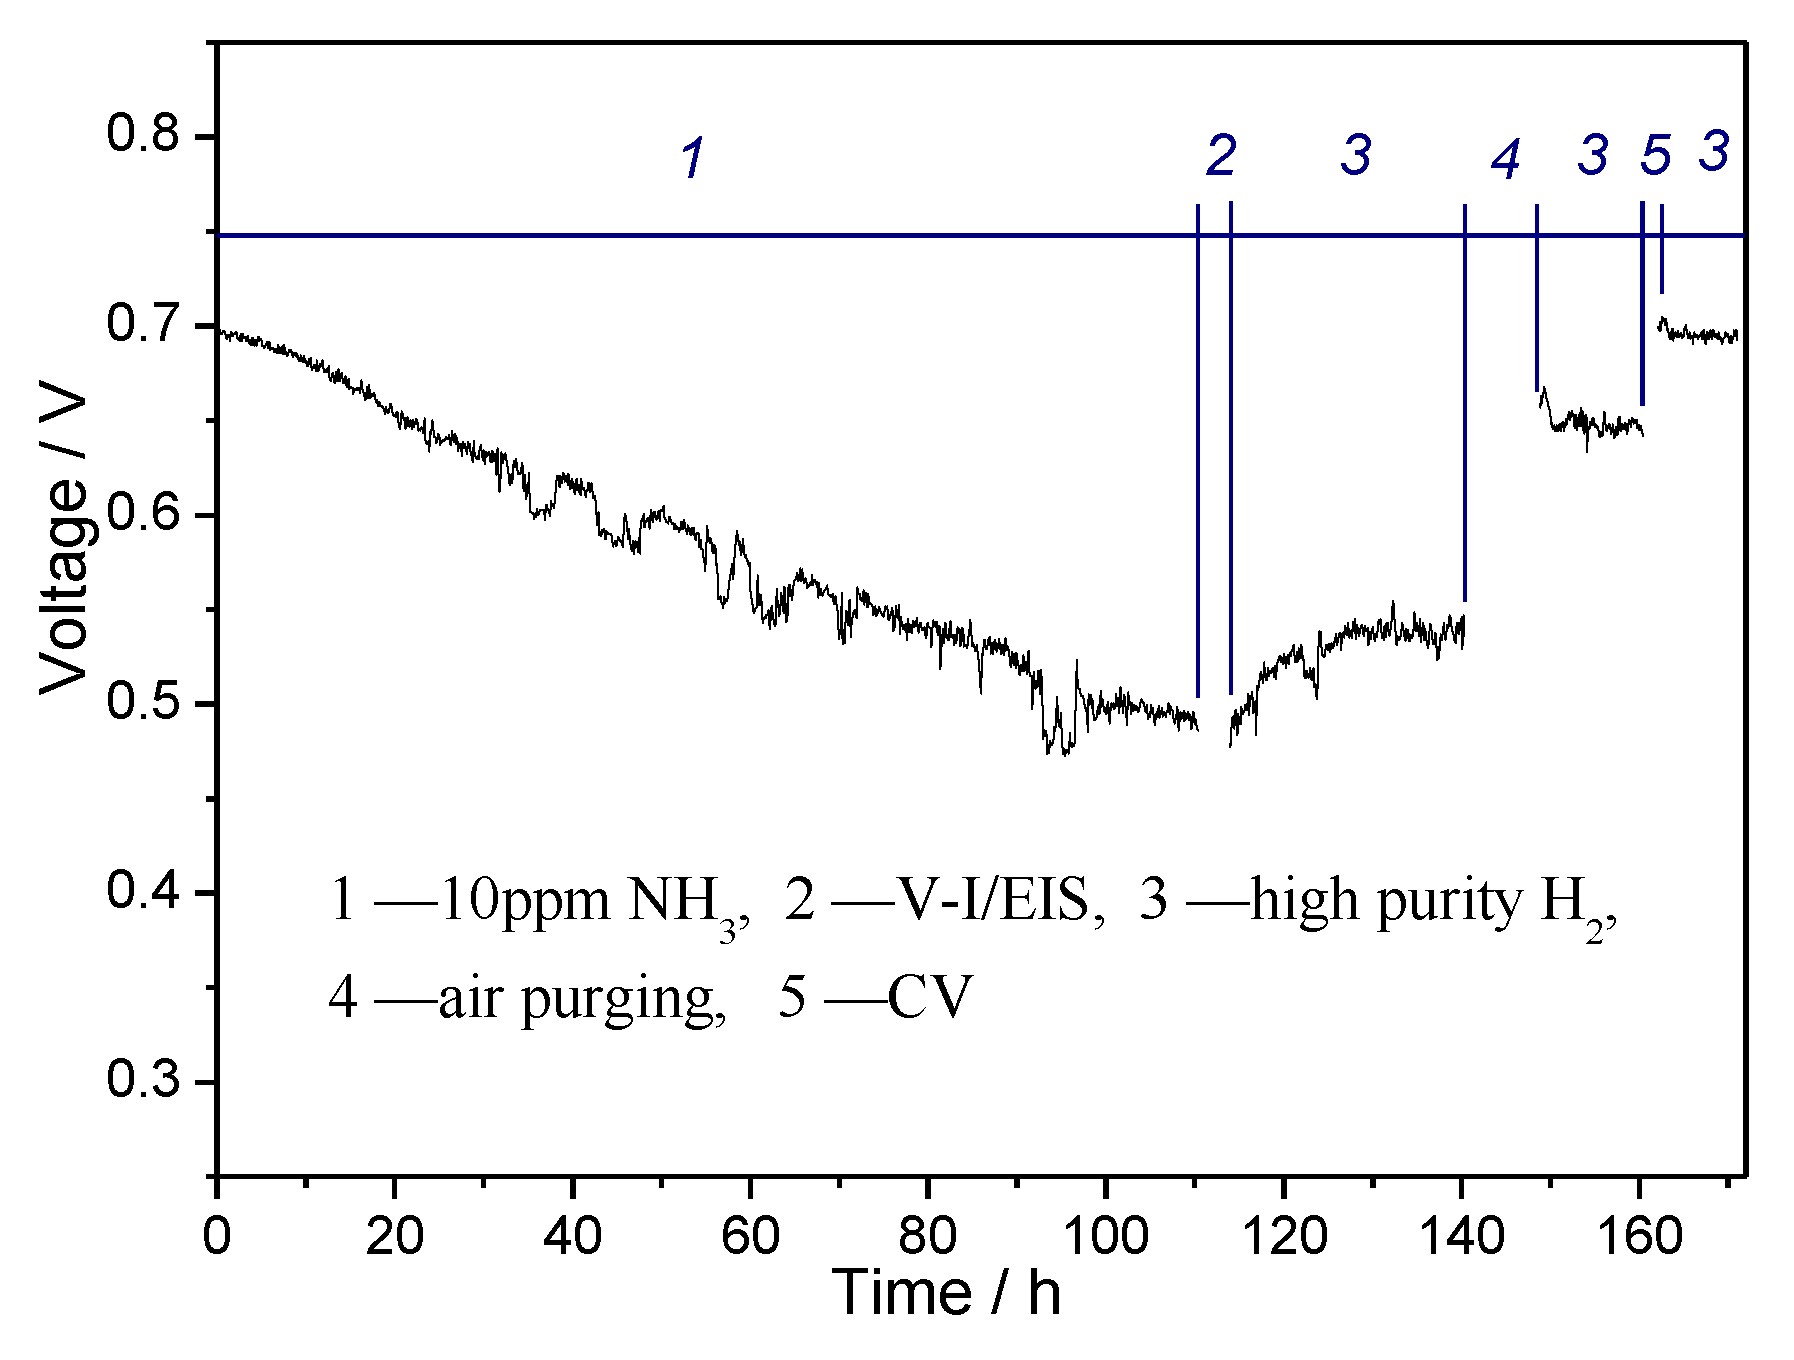
Serial tests were performed to study the recovery of cell performance after exposed to 10 ppm NH
3/H
2 for more than 100 h. As seen in
Figure 6, the cell was recovered through (a) cutting off NH
3 and carrying out the polarization curve test and EIS test, (b) running with pure H
2, (c) purging the anode with clean air, (d) and testing with CV. It was found that after the NH
3 poisoning, the cell voltage dropped to ca. 0.492 V, and even discharged with high-purity H
2 for as long as 24 h, the cell voltage was lightly recovered. It merely rosed from 0.492 V to 0.539 V, i.e., 77.3% of the original value. After being purged with clean air for 10 h, the cell voltage was further recovered to 0.647 V, i.e., 92.8% of the original value. After CV scan, the cell voltage could be recovered to 0.686 V, i.e., 98.4% of the original value. During the composite processes treatment, the anode surface was cleaned with moist H
2 at first; meanwhile, some NH
4+ cations could be washed out. When clean air was introduced, with CV scan in higher potential, the substance adsorbed on the surface was removed. Therefore, cell performance was mostly, if not completely, recovered.
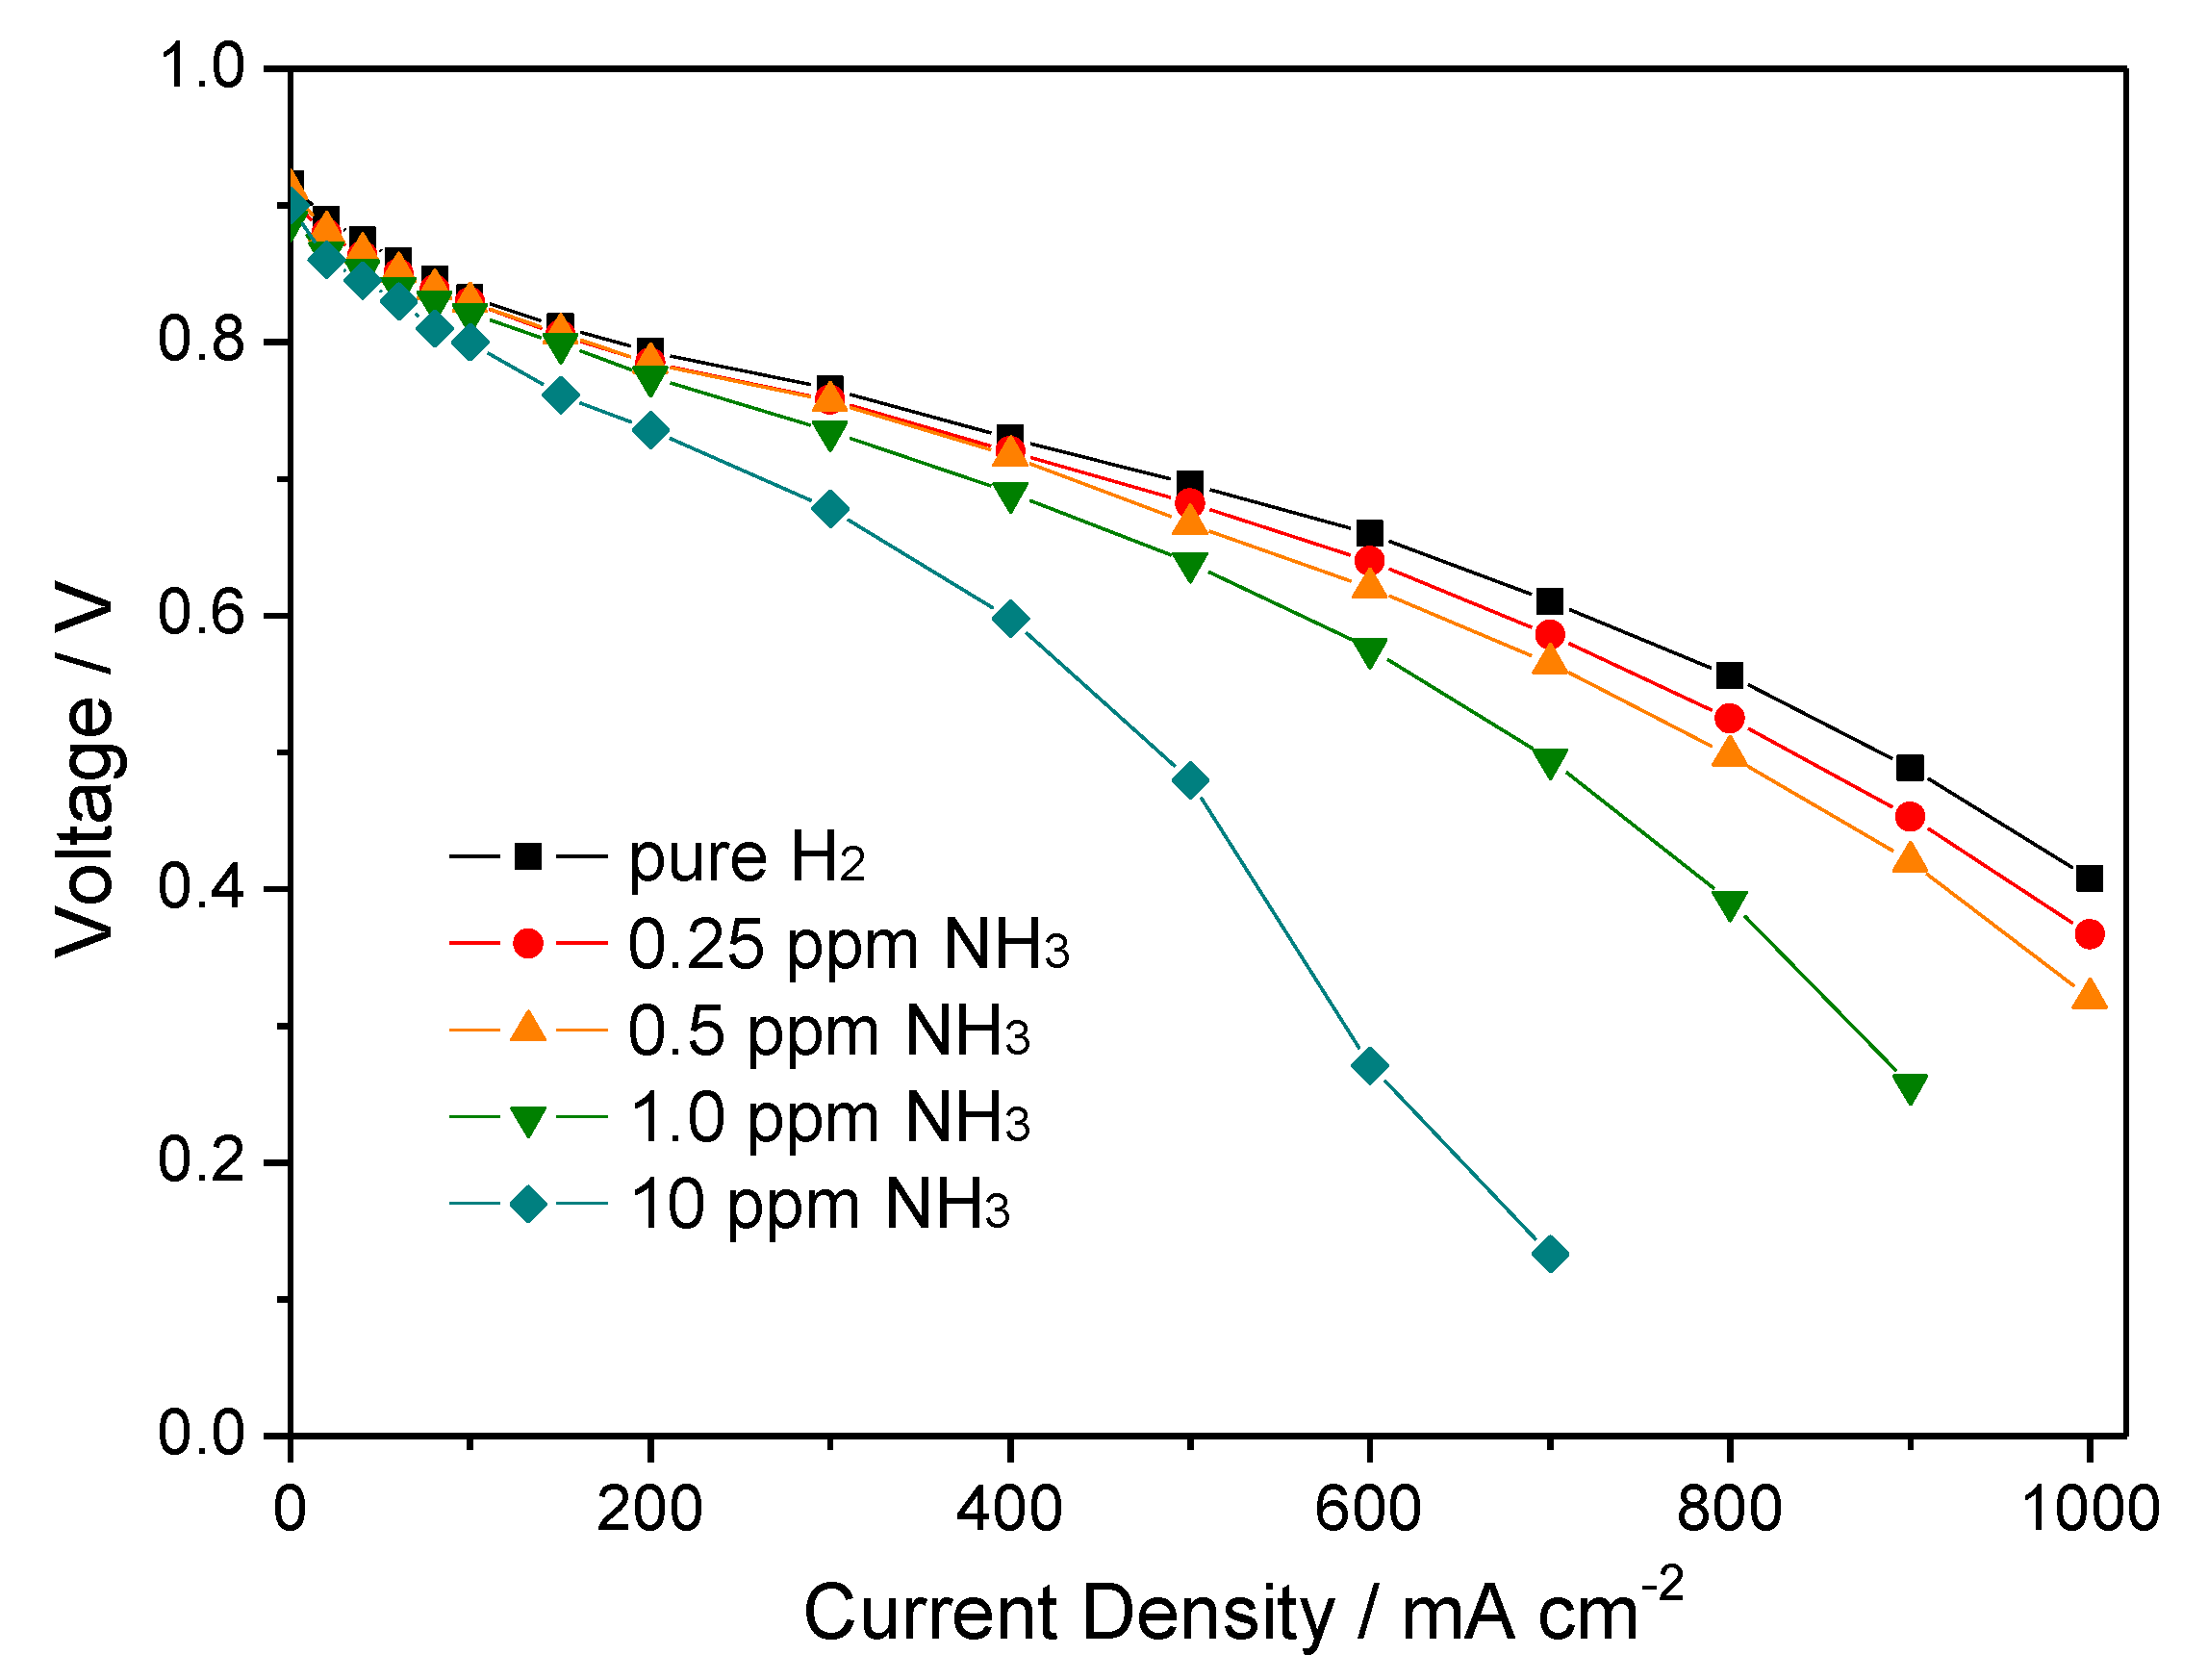
Figure 7 shows the polarization curves after poisoning with different concentrations of NH
3/H
2. Each polarization test was carried out 100 h after the addition of NH
3. It seems that the polarization losses did not strengthen too much in the curves of 0.25 ppm and 0.5 ppm of NH
3. However, it was much more severe when 1 ppm or higher concentrations of NH
3 were introduced into the anode. Compared to the effect of NH
3 in air, it was found that the polarization losses were much more severe with the same concentration levels in H
2.
3.3. Recovery Mechanism Study
3.3.1. Impedance Study
In order to clarify the effect of NH
3 in air and H
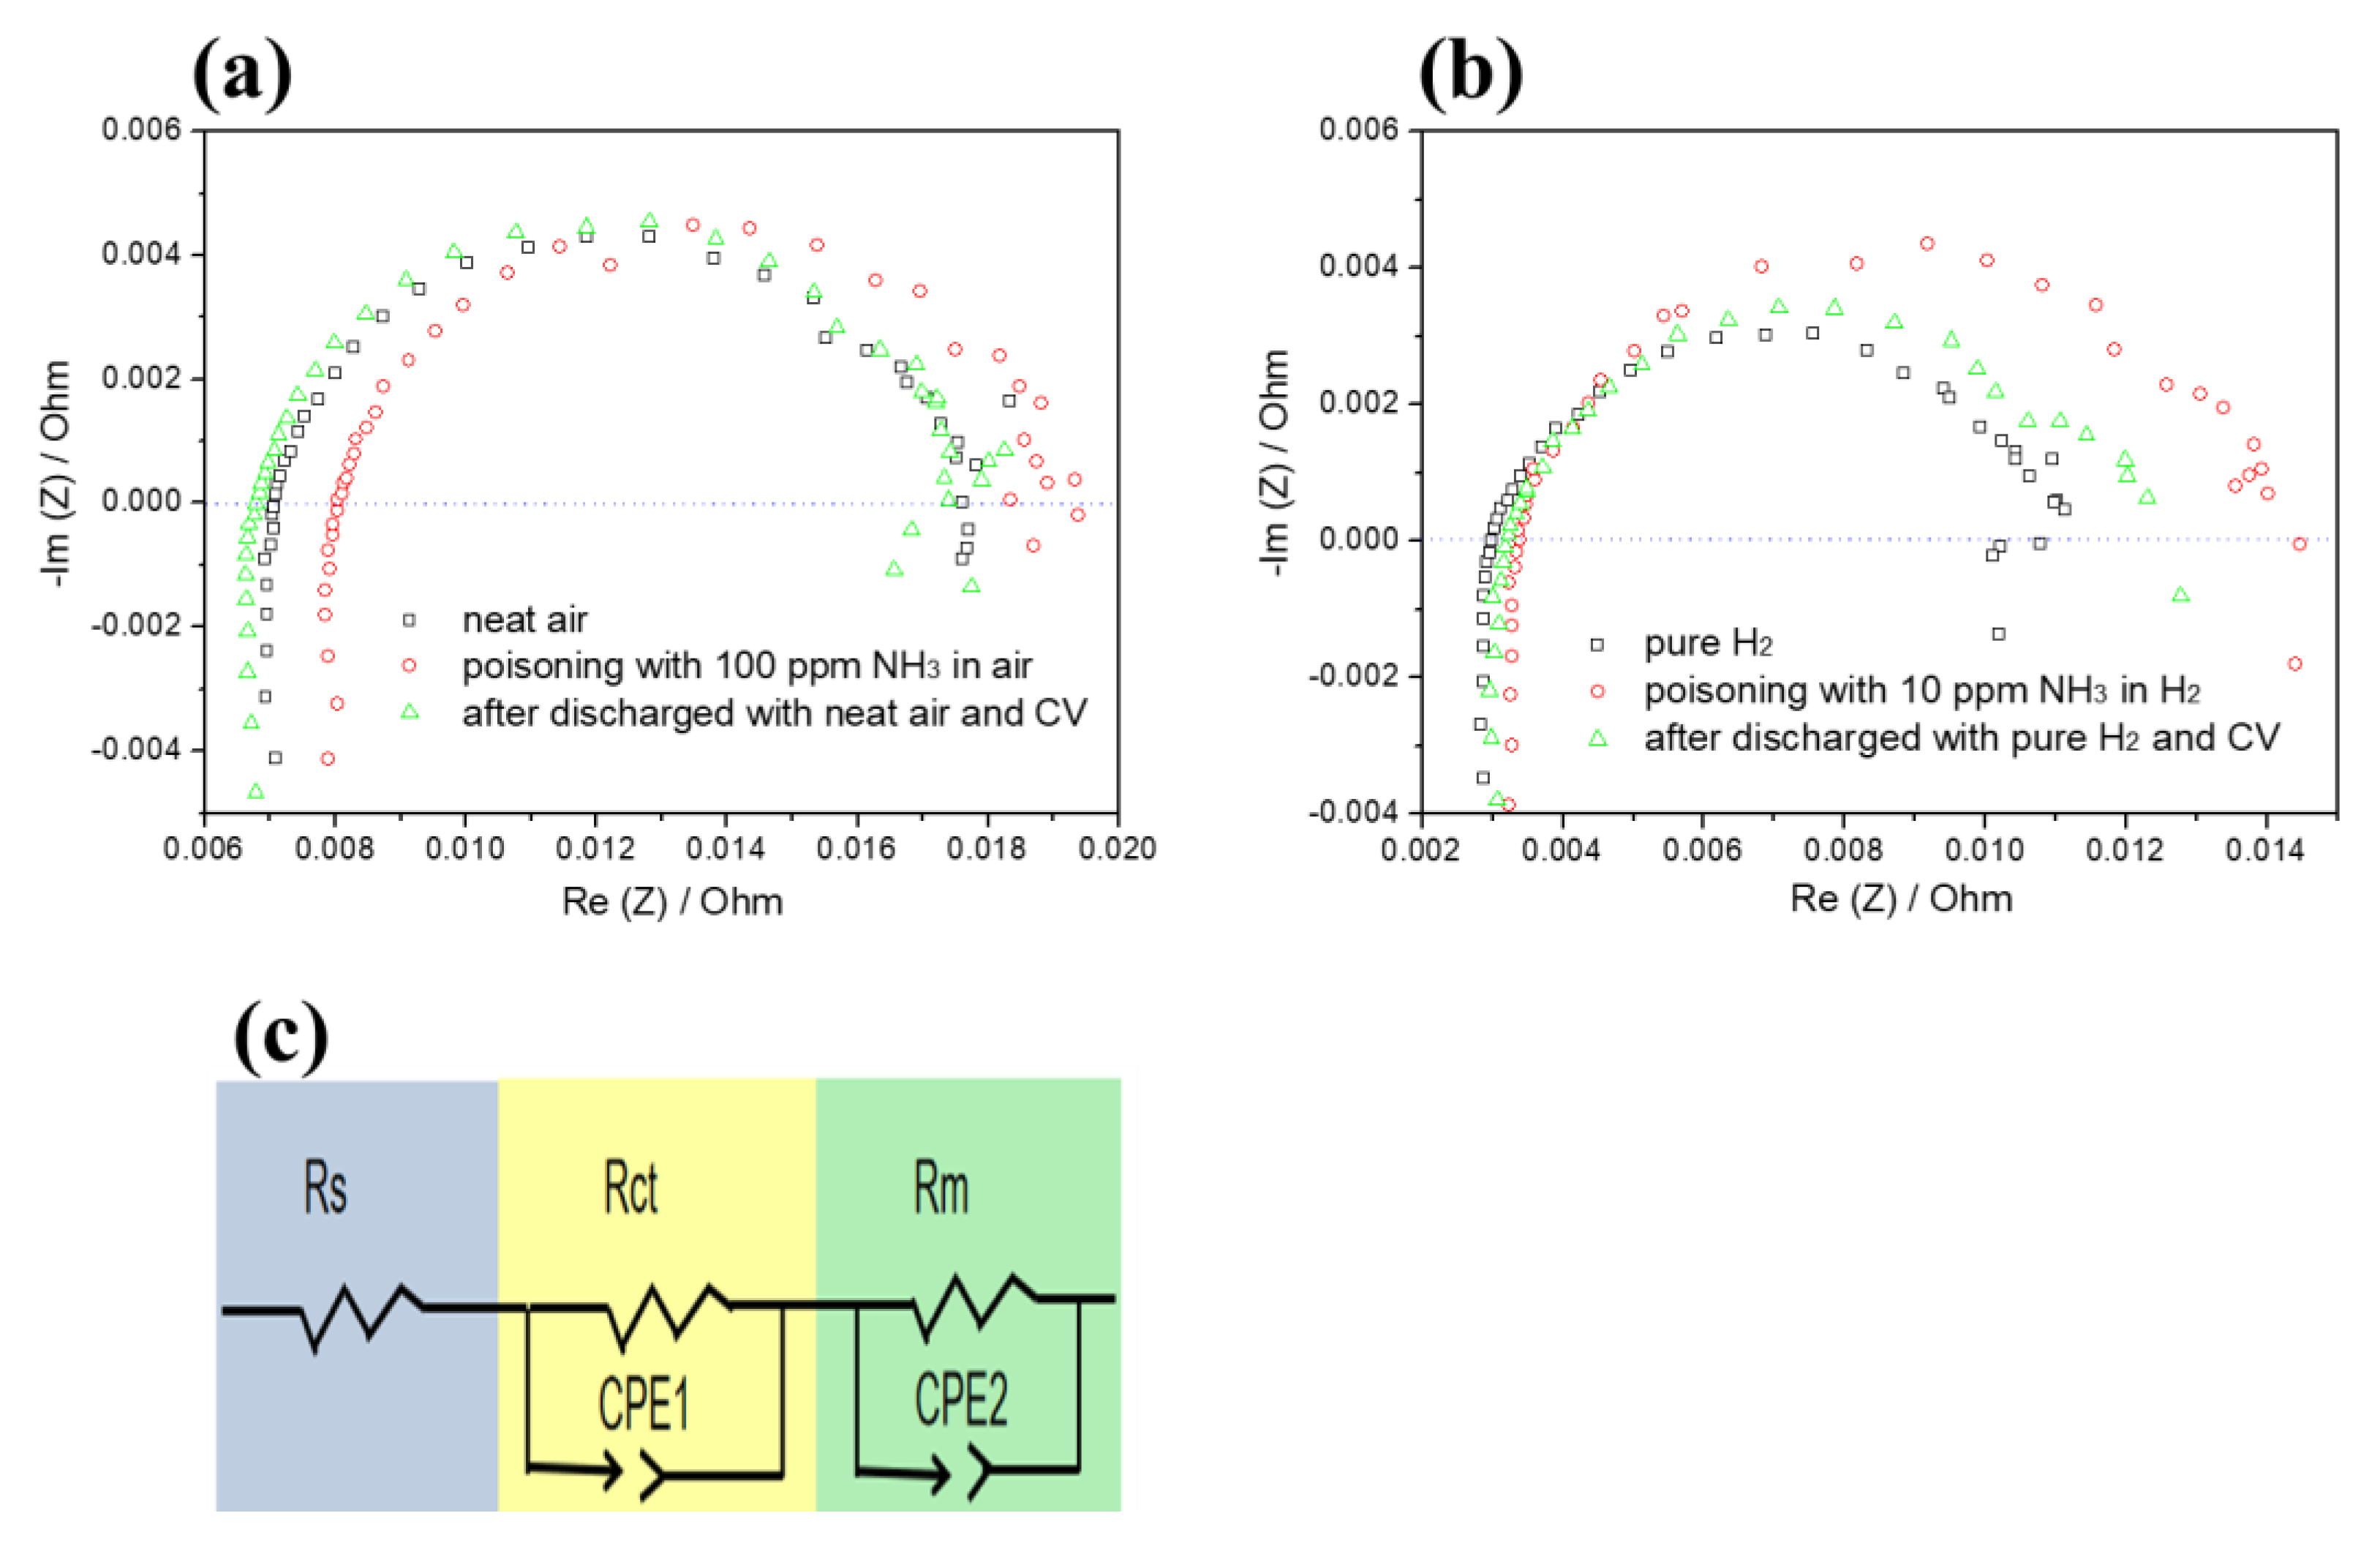
2 on the impedance of PEMFC, EIS tests were carried out to study the impedance changes during the durability tests. Nyquist plots drawn in EIS tests show the same pattern as shown in
Figure 8a,b: an inductive line at a high frequency range and a depressed capacitive semicircle at intermediate and low frequency ranges [
18,
19]. The inductive lines intersecting with the real axis correspond to the total ohmic resistance of the cell. This single semicircle loop, often called the “kinetic loop”, occurs when the electrode process is dominated only by the interfacial kinetics of the ORR process. The radii of the semicircle show the polarization resistance of the cell. The electrochemical parameters (
Table 1) of the MEAs were analyzed via an equivalent circuit (EC) method (
Figure 8c). R
ct represents the charge transfer resistance of the ORR; R
s represents the total ohmic resistance of the cell, which can be expressed as the sum of the contributions from contact resistances between components and ohmic resistances of the cell components; R
m represents the mass transfer impedance.
In
Figure 8a, three Nyquist plots of the cathode under different states are shown: in clean air, after being poisoned by 100 ppm of NH
3, and after being discharged with clean air and CV scanned.
Under the effect of NH
3, the R
s increases; however, the capacitive semicircle varies slightly. This means the impedance change is mainly attributable to the increase of ohmic resistance, which is due to the NH
4+ absorption on the surface of catalyst and its transfer into the membrane. After the addition of NH
3 was shut down, the cell was discharged with neat air for 3 h, and the cathode was scanned by CV; the impedance spectra were greatly recovered. The immovability in polarization resistance showed that the Pt/C catalyst was not affected by NH
3. However, in the catalysis of Pt/C, NH
3 could be oxidized to N
2 or nitrogen oxides, and then be swept out of the cathode by air flow and water. The Reactions are proposed as follows:
Figure 8b shows the impedance test results of cell poisoning with 10 ppm NH
3 in H
2 recovered by certain methods, such as purging with pure H
2 and CV scanning.
It can be seen that both the ohmic and polarization resistance increased with the addition of NH
3. After the methods mentioned above were taken to recover the cell, the polarization resistance decreased but could not return to the original level, as well as the ohmic resistance. This means that some of the NH
3 added to the anode was absorbed in the membrane. Ammonium formed by reaction (R1) could not be easily swept out of the membrane, which caused the increase in ohmic resistance. Other NH
3 might be adsorbed by Pt/C catalyst [
20], which caused the increase in polarization resistance. Under the oxidation circumstance of the anode and the absence of oxygen, the adsorbed NH
3 molecule can be oxidized by losing one or two proton(s):
3.3.2. Cyclic Voltammetry Study
CV was employed to investigate the adsorption and desorption of NH
3 on the surface of Pt, because it is a sensitive tool for the diagnostic of the surface state change, including the determination of the electrochemical active surface (EAS) of an electrode [
21,
22].
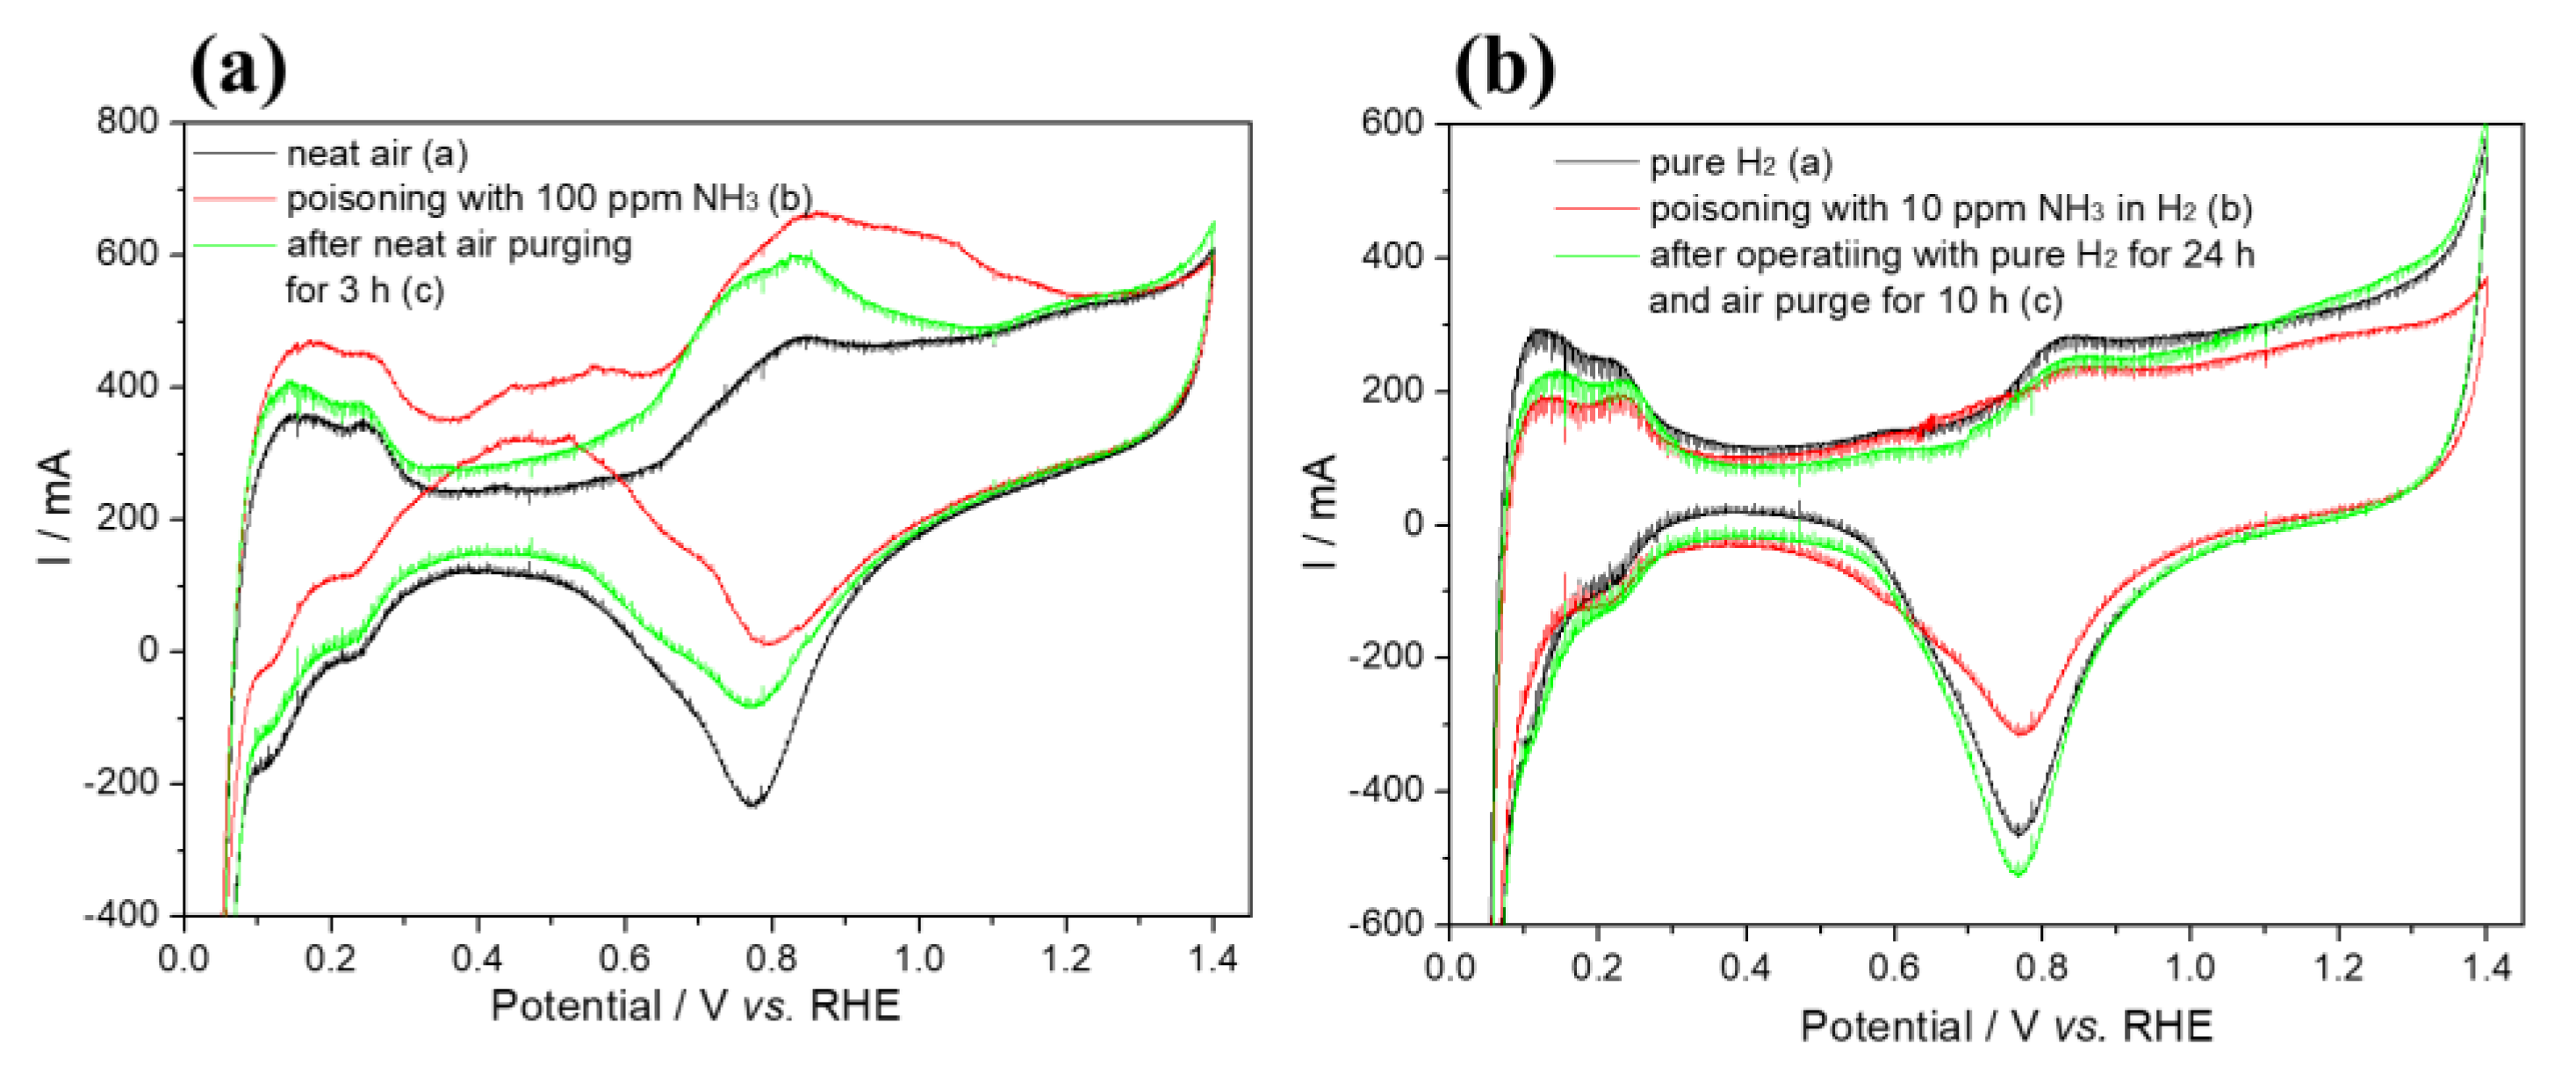
In
Figure 9a combined with the
Table 2, the CV results of a cell poisoning with 100 ppm NH
3 in air for 2 h (curve b) and then discharged with neat air for 3 h (curve c) are shown, as well as the one tested with pure H
2 (reference curve a). With the contamination of 100 ppm NH
3, the CV curve changed significantly. The broader oxidation curve in ca. 0.8 V can be attributed to the oxidation of adsorbed ammonia molecules. On the other hand, the double layer region became smaller after contamination, changing from 0.28 V~0.68 V to 0.35 V~0.68 V, because of the weakened capacity of the catalyst layers due to the adsorption of ammonia. However, the H-desorption peaks in the range of 0.1 to 0.3 V showed little variation. After air purging for 3 h, curve b was close but not similar to the original one (curve a), which clarified the irreversibility of the cell performance after the cell was poisoned by NH
3 in the cathode. The reason to explain why the CV curve changes so much needs to be found through deeper research.
The CV results poisoning with 10 ppm NH
3 in H
2 for 100 h (curve b) and then discharging with pure H
2 for 24 h and purging with air for 10 h (curve c) are shown in
Figure 9b, as well as the one tested with pure H
2 (reference curve a). It can be seen in curve b that the H-desorption peaks in the range of 0.1 to 0.3 V decrease after the introduction of NH
3, and due to the strong adsorption of NH
3 on Pt, the EAS of Pt is blocked by NH
3, which in turn suppresses the HOR, leading to a decrease in cell performance. Furthermore, there exists a reduced oxidation peak of Pt at 0.85 V in curve b. This peak could be caused by the reduction of the EAS of Pt. Indeed, the reduction peak for PtO or PtO
2 at 0.7 V during the cathodic scan became weaker, because less Pt oxides were generated during the previous anodic scan. After being discharged with pure H
2 and purged with neat air, curve c recovered almost completely, but the H-desorption peaks in the range of 0.1 to 0.3 V became smaller than that of the reference one (curve a), implying that the surface properties (EAS, particle size, etc.) of Pt/C might be changed. Therefore, the poisoning effect of NH
3 cannot be completely recovered by CV oxidation.
3.4. Determination of Tolerant Limit of NH3 in H2
Compared with air, the lower concentration of NH
3 in H
2 has a more severe performance degradation. Therefore, it is important to set a tolerance limit of NH
3 in H
2 for automotive applications, under which the fuel cell should not be impacted to lose too much work efficiency in a certain period and the cell should be able to perform under rather low degradation rates. In automotive application, the ideal lifetime should be 5000 h or more [
23]. However, nowadays, the technologies for the lifespan of FC do not reach that high a level. If the level of 5000 h is set, the tolerance limit would be set extremely low, and the cost of hydrogen would be impractically high. Therefore, it could be considered that the tolerance limit of NH
3 can be set in three phases. The running time of FC must reach 1000 h in the first phase, 2000 h in the second phase, and 5000 h in the third phase. Additionally, the limitation of the decrease in cell voltage at 500 mA/cm
2 was set at 25 mV.
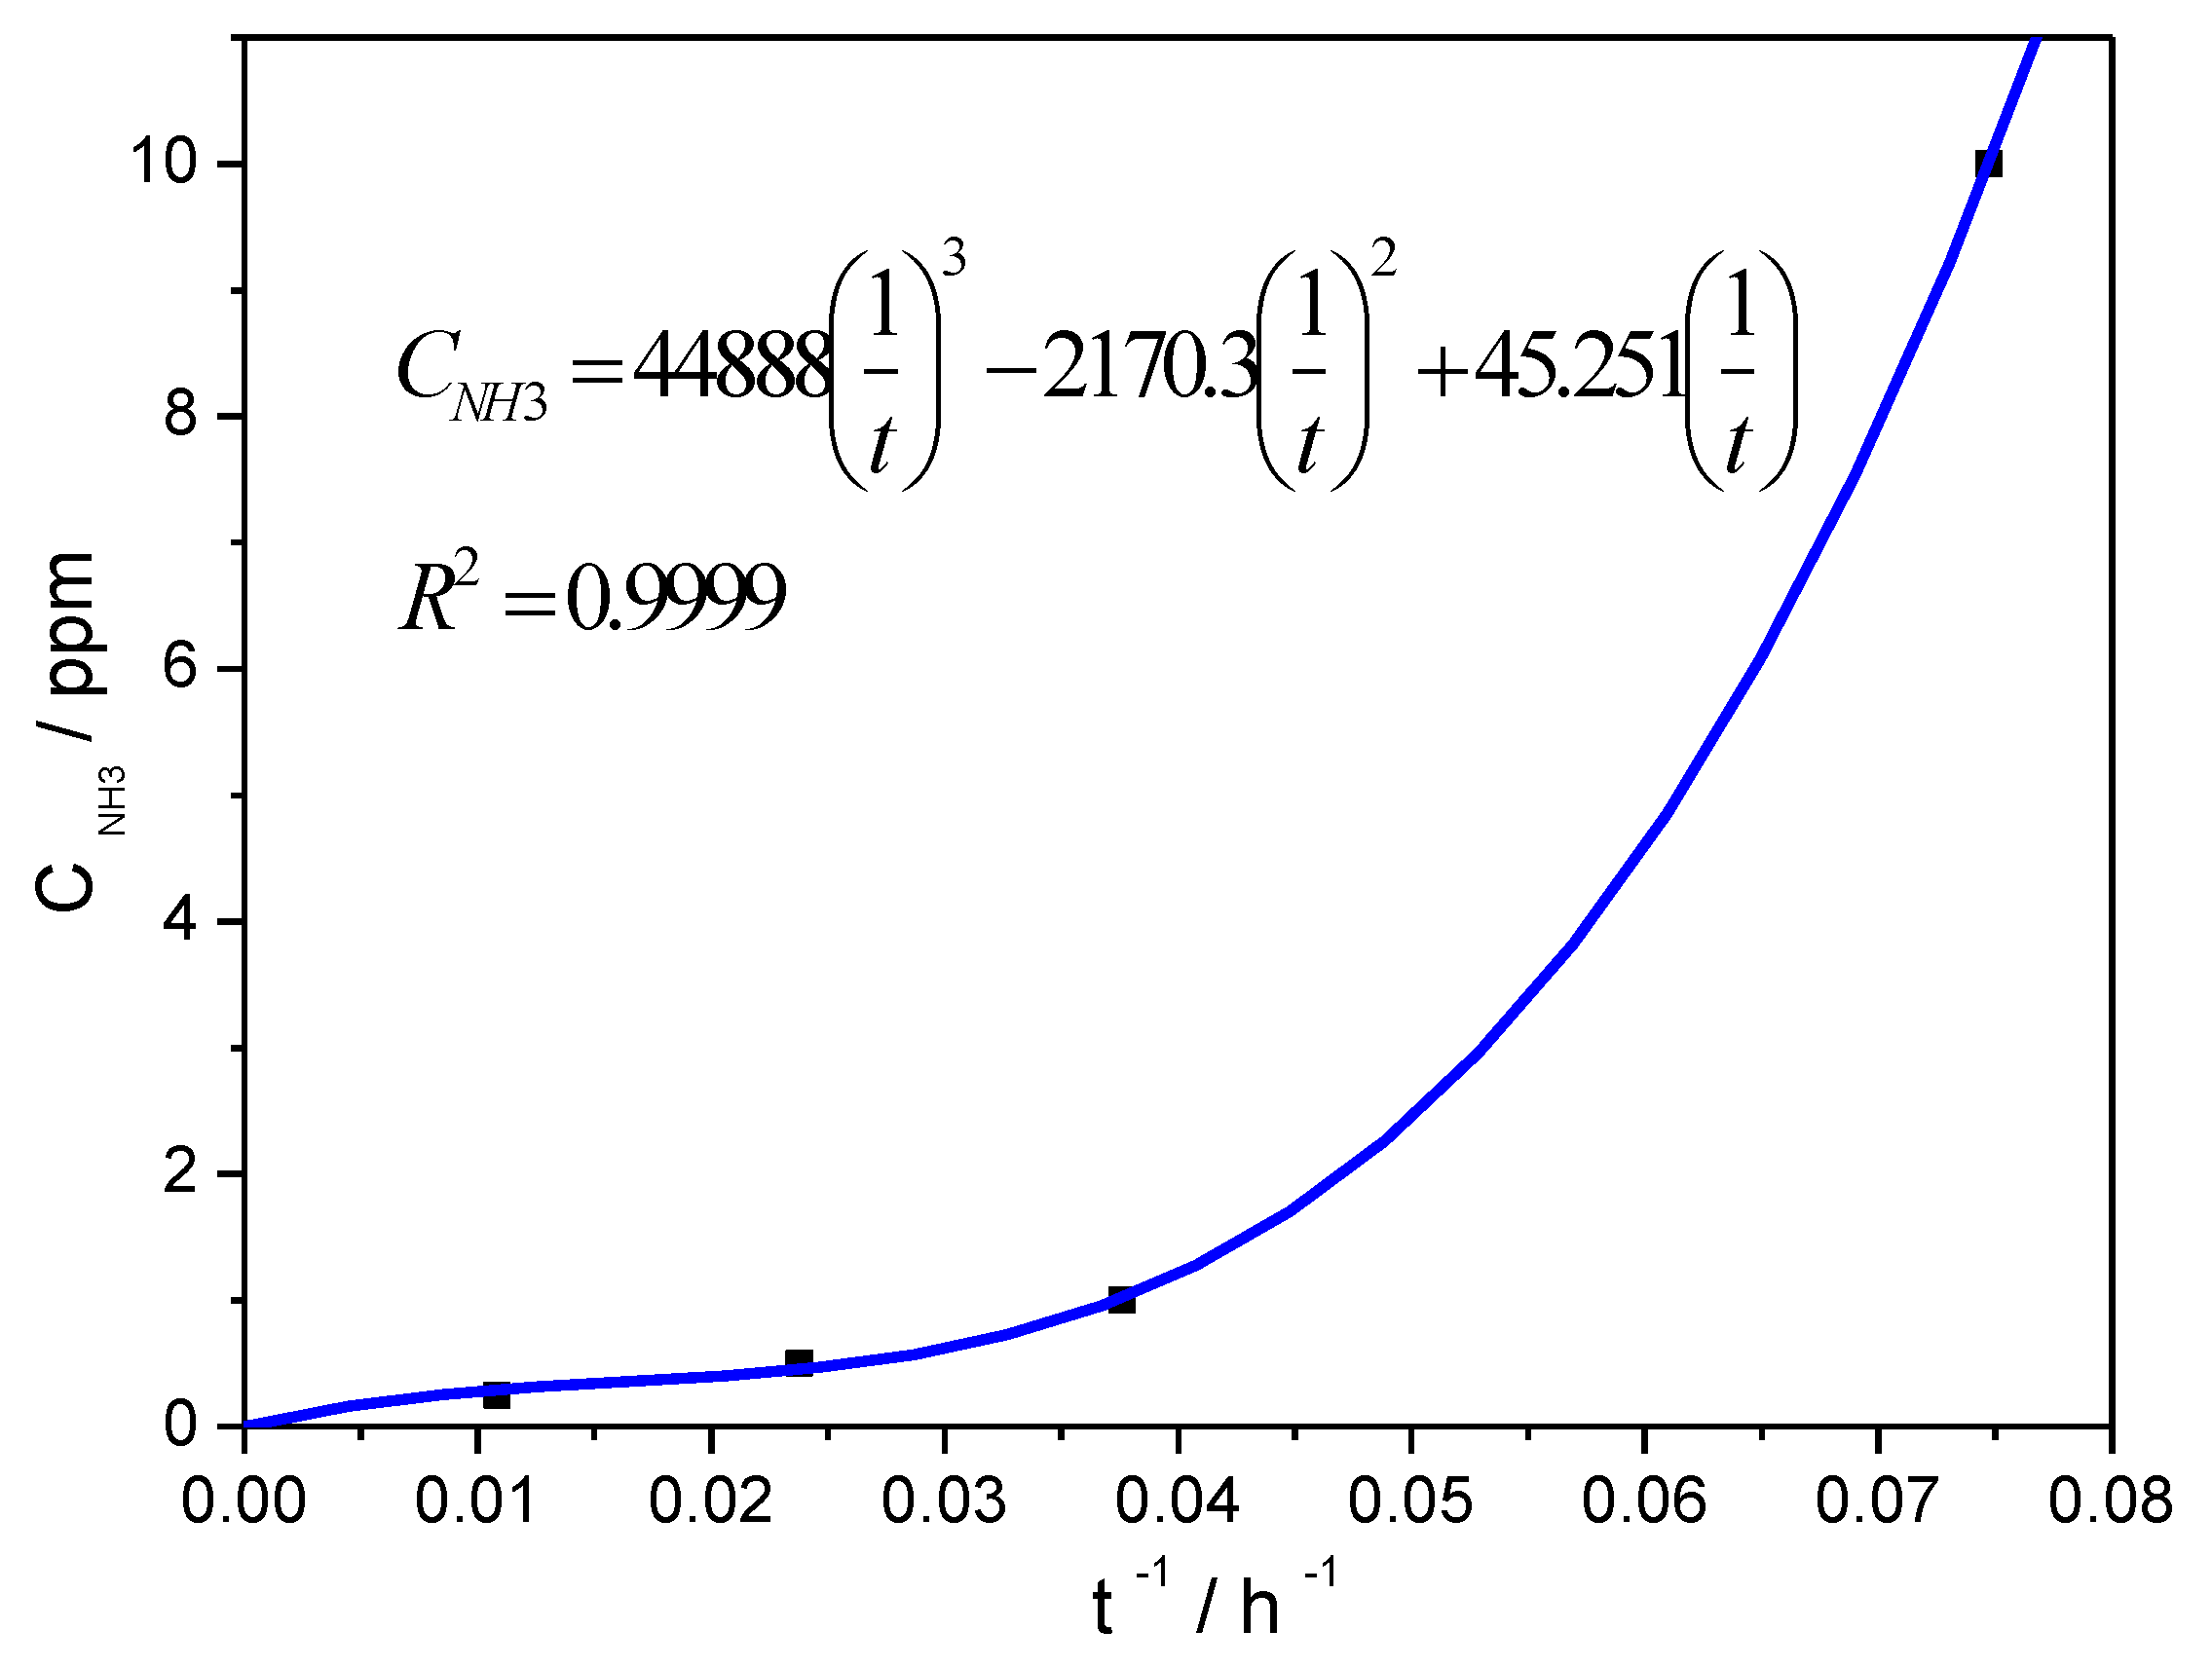
In
Figure 5, the original voltage and the dropped voltage poisoning with NH
3 were indicated by two straight lines. The line at 0.697 V indicated the original voltage and the one at 0.672 V as the voltage drop tolerance limit. Based on the experimental results given in
Figure 5, the time spent for 25 mV of cell voltage decrease, and for the four corresponding concentrations of NH
3, the time spent to reach 25 mV voltage decrease under the effect of certain concentration of NH
3 can be obtained. In
Figure 10,
CNH3, the concentration of NH
3, is plotted against 1/
t. A polynomial relationship between the two variables can be drawn out:
where
t is time of fuel cell running, h, and
CNH3 is NH
3 concentration, ppm.
From Equation (1), the tolerance limit for a 25 mV voltage drop can be calculated. For example, to reach a running time of 1000 h, the concentration of NH
3 in H
2 should be controlled at a level of 40 ppb. For 2000 h of operation time, the concentration of NH
3 should be decreased to 20 ppb. For 5000 h of operation time, the concentration of NH
3 should be controlled at 9 ppb, which is very close to the level set by the national standard [
24].
In this work, the determination of the tolerance limit was discussed based on the durability test results. However, the influence factors on the behavior of NH3 effect may be multiple. Therefore, more experiments should be carried out in various operation conditions, such as Pt loading, the operating current density, or voltage and cell temperature, etc. Nevertheless, the method in this paper can be applied in the same way; furthermore, the effects of other hydrogen impurities, such as CO and H2S, etc., can also be investigated as well.


