Article

Continuous Production of Lipids with Microchloropsis salina in Open Thin-Layer Cascade Photobioreactors on a Pilot Scale

1
Institute of Biochemical Engineering, Technical University of Munich, 85748 Garching, Germany
2
TUM-AlgaeTec Center, Technical University of Munich, 85521 Taufkirchen, Germany
3
Werner Siemens-Chair of Synthetic Biotechnology, Technical University of Munich, 85748 Garching, Germany
*
Author to whom correspondence should be addressed.
Energies 2021, 14(2), 500; https://doi.org/10.3390/en14020500
Submission received: 16 December 2020 / Revised: 11 January 2021 / Accepted: 17 January 2021 / Published: 18 January 2021

Abstract

:
Studies on microalgal lipid production as a sustainable feedstock for biofuels and chemicals are scarce, particularly those on applying open thin-layer cascade (TLC) photobioreactors under dynamic diurnal conditions. Continuous lipid production with Microchloropsis salina was studied in scalable TLC photobioreactors at 50 m2 pilot scale, applying a physically simulated Mediterranean summer climate. A cascade of two serially connected TLC reactors was applied, promoting biomass growth under nutrient-replete conditions in the first reactor, while inducing the accumulation of lipids via nitrogen limitation in the second reactor. Up to 4.1 g L−1 of lipids were continuously produced at productivities of up to 0.27 g L−1 d−1 (1.8 g m2 d−1) at a mean hydraulic residence time of 2.5 d in the first reactor and 20 d in the second reactor. Coupling mass balances with the kinetics of microalgal growth and lipid formation enabled the simulation of phototrophic process performances of M. salina in TLC reactors in batch and continuous operation at the climate conditions studied. This study demonstrates the scalability of continuous microalgal lipid production in TLC reactors with M. salina and provides a TLC reactor model for the realistic simulation of microalgae lipid production processes after re-identification of the model parameters if other microalgae and/or varying climate conditions are applied.

Graphical Abstract

1. Introduction

In the face of a growing world population and the associated increase of energy and food demand, microalgal biomass is considered a promising, renewable feedstock for a sustainable bioeconomy. With the ability to harvest light energy while recirculating carbon dioxide from air or flue gases, as well as removing nitrogen and phosphorus from municipal or agricultural wastewater [1,2], the utilization of biomass from microalgae can contribute to several of the United Nation’s Sustainable Development Goals, e.g., affordable and clean energy, climate action, responsible consumption and production, and zero hunger [3]. Major advantages of microalgae over terrestrial crop plants are the approximate 10 times higher productivities with shorter growth cycles and less consumption of fresh water [4,5]. Additionally, they can be cultivated on non-fertile ground, thereby avoiding the competition for agricultural land. Although land-based mobility is expected to use more and more electrical energy, electrical or hydrogen-based propulsion is not expected to scale up or comply with safety regulations for aviation and shipping in the near future [6]. To swiftly support CO2 emission reductions in these sectors, and needing a high energy density, the utilization of synthetic or biofuels might offer a drop-in solution [7]. However, despite much effort to establish microalgal biomass as a sustainable feedstock for bioenergy for more than 40 years, economically feasible processes are scarce and have only been developed for a few high-value products like nutraceuticals, pigments, or other specialty chemicals [8,9]. Development and commercialization of microalgae processes are mainly limited by the high costs of algal biomass production compared to conventional crops [10,11]. High operating costs are caused (i) by the power input, which is necessary for circulating the diluted microalgal suspension in the photobioreactors at low growth rates, resulting in long process times and (ii) by the separation of huge amounts of water during cell harvest [12]. The overall costs are further increased by high capital costs for large-scale production facilities at often remote locations with suitable climate conditions.
Because operational and capital costs of closed photobioreactors are especially high, only open photobioreactors, meaning photobioreactors with open surfaces to the atmosphere, are considered for a feasible production of microalgal biomass [13]. In this respect, open raceway ponds are the most commonly applied photobioreactors for producing microalgal biomass. However, raceway ponds are limited to very dilute microalgal suspensions of only 0.3–1.0 g L−1 cell dry weight (CDW) because of low mixing and mutual shading of algae cells in the long light path through the fluid layer of up to 30 cm [14,15]. An open photobioreactor system designed to overcome this limitation is the thin-layer cascade (TLC) reactor. Here, the culture gravimetrically flows along a sloped channel in a thin fluid layer of <1 cm, thereby increasing both flow turbulence and the surface-to-volume ratio, resulting in a much higher volumetric productivity of the algal culture and lower costs for water removal [16]. Turbulent flow increases light–dark cycle frequency to prevent excessive photoinhibition on the suspension surface as well as light limitation on the light-averted side. Thus, up to 50 g L−1 CDW can be achieved with TLC reactors in nutrient-replete batch processes, which was shown with Chlorella sp. and Microchloropsis salina (formerly Nannochloropsis salina) [17,18]. Additionally, high microalgal biomass concentrations decrease the culture’s susceptibility to invading organisms, a common problem in open pond systems [19,20].
While suitable microalgae strains grow rapidly under optimal environmental conditions, some species are also able to accumulate high amounts of lipids, mainly triacylglycerides, if physiological stress factors are applied, making them a promising feedstock for biofuel production [21]. The most widely studied stress factor to induce the accumulation of lipids in microalgae is nitrogen limitation [22]. If an insufficient nitrogen supply limits protein synthesis, photosynthetically fixated carbon and electrons are diverted to lipid synthesis instead, to mitigate an imbalance of redox equivalents and oxidative damage [23,24]. In this way, the batch production of up to 6.6 g L−1 of lipids was recently reported with a maximum lipid quota of 46% (w/w) with M. salina, cultivated indoors with artificial seawater with a physically reproduced Mediterranean summer climate, applying a TLC reactor with a surface area of 8 m2 [25]. This two-phase batch process, consisting of a nutrient-replete growth phase followed by a nitrogen-limited lipid accumulation phase, was transferred to a continuously operated cascade of two serially connected TLC reactors. Here, the first TLC photobioreactor was continuously supplied with fresh cultivation medium to promote rapid growth, while lipid accumulation was induced in the second TLC reactor under nutrient-limited conditions. Thereby, continuous production of 3.0–3.5 g L−1 lipids was observed with M. salina at a productivity of 0.2 g L−1 d−1 (1.35 g m−2 d−1) lipids within 24 d of continuous operation [25].
So far, microalgal lipid production has mostly been studied at laboratory scale or in well-controlled but expensive closed photobioreactors. However, data on large-scale processes in open reactors under outdoor climate conditions is necessary to bridge the gap to a commercial, large-scale production of microalgae biomass. In this respect, experimental efforts for process development can be reduced by computational simulations, applying validated models for algal growth and lipid formation. In this study, we report on the continuous production of lipid-rich M. salina biomass in a scalable 50 m2 TLC photobioreactor under a physically simulated Mediterranean summer climate. Open TLC reactors were operated with artificial seawater in the TUM-AlgaeTec Center (Technical University of Munich, Taufkirchen, Germany), a research facility designed for the indoor evaluation of photoautotrophic microalgae processes under a realistic reproduction of outdoor sunlight intensity, temperature, and air humidity with dynamic diurnal cycles. Additionally, a mathematical model was developed and validated, coupling reactor mass balances with microalgae reaction kinetics to simulate M. salina growth and lipid production under dynamic light conditions in TLC photobioreactors in batch or continuous mode.

2. Materials and Methods

2.1. Climate Simulation

All experiments were conducted at the TUM-AlgaeTec Center, a facility for indoor pilot-scale microalgae processes under realistically reproduced outdoor light and air conditions. TLC photobioreactors were located inside glass halls and illuminated by natural sunlight. LED-panels emitting artificial sunlight (FutureLED, Berlin, Germany) supplemented the local irradiance in the 400 to 750 nm range according to a set target irradiance. Automatically controlled windows as well as an air-conditioning system controlled the air temperature inside the glass halls. Irradiance and air temperature were reproduced daily according to the climate data of 15 June 2012 in Almería, Spain, a sunny day with a 14:10 light–dark cycle and a temperature range of 17–30 °C. The maximum light intensity in the photosynthetically active radiation (PAR) range (400–700 nm) was 1823 µmol m−2 s−1. A detailed description of the TUM-AlgaeTec Center and climate simulation has previously been given [17].

2.2. Microalga Strain and Reaction Medium

The marine microalgae strain Microchloropsis salina (SAG 40.85) was obtained from the Culture Collection of Algae at the University of Göttingen, Germany. Modified artificial seawater (ASW) [26] was used as growth medium. ASW was composed of NaCl (27 g L−1), MgSO4 · 7 H2O (6.6 g L−1), CaCl2 · 2 H2O (1.5 g L−1), Urea (0.3 g L−1), KH2PO4 (0.07 g L−1), Na2EDTA · 2 H2O (0.021 g L−1), FeCl3 · 6 H2O (0.014 g L−1), and 1 mL L−1 of a trace element solution of ZnCl2 (0.04 g L−1), H3BO3 (0.6 g L−1), CuCl2 · 2 H2O (0.04 g L−1), MnCl2 (0.4 g L−1), (NH4)6Mo7O24 · 4 H2O (0.37 g L−1). To avoid nutrient limitations in batch processes, ASW was additionally supplied with a concentrated feed medium at the beginning of each batch process, composed of the same components and ratios as ASW but without NaCl, MgSO4, and CaCl2. In nutrient-replete batch processes, the same feed medium was also added manually during the cultivation process to keep the urea concentration at 0.5–1.5 g L−1. Seed cultures were prepared as described before [25].

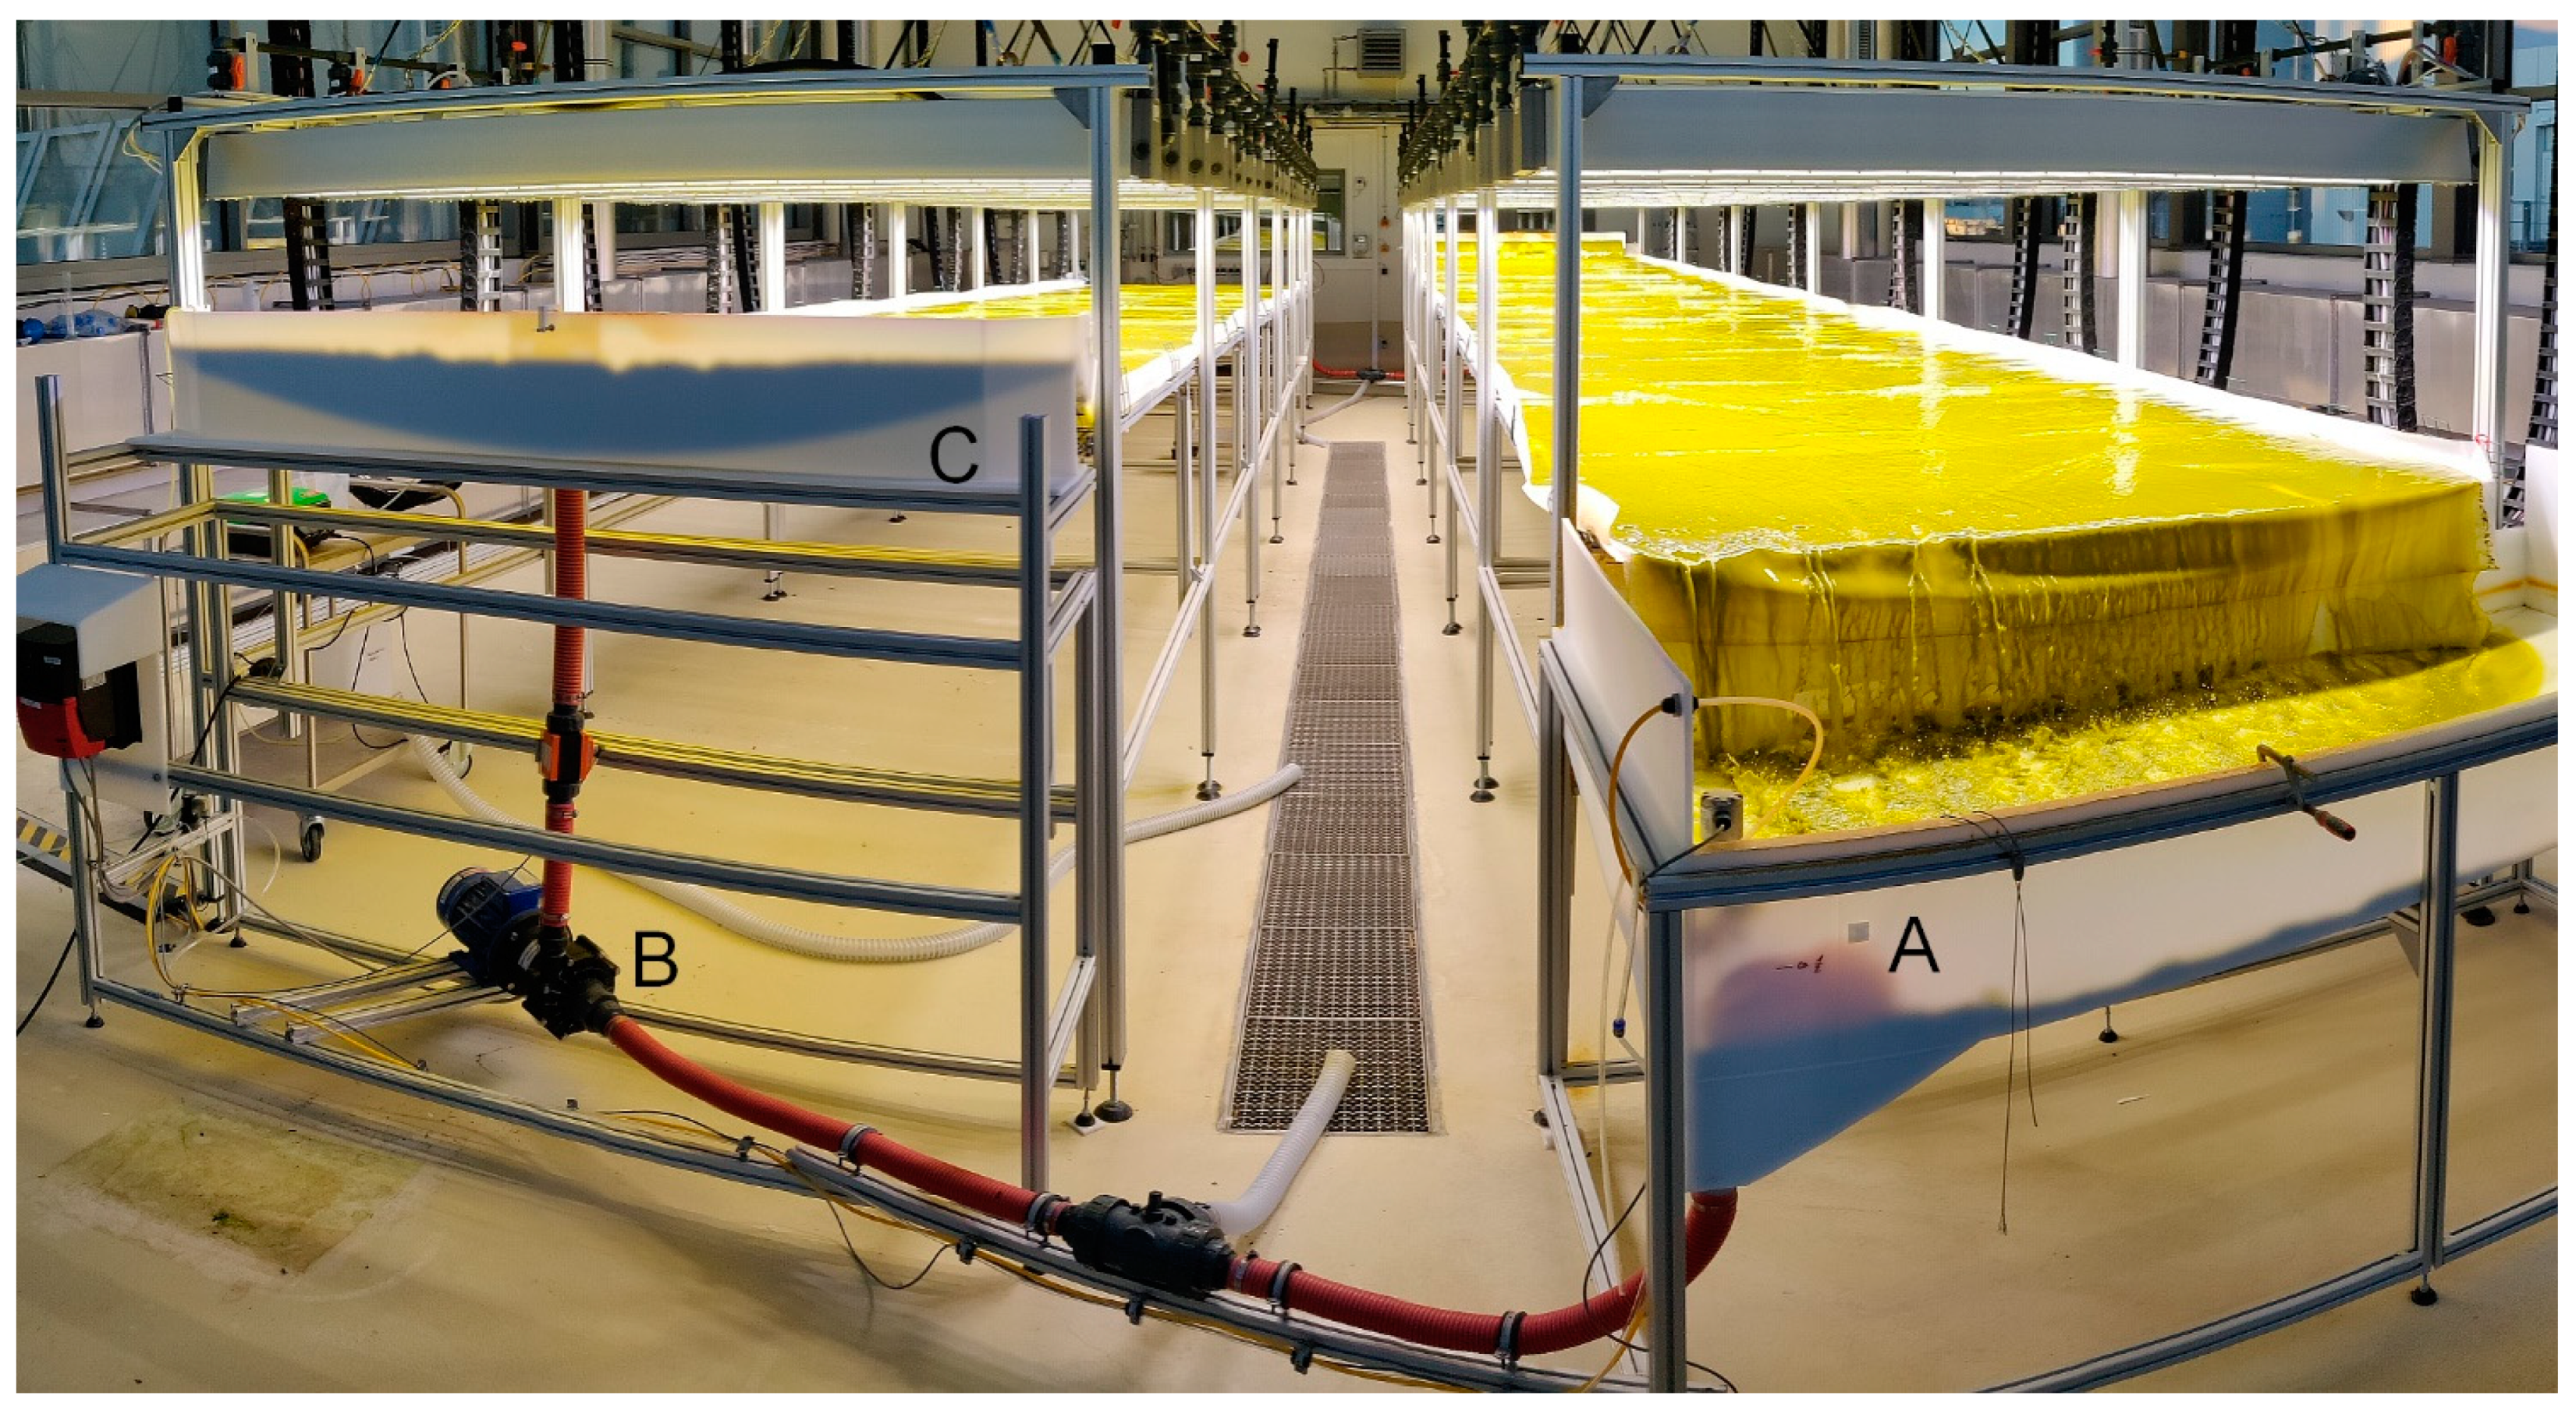
2.3. Thin-Layer Cascade Photobioreactor Operation

Two types of open TLC photobioreactors with an illuminated surface area of 8 m2 and 50 m2 were used in this study. 8 m2 reactors with a working volume of 55 L consisted of an upper and a lower 4 m × 1 m channel made of polyethylene with an inclination of 1° each in opposite direction, connected by a flow reversal module. A magnetically coupled centrifugal pump (MKPG, Ventaix, Monschau, Germany) with a 90 mm polypropylene rotor circulated the culture suspension at 2.4 L s−1 day and night from a retention tank at the end of the lower channel back to an inlet module at the start of the upper channel. This flow rate was chosen as a good compromise between turbulent mixing and energy saving considerations since it ensures a flow regime in the transition range at a Reynolds number of 2347 [17,27]. About 500 mL of tap water were automatically added via a magnetic valve as soon as a binary level-sensor (LFFS, Baumer, Friedberg, Germany) in the retention tank detected a loss of volume due to evaporation. During the day, pH was controlled at pH 8.5 by the addition of pure CO2 via a mass flow controller (red-y smart, Vögtlin, Aesch, Switzerland) through perforated hoses (Solvox B, Linde, Pullach, Germany) with a total surface area of 226 cm2 installed at the bottom of the retention tank. A detailed description of design, construction, and computational fluid dynamics simulations of the 8 m2 TLC photobioreactor was published previously [17,28].
The pilot-scale 50 m2 TLC bioreactor consisted of two 12 m × 2 m channels made of white woven coated polyethylene pond liner (areal weight 320 g m−2, Daedler, Trittau, Germany). As with the 8 m2 TLC reactor, both channels were inclined 1° in opposite directions; however, they were installed at the same height and connected on both sides via an open retention tank, centrifugal pump, and inlet module, instead of using a flow reversal module on one side. This change allows for better scaling of the reaction system, since multiple channels can be connected in parallel on inclined ground-level ramps; however, at the cost of additional pumping stations. Target flow rate of both centrifugal pumps was set to 4.8 L s−1 in order to maintain identical hydrodynamic conditions (2.4 L s−1 m−1 in relation to channel width) in the 8 m2 and 50 m2 photobioreactors, respectively. The same CO2 gassing hoses and level sensors as used before were installed in both retention tanks, while pH measurement and automatic addition of tap water were exclusive to one tank. Since the actual reactor volume depends on the fluid level in both retention tanks, tap water addition occurred only when both level sensors registered a reduced volume simultaneously for at least 12 s. The level sensors additionally served to modulate the volume flow of each respective pump in an interval of ±0.15 L s−1 to level out both tanks and ensure uniform distribution of the microalgal suspension in the entire photobioreactor. The main characteristics of both TLC reactor designs are summarized in Table 1. A photograph of the 50 m2 TLC photobioreactor is shown in Figure 1.
8 m2 TLC reactors were inoculated with M. salina to achieve an initial concentration of 0.3 g L−1 CDW with microalgal cells from a 4 m2 pre-culture TLC reactor. The 50 m2 TLC reactor was inoculated to initially achieve 0.6 g L−1 CDW in order to prevent a previously observed excessive photoinhibition in the beginning of the cultivation, which might have been the result of the longer channels and higher surface-to-volume ratio in the dilute culture at pilot scale [29].

2.4. Continuous Operation of Thin-Layer Cascades

8 m2 TLC reactors were operated continuously under the same conditions as in batch mode. The photobioreactor was initially supplied with ASW medium plus 4× concentrated feed medium to reach about 6–7 g L−1 CDW in the initial batch phase before the continuous operation was started. The reactor was continuously supplied with ASW medium plus additional 2–4× concentrated feed medium to ensure a urea concentration of 0.9–1.5 g L−1 in the microalgal suspension. Continuous medium supply and harvest via peristaltic pumps (530DuN, Watson-Marlow, Rommerskirchen, Germany) were stopped automatically between 8 p.m. and 6 a.m. to prevent wash-out of biomass at night. A constant feeding and harvest rate V ˙ was fixed according to Equation (1) to achieve the favored constant dilution rate D during a daylight-phase of 14 h (with reactor volume V ).
D = V ˙ V · 14   h 24   h
For continuous lipid production, the second 50 m2 TLC photobioreactor, initially supplied with ASW plus 1× concentrated feed medium to induce the accumulation of lipids at the end of the preliminary batch phase, was used in series. Continuous operation was initiated at the same time as the first 8 m2 TLC reactor, using the harvest stream of the first reactor as influent for the second reactor without additional nutrient supply. Since the accumulation of lipids under nitrogen-limited conditions in the second reactor is a much slower process than microalgal growth under nutrient-replete conditions in the first reactor, the dilution rate of the second TLC reactor was set to 0.05 d−1 while the first TLC reactor was operated at 0.4 d−1. These different dilution rates allowed using a 50 m2 reactor, supplied by an 8 m2 reactor for biomass production, for lipid accumulation. To achieve this difference in dilution rates between the TLC photobioreactors in series, 25% of the harvest stream of the first reactor was discarded.

2.5. Optical Density and Cell Dry Weight

Cell dry weight was determined by optical density measurement at 750 nm (OD750) in triplicate with an UV–Vis spectrophotometer (Genesys 10S UV-VIS, Thermo Fisher Scientific Inc., Waltham, MA, USA). Additionally, CDW was measured gravimetrically once per day by filtration on pre-dried and weighted glass-microfiber filters (GF/C, Whatman, GE Healthcare, Chicago, IL, USA) in triplicate to obtain a linear correlation factor between CDW and OD750 for each experiment. Loaded filters were washed with deionized water and dried at 80 °C for at least 48 h before weighing. In some processes, the optical density was additionally measured online via an optical density-sensor (ALS-OD4, algae lab systems, Boulder, CO, USA) up to the detection limit of 11–12 g L−1 CDW. Online data was calibrated with manual OD750 measurements for each process.

2.6. Total Lipid Analysis

The total lipid concentration of the algae suspension was determined via a modified sulfo-phospho-vanillin (SPV) assay in triplicates [30,31]. A 0.3 g measure of vanillin was dissolved in 5 mL absolute ethanol and 45 mL deionized water. 200 mL phosphoric acid was added, yielding the phospho-vanillin reagent. A 50 μL measure of a microalgae sample was incubated for 10 min in 1 mL sulfuric acid (98%) at 90 °C. After cooling on ice for 5 min, 2.5 mL phospho-vanillin reagent was added, thoroughly mixed and incubated for 15 min at 37 °C and 900 rpm (Thermomixer basic, CellMedia, Elsteraue, Germany). The absorption was then measured at 530 nm with an UV–Vis spectrophotometer (Genesys 10S UV-VIS, Thermo Fisher Scientific Inc., Waltham, MA, USA) against a blank of water, which was treated in the same way as the algal samples. An external standard of rapeseed oil was used to linearly correlate the absorption to the total lipid concentration.

2.7. Urea and Salinity Measurement

Salinity and urea were analyzed daily in the supernatant of a centrifuged sample (14,500× g, 4 min, Espresso, Thermo Fisher, Waltham, MA, USA). The salinity was measured by a refractometer (Hanna Instruments, Vöhringen, Germany) in the ppt range. An enzymatic urea/ammonia assay (R-Biopharm AG, Darmstadt, Germany) based on the stoichiometric conversion of NADH to NAD+ via urease and glutamate dehydrogenase was used according to the manufacturer’s instructions to determine the urea concentration photometrically at 340 nm.

2.8. Specific Growth Rate and Biomass Productivity

In diurnal microalgal cultures, two types of specific growth rates were estimated: the daily growth rate considers multiple samples during the daylight phase of a single day, while the inter-day growth rate is based on one respective sample at a specific daytime over multiple days. Since the inter-day growth rate also includes the night phase, it is usually much slower compared to the daily growth rate. The daily specific growth rate µ during the daylight phase in exponentially growing batch processes was estimated based either on five to six manual CDW concentration measurements cX or, if available, with online OD data measured by an optical density-sensor (ALS-OD4, algae lab systems, Boulder, CO, USA), which was calibrated with manual OD750 measurements. The daily specific growth rate µ was estimated by nonlinear regression applying the Levenberg–Marquardt algorithm with the exponential growth function, assuming ideal mixing in the TLC photobioreactor (Equation (2)).
c X ( t ) = c X ( t 0 ) · e μ · t
Inter-day growth rates were estimated in the same way based on CDW concentration data at 10 a.m. over several days.
The volumetric productivity P i , n of product i (biomass or lipids) in a single TLC reactor n in continuous operation was estimated based on the sum of the product inside the reactor volume and the integral of product being harvested, assuming an ideally mixed bioreactor (Equation (3)).
P i , n = ( ( c i , n ( t ) c i , n ( t 0 ) ) + 1 V n · t 0 t ( c i , n ( t ) c i , n i n ( t ) ) · V ˙ n ( t )   d t ) · ( t t 0 ) 1
with the influent and harvest volume flow V ˙ n and the product concentration in reactor n ci,n and in the influent c i , n i n . Integration was performed via the cumtrapz Matlab (Matlab R2020a, Mathworks, Natick, MA, USA) function, based on linearly interpolated data between samples.
The overall productivity of the two-stage continuous cascade considers the total amount of product harvested from the second reactor. Since the volume flow of the first TLC reactor was higher than the volume flow of the second, only the fraction of the first reactor that was necessary to supply the second was taken into account to calculate the total volume V t o t a l of the cascade (Equation (4)).
V t o t a l = 0.75 ·   V 1 + V 2
with the volumes V 1 and V 2 of reactor 1 and 2. The overall biomass and lipid productivity of the two-stage cascade P i , t o t a l was then estimated by means of Equation (5) with the product concentration in the second reactor c i , 2 .
P i , t o t a l = ( V 2 · ( c i , 2 ( t ) c i , 2 ( t 0 ) ) + t 0 t c i , 2 ( t ) · V ˙ 2 ( t )   d t ) · ( t t 0 ) 1 · V t o t a l 1

2.9. Modeling

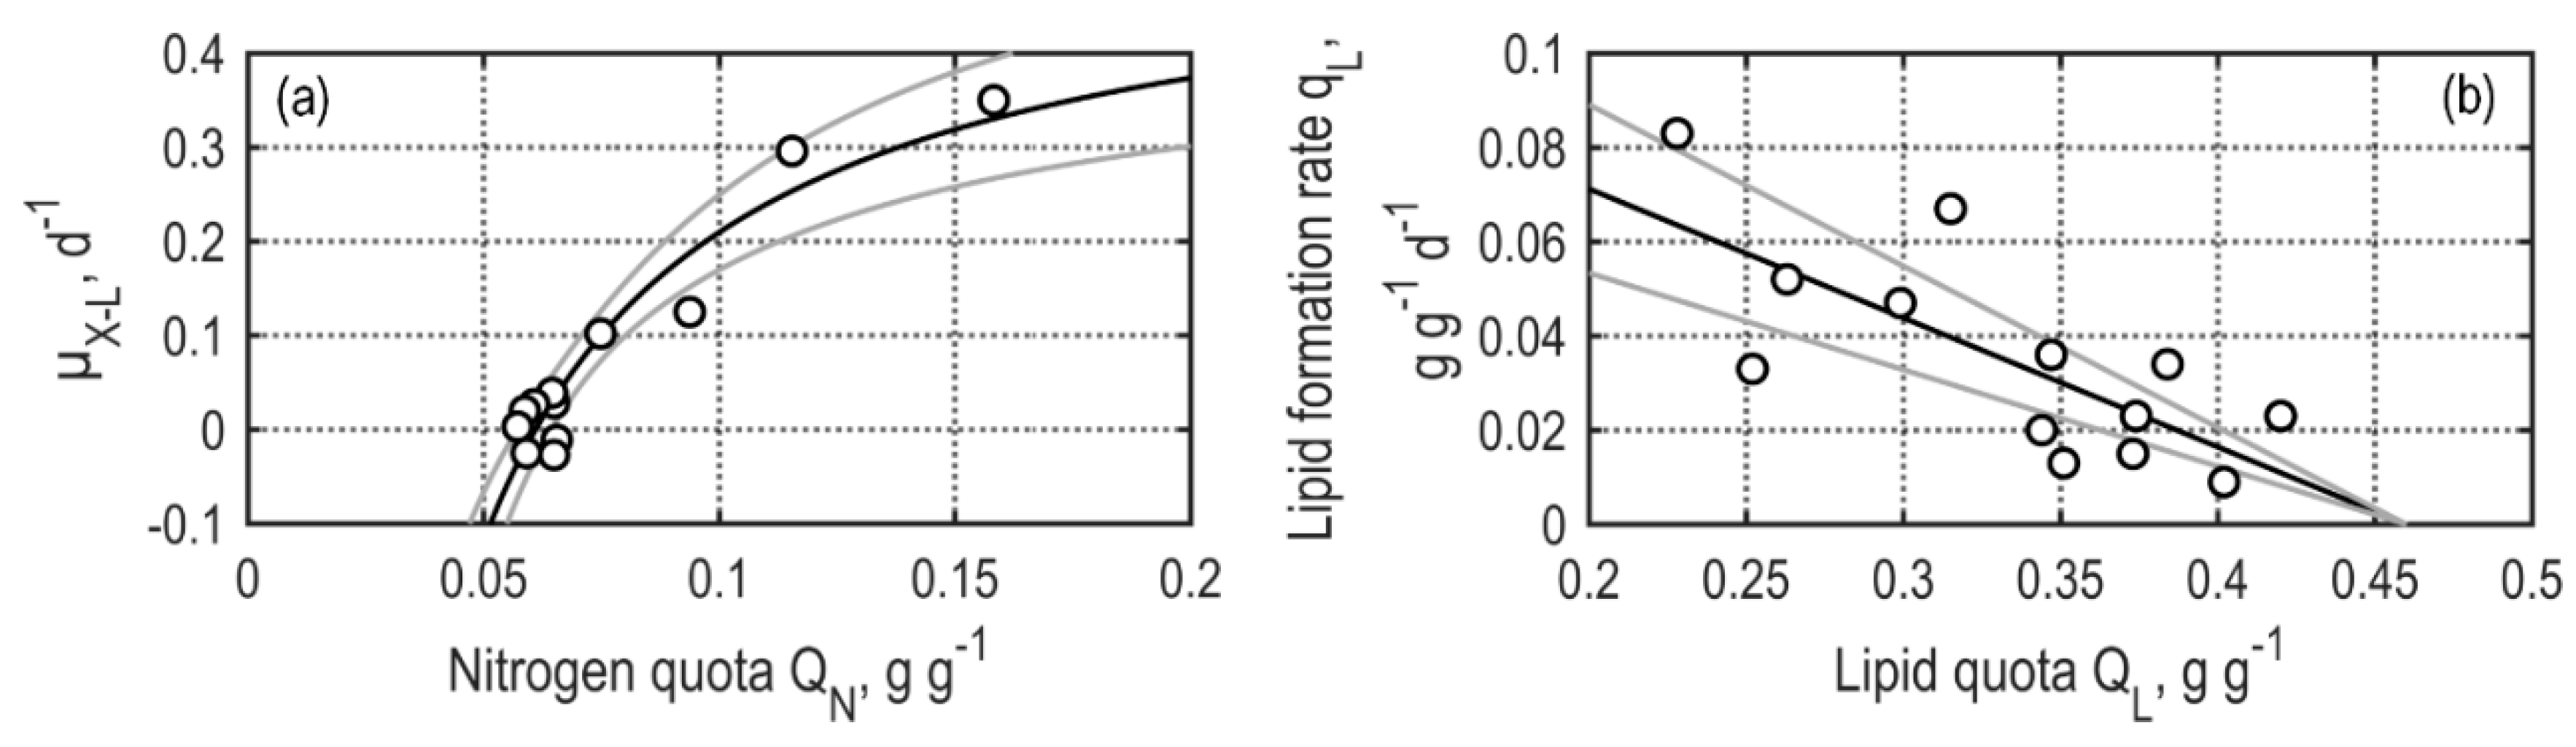
2.9.1. Kinetics of Microalgae Growth

Phototrophic microalgae processes with M. salina in TLC photobioreactors were modeled by coupling reactor mass balances with kinetics of microalgae growth and lipid formation. The limiting-state variable influencing phototrophic microalgae growth is the availability of light. The incident photosynthetic photon flux density (PPFD) I 0 on the reactor surface is attenuated over the culture layer l by algal cells via absorption and scattering. At sufficiently low biomass concentrations or short light paths, the effective PPFD at layer-depth l is given by the transmission I in Lambert–Beer’s law (Equation (6)):
I =   I 0 · e ε · c X · l
with the CDW concentration c X and the specific extinction coefficient ε . Since light availability decreases with increasing layer-depth, up to three light regimes can be found in microalgal cultures [32]: a light-limited regime at a low PPFD, where microalgal growth increases with increasing irradiance, is typically the case at the light-averted side of the photobioreactor. Here, growth can even become negative at a very low light availability when the rate of photosynthesis does not compensate the rate of respiration. A photo-saturated zone is typically found in the middle of the culture layer where the PPFD is sufficiently high to achieve a maximum photosynthetic rate. At an even higher irradiance near the reactor surface, photoinhibition can occur, decreasing microalgal growth due to redox imbalances and damage to the photosystems [33].
Although strongly varying growth rates can be expected in these different light regimes, Pfaffinger et al. [34,35] recently validated the applicability of a mean integral growth rate of the microalgae suspension, corresponding to an averaged integral photon flux density, for M. salina in flat-panel and TLC photobioreactors. Despite its inability to differentiate between light absorption, scattering, and reflection, Lambert–Beer’s law in combination with this averaged integral PPFD was found to be an adequate approximation to describe the mean integral growth rate up to CDW concentrations of at least 10 g L−1 in TLC reactors (l = 0.6 cm) [35] or 5 g L−1 in flat-panel reactors (l = 2 cm) [34,36]. The integral PPFD I * is given by Equation (7) [37].
I * =   1 L · 0 L I ( c X ,   l )   d l = I 0 · ( 1 e ε · c X · L ) ε · c X · L
with the total suspension layer-thickness L and the attenuated irradiance I as a function of CDW concentration c X and layer-depth l according to Lambert–Beer’s law (Equation (6)).
When microalgae are cultivated under nitrogen-limited conditions to promote the accumulation of lipids, the concentration of the nitrogen source c N needs to be taken into account as an additional growth-limiting factor. Based on the inhibition model by Pfaffinger et al. [34,35] the mean biomass specific growth rate μ of the microalgal suspension can then be described with Equation (8).
μ =   μ m a x · I * K S + I * + I * · ( I * K I ) φ · c N K N + c N
Here, μ m a x represents the maximum biomass specific growth rate while K S and K I represent the half-saturation and inhibition constant for light, respectively. At a mean integral PPFD of K S or K I ( K S < K I ), the biomass specific growth rate is approximately half of its maximum when the nitrogen source is not limiting. The sensitivity factor φ is proportional to the decline of the growth rate in the photoinhibition regime. When a nitrogen limitation is considered, K N gives the half-saturation concentration for the nitrogen source.
At night, when no light is available for growth, CDW concentration declines due to respiration. However, M. salina showed a decreasing biomass decay in the dark with increasing lipid quota towards the maximum lipid quota Q L , m a x . This observation agrees with other investigations, describing reduced nightly biomass losses in nutrient or light-limited late-linear growth phases [38,39,40]. The nightly biomass specific decay rate b was estimated by Equation (9) with the maximum decay rate b m a x at the baseline lipid quota under nutrient-replete conditions Q L , 0 .
b = b m a x · ( 1 Q L Q L , 0 Q L , m a x Q L , 0 )
The consumption rate q N of urea as nitrogen source is connected to the specific growth rate via the yield coefficient Y X N by Equation (10).
q N = μ Y X N

2.9.2. Kinetics of Lipid Formation

The accumulation of lipids in M. salina can be induced by limitation of nitrogen. In contrast to the specific growth rate, the lipid formation rate q L is therefore inversely related to the concentration of the nitrogen source c N (Equation (11)).
q L =   q L , m a x · ( 1 c N c N + K N ) · ( 1 Q L Q L , 0 Q L , m a x Q L , 0 )
Q L , m a x gives the maximum lipid quota at which no further lipid accumulation is observed. When the concentration of the nitrogen source is zero and no additional lipids have been accumulated yet, the lipid formation rate is maximal at q L , m a x .
Furthermore, a redistribution of intracellular nitrogen probably enables an additional formation of microalgal biomass in the early stage of nitrogen limitation, even when the nitrogen source in the growth medium is completely consumed [41,42]. Since the observed biomass formation exceeds the lipid formation, this biomass formation can be described as the sum of the lipid formation rate and the formation rate of lipid-free biomass. However, lipid-free biomass growth leads to a decrease of the intracellular nitrogen quota Q N since no additional nitrogen is available for uptake. Lipid-free biomass growth with the specific rate μ X L therefore only occurs above a minimum intracellular nitrogen quota Q N , m i n (Equation (12)).
μ X L =   μ X L , m a x · ( 1 c N c N + K N ) α · ( 1 Q N Q N , m i n Q N )
Analogous to lipid formation, this lipid-free biomass formation rate is defined to be at the maximum at μ X L , m a x when no nitrogen source is present in the growth medium, but the intracellular nitrogen quota is still high. The lipid-free biomass formation rate then declines with a decreasing nitrogen quota. The response to the nitrogen concentration in the growth medium is additionally modulated by the sensitivity factor α . The nitrogen quota Q N can be estimated via the amount of consumed nitrogen source Δ c N with nitrogen content ε N and the produced lipid-free biomass Δ c X L (Equation (13)).
Q N =   Δ c N · ε N Δ c X L

2.9.3. Simulation of Microalgal Growth and Lipid Formation

Since the TLC photobioreactor has a mixing time on a timescale of minutes to achieve 99% homogeneity, it can be assumed to be ideally mixed with respect to microalgal growth, which takes place on a timescale of hours [43]. Therefore, the general mass balance of component i with concentration ci in an ideally mixed reactor at identical inlet and outlet volume flows is given by Equation (13) with time t, the dilution rate D = V ˙ · V 1 , the concentration i in the inlet flow c i i n , and the volumetric reaction rate ri of component i.
d c i d t = D · ( c i i n c i ) + r i
Making use of Equations (8)–(12), the volumetric reaction rates for microalgal biomass formation or decay during the day r X , d a y and at night r X , n i g h t , the volumetric urea consumption rate r N , and the volumetric lipid formation rate r L can be estimated with Equations (15)–(18).
r X , d a y = c X · μ + c X L · ( q L + μ X L )
r X , n i g h t = c X · b
r N = c X · q N
r L = Q L , 0 · c X · μ + c X L · q L
Therein, c X L = c X c L is defined as the lipid-free biomass, considering that new lipids are synthesized by metabolically active biomass and not by already-synthesized storage compounds.
To simulate the CDW concentration, urea concentration, and lipid concentration in a TLC photobioreactor under dynamic diurnal light conditions, the respective differential equations were solved with the built-in ode45 solver of Matlab with a maximum step-size of 0.01 d, taking into account the same irradiance data that was used for the climate simulation experiments (see Section 2.1). A continuous cascade of two serially connected reactors was simulated by defining the respective concentrations in the first TLC reactor as the inlet concentrations of the second. The model was validated by comparing simulations to a set of experiments that were not used for the identification of model parameters. The validation experiments covered a nutrient-replete batch process, a nitrogen-limited batch process with initially supplied ASW plus 3× feed medium but no further nutrient supplementation, and a continuous cascade of two serially connected TLC reactors. The initial conditions of the simulations were set according to each respective experiment.

2.10. Identification of Model Parameters

The specific extinction coefficient ε for M. salina grown at dynamic light conditions in a TLC reactor has been determined previously [35]. Nutrient-replete batch processes with M. salina in a TLC reactor with 8 m2 surface area under the physically simulated Mediterranean summer climate were performed to determine the light-dependent growth kinetic under dynamic diurnal light conditions (Figure S1). To this end, the mean daily specific growth rate was plotted against the integral PPFD, based on the mean CDW concentration on the respective day. Under nutrient-replete conditions, Equation (8) can be simplified, so that Equation (18) was used for parameter identification via nonlinear regression, making use of Matlab’s curve fitting toolbox, based on the experimental data of the nutrient-replete batch process (Figure 2a).
μ =   μ m a x · I * K S + I * + I * · ( I * K I ) φ
The decline of CDW concentration due to respiration in the dark was estimated as a mean biomass specific rate from 8 p.m. to 6 a.m. via online optical density measurements during the night in a continuous nutrient-replete cultivation without induction of lipid accumulation at a dilution rate of 0.3 d−1 (Figure S2). During 14 consecutive nights, the reduction in CDW concentration amounted to 6.7 ± 2.3% per night, resulting in a maximum biomass decay rate b m a x of 0.17 d−1. Nightly biomass loss might partially have been a consequence of the high shear stress caused by the centrifugal pump [44,45]. However, our result is in good accordance to the average rate of nightly biomass decay of 0.17 ± 0.037 d−1 (6.8 ± 1.4% w/w) measured in three different microalgae species, including M. salina, by Edmundson and Huesemann [38] in aerated shake flasks, as well as to the rate of Athrospira platensis cultures grown in tubular outdoor reactors with an overnight loss of 5–7.6% (w/w) [46].
The same continuous process that was applied for the estimation of biomass loss at night was also used to estimate the saturation constant K N for urea. K N was calculated for the initial batch phase and the continuous phase with a urea concentration of 1.2 g L−1 in the influent medium via nonlinear regression with Equation (8), including the previously obtained kinetic parameters μ m a x , K S , K I , and φ (Figure 2b). The yield coefficient Y X N of 4.2 g g−1 was determined previously with urea as the nitrogen source at nutrient-replete conditions [47].
A baseline lipid quota of M. salina cells under nutrient-replete conditions of 0.15 g g−1 as well as a maximum lipid quota of 0.46 g g−1 under nitrogen-limited conditions were determined previously in a batch process with ASW plus 1× concentrated initial feed medium in a TLC reactor of 8 m2 under physical simulation of the same Mediterranean summer climate (Figure S3) [25]. The same process was used to estimate the maximum specific lipid-free growth rate μ X L , m a x and the minimum intracellular nitrogen quota Q N , m i n . When the nitrogen source in the growth medium is consumed completely, Equation (12) for the specific lipid-free growth rate can be simplified to a function of only the intracellular nitrogen quota Q N (Equation (20)). μ X L , m a x and Q N , m i n can then be estimated with experimentally measured specific lipid-free growth rates and the respective nitrogen quota via nonlinear regression of Equation (20) (Figure 3a).
μ X L =   μ X L , m a x · ( 1 Q N Q N , m i n Q N )
The same process data were used to estimate the maximum biomass specific lipid formation rate q L , m a x . Under nitrogen-depleted conditions, Equation (11) can be simplified so that q L , m a x can be estimated via nonlinear regression of Equation (21) to lipid formation data as a function of the lipid quota (Figure 3b).
q L =   q L , m a x · ( 1 Q L Q L , 0 Q L , m a x Q L , 0 )
The inhibition of the lipid-free growth rate by an available nitrogen source is additionally modulated by the urea limitation sensitivity factor α (Equation (12)). This model parameter could, however, not be estimated via experimental data. Since this lipid-free growth is only observed after nearly complete consumption of the nitrogen source, it follows that α should be above 1 to obtain a strong inhibition of lipid-free growth at a low nitrogen concentration c N   <   K N . All identified model parameters are summarized in Table 2.

3. Results and Discussion

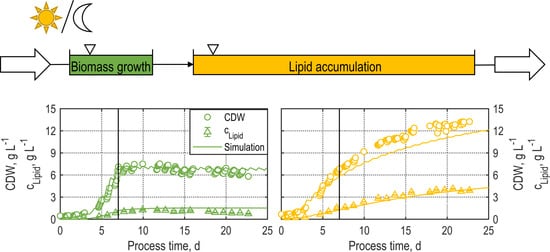
3.1. Continuous Lipid Production with Microchloropsis Salina in Thin-Layer Cascade Photobioreactors at Pilot Scale

Lipid production with M. salina was studied in a continuously operated cascade of two serially connected TLC photobioreactors under a physically simulated Mediterranean summer climate. The first reactor with a surface area of 8 m2 was continuously supplied with fresh feed medium during the day to promote high biomass productivity. The dilution rate was constant at 0.69 d−1 from 6 a.m. to 8 p.m., resulting in an overall dilution rate of 0.40 d−1 on a 24 h basis (mean hydraulic residence time of 2.5 d). The second TLC reactor with a surface area of 50 m2 was continuously fed from the first reactor during the day. Here, the accumulation of lipids was induced in M. salina by application of nitrogen-limited conditions due to almost complete consumption of urea used as the nitrogen source in the first TLC reactor. Since lipid accumulation in M. salina is a much slower process than biomass growth, the overall dilution rate of the second TLC reactor was set to 0.05 d−1 (mean hydraulic residence time of 20 d). This difference in dilution rates allowed the application of an 8 m2 TLC reactor (V = 55 L) as the first open photobioreactor to supply the second 50 m2 TLC reactor (V = 330 L).
In both reactors, continuous operation was initiated when a CDW concentration of 6–7 g L−1 was achieved after seven days of batch operation in both reactors (Figure 4). Inter-day specific growth rates during the exponential phase in the first and second TLC photobioreactor were 0.48 ± 0.06 d−1 and 0.43 ± 0.07 d−1, respectively. During continuous operation, the CDW concentration of the first reactor reached a steady state after 3 mean hydraulic residence times at 6.5 ± 0.3 g L−1, resulting in a stable biomass productivity of 2.6 g L−1 d−1 (17.9 g m−2 d−1). The lipid quota in the first reactor remained constant at 16.5 ± 2.0% (w/w), indicating no distinct lipid accumulation due to a sufficient nutrient supply.
The CDW concentration in the second TLC reactor increased during continuous operation up to a final concentration of 13.3 ± 0.12 g L−1 after 23 days of cultivation. Steady state was not reached, since at least 60 days of continuous cultivation would have been necessary under constant influent conditions to fulfill the requirement of at least three mean hydraulic residence times. No urea was detected in the aqueous phase in the second TLC photobioreactor after day 6, resulting in the accumulation of lipids. Hence, the lipid quota of the microalgae increased during the first seven days of continuous operation and stabilized at 30.3 ± 1.3% (w/w). The lipid concentration increased from 1.1 ± 0.1 g L−1 in the first reactor with growing microalgae to a constant lipid concentration of 3.9 ± 0.1 g L−1 in the second reactor after 18 days of cultivation, resulting in an overall lipid space–time yield (STY) of 0.24–0.27 g L−1 d−1. The lipid STY was higher in the first TLC reactor at 0.33 g L−1 d−1 due to the high dilution rate of 0.4 d−1, however, at only about half the lipid quota in CDW compared to the second TLC reactor. This is a typical observation in microalgae cultures due to the mutual exclusiveness of rapid biomass growth under nutrient sufficient conditions and the accumulation of lipids under nitrogen-limited conditions [48,49,50]. Nevertheless, producing lipids under the effect of a nitrogen limitation is often favored for biofuel production due to the additional benefit of shifting the lipid profile from polar functional lipids to apolar triacylglycerides with an increased saturation of fatty acids [23,51]. Additionally, nitrogen limitation reduces the protein content of the biomass [25], thereby decreasing the demand of heteroatom removal to prevent poisoning of catalysts during hydroprocessing of the bio-oil [52,53].
Hence, continuous lipid production was successfully scaled to the 50 m2 scale and even surpassed the previously reported lipid concentration at the 8 m2 scale by 33% and areal productivity by 20%, respectively [25]. Furthermore, this open 50 m2 TLC photobioreactor can be scaled easily to any size by adding additional flow channels connected via pumping stations. To the best of our knowledge, these are the highest reported lipid concentrations (3.9 ± 0.1 g L−1) and overall STYs (0.24–0.27 g L−1 d−1) in continuously operated open microalgae processes so far. Other studies conducted under outdoor climate conditions reported lipid productivities of 0.03 g L−1 d−1 and 0.11 g L−1 d−1 with Microchloropsis gaditana in a continuously operated raceway pond and tubular photobioreactor, respectively [54,55], whereas a lipid productivity of up to 0.05 g L−1 d−1 was reported with Staurosira sp. in a 60 m3 raceway pond in repeated batch mode [56]. A lipid concentration of 1.7 g L−1 and maximum lipid content of 31% (w/w) were achieved with Chlorella vulgaris under nitrogen-limited conditions in a 150 L TLC operated in a greenhouse [48]. A daily lipid productivity of about 0.3 g L−1 d−1 was reached in the same study, however, only for a duration of 3 days, resulting in an overall lipid productivity of about 0.2 g L−1 d−1.

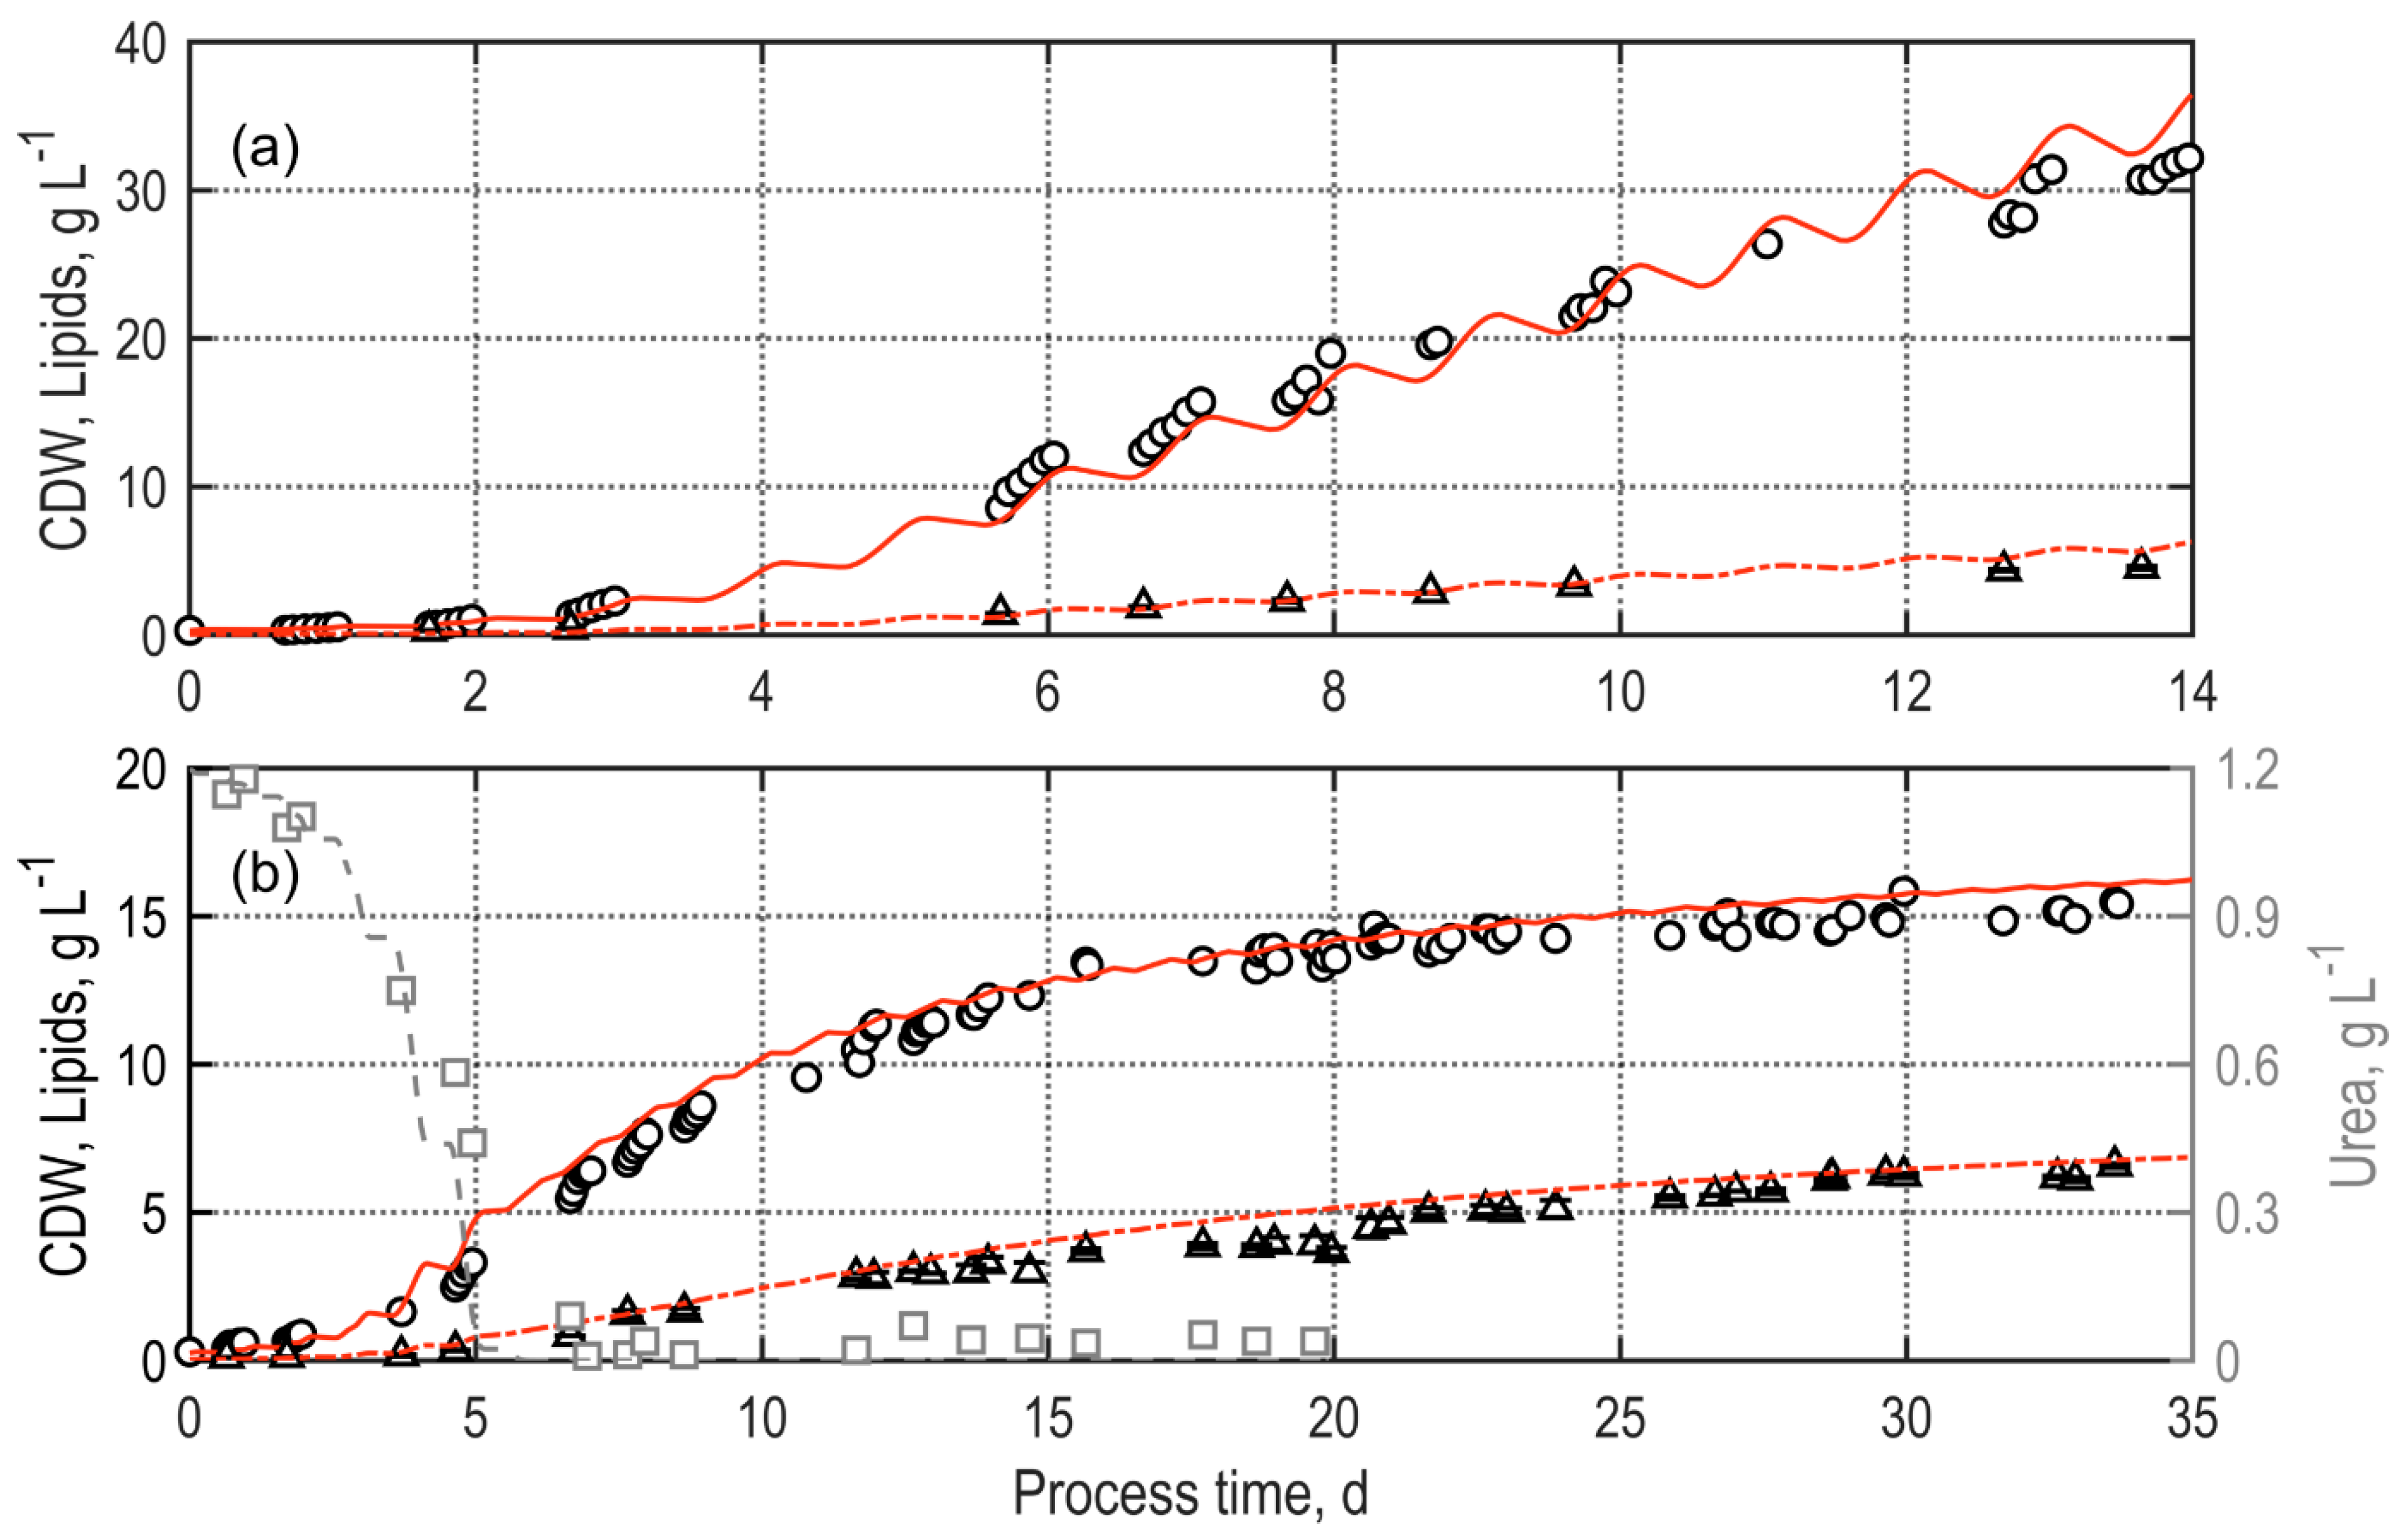
3.2. Validation of Process Simulations for Biomass and Lipid Production with M. salina

3.2.1. Batch Processes Applying TLC Photobioreactors

A nutrient-replete batch process was performed with M. salina, applying TLC photobioreactor with a surface area of 8 m2 under physically simulated climate conditions. Experimental data of CDW and lipid concentration were compared to the respective simulation in order to validate model predictions (Figure 5a). The specific growth rate during the exponential growth phase did not differ significantly based on 95% confidence intervals between experiment and simulation at 0.58 ± 0.06 d−1 and 0.57 ± 0.10 d−1, respectively. After 10 days of cultivation, the predicted CDW concentration of 23.9 g L−1 deviated only slightly (0.8%) from the experimentally measured CDW concentration of 24.1 ± 0.08 g L−1. After 14 days of operation, the simulated (36.1 g L−1) surpassed the experimentally measured CDW concentration (32.2 ± 0.00 g L−1) with a deviation of 12.1%. The predicted lipid concentration of 3.4 g L−1 after 10 days was overestimated by 3.3% compared to the experimentally measured lipid concentration of 3.3 ± 0.07 g L−1. As already observed with respect to cell densities, the overestimation of lipid concentration increased in the last days of the experiment. After 14 days, 4.5 ± 0.11 g L−1 and 5.6 g L−1 lipids were achieved in the experiment and simulation, respectively, resulting in a deviation of 23.8%. The average deviations of CDW and lipid concentrations between simulation and experiment over the 14-day process were 9.4 ± 4.9% and 9.9 ± 8.7%, respectively.
A second batch process applying an 8 m2 TLC photobioreactor under the same climate conditions was performed to validate the prediction of biomass growth, lipid formation, and urea consumption with M. salina under nitrogen-limited conditions. Therefore, ASW medium with 3× additional feed medium according to an initial overall urea concentration of 1.2 g L−1 was used, without further nutrient replenishments to induce lipid accumulation after urea was completely consumed. The cultivation was terminated when CDW and lipid concentration seemed to be stationary after 34 days. During the whole process, the CDW concentration differed only slightly between experiment and simulation, reaching 15.4 ± 0.04 g L−1 and 16.1 g L−1, respectively, with a deviation of 4.6% at the end of the process. The simulated lipid concentration after 34 days of 6.8 g L−1 resulted in a slight overestimation of 3.0% with regard to the experimental lipid concentration of 6.6 ± 0.06 g L−1. Average deviations of CDW and lipid concentrations between simulation and experiment over the 34 days process were 8.7 ± 9.8%, and 14.1 ± 10.5%, respectively. The simulation of the urea concentration was accurate during the first 4 days of the process, declining from 1.2 g L−1 to 0.6 g L−1. Thereafter, the urea consumption was somewhat overestimated, so that urea was completely consumed on the sixth day of the simulation, while lasting until the end of the seventh day in the experiment.
Overall, the simulations of both the nutrient-replete and the nitrogen-limited microalgae batch processes in TLC reactors resulted in good predictions of experimental results with average deviations of CDW and lipid concentrations between simulation and experimental data of 9%–14%. However, an overestimation of growth at very high CDW concentrations > 30 g L−1 suggests additional growth limiting factors at high cell densities, possibly due to an accumulation of cell debris and pigments released via cell lysis [47].

3.2.2. Continuous Processes Applying TLC Photobioreactors

To validate the identified growth and lipid production model of M. salina in continuous operation, a cascade of two serially connected TLC photobioreactors (8 m2 and 50 m2, Section 3.1) was simulated. In this case, the predicted concentrations in the first TLC reactor were used as influent concentrations for the second reactor. In accordance with the experiment, simulation of the continuous operation was initiated on day 7 with a dilution rate of 0.4 d−1 in the first reactor and 0.05 d−1 in the second reactor. At the end of the batch phase, experimental CDW concentrations measured in the first TLC reactor of 7.1 ± 0.02 g L−1 were identical within the estimation error compared to the simulation (Figure 6a). In the second TLC reactor, a CDW concentration of 6.9 ± 0.02 g L−1 was measured, whereas the simulation predicted 5.9 g L−1. During continuous operation, the CDW concentration in the first reactor stabilized at a steady-state concentration of 6.5 ± 0.32 g L−1, which was overestimated by 4.6% in the simulation at 6.8 ± 0.10 g L−1. However, the simulation predicted a slightly smaller deviation of 0.3 g L−1 between the lowest CDW concentrations in the morning and highest in the evening compared to a difference of about 0.7 g L−1 measured experimentally. Due to a further increase in CDW concentration in nitrogen-limited conditions, the second reactor reached a maximum CDW concentration of 13.3 ± 0.12 g L−1 at the end of the process after 23 days. The simulation underestimated the final CDW concentration by 11.7% at 11.7 g L−1. Due to the high mean hydraulic residence time of 20 days in the second reactor, a steady state was not reached during the process time. In order to reach a steady state in the second reactor, at least 3–5 mean hydraulic residence times would be necessary after achieving a steady state in the first reactor. The respective simulation of a 100-day process predicted a steady-state CDW concentration of 17.0 g L−1.
The lipid concentration in the first TLC reactor of the experiment reached a steady state at about 1.1 ± 0.10 g L−1 after 3 mean hydraulic residence times during continuous operation. The simulation, however, resulted in an overestimation of 34.5% at a stationary lipid concentration of 1.5 g L−1. During the last 3 days of the continuous process, the experimental data showed a decrease in lipid concentration to 0.8 ± 0.06 g L−1, resulting in a final deviation between experiment and simulation of 87.5% after 23 days (Figure 6b). This increased deviation of the lipid concentration probably resulted from low urea concentrations near the urea saturation constant K N in the first reactor. K N is used in the model not only for biomass growth limitation (Equation (8), but also for lipid accumulation inhibition (Equation (11). The deviation between measured and predicted lipid accumulation at low urea concentrations therefore suggests that the estimation of K N might be flawed or an additional parameter for inhibition of the lipid accumulation might be necessary. However, the effect on lipid accumulation at a high or zero urea concentration was negligible.
In the second reactor, where urea was completely consumed, the lipid concentration increased further, reaching a maximum of 4.1 ± 0.05 g L−1 after 20 days and 3.9 ± 0.06 g L−1 at the end of the cultivation. At this process time, the simulation resulted in a 3.3% overestimated lipid concentration of 4.0 g L−1. Since no steady state was reached during the process time of 23 days, the predicted lipid concentration further increased in a 100-day simulation to a stationary 6.6 g L−1.
During the 23 days of cultivation, the model adequately predicted the two-stage reactor cascade for the continuous lipid production with M. salina. The average deviations of CDW concentration between simulation and experiment in the first and second reactor were 7.2 ± 6.3% and 13.5 ± 4.8%, respectively. Lipid concentration was predicted with an average deviation of 40.9 ± 27.6% and 10.2 ± 5.9% in the first and second reactor, respectively. Deviations between CDW concentrations in simulation and experiment slightly increased in the second reactor of the two-stage cascade, probably as a continuation of minor prediction errors in the first reactor. The accuracy of the simulated lipid concentration, however, increased in the second reactor due to an overestimation of lipid accumulation at urea concentrations near K N in the first reactor.
Additionally, experimental results and simulations of single-stage continuous processes with four different dilution rates at different feed concentrations in the inlet flow were compared in terms of steady state CDW concentrations after at least three mean hydraulic residence times of continuous operation (Figure 7). The dilution rates studied were 0.31 d−1, 0.4 d−1, 0.5 d−1, and 0.6 d−1, respectively with feed medium according to urea concentrations of 1.2 g L−1, 1.5 g L−1, 1.2 g L−1 and 0.9 g L−1, respectively. Steady-state CDW concentrations declined at higher dilution rates of 0.5 d−1 and 0.6 d−1 in both experiments and simulations. This was expected, since the microalgal growth rate mainly depends on the availability of light in the culture suspension, which increases with decreasing CDW. The average deviation between simulation and experiment was 8.3 ± 5.0%, which further confirms the applicability of CDW simulations in continuous processes.
Although multiple kinetic model approaches have been published to simulate microalgal growth, some of them also including the accumulation of lipids, a large gap persists between laboratory models and their validity in large-scale outdoor production systems under real climate conditions [57,58]. In this respect, this study presents an applicable model, validated in an easily scalable open reaction system, being also the first to simulate both growth and lipid accumulation in TLC photobioreactors.

4. Conclusions

A cascade of two serially connected open TLC photobioreactors enabled the continuous production of lipids with M. salina on a pilot scale under a physically simulated Mediterranean summer climate. High lipid concentrations of up to 4.1 g L−1 and space–time yields of up to 0.27 g L−1 d−1 (1.8 g m−2 d−1) were achieved by promoting rapid growth under nutrient-replete conditions in the first TLC reactor and inducing the accumulation of lipids under nitrogen-limited conditions in the second reactor. This process strategy and reactor design can easily be scaled-up to full-scale microalgae processes by increasing the surface area of the TLC reactors and by adding further reactor channels connected via pumping stations. The TLC reactor model developed for simulation of growth and lipid accumulation with M. salina facilitates the estimation of M. salina biomass and lipid production in batch or continuous operation under dynamic light conditions with average deviations from experimental results of around 10% in most cases. This reactor model is the basis for the realistic simulation of lipid production processes with M. salina in a full-scale production plant applying open TLC reactors under the Mediterranean summer climate conditions studied. The model parameters have to be re-identified if other microalgae and/or varying climate conditions will be applied. Nevertheless, our experimental results on phototrophic lipid production on a pilot scale together with the process model for continuous production of microalgal lipids in open TLC photobioreactors contributes to paving the way to an industrial production of microalgae biomass as a renewable feedstock for biofuels and chemicals.

Supplementary Materials

The following are available online at https://www.mdpi.com/1996-1073/14/2/500/s1, Figure S1, Figure S2 and Figure S3.

Author Contributions

Conceptualization, T.S., A.-L.T., T.B. and D.W.-B.; methodology, software, validation, formal analysis, and investigation, T.S. and A.-L.T.; data curation, T.S.; writing—original draft preparation, T.S.; writing—review and editing, D.W.-B. and T.B.; visualization, T.S.; supervision, D.W.-B.; project administration, T.B. and D.W.-B.; funding acquisition, T.B. and D.W.-B. All authors have read and agreed to the published version of the manuscript.

Funding

This research was funded by the Bavarian State Ministry for Economic Affairs, Regional Development and Energy (Munich, Germany) and the Bavarian State Ministry of Science and the Arts (Munich, Germany) under grant number LABAY 89A. The APC was funded by the University Library, Technical University of Munich.

Data Availability Statement

Data presented in this manuscript are available upon request from the corresponding author.

Acknowledgments

The authors gratefully acknowledge the support by the TUM students Angelina Tzanavari and Philippe Kollovieh in the TUM-AlgaeTec Center. We thank Stefan Wilbert (DLR, Plataforma Solar de Almería, Almería, Spain) for providing meteorological data of Almería for the climate simulation. The support of Torben Schädler by the TUM Graduate School (Technical University of Munich, Germany) is acknowledged as well.

Conflicts of Interest

The authors declare no conflict of interest. The funders had no role in the design of the study; in the collection, analyses, or interpretation of data; in the writing of the manuscript, or in the decision to publish the results.

References

  1. Mohan, S.V.; Hemalatha, M.; Chakraborty, D.; Chatterjee, S.; Ranadheer, P.; Kona, R. Algal biorefinery models with self-sustainable closed loop approach: Trends and prospective for blue-bioeconomy. Bioresour. Technol. 2020, 295, 122128. [Google Scholar] [CrossRef] [PubMed]
  2. Behera, S.; Singh, R.; Arora, R.; Sharma, N.K.; Shukla, M.; Kumar, S. Scope of Algae as Third Generation Biofuels. Front. Bioeng. Biotechnol. 2015, 2, 90. [Google Scholar] [CrossRef] [PubMed]
  3. United Nations General Assembly. Transforming Our World: The 2030 Agenda for Sustainable Development, A/RES/70/1. 2015. Available online: https://sustainabledevelopment.un.org/post2015/transformingourworld/publication (accessed on 2 December 2020).
  4. Moody, J.W.; McGinty, C.M.; Quinn, J.C. Global evaluation of biofuel potential from microalgae. Proc. Natl. Acad. Sci. USA 2014, 111, 8691–8696. [Google Scholar] [CrossRef] [PubMed] [Green Version]
  5. Brennan, L.; Owende, P. Biofuels from microalgae—A review of technologies for production, processing, and extractions of biofuels and co-products. Renew. Sustain. Energy Rev. 2010, 14, 557–577. [Google Scholar] [CrossRef]
  6. Sharmina, M.; Edelenbosch, O.Y.; Wilson, C.; Freeman, R.; Gernaat, D.E.H.J.; Gilbert, P.; Larkin, A.; Littleton, E.W.; Traut, M.; van Vuuren, D.P.; et al. Decarbonising the critical sectors of aviation, shipping, road freight and industry to limit warming to 1.5–2 °C. Clim. Policy 2020. [Google Scholar] [CrossRef]
  7. Gilbert, P.; Walsh, C.; Traut, M.; Kesieme, U.; Pazouki, K.; Murphy, A. Assessment of full life-cycle air emissions of alternative shipping fuels. J. Clean. Prod. 2018, 172, 855–866. [Google Scholar] [CrossRef]
  8. Oncel, S.S. Microalgae for a macroenergy world. Renew. Sustain. Energy Rev. 2013, 26, 241–264. [Google Scholar] [CrossRef]
  9. Slocombe, S.P.; Benemann, J.R. Introduction. In Microalgal Production for Biomass and High-Value Products; Slocombe, S.P., Benemann, J.R., Eds.; CRC Press: Boca Raton, FL, USA, 2016; pp. xvii–xxx. [Google Scholar]
  10. Wijffels, R.H.; Barbosa, M.J. An Outlook on Microalgal Biofuels. Science 2010, 329, 796–799. [Google Scholar] [CrossRef] [Green Version]
  11. Chisti, Y. Constraints to commercialization of algal fuels. J. Biotechnol. 2013, 167, 201–214. [Google Scholar] [CrossRef]
  12. Laurens, L.M.L.; Chen-Glasser, M.; McMillan, J.D. A perspective on renewable bioenergy from photosynthetic algae as feedstock for biofuels and bioproducts. Algal Res. 2017, 24, 261–264. [Google Scholar] [CrossRef]
  13. Apel, A.C.; Weuster-Botz, D. Engineering solutions for open microalgae mass cultivation and realistic indoor simulation of outdoor environments. Bioprocess Biosyst. Eng. 2015, 38, 995–1008. [Google Scholar] [CrossRef] [PubMed]
  14. Doucha, J.; Lívanský, K. High Density Outdoor Microalgal Culture. In Algal Biorefineries: Volume 1: Cultivation of Cells and Products; Bajpai, R., Prokop, A., Zappi, M., Eds.; Springer: Dordrecht, The Netherlands, 2014; pp. 147–173. [Google Scholar]
  15. De Vree, J.H.; Bosma, R.; Janssen, M.; Barbosa, M.J.; Wijffels, R.H. Comparison of four outdoor pilot-scale photobioreactors. Biotechnol. Biofuels 2015, 8, 215. [Google Scholar] [CrossRef] [PubMed] [Green Version]
  16. Grivalský, T.; Ranglová, K.; da Câmara Manoel, J.A.; Lakatos, G.E.; Lhotský, R.; Masojídek, J. Development of thin-layer cascades for microalgae cultivation: Milestones (review). Folia Microbiol. 2019, 64, 603–614. [Google Scholar] [CrossRef] [PubMed]
  17. Apel, A.C.; Pfaffinger, C.E.; Basedahl, N.; Mittwollen, N.; Göbel, J.; Sauter, J.; Brück, T.; Weuster-Botz, D. Open thin-layer cascade reactors for saline microalgae production evaluated in a physically simulated Mediterranean summer climate. Algal Res. 2017, 25, 381–390. [Google Scholar] [CrossRef]
  18. Masojídek, J.; Kopecký, J.; Giannelli, L.; Torzillo, G. Productivity correlated to photobiochemical performance of Chlorella mass cultures grown outdoors in thin-layer cascades. J. Ind. Microbiol. Biotechnol. 2011, 38, 307–317. [Google Scholar] [CrossRef]
  19. Deruyck, B.; Thi Nguyen, K.H.; Decaestecker, E.; Muylaert, K. Modeling the impact of rotifer contamination on microalgal production in open pond, photobioreactor and thin layer cultivation systems. Algal Res. 2019, 38, 101398. [Google Scholar] [CrossRef]
  20. Montemezzani, V.; Duggan, I.C.; Hogg, I.D.; Craggs, R.J. A review of potential methods for zooplankton control in wastewater treatment High Rate Algal Ponds and algal production raceways. Algal Res. 2015, 11, 211–226. [Google Scholar] [CrossRef]
  21. Chisti, Y. Biodiesel from microalgae. Biotechnol. Adv. 2007, 25, 294–306. [Google Scholar] [CrossRef]
  22. Mallick, N.; Bagchi, S.K.; Koley, S.; Singh, A.K. Progress and Challenges in Microalgal Biodiesel Production. Front. Microbiol. 2016, 7, 1019. [Google Scholar] [CrossRef] [Green Version]
  23. Hu, Q.; Sommerfeld, M.; Jarvis, E.; Ghirardi, M.; Posewitz, M.; Seibert, M.; Darzins, A. Microalgal triacylglycerols as feedstocks for biofuel production: Perspectives and advances. Plant J. 2008, 54, 621–639. [Google Scholar] [CrossRef]
  24. Sharma, K.K.; Schuhmann, H.; Schenk, P.M. High Lipid Induction in Microalgae for Biodiesel Production. Energies 2012, 5, 1532–1553. [Google Scholar] [CrossRef] [Green Version]
  25. Schädler, T.; Cerbon, D.C.; de Oliveira, L.; Garbe, D.; Brück, T.; Weuster-Botz, D. Production of lipids with Microchloropsis salina in open thin-layer cascade photobioreactors. Bioresour. Technol. 2019, 289, 121682. [Google Scholar] [CrossRef] [PubMed]
  26. Boussiba, S.; Vonshak, A.; Cohen, Z.; Avissar, Y.; Richmond, A. Lipid and Biomass Production by the Halotolerant Microalga Nannochloropsis salina. Biomass 1987, 12, 37–47. [Google Scholar] [CrossRef]
  27. Severin, T.S.; Apel, A.C.; Brück, T.; Weuster-Botz, D. Investigation of vertical mixing in thin-layer cascade reactors using computational fluid dynamics. Chem. Eng. Res. Des. 2018, 132, 436–444. [Google Scholar] [CrossRef]
  28. Severin, T.S.; Brück, T.; Weuster-Botz, D. Validated numerical fluid simulation of a thin-layer cascade photobioreactor in OpenFOAM. Eng. Life Sci. 2018, 19, 97–103. [Google Scholar] [CrossRef] [PubMed] [Green Version]
  29. Masojídek, J.; Sergejevová, M.; Malapascua, J.R.; Kopecký, J. Thin-Layer Systems for Mass Cultivation of Microalgae: Flat Panels and Sloping Cascades. In Algal Biorefineries: Volume 2: Products and Refinery Design; Prokop, A., Bajpai, R.K., Zappi, M.E., Eds.; Springer International Publishing: Cham, Switerland, 2015; pp. 237–261. [Google Scholar]
  30. Byreddy, A.R.; Gupta, A.; Barrow, C.J.; Puri, M. A quick colorimetric method for total lipid quantification in microalgae. J. Microbiol. Methods 2016, 125, 28–32. [Google Scholar] [CrossRef] [PubMed]
  31. Mishra, S.K.; Suh, W.I.; Farooq, W.; Moon, M.; Shrivastav, A.; Park, M.S.; Yang, J.-W. Rapid quantification of microalgal lipids in aqueous medium by a simple colorimetric method. Bioresour. Technol. 2014, 155, 330–333. [Google Scholar] [CrossRef] [PubMed]
  32. Richmond, A. Biological Principles of Mass Cultivation of Photoautotrophic Microalgae. In Handbook of Microalgal Culture: Applied Phycology and Biotechnology, 2nd ed.; Richmond, A., Hu, Q., Eds.; Wiley-Blackwell: Chichester, UK, 2013; pp. 171–204. [Google Scholar]
  33. Wilhelm, C.; Jakob, T. Balancing the conversion efficiency from photon to biomass. In Microalgal Biotechnology: Potential and Production; Posten, C., Walter, C., Eds.; De Gruyter: Berlin, Germany, 2012; pp. 39–53. [Google Scholar]
  34. Pfaffinger, C.E.; Schöne, D.; Trunz, S.; Löwe, H.; Weuster-Botz, D. Model-based optimization of microalgae areal productivity in flat-plate gas-lift photobioreactors. Algal Res. 2016, 20, 153–163. [Google Scholar] [CrossRef]
  35. Pfaffinger, C.E.; Severin, T.S.; Apel, A.C.; Göbel, J.; Sauter, J.; Weuster-Botz, D. Light-dependent growth kinetics enable scale-up of well-mixed phototrophic bioprocesses in different types of photobioreactors. J. Biotechnol. 2019, 297, 41–48. [Google Scholar] [CrossRef]
  36. Koller, A.P.; Löwe, H.; Schmid, V.; Mundt, S.; Weuster-Botz, D. Model-supported phototrophic growth studies with Scenedesmus obtusiusculus in a flat-plate photobioreactor. Biotechnol. Bioeng. 2017, 114, 308–320. [Google Scholar] [CrossRef]
  37. Molina-Grima, E.; Camacho, F.G.; Pérez, J.A.S.; Fernández, F.G.A.; Sevilla, J.M.F. Evaluation of photosynthetic efficiency in microalgal cultures using averaged irradiance. Enzyme Microb. Technol. 1997, 21, 375–381. [Google Scholar] [CrossRef]
  38. Edmundson, S.J.; Huesemann, M.H. The dark side of algae cultivation: Characterizing night biomass loss in three photosynthetic algae, Chlorella sorokiniana, Nannochloropsis salina and Picochlorum sp. Algal Res. 2015, 12, 470–476. [Google Scholar] [CrossRef] [Green Version]
  39. Janssen, J.H.; Kastenhofer, J.; de Hoop, J.A.; Lamers, P.P.; Wijffels, R.H.; Barbosa, M.J. Effect of nitrogen addition on lipid productivity of nitrogen starved Nannochloropsis gaditana. Algal Res. 2018, 33, 125–132. [Google Scholar] [CrossRef]
  40. Michels, M.H.A.; Slegers, P.M.; Vermuë, M.H.; Wijffels, R.H. Effect of biomass concentration on the productivity of Tetraselmis suecica in a pilot-scale tubular photobioreactor using natural sunlight. Algal Res. 2014, 4, 12–18. [Google Scholar] [CrossRef]
  41. Grobbelaar, J.U. Inorganic Algal Nutrition. In Handbook of Microalgal Culture: Applied Phycology and Biotechnology; Richmond, A., Hu, Q., Eds.; Wiley-Blackwell: Chichester, UK, 2013; pp. 123–133. [Google Scholar]
  42. Keller, M.D.; Kiene, R.P.; Matrai, P.A.; Bellows, W.K. Production of glycine betaine and dimethylsulfoniopropionate in marine phytoplankton. II. N-limited chemostat cultures. Mar. Biol. 1999, 135, 249–257. [Google Scholar] [CrossRef]
  43. Severin, T.S.; Plamauer, S.; Apel, A.C.; Brück, T.; Weuster-Botz, D. Rapid salinity measurements for fluid flow characterisation using minimal invasive sensors. Chem. Eng. Sci. 2017, 166, 161–167. [Google Scholar] [CrossRef]
  44. Wang, C.; Lan, C.Q. Effects of shear stress on microalgae—A review. Biotechnol. Adv. 2018, 36, 986–1002. [Google Scholar] [CrossRef]
  45. Scarsella, M.; Torzillo, G.; Cicci, A.; Belotti, G.; De Filippis, P.; Bravi, M. Mechanical stress tolerance of two microalgae. Process Biochem. 2012, 47, 1603–1611. [Google Scholar] [CrossRef]
  46. Torzillo, G.; Sacchi, A.; Materassi, R.; Richmond, A. Effect of temperature on yield and night biomass loss in Spirulina platensis grown outdoors in tubular photobioreactors. J. Appl. Phycol. 1991, 3, 103–109. [Google Scholar] [CrossRef]
  47. Schädler, T.; Neumann-Cip, A.-C.; Wieland, K.; Glöckler, D.; Haisch, C.; Brück, T.; Weuster-Botz, D. High-Density Microalgae Cultivation in Open Thin-Layer Cascade Photobioreactors with Water Recycling. Appl. Sci. 2020, 10, 3883. [Google Scholar] [CrossRef]
  48. Přibyl, P.; Cepák, V.; Zachleder, V. Production of lipids in 10 strains of Chlorella and Parachlorella, and enhanced lipid productivity in Chlorella vulgaris. Appl. Microbiol. Biotechnol. 2012, 94, 549–561. [Google Scholar] [CrossRef] [PubMed]
  49. Zienkiewicz, K.; Du, Z.-Y.; Ma, W.; Vollheyde, K.; Benning, C. Stress-induced neutral lipid biosynthesis in microalgae—Molecular, cellular and physiological insights. Biochim. Biophys. Acta BBA Mol. Cell Biol. Lipids 2016, 1861, 1269–1281. [Google Scholar] [CrossRef] [PubMed] [Green Version]
  50. Adams, C.; Godfrey, V.; Wahlen, B.; Seefeldt, L.; Bugbee, B. Understanding precision nitrogen stress to optimize the growth and lipid content tradeoff in oleaginous green microalgae. Bioresour. Technol. 2013, 131, 188–194. [Google Scholar] [CrossRef] [PubMed] [Green Version]
  51. Bondioli, P.; Bella, L.D.; Rivolta, G.; Zittelli, G.C.; Bassi, N.; Rodolfi, L.; Casini, D.; Prussi, M.; Chiaramonti, D.; Tredici, M.R. Oil production by the marine microalgae Nannochloropsis sp. F&M-M24 and Tetraselmis suecica F&M-M33. Bioresour. Technol. 2012, 114, 567–572. [Google Scholar]
  52. Shakya, R.; Adhikari, S.; Mahadevan, R.; Hassan, E.B.; Dempster, T.A. Catalytic upgrading of bio-oil produced from hydrothermal liquefaction of Nannochloropsis sp. Bioresour. Technol. 2018, 252, 28–36. [Google Scholar] [CrossRef]
  53. Elliott, D.C. Review of recent reports on process technology for thermochemical conversion of whole algae to liquid fuels. Algal Res. 2016, 13, 255–263. [Google Scholar] [CrossRef] [Green Version]
  54. Pedro, A.S.; González-López, C.V.; Acién, F.G.; Molina-Grima, E. Outdoor pilot production of Nannochloropsis gaditana: Influence of culture parameters and lipid production rates in raceway ponds. Algal Res. 2015, 8, 205–213. [Google Scholar] [CrossRef]
  55. Pedro, A.S.; González-López, C.V.; Acién, F.G.; Molina-Grima, E. Outdoor pilot-scale production of Nannochloropsis gaditana: Influence of culture parameters and lipid production rates in tubular photobioreactors. Bioresour. Technol. 2014, 169, 667–676. [Google Scholar] [CrossRef]
  56. Huntley, M.E.; Johnson, Z.I.; Brown, S.L.; Sills, D.L.; Gerber, L.; Archibald, I.; Machesky, S.C.; Granados, J.; Beal, C.; Greene, C.H. Demonstrated large-scale production of marine microalgae for fuels and feed. Algal Res. 2015, 10, 249–265. [Google Scholar] [CrossRef] [Green Version]
  57. Darvehei, P.; Bahri, P.A.; Moheimani, N.R. Model development for the growth of microalgae: A review. Renew. Sustain. Energy Rev. 2018, 97, 233–258. [Google Scholar] [CrossRef]
  58. Lee, E.; Jalalizadeh, M.; Zhang, Q. Growth kinetic models for microalgae cultivation: A review. Algal Res. 2015, 12, 497–512. [Google Scholar] [CrossRef]
Figure 1. A thin-layer cascade (TLC) photobioreactor made of pond liner with an illuminated surface area of 50 m2. Two 12 m × 2 m channels were each connected with an open retention tank (A), a centrifugal pump (B), and an inlet module (C) for continuous circulation of the microalgal suspension. The reactor was placed in a glass hall of the TUM AlgaeTec-Center, with application of physically reproduced light and air conditions in accordance with 12 June 2012 in Almería, Spain. The yellow color of the microalgal suspension was caused by nitrogen limitation to induce the accumulation of lipids in M. salina.
Energies 14 00500 g001
Figure 2. (a) Mean daily specific growth rates (○) as a function of integral photosynthetic photon flux density I* measured during 4 independent nutrient-replete batch processes of 10 days in a thin-layer cascade reactor (A = 8 m2) with M. salina under a physically simulated Mediterranean summer climate. Error bars represent 95% confident intervals. Equation (18) was fitted to experimental growth rates via nonlinear regression (―). The grey lines () represent the 95% confidence interval of the identified Equation (18). (b) Mean daily specific growth rates (○) of M. salina as a function of urea concentration and integral photosynthetic photon flux density I* in a continuously operated thin-layer cascade reactor (A = 8 m2, D = 0.3 d−1) with an influent urea concentration of 1.2 g L−1 under a physically simulated Mediterranean summer climate.
Energies 14 00500 g002
Figure 3. (a) Specific lipid-free growth rate μ X L of M. salina as a function of intracellular nitrogen quota Q N in a TLC reactor (A = 8 m2) using a physical simulation of a Mediterranean summer climate. Equation (20) was fitted to the measured lipid-free growth rates and nitrogen quota via nonlinear regression (―). (b) Equation (21) was fitted to the measured daily lipid formation rates q L as a function of the lipid quota Q L via nonlinear regression (―). The grey lines () represent the 95% confidence interval of both fits.
Energies 14 00500 g003
Figure 4. Continuous lipid production with M. salina in two serially connected thin-layer cascade reactors under a physically simulated Mediterranean summer climate. The first TLC reactor (8 m2, 55 L, ○) was supplied with fresh feed medium and was operated at a hydraulic residence time of 2.5 d. The second TLC reactor (50 m2, 330 L, ) was supplied from the first reactor at a hydraulic residence time of 20 d. (a) Cell dry weight concentration (CDW, error bars omitted for visual clarity, average relative standard deviation 0.5%), (b) lipid concentration ( c L ), (c) lipid quota in dry weight, and (d) lipid space–time yield (STYLipid) of the first (─) and second TLC () and overall lipid STY of the reactor cascade (). The vertical line indicates the initiation of continuous operation.
Energies 14 00500 g004
Figure 5. Batch processes with M. salina in a thin-layer cascade reactor under a physically simulated Mediterranean summer climate, applying (a) nutrient-replete and (b) nitrogen-limited growth conditions. Experimentally measured cell dry weight (CDW, error bars omitted for visual clarity, average relative standard deviation 0.7%) concentration (○), lipid concentration (△), and urea concentration (), and simulated CDW concentration (), lipid concentration (--), and urea concentration (--).
Energies 14 00500 g005
Figure 6. (a) Cell dry weight concentration (CDW, error bars omitted for visual clarity, average relative standard deviation 0.5%), and (b) lipid concentration in a continuous process with M. salina using two serially connected thin-layer cascade reactors under a physically simulated Mediterranean summer climate. The first TLC reactor (8 m2, 55 L) was supplied with fresh feed medium and was operated at a hydraulic residence time of 2.5 d. The second TLC reactor (50 m2, 330 L) was supplied from the first reactor at a hydraulic residence time of 20 d. Experimental results of the first (○) and second reactor (), and simulation of CDW and lipid concentration in the first (─) and second reactor (). The vertical line indicates initiation of continuous operation.
Energies 14 00500 g006
Figure 7. Experimentally observed (white bars) and simulated (red bars) steady-state cell dry weight (CDW) concentrations with M. salina in continuously operated thin-layer cascade photobioreactors at dilution rates of 0.31 d−1, 0.4 d−1, 0.5 d−1, and 0.6 d−1 with urea concentrations in the feed medium of 1.2 g L−1, 1.5 g L−1, 1.2 g L−1, and 0.9 g L−1, respectively. Error bars represent single standard deviations of diurnally deviating CDW concentrations during the steady state.
Energies 14 00500 g007
Table 1. Comparison of the main characteristics of the two thin-layer cascade (TLC) photobioreactor designs used in this study.
Surface Area8 m250 m2
Working volume55 L330 L
Surface-to-volume ratio145 m−1152 m−1
Volume flow2.4 L s−14.8 L s−1
Suspension layer thickness0.6 cm0.6 cm
pH8.58.5
Table 2. Model parameters identified for the simulation of growth and lipid formation with M. salina in thin-layer cascade reactors under repeated physical simulation of light and air temperatures on 15 June 2012 in Almería, Spain. Error estimates represent the 95% confidence intervals of the respective fit. Superscript letters denote parameters that were estimated in the same experiments in this study or reported previously.
#ParameterValueUnit
1 *Extinction coefficient ε 0.925L g−1 cm−1
2 aMaximum biomass specific growth rate μ m a x 3.5 ± 1.1d−1
3 aLight saturation constant K S 633 ± 316µmol m−2 s−1
4 aPhotoinhibition constant K I 1223 ± 60µmol m−2 s−1
5 aPhotoinhibition sensitivity factor φ 12.6 ± 11.6-
6 bUrea saturation constant K N 0.11 ± 0.04g L−1
7 *Biomass yield coefficient with urea Y X N 4.2g g−1
8 bNightly maximum biomass specific decay rate, b m a x 0.17 ± 0.03d−1
9 cMaximum biomass specific lipid formation rate q L , m a x 0.08 ± 0.02g g−1 d−1
10 cMaximum specific lipid-free growth rate μ X L , m a x 0.54 ± 0.11g g−1 d−1
11Urea-limitation sensitivity factor α 2-
12 *Baseline lipid quota of M. salina Q L , 0 0.15g g−1
13 *Maximum lipid quota of M. salina Q L , m a x 0.46g g−1
14 cMinimum nitrogen quota in lipid-free CDW Q N , m i n 0.06 ± 0.00g g−1
a: agglomerated data from four processes; b and c: one process each, * reported previously.
Publisher’s Note: MDPI stays neutral with regard to jurisdictional claims in published maps and institutional affiliations.

