Article

Simulation Study on Active Air Flow Distribution Characteristics of Closed Heat Pump Drying System with Waste Heat Recovery

1
School of Ocean, Yantai University, Yantai 264005, China
2
Department of Automobile and Ship Engineering, Yantai Vocational College, Yantai 264670, China
3
School of Civil Engineering, Yantai University, Yantai 264005, China
*
Author to whom correspondence should be addressed.
Energies 2021, 14(19), 6358; https://doi.org/10.3390/en14196358
Submission received: 8 September 2021 / Revised: 29 September 2021 / Accepted: 2 October 2021 / Published: 5 October 2021
(This article belongs to the Topic Sustainable Energy Technology)

Abstract

:
A tridimensional turbulent flow model is established for a closed heat pump drying system with waste heat recovery to improve the drying air flow characteristics and reduce the energy consumption of air circulation. The active flow distribution mode is introduced to guide air flowing in the system’s drying cabinet, top air duct, mixing zone, and heat pump. It is found that the wind velocity in the cabinet’s supply channel is greater than that in the return channel, the velocity distribution in the top duct is uneven, and the outlet velocity of the bypass fan is high and a vortex forms. A partition panel added in the top duct and modulating fans in the drying cabinet are proposed to solve these problems. The simulation results show that removing the circulating fan, changing the volume flow of the bypass fan, adopting the alternative operation mode of the bypass fans, reducing the air volume flow of the supply fan, and reducing the total pressure of the fans can improve the dry air velocity uniformity in the drying cabinet and reduce the energy consumption of the fans. This paper analyzes the closed-loop drying air flow characteristics of the active flow distribution system in the heat pump drying system, which lays a foundation for the wind velocity, temperature, and humidity regulating of heat pump drying system with waste heat recovery.

1. Introduction

Heat pump drying uses circulating air with high temperature and low humidity to take away the moisture in materials and reduce their moisture content. In essence, it is a coupled process of heat and mass transfer [1,2]. The heat pump drying system uses the ambient heat source to obtain hot air, which has a remarkable energy-saving effect, and the drying process can be optimized by adjusting the temperature and humidity, which can significantly improve the drying effect [3,4,5,6,7,8,9,10].
Factors affecting the drying effect, such as wind velocity, temperature, humidity, and the structure of drying equipment, have been studied extensively. The uneven distribution of dry air is the most common problem in the drying cabinet. Aktas [11] designed a new drying chamber. It uses three stainless steel cylinders with a circular nested form that has the advantage of uniform air flow and prevents the spread of lightweight samples over a drying system. Olejnik [12] found that a modification of the chamber where a rotating disc had been used had a positive effect on the uniform distribution of air flows in the drying chamber. Luo [13] used air-deflectors on the drying chamber’s internal sidewalls to enhance the heat and mass transfer between the conveyor sludge and circulating airflow. Shamsuddeen [14] concluded that the front discharge in a hybrid heat pump dryer has better flow uniformity and lower power consumption in sea cucumber and oyster drying. Xu et al. [15] simulated the air distribution in the square heat pump drying cabinet and added an inlet baffle to improve the uniformity of air distribution near the material layer. Wang et al. [16] investigated a ginseng drying room. They pointed out that the inhomogeneous distributions of the air flow and temperature in the drying room are mainly influenced by the inlet airflow rate, inlet diameter, and the number of partition boards with stacked ginseng.
Natalia et al. [17] carried out the experimental and simulation study on drying uniformity in a tray dryer and found that low local turbulence values can negatively affect the local mass transfer coefficient. Yang et al. [18] measured and simulated the drying tower’s exhaust velocity under the unload condition to optimize its internal structure. Noh et al. [19] used Ansys Fluent to simulate and analyze the effect of product arrangement and different operating conditions on the airflow distribution inside the drying chamber of the newly developed solar dryer. The homogeneity of the distribution of the air velocity in an industrial meat dryer is discussed by Mirade [20] with a two-dimensional computational fluid dynamics model. Zheng et al. [21] set up a microwave dryer’s square drying cabinet’s simulation model to study the internal air flow field. They found that the air flow in the cabinet is more stable, and the air vortex in the cabinet can be reduced by installing the air balance plate in the discharge port’s air inlet and outlet pipe.
Many simulations and analysis studies of the flow field [22,23,24,25,26] are aimed at the drying cabinet but less at the closed drying system, including the drying cabinet and the closed-loop air cycle paths. In the closed heat pump drying system with waste heat recovery (Figure 1), the dry air circulates inside the completely closed channels. The drying medium may be air or other gas. The system operates without fresh air intake from the environment and without discharging waste gas into the environment. In the cycles, the drying air flows to dry materials, be reheated and dehumidified, recovers the waste heat to improve drying efficiency and reduce energy consumption [27]. Air flows along different paths to be distributed and mixed during circulation to obtain the required dry temperature and humidity. An air valve is commonly used to regulate air volume flow. But it has the disadvantages of leakage at fully closed valve position and low-temperature control precision due to the opening’s line regulation failure. Therefore, it is vital to study novel air flow regulation in heat pump drying to optimize the drying process of materials, improve the drying quality, and reduce the system energy consumption. The focus of the current work is that the active flow distribution driven by a fan is introduced in a closed heat pump drying system, and its influence on the velocity distribution of closed-loop circulation air in the system is studied through numerical simulation and experimental methods. This provides a reference for the design and structure optimization of the closed heat pump drying cabinet.

2. The Closed Heat Pump Drying System with Waste Heat Recovery

Figure 2 is the schematic diagram of the closed waste heat recovery type heat pump drying test rig. The drying box comprises four sections: drying cabinet, mixing zone, heat pump zone, and top air duct. The overall size of the drying box is 7300 mm (long) 2000 mm (wide) 2800 mm (high). A horizontal partition is installed at a distance of 550 mm from the top of the box. From left to right, the drying cabinet, the mixing zone, and the heat pump zone are below the partition and are 4900 mm, 900 mm, and 1500 mm in length, respectively. A vertical partition is installed in the middle of the drying cabinet to divide it into supply and return channels. Two groups of material pallets are placed on the two channels of the drying cabinet. The size of each pallet is 800 mm (long), 600 mm (wide), and 50 mm (high). There is a door on the left side of the drying box to load or unload the materials. An air channel is located between the door and the left ends of the horizontal and vertical partitions. A condenser is arranged in the top air duct above the mixing zone. The heat pump zone comprises the compressor, auxiliary condenser, evaporator, and sensible heat exchanger.
Fans in different paths realize the active flow distribution of dry air in the system. The parameters of the fans are shown in Table 1. The partition wall between the drying cabinet and the mixing zone is equipped with six reversible axial flow fans (GKT/FB5S-4D). They are divided equally into two groups. Fans in each group alternately function as the supply fan and the return fan by adjusting the rotation direction, guiding the air in the drying cabinet to flow clockwise or counterclockwise, and ensuring homogeneous drying. Two bypass fans (GKF/FB3S-2D) are installed on the left side of the top air duct. Two circulating fans (GKF/FB3S-2D) are installed on the partition between the top air duct and the mixing zone. A centrifugal fan is arranged on the lower wall between the heat pump zone and the mixing zone.
The drying air in the mixing zone is sent to the drying cabinet under the action of the supply and return fans. When flowing along the supply channel to the end of the vertical partition, a part of it goes to the return channel and flows back to the mixing zone through the return fans. Another part of the air is introduced into the top duct under the bypass fan’s action and divided into two parts. One part is driven by the circulation fan into the condenser 22 to get heated and then returns to the mixing zone. The other part is driven by the centrifugal fan-7 to flow down to the heat pump zone and enters the sensible heat exchanger-4 from its left side to the right side. Then it enters evaporator 3 to be dehumidified. After leaving the evaporator, it goes back upwards and enters heat exchanger-4 again from the upper side. Then it flows out from the lower side after absorbing heat and enters the auxiliary condenser 21 to be reheated. Then it enters the mixing zone through the centrifugal fan-7 and finishes the heat pump air path, in which the waste heat is recovered, and the air is dehumidified. The closed-loop air flow circulates in the drying cabinet, condenser, and the heat pump and is distributed under the joint action of the circulation fan, the centrifugal fan, the supply and return fans to complete the tasks of the circulation heating, the waste heat recovery, and the de-humidification to maintain the required temperature and humidity for drying.

3. Mathematical Models

3.1. Assumptions

The drying air is regarded as an ideal gas in the simulation, without component variation and energy exchange. It flows steadily. The application of the active flow distribution leads to high velocity in the drying box, and the maximum Reynolds number is 26,574, so the flow is in a state of turbulent flow. The work was carried out by ignoring the viscous force of air. The resistive loss of each heat exchanger is omitted in the model.

3.2. Governing Equation

The air flow in the drying cabinet satisfies the continuity equation and conservation of momentum.
Continuity equation:
ρ t + ρ u i x i = 0
where ρ is the density of the air; t is time; u i is the vector velocity of the air; x i is the Cartesian coordinates.
Momentum conservation equation:
ρ u i t + ρ u i u j x i = p x i + x j μ a + μ t u i x j + u j x i = 0
The standard κ ϵ model is chosen as the turbulence model, which is composed of turbulent kinetic energy equation and turbulent dissipation rate equation [28,29].
Turbulent kinetic energy equation:
ρ k t + ρ k μ i x i = x j μ a + μ t α k k x j + μ a + μ t u i x j + u j x i u i x j ρ ε
Turbulent dissipation rate equation:
ρ ϵ t + ρ ϵ μ i x i = x j μ a + μ t α ε ϵ x j + C 1 ε ϵ k μ a + μ t u i x j + u j x i u i x j C 2 ϵ ρ ϵ 2 k
where μ a is the average viscosity, μ t is the turbulent viscosity, μ t = ρ C μ k 2 ϵ ; The α k = 1.0 and α ϵ = 1.3 are the Planck numbers corresponding to the turbulent kinetic energy and the dissipation rate, respectively; C 1 ϵ , C 2 ϵ , and C μ are constants of 1.44, 1.92, and 0.09, respectively.
Because the drying air circulates in the closed drying system, there are no inlet or outlet conditions. The boundary conditions are 0 m/s on the walls and partition planes.
In modeling, coarse, standard, fine, and extremely fine meshes are calculated. The mean velocity results show that the deviations of standard, fine, and extremely fine meshes are within ±5%. Therefore, the following works are performed using standard meshes (Figure 3) to save computation time.

4. Model Validation

Ten hot wire anemometers (JY-GD2 type), with a measuring range of 0–15 m/s and accuracy of ±0.2 m/s, are arranged uniformly from top to bottom at the middle section of the supply and return channel in the drying cabinet to verify the model’s accuracy. The sensor probes are located in the middle of the adjacent pallets on the shelf with heights of 0.25 m, 0.65 m, 1.05 m, 1.45 m, and 1.85 m, respectively. The supply channel is numbered 1 to 5 from top to bottom, and the return side is numbered from 6 to 10. The data is recorded every 1 min during the test, and the test lasted for at least 30 min. The velocity values for each point during the steady test period were averaged and compared with the measured ones at each point, as shown in Figure 3.
As shown in Figure 4, the absolute and relative velocity errors between the simulated and experimental results are within 0.02–0.18 m/s and 0.99%–7.56%, respectively. The simulation results are in good agreement with the experimental data, which proves the model’s accuracy.

5. Results and Analysis

The simulated streamlines and flow fields of the closed heat pump drying system with waste heat recovery are shown in Figure 5. The active flow distribution of the closed-loop drying air is driven by the fans and works well. The air from the supply fan enters the circulation passage of the drying cabinet and the top duct. Then, it enters the condenser and the heat pump and finally returns to the mixing zone. The supply, return, bypass, centrifugal and circulation fans drive air flow in the drying system to make the closed-loop air circulation including the drying cabinet circulation passage, circulation heating passage, and heat pump air passage.
The distribution of air velocity in different planes is analyzed below.

5.1. Sections in the x Direction

Figure 6 shows the velocity distribution on these four planes at specific X locations. The velocity distributions in the top duct (Z > 2.2 m), the air supply channel (0 < Y < 1 m) and the return channel (1 < Y < 2 m) are different on the x section. The turbulent flow in the drying cabinet and the wake effect of air flowing out of the shelf results in a higher velocity near the wall than in the middle. The velocity is higher (6–8 m/s) near the lower part of the partition in the air supply channel. The velocity is higher near the cabinet wall and a vortex is generated in the middle. The maximum velocity is over 10 m/s in the top duct. The velocity between the adjacent pallets of the shelf is slightly smaller than that near the wall, as shown in Figure 6b. The velocity in the air supply channel is greater than that in the return channel due to the top duct branch. The velocity distribution of the section in Figure 6c is similar to that of the x = 2.25 m section, but its supply channel average velocity is higher because of flow resistance. The velocity distribution of the section in Figure 6d is similar to that of the x = 1.2 m section, but its average velocity is higher. The maximum velocity is over 12 m/s near the lower part of the vertical partition. It is found that the velocity near the fan is higher on the left and right sides of the return channel. Moreover, the velocity distribution becomes more uniform away from the fan, and velocity above the supply duct is always higher.

5.2. Sections in the y Direction

The velocity distribution in the drying cabinet, the top duct, mixing zone, and the heat pump can be obtained from Y planes. Figure 7a is a velocity profile on the y = 0.75 m plane in the supply channel. The velocity increases when the air flows between the adjacent pallets. The velocities in the passage between the pallets of different heights are different. The velocity in the lower layer is generally higher than that in the upper layer, and the velocity in the lower outlet of the supply fan is the highest (10–12 m/s). The velocity between the pallets of the shelf near the supply and return fan is larger than that far away from the fans. Figure 7b shows the velocity profile on the y = 1.35 m plane in the return channel. Eddy currents are present in the return channel in the x = 0.5–2 m region due to reduced static pressure at the inlet of the return passage. This reduction is caused by the bypass fan running in the top duct.
From the profiles at different Y positions, it is found that the velocity in the air supply channel is larger than that in the return channel, and the velocity on the vertical section in the air supply channel varies greater than that in the return channel especially near the supply fan. The velocity difference between the supply and return channels and the increase of moisture content along the dry air flow, will reduce the drying capacity of drying air, resulting in uneven drying of the materials placed in the two channels. Therefore, closed-type heat pump drying operation should periodically adjust the direction of the supply and return fan to reduce uneven drying. On the other hand, uneven velocity distribution exits between the upper and lower air passages over pallets of the shelf. It will also lead to uneven drying in the upper and lower pallets. Hence, the amount of material can be arranged according to the height with fewer materials on the upper layer to ensure synchronous drying and good quality.
It can also be seen from Figure 7 that there are eddies in the mixing zone and heat pump zone. In the heat pump zone, the drying air flows from the top loop down to the heat pump zone under the action of a centrifugal fan. The air flow horizontally into the sensible heat exchanger from the left to the right side and releases heat (Figure 7a). Then it moves sequentially to the evaporator for dehumidification, the sensible heat exchanger from the upper inlet to absorb heat (Figure 7b), the condenser to absorb heat, and then through the centrifugal fan into the mixing zone.

5.3. Sections in the z Direction

Figure 8a and b are velocity profiles on Z = 0.4 m and Z = 1.75 m planes in the drying cabinet, respectively. As can be seen that, the velocity range in the lower part of the drying cabinet (Z = 0.4 m) is higher than that in the upper part (Z = 1.75 m). It is observed that there is a vortex near the partition in the return channel. Figure 8c is a velocity field on a z = 2.25 m plane in the top loop. The velocity at the outlet of the bypass fan over the supply channel of the drying cabinet, with the maximum velocity up to 20 m/s, is higher than that over the return channel, which causes uneven velocity distribution and produces a vortex. Because the supply and return fans in the drying cabinet are two-way fans, the circulation direction conversion of the air in the drying box can be realized. When the return fans reverse flow and function as the supply fans, and the supply fans reverse flow and function as the return fans, the outlet velocity of the upper bypass fan in the top duct will be higher than that of the lower fan, and the vortex will also appear.

6. Discussions

The existence of vortices in the upwind side of the material in the drying cabinet can enhance the convective heat transfer between the air and the material and is favorable for drying. However, the existence of vortices in the top loop will result in energy wastage. In order to reduce unnecessary vortices, two improvements are made to the top duct. First, a partition panel is installed in the top duct at y = 1.1 m location to form two new channels: the front and back channels in the top duct. At the same time, the simultaneous operation of two bypass fans is changed to an alternating operation of one fan at a time. When the supply and return fans are running, the front bypass fan runs, the back one stops, and when the supply and return fans reverse, the back bypass fan runs, the front one stops. Thus, when one of the bypass fans is running, the air flows in one of the channels formed by the partition panel, while the other one stops, thus reducing power consumption. Secondly, because the inlet of the heat pump air passage is far from the right wall of the drying box, a vortex generates at the right end of the top duct. This results in additional energy consumption and even a stagnant zone when the air enters the heat pump. Therefore, the right wall of the top channel was shifted left by 0.8 m to improve the flow condition of the top channel. The supply fans produce negative pressure in the mixing zone, and air in the top duct can flow directly into it under the pressure difference. Therefore, the circulation fans are not needed and can be removed to reduce the energy consumption of fans in the system.
The model was used to simulate the flow fields of the improved system to analyze the velocity uniformity of the drying cabinet, the fan’s energy consumption, and to estimate the optimal design and operation of the closed drying box. The existing active fan flow distribution and improved programs are simulated as listed in Table 2.
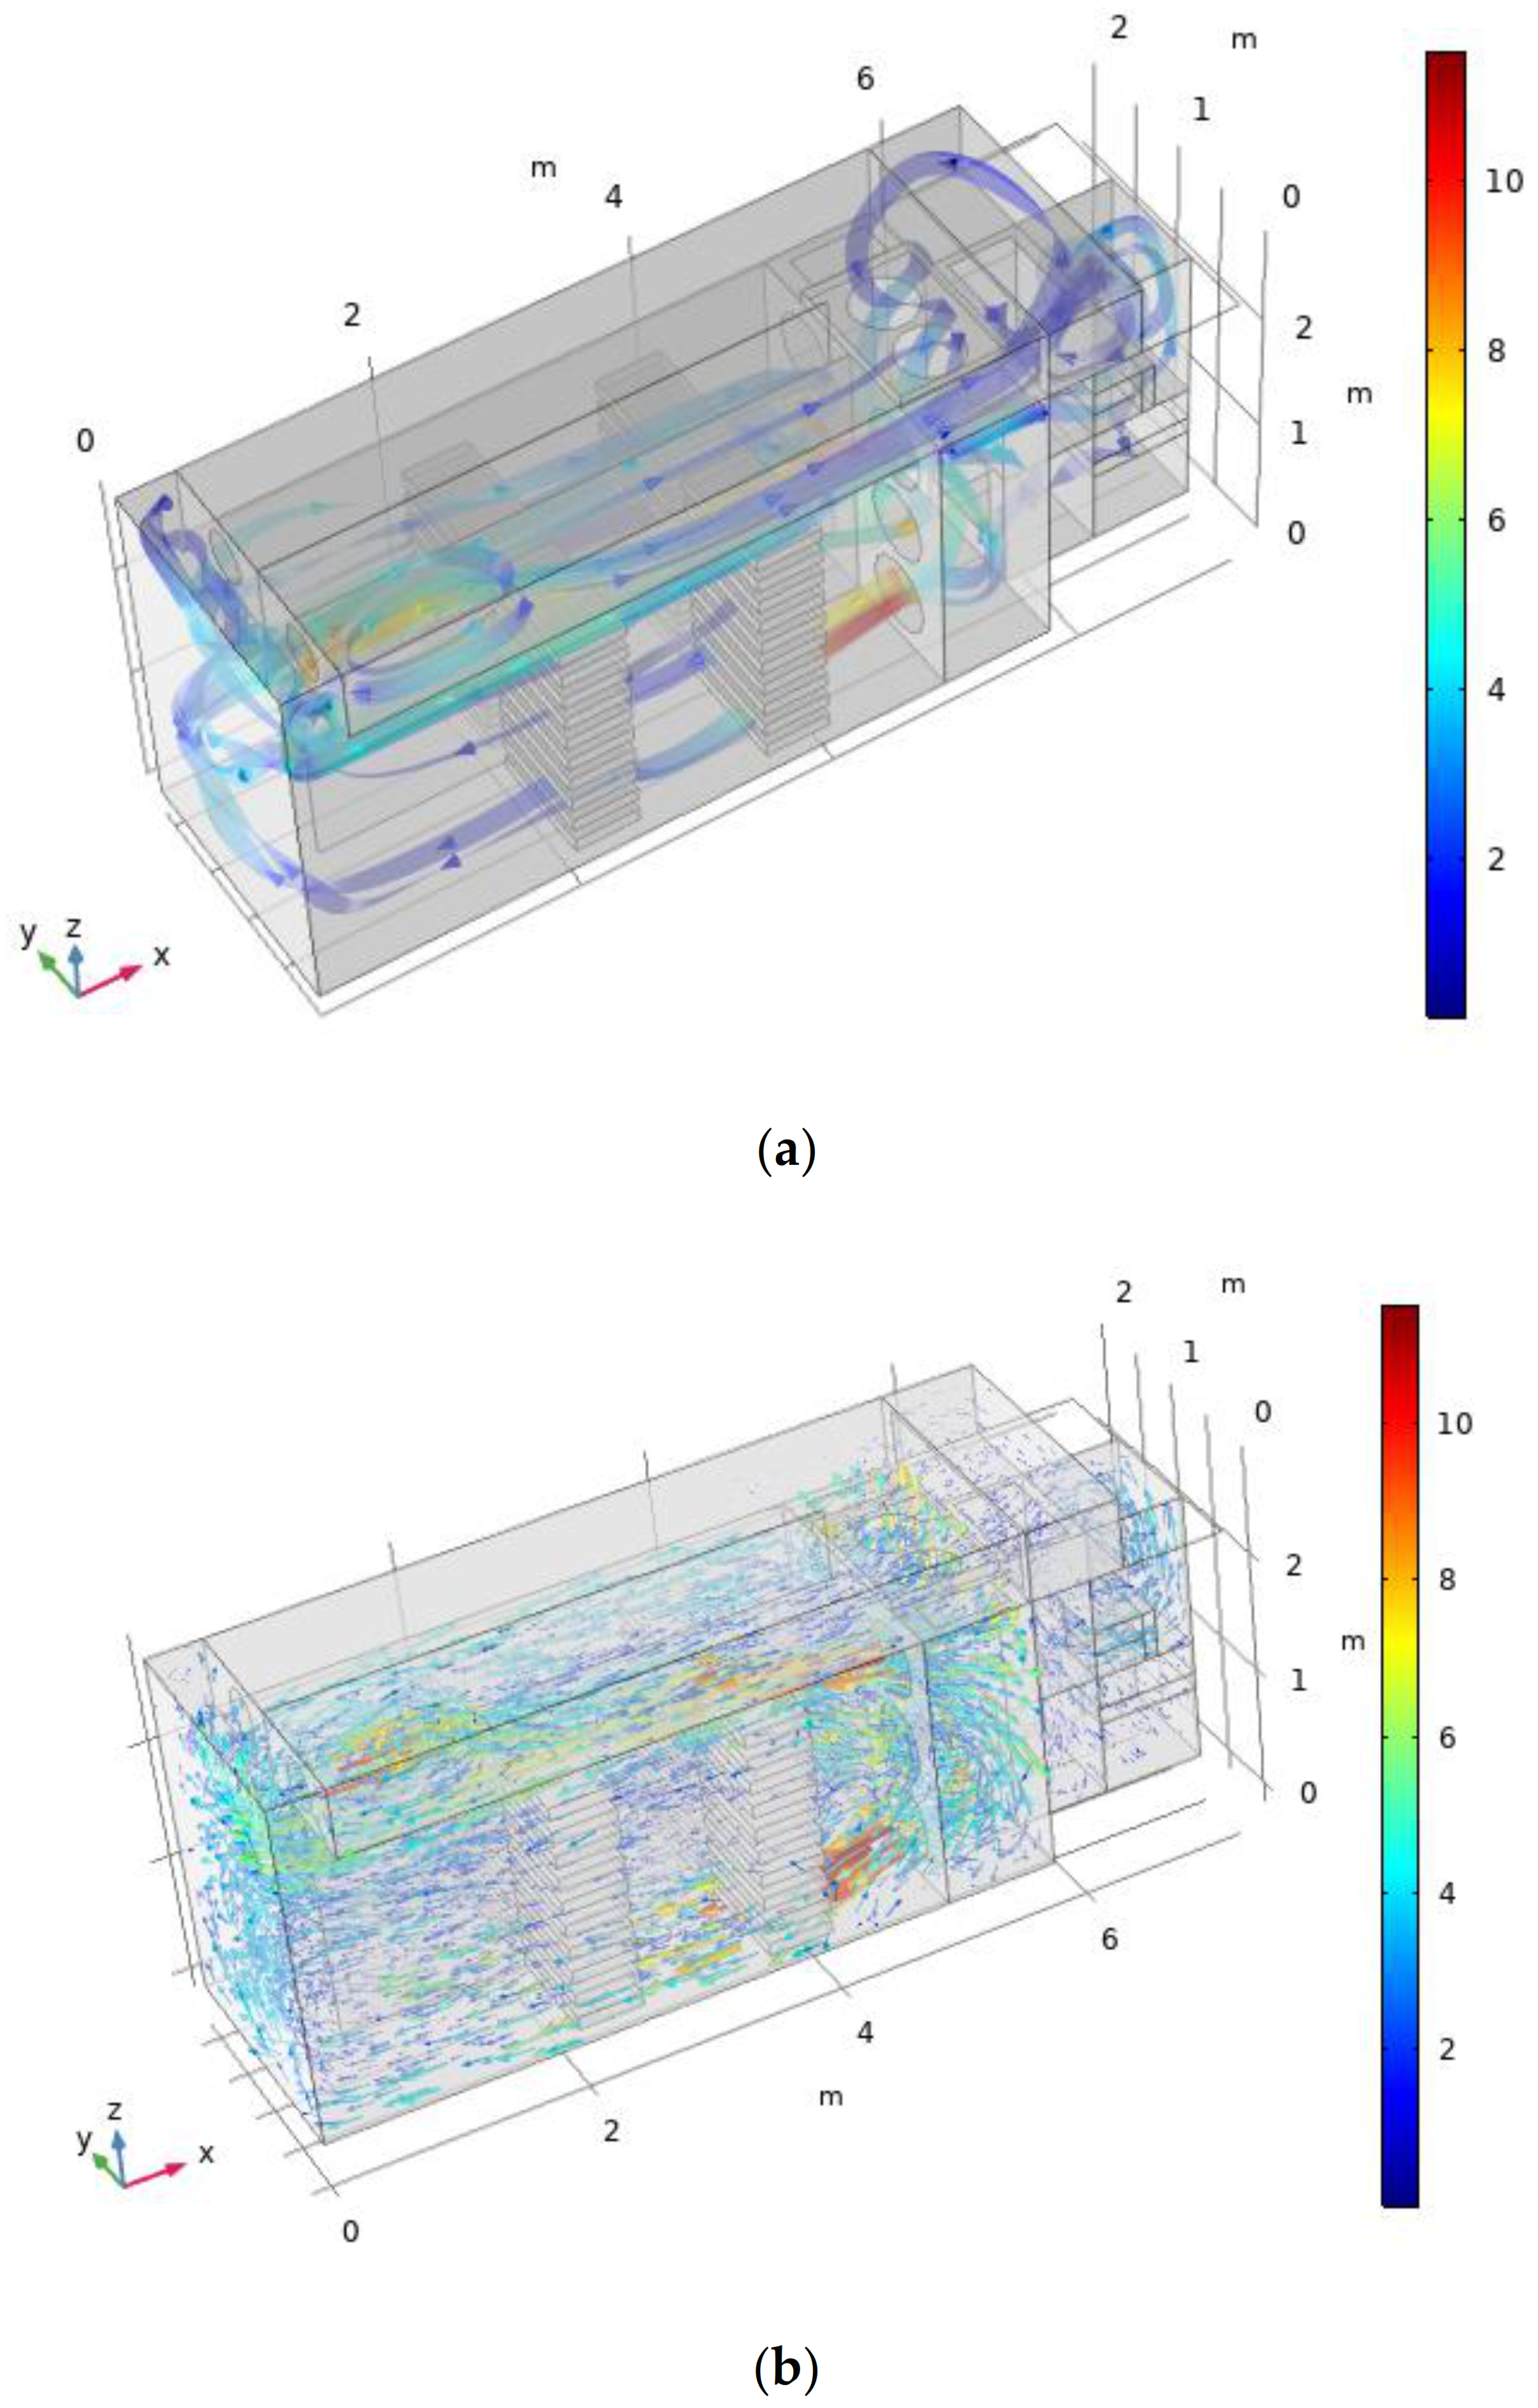
Figure 9 shows simulated streamlines and velocity distribution of the drying cabinet for the P3 program. As shown, after taking measures such as installing a partition panel on the top duct, replacing the bypass fan with intermittent opening, and removing the circulation fan, the air can still circulate in the drying cabinet, the heat pump, and the mixing zone. Compared with Figure 5, the maximum velocity in the system decreased, but the velocity in the drying cabinet varied little after the modification.
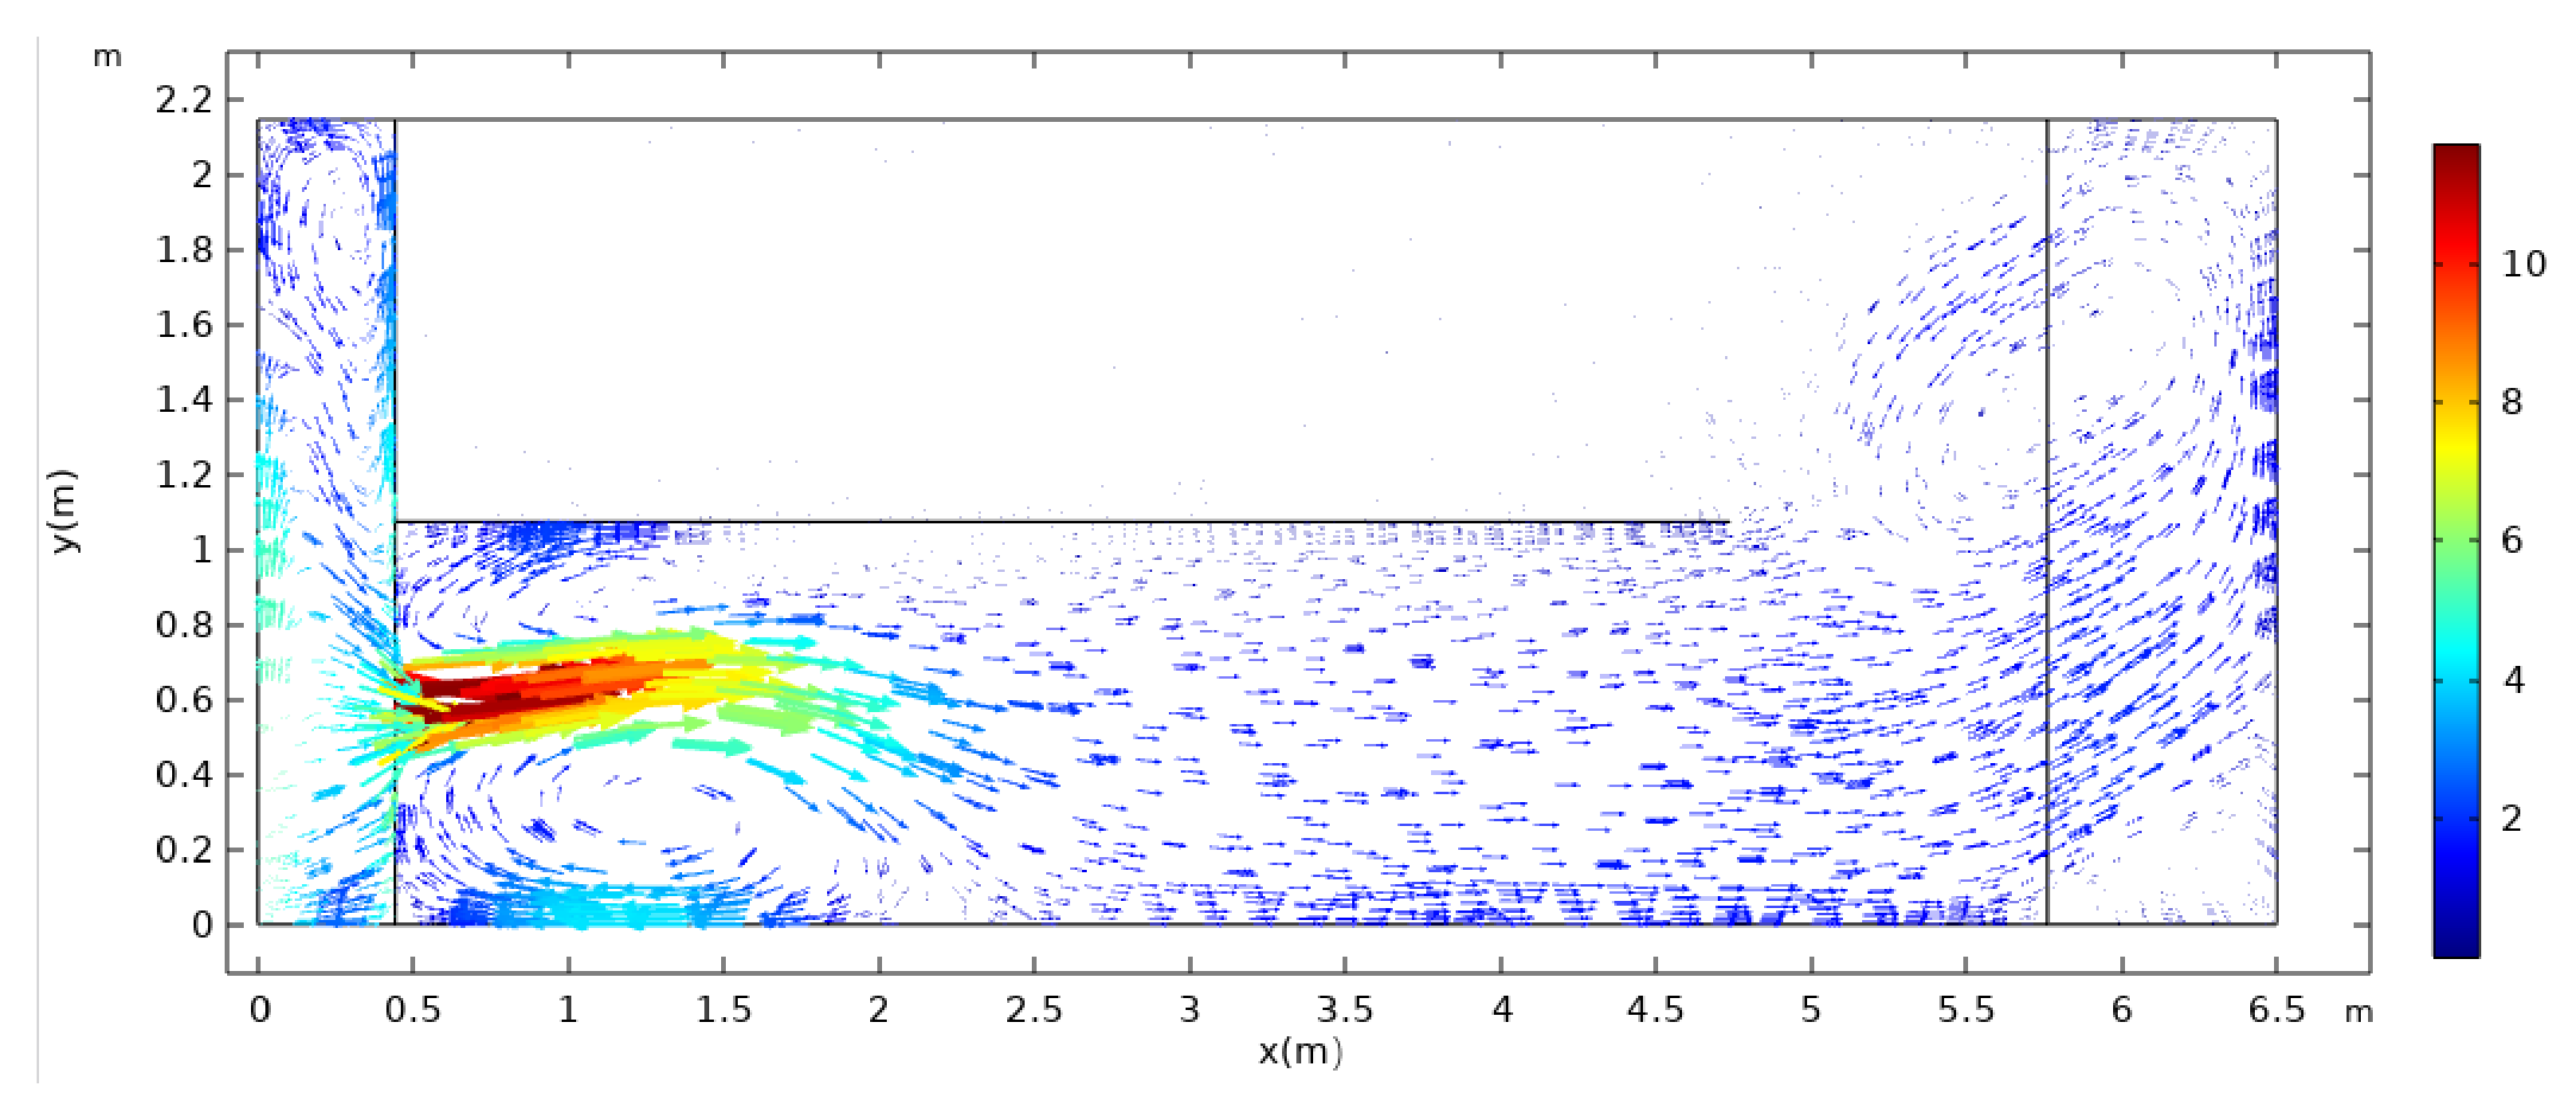
Figure 10 shows the simulated velocity distribution at the z = 2.55 m section for the P3 program. It can be seen that the installation of the partition panel in the top duct abates the vortex in Figure 8c, and the top flow field is improved.
Figure 11 shows the turbulent kinetic energy distribution at the Z = 2.55 m section in the P3 program. It can be seen that the maximum turbulent kinetic energy appears on the left side of the section, which provides energy for the air to flow into the return and the top passage to realize reasonable allocation of air volume flows. When the front bypass fan runs, the maximum turbulent kinetic energy in the top duct occurs in the front channel, driving the air to the right, entering the mixing zone and the heat pump air passage.
To quantitatively analyze the performance variation of the improved drying box, parameters such as average velocity u, velocity uniformity coefficient Ku and fan energy consumption P are defined according to the simulation results.
Average velocity:
u = V u i V
Velocity uniformity coefficient:
K u = V u i u 2 V
Fan energy consumption:
P = Q Δ P / η
where u is the velocity, m/s, V is the volume of the drying cabinet, m3, Q is the air volume flow, m3/s, Δ P is the total pressure, pa, and η is the fan efficiency.
Figure 12 and Figure 13 show the average velocity and the velocity uniformity coefficient in the drying cabinet and the energy consumption of the fans after the volume flow of the bypass fan is altered. The average velocity is reduced by 3.6–6.0%, and the velocity uniformity coefficient is reduced by 14.2–14.4% when two 1800 m3/h volume flow bypass fans of the P0 scheme are replaced by 2400 m3/h, 3000 m3/h, and 3600 m3/h volume flow fans with alternating operation of P1–P3 programs.
Different materials require different drying air velocities. Motevali et al. [30] adopt 0.5–1.5 m/s in their study, and Majdi et al. [31] found the drying air rate was 0.1 m/s for optimum drying time and energy consumption for an application involving apple slices. Wang et al. [16] adopt the maximum air velocity of 1.3 m/s in American Ginseng drying. Roberto et al. [32] studied the drying kinetics of olive-waste cake during turbulent drying at a velocity of 2 m/s. These studies show that P1–P3 programs still satisfy the drying requirements of most materials and attain better uniformity in the drying cabinets.
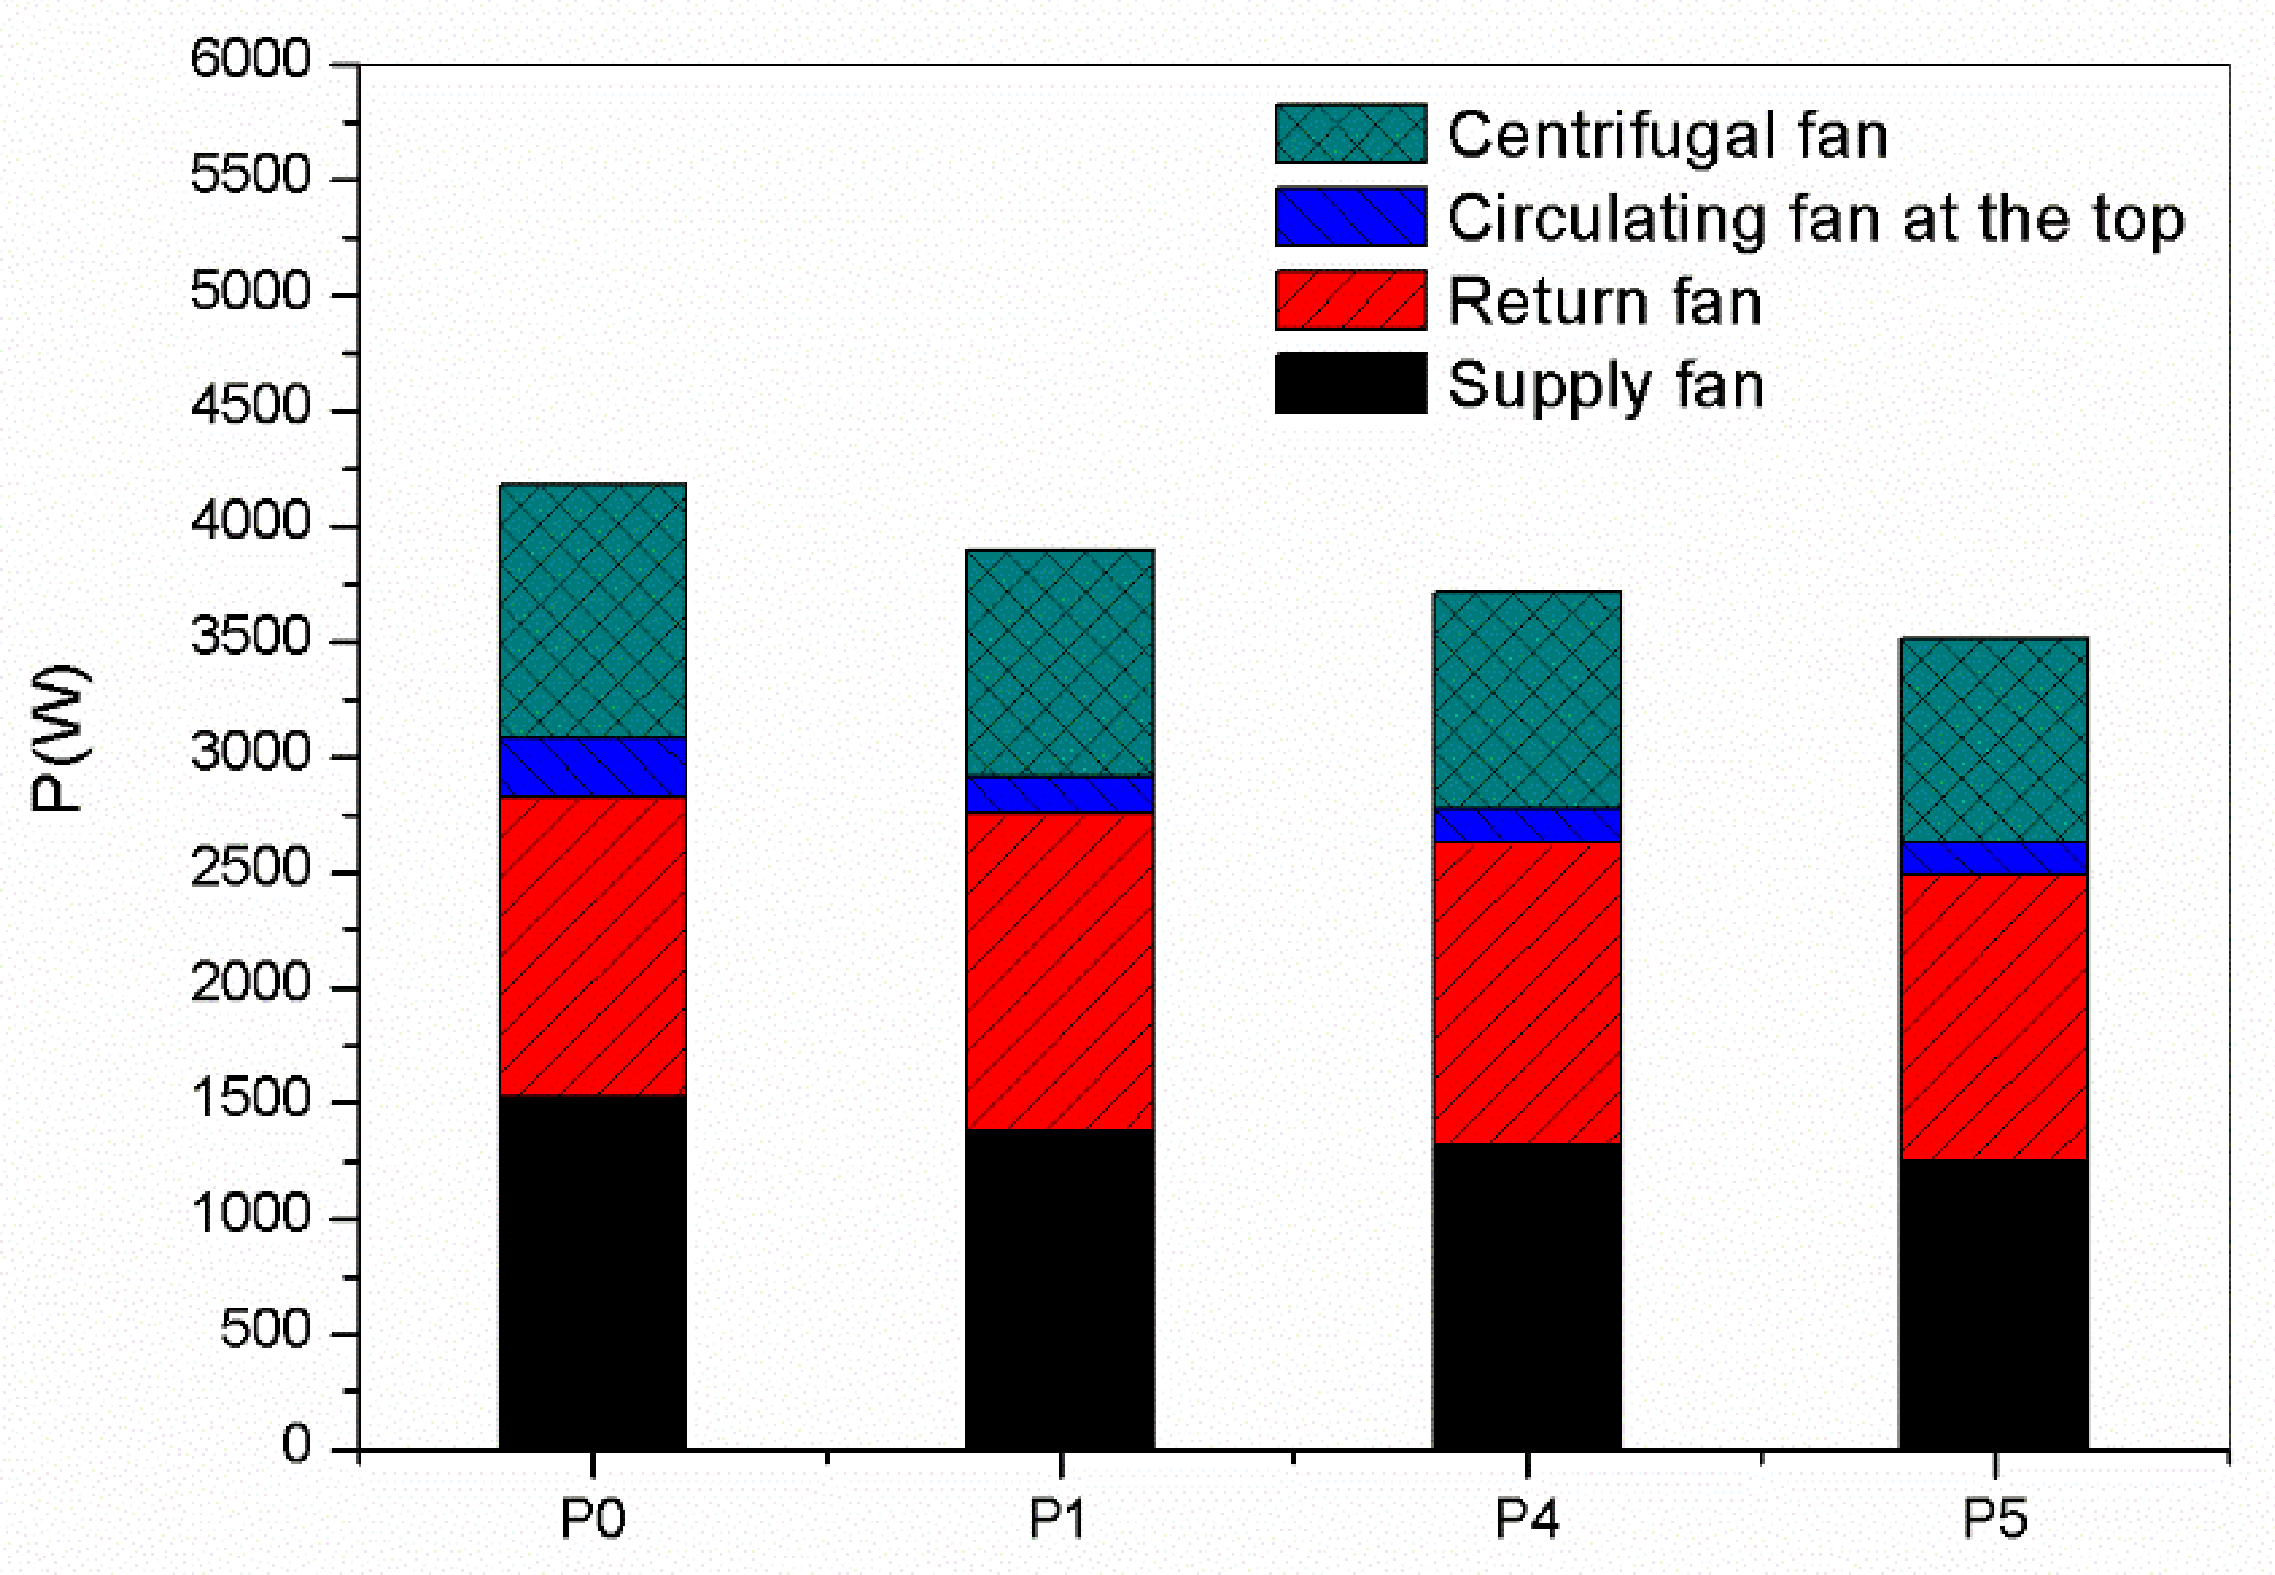
As shown in Figure 14, the power consumption of the supply fans in the P1–P3 programs is slightly reduced compared to the P0 program. Only one bypass fan runs with reduced volume flow, and circulating fans are removed so that the total energy consumption of the fans in the P1–P3 program is 13.4%, 12.6%, and 12.0% lower than the P0 program, respectively. Subsequently, the total energy consumption of fans is obviously reduced. This conclusion is consistent with a study by Nwakuba et al. [33], which found that as aerodynamic devices consume more energy, the drying energy consumption increases with increased air velocity.
According to the simulation results, the flow rates from the top air duct to the mixing zone and the heat pump are calculated. Taking the P0 and P1 programs as examples, the flow rates from the top air duct to the mixing zone are 1.27 m3/s and 1.17 m3/s, respectively, with a reduction of 0.1 m3/s (7.9%). The flow rates from the top air duct to the heat pump passage are 3.31 m3/s and 3.05 m3/s, respectively, with a reduction of 0.26 m3/s (7.8%). Compared with the original P0 program, the air flows from the top air duct to the mixing region and the heat pump have little change, which remains the heating and dehumidifying capacities of the drying air largely the same.
Figure 14 and Figure 15 show the average velocity and the velocity uniformity coefficient in the drying cabinet and the energy consumption of the fans after the volume flows of the supply fans are changed, respectively. It can be seen that the average velocity in the drying cabinet is 4.6% and 9.5% lower than that in the P1 program. The velocity uniformity coefficient is reduced from 1.61 to 1.53 and 1.45 for 63000 m3/h and 6000 m3/h of supply volume flow, respectively. It shows that reducing the volume flow of the supply fan can reduce the velocity in the drying cabinet but improves uniformity. As shown in Figure 15, the total energy consumption of fans in the P4–P5 program is 4.7% and 9.8% lower than that in the P1 program because the power consumption of fans decreases with the decrease in volume flow.
In the active flow distribution system, the series-parallel connected fans drive the air circulating in the system. The change of total pressure will affect the velocity distribution in the drying system and further affect the energy consumption. Figure 16 and Figure 17 show the average velocity and the uniformity coefficient in the drying cabinet and the fans’ energy consumption after changing the fans’ total pressures. The total pressure of each fan in the P6 and P7 programs is 10% and 20% lower than that in the P5 program. The average velocity in the drying cabinet decreases from 2.2 m/s to 2.1 m/s (−1.9%) and 2.0 m/s (−4.2%), while the uniformity coefficient decreased from 1.45 to 1.42 and 1.43. The results show that the velocity in the drying cabinet decreases slightly, and the uniformity becomes better when the total pressure of the fan is reduced. As shown in Figure 17, the total energy consumption of fans in the P6–P7 program is 5.4% and 12.6% lower than that in the P5 program, respectively. This reduction is due to the lower energy consumption of each fan. It proves that the total fan energy consumption decreases with the reduction in the total pressure of the fans.
From the above analysis, it can be concluded that by changing the operation mode of the bypass fan, selection fans with different air flow rates and total pressures can improve the internal uniformity and reduce energy consumption. However, the average air velocity in the drying cabinet is reduced. The closed drying system should operate in heating, dehumidification, and constant temperature modes, each mode requires different velocities. Drying air flows in the cabinet, top duct, mixing zone and heat pump are interrelated. Low velocity will directly reduce the drying speed and affect heating and dehumidification abilities for the drying operation. Therefore, in the design of the active flow distribution of the closed-type drying box, the requirement of wind speed, uniformity, and energy consumption of the fans should be considered comprehensively. In addition, because more fans are installed in the active flow distribution, attention should be paid to the matching of volume flow and total pressure in fan selection to avoid system stalling.

7. Conclusions

This paper establishes a turbulent flow model for a closed heat pump drying system with waste heat recovery. The model of the P0 program is proved by experiments. The simulation results show that the active flow distribution system composed of the bypass, centrifugal, circulation, supply, and return fans can facilitate closed-loop drying air circulation in the drying system. Air flow allocates well among the drying cabinet passage, top air duct, circulation heating passage, and heat pump air passage. The simulation results show that the velocity in the supply channel of the drying cabinet is larger than that in the return channel, and the velocity over the upper and lower pallets in the material shelf is different. This can be used to guide the arrangement of materials in the drying cabinet. The supply and return fans should take alternate direction rotation operation mode to ensure the synchronized drying of materials and drying quality. It is also found that the air distribution in the top duct is not uniform, and there are vortices.
In order to improve the velocity uniformity in the drying cabinet and reduce the energy consumption of the fans, the simulation method was used to study the flow field in the drying cabinet by adding a partition panel in the top passage, reducing the number of fans, changing the volume flow and total pressure of fans. The results show that removing the circulation fan, changing the volume flow of the by-pass fan, adopting the alternate operation mode, reducing the volume flow of the supply fan, and reducing the total pressure of the fan, improved the uniformity in the drying cabinet and reduced the total energy consumption of the fans. However, all of the above methods will reduce the average velocity inside the drying cabinet. In the actual operation, the active flow distribution design of the closed-type drying box should be carried out according to the demand of the dry air velocity and the drying operation mode of the closed-type drying box, considering factors such as the wind speed requirement, uniformity, and the energy consumption of the fans. The results can guide the design of the active flow distribution system of the closed drying box and lay a foundation for the control of the air velocity, temperature, and humidity of the heat pump drying system.

Author Contributions

Modelling, H.-B.Z. and K.W.; experiment test, J.-F.Z.; software, H.-B.Z.; validation, H.-B.Z.; writing—original draft preparation, H.-B.Z.; writing—review and editing, K.W. All authors have read and agreed to the published version of the manuscript.

Funding

This research was funded by the Yantai Science and Technology Plan Project, grant number 2020XDRH097 and Shandong natural science foundation, grant number ZR2014EL029.

Institutional Review Board Statement

Not applicable.

Informed Consent Statement

Not applicable.

Data Availability Statement

Not applicable.

Conflicts of Interest

The authors declare no conflict of interest.

References

  1. Lamidi, R.O.; Jiang, L.; Pathare, P.B.; Wang, Y.D.; Roskilly, A.P. Recent advances in sustainable drying of agricultural produce: A review. Appl. Energy 2019, 233, 367–385. [Google Scholar] [CrossRef] [Green Version]
  2. Raghavi, L.; Moses, J.; Anandharamakrishnan, C. Refractance window drying of foods: A review. J. Food Eng. 2018, 222, 267–275. [Google Scholar] [CrossRef]
  3. Aktaş, M.; Şevik, S.; Özdemir, M.B.; Gönen, E. Performance analysis and modeling of a closed-loop heat pump dryer for bay leaves using artificial neural network. Appl. Therm. Eng. 2015, 87, 714–723. [Google Scholar] [CrossRef]
  4. Goh, L.J.; Othman, M.Y.; Mat, S.; Ruslan, H.; Sopian, K. Review of heat pump systems for drying application. Renew. Sustain. Energy Rev. 2011, 15, 4788–4796. [Google Scholar] [CrossRef]
  5. Li, T.; Yuan, Z.; Li, W.; Yang, J.; Zhu, J. Strengthening mechanisms of two-stage evaporation strategy on system performance for organic Rankine cycle. Energy 2016, 101, 532–540. [Google Scholar] [CrossRef]
  6. Li, Y.; Li, W.; Liu, Z.; Lu, J.; Zeng, L.; Yang, L.; Xie, L. Theoretical and numerical study on performance of the air-source heat pump system in Tibet. Renew. Energy 2017, 114, 489–501. [Google Scholar] [CrossRef]
  7. Vaitkus, L.; Dagilis, V. Refrigerant charge reduction in low-temperature transport refrigerator with the eutectic plate evaporator. Int. J. Refrig. 2014, 47, 46–57. [Google Scholar] [CrossRef]
  8. Qiu, Y.; Li, M.; Hassanien, R.; Wang, Y.; Luo, X.; Yu, Q. Performance and operation mode analysis of a heat recovery and thermal storage solar-assisted heat pump drying system. Sol. Energy 2016, 137, 225–235. [Google Scholar] [CrossRef]
  9. Wang, W.; Li, M.; Hassanien, R.H.E.; Wang, Y.; Yang, L. Thermal performance of indirect forced convection solar dryer and kinetics analysis of mango. Appl. Therm. Eng. 2018, 134, 310–321. [Google Scholar] [CrossRef]
  10. Zhang, L.; Dong, J.; Jiang, Y.; Deng, S.S.; Huang, S. An experimental study on frosting and defrosting performances of a novel air source heat pump unit with a radiant-convective heating terminal. Energy Build. 2018, 163, 10–21. [Google Scholar] [CrossRef]
  11. Aktaş, M.; Khanlari, A.; Aktekeli, B.; Amini, A. Analysis of a new drying chamber for heat pump mint leaves dryer. Int. J. Hydrog. Energy 2017, 42, 18034–18044. [Google Scholar] [CrossRef]
  12. Olejnik, T.P.; Mysakowski, T.; Tomtas, P.; Mostowski, R. Optimization of the Beef Drying Process in a Heat Pump Chamber Dryer. Energies 2021, 14, 4927. [Google Scholar] [CrossRef]
  13. Luo, W.-J.; Lin, C.-Y.; Wu, N.-F.; Xu, Z.-Q. Performance Enhancement of a Sludge Continuous Feed Heat Pump Drying System by Air Deflectors and Auxiliary Cooling Subsystems. Energies 2020, 13, 6651. [Google Scholar] [CrossRef]
  14. Shamsuddeen, M.M.; Cha, D.-A.; Kim, S.-C.; Kanemoto, T.; Kim, J.-H. Performance Study of a Hybrid Heat Pump Dryer based on Numerical Analysis and Experimental Set-up. J. Therm. Sci. 2021, 30, 111–122. [Google Scholar] [CrossRef]
  15. Xu, K.X.; Liu, G.B.; Li, L.S.; Wang, T.Z.; Luo, F.Q. Simulation on Airflow Distribution in Double-layer Drying Cabinet of Heat Pump Drying. Chin. J. Refrig. Technol. 2020, 40, 34–39. [Google Scholar]
  16. Wang, P.; Liu, G.; Ao, S.; Sun, D.; Yu, B.; Wu, X. Numerical investigation of airflow and heat transfer characteristics and optimal design of the American ginseng drying room. Appl. Therm. Eng. 2021, 183, 115885. [Google Scholar] [CrossRef]
  17. Natalia, S.V.; Mauricio, C.; Hugo, A.M.-C.; Hugo, F.L. Drying Uniformity Analysis in a Tray Dryer: An Experimental and Simulation Approach. Adv. J. Food Sci. Technol. 2018, 15, 233–238. [Google Scholar] [CrossRef]
  18. Yang, X.L.; Gao, K.; Rong, R.; Shi, G.H. Airflow Tissue Simulation and Structure Optimization of Grain Drying Tower. Sci. Technol. Eng. 2018, 18, 19–29. [Google Scholar]
  19. Noh, A.M.; Mat, S.; Ruslan, M.H. CFD simulation of temperature and air flow distribution inside industrial scale solar dryer. J. Adv. Res. Fluid Mech. Therm. Sci. 2018, 45, 156–164. [Google Scholar]
  20. Mirade, P.-S. Prediction of the air velocity field in modern meat dryyers using unsteady computational fluid dynamics (CFD) models. J. Food Eng. 2013, 60, 41–48. [Google Scholar] [CrossRef]
  21. Zheng, X.Z.; Xu, H.; Wang, F.; Liu, H.; Chang, K.F.; Zhao, Z.Y.; Zhu, G.H. Simulation analysis and verification of flow field in continuous microwave dryer. J. Northeast Agric. Univ. 2018, 49, 69–87. [Google Scholar]
  22. Liu, D.Q.; Fan, C.H.; Dong, H.F.; Li, H. Analysis of internal flow field and optimization of mechanism parameters of negative pressure electric heating dryer based on fluent. Food Mach. 2017, 33, 94–191. [Google Scholar]
  23. Bedelean, B.; Sova, D. Performance assessment of a laboratory drying kiln designed with and without baffles. Pro Ligno 2012, 8, 89–99. [Google Scholar]
  24. Babu, A.K.; Kumaresan, G.; Raj, V.A.A.; Velraj, R. CFD studies on different configurations of drying chamber for thin-layer drying of leaves. Energy Sources Part A Recover. Util. Environ. Eff. 2020, 42, 2227–2239. [Google Scholar] [CrossRef]
  25. Li, G.J.; Cui, Y.H.; Wu, S.; Duan, P.S.; Ye, D.P. Modeling and simulation analysis of flow field in heat pump drying room based on Fluent. J. Fujian Agric. For. Univ. (Nat. Sci. Ed.) 2020, 49, 425–432. [Google Scholar]
  26. Liu, R.; Dong, J.X.; Wang, D.; Dong, P.P.; Wen, J.H.; Song, X. Flow-field simulation and structural optimization of the chry-santhemum hot air drying room. J. Mach. Des. 2021, 38, 47–54. [Google Scholar]
  27. Chen, D.; Xie, J. Heat Pump Technology Manual; Chemical Industry Press: Beijing, China, 2012; pp. 542–544. [Google Scholar]
  28. Tao, W.Q. Numerical Heat Transfer, 2nd ed.; Xi’an Jiaotong University Press: Xi’an, China, 2003; pp. 333–376. [Google Scholar]
  29. Wang, G.; Yang, F.; Wu, K.; Ma, Y.; Peng, C.; Liu, T.; Wang, L.-P. Estimation of the dissipation rate of turbulent kinetic energy: A review. Chem. Eng. Sci. 2021, 229, 116133. [Google Scholar] [CrossRef]
  30. Motevali, A.; Minaei, S.; Khoshtagaza, M.H. Evaluation of energy consumption in different drying methods. Energy Convers. Manag. 2011, 52, 1192–1199. [Google Scholar] [CrossRef]
  31. Majdi, H.; Esfahani, J.A. Energy Consumption and Drying Time Optimization of Convective Drying for Performance Improvement: Response Surface Methodology and Lattice Boltzmann Method. J. Heat Transf. 2018, 140, 102009. [Google Scholar] [CrossRef]
  32. Roberto, L.M.; Carlos, Z.; Carlos, R. Computational modelling and energy consumption of turbulent 3D drying process of olive-waste cake. J. Food Eng. 2019, 263, 102–113. [Google Scholar]
  33. Nwakuba, N.R.; Asoegwu, S.N.; Nwaigwe, K.N. Energy requirements for drying of sliced agricultural products: A review. Agric. Eng. Int. CIGR J. 2016, 18, 144–155. [Google Scholar]
Figure 1. The closed heat pump drying system with waste heat recovery. (a) Schematic diagram (b) P-h diagram of heat pump cycle. 1. Compressor 2. Condenser 3. Evaporator 4. Sensible heat exchanger 5. Drying cabinet 6. Throttle valve. A. Compressor suction B. Compressor displacement C. Condenser outlet D. Throttle valve outlet.
Energies 14 06358 g001
Figure 2. Schematic diagram of waste heat recovery type heat pump drying test rig. 1. Compressor 21. Auxiliary condenser 22. Main condenser 3. Evaporator 4. Sensible heat exchanger 5. Electric auxiliary heat 61. Return fan 62. Supply fan 63. Bypass fan at the top 64. Circulating fan 7. Centrifugal fan 8. Partition panel.
Energies 14 06358 g002aEnergies 14 06358 g002b
Figure 3. Meshing of computational domain.
Energies 14 06358 g003
Figure 4. Comparison of the velocities in the numerical results and experimental data.
Energies 14 06358 g004
Figure 5. Streamline diagram (a) and flow field (b) of a closed heat pump drying system with waste heat recovery.
Energies 14 06358 g005
Figure 6. Velocity distribution at specific X locations on different planes (a) x = 1.2 m, (b) x = 2.25 m, (c) x = 3.75 m, (d) x = 4.5 m.
Energies 14 06358 g006
Figure 7. Velocity distribution at specific Y locations on different planes (a) y = 0.75 m, (b) y = 1.35 m.
Energies 14 06358 g007
Figure 8. Velocity distribution at specific Z locations on different planes (a) Z = 0.4 m, (b) Z = 1.75 m, (c) Z = 2.55 m.
Energies 14 06358 g008aEnergies 14 06358 g008b
Figure 9. The streamlines (a) and flow field (b) of a closed heat pump drying system with waste heat recovery for P3 program.
Energies 14 06358 g009
Figure 10. Velocity distribution at Z = 2.55 m location with partition panel added in the top duct (P3 program).
Energies 14 06358 g010
Figure 11. Turbulent kinetic energy profile at Z = 2.55 m section with partition panel added in the top duct (P3 program).
Energies 14 06358 g011
Figure 12. The average velocity and velocity uniformity coefficient after changing the volume flow of the bypass fan.
Energies 14 06358 g012
Figure 13. The energy consumption of the fans after changing the volume flow of the bypass fan.
Energies 14 06358 g013
Figure 14. The average velocity and velocity uniformity coefficient after changing the volume flow of the supply fan.
Energies 14 06358 g014
Figure 15. The energy consumption of the fans after changing the volume flow of the supply fan.
Energies 14 06358 g015
Figure 16. The average velocity and velocity uniformity coefficient after changing total pressures of the fans.
Energies 14 06358 g016
Figure 17. The energy consumption of the fans after changing total pressures of the fans.
Energies 14 06358 g017
Table 1. Fan specifications of a closed heat pump drying system with waste heat recovery.
No.Fan NomenclatureSpecifications
Volume FlowTotal PressureNo. of Fans
1Supply fan6600 m3/h135 Pa3
2Return fan6600 m3/h135 Pa3
3Bypass fan1800 m3/h200 Pa2
4Circulating fan1800 m3/h200 Pa2
5Centrifugal fan3200 m3/h400 Pa1
Table 2. Simulation programs.
No.Fan and its Operation
P0The existing fans with configurations in Table 1, and 1800 m3/h volume flow of the bypass fans operate at the same time.
P1The circulation fans are removed, the 2400 m3/h volume flow of the bypass fans with intermittent operation of one fan at a time. The air volume of the air supply fan is 6600 m3/h.
P2The circulation fans are removed, 3000 m3/h volume flow of the by-pass fans with intermittent operation of one fan at a time. The air volume of the air supply fan is 6600 m3/h.
P3The circulation fans are removed, 3600 m3/h volume flow of the by-pass fans with intermittent operation of one fan at a time. The air volume of the air supply fan is 6600 m3/h.
P4The circulation fan is removed, 2400 m3/h volume flow of the by-pass fans with intermittent operation of one fan at a time. Differs from P1, the air volume of the air supply fan is 6000 m3/h.
P5The circulation fan is removed, 2400 m3/h volume flow of the by-pass fans with intermittent operation of one fan at a time. Differs from P1, the air volume of the air supply fan is 6000 m3/h.
P6The total pressure of the fans is 10% less than that of the P5.
P7The total pressure of the fans is 15% less than that of the P5.
Publisher’s Note: MDPI stays neutral with regard to jurisdictional claims in published maps and institutional affiliations.

