Article

Using the Modified Resistivity–Porosity Cross Plot Method to Identify Formation Fluid Types in Tight Sandstone with Variable Water Salinity

1
College of Energy, Chengdu University of Technology, Chengdu 610059, China
2
State Key Laboratory of Oil and Gas Reservoir Geology and Exploitation, Chengdu University of Technology, Chengdu 610059, China
3
Hainan Branch of China National Offshore Oil Corporation Ltd., Haikou 570100, China
4
Institute of Sedimentary Geology, Chengdu University of Technology, Chengdu 610059, China
*
Author to whom correspondence should be addressed.
Energies 2021, 14(19), 6335; https://doi.org/10.3390/en14196335
Submission received: 15 September 2021 / Revised: 25 September 2021 / Accepted: 27 September 2021 / Published: 4 October 2021
(This article belongs to the Special Issue Advances in Petroleum Exploration and Production)

Abstract

:
It is generally difficult to identify fluid types in low-porosity and low-permeability reservoirs, and the Chang 8 Member in the Ordos Basin is a typical example. In the Chang 8 Member of Yanchang Formation in the Zhenyuan area of Ordos Basin, affected by lithology and physical properties, the resistivity of the oil layer and water layer are close, which brings great difficulties to fluid type identification. In this paper, we first analyzed the geological and petrophysical characteristics of the study area, and found that high clay content is one of the reasons for the low-resistivity oil pay layer. Then, the formation water types and characteristics of formation water salinity were studied. The water type was mainly CaCl2, and formation water salinity had a great difference in the study area ranging from 7510 ppm to 72,590 ppm, which is the main cause of the low-resistivity oil pay layer. According to the reservoir fluid logging response characteristics, the water saturation boundary of the oil layer, oil–water layer and water layer were determined to be 30%, 65% and 80%, respectively. We modified the traditional resistivity–porosity cross plot method based on Archie’s equations, and established three basic plates with variable formation water salinity, respectively. The above method was used to identify the fluid types of the reservoirs, and the application results indicate that the modified method agrees well with the perforation test data, which can effectively improve the accuracy of fluid identification. The accuracy of the plate is 88.1%. The findings of this study can help for a better understanding of fluid identification and formation evaluation.

1. Introduction

Fluid identification is the basis for reservoir evaluation and research. For tight sandstone, complex pore structure and minerals weaken the fluid identification ability of conventional logs [1]. Additionally, the great difference in formation water salinity also reduces the contrast between the oil layer and the water layer to some extent, which brings great difficulties to fluid identification [2]. If the oil layer were mistakenly interpreted as the water layer, the accuracy of fluid identification would be reduced. Therefore, with large changes in formation water salinity, figuring out the characteristics of formation water and finding the right fluid identification method are critical [3,4,5].
There are many factors that lead to low-resistivity pay zones. Reservoir fluid resistivity is influenced by water saturation and porosity, and the resistivity data interpretation shows high water saturation, but oil or even dry oil. There are two mechanisms responsible for the high water saturation. The first is the impact of conductive minerals, such as clay minerals, metal sulfides and pyrite. The second is a group consisting of reservoirs where the actual water saturation can be high but free hydrocarbons are produced [6,7]. In addition, lithologic oil and gas reservoirs in China cause differences in formation water environment due to lithologic isolation, resulting in great changes in formation water salinity. Variable formation water salinity often results in low-resistivity pay layers and ambiguity in the log interpretation [8]. Thus, it is necessary to construct fluid identification methods based on making clear the reasons for low-resistivity pay zones and the characteristics of formation water.
At present, scholars have proposed many fluid identification methods, such as the normal distribution method, qualitative-semi-quantitative judgement technology, double porosity method (total porosity, aqueous porosity), overlap method, movable water analysis method and differential map method [9,10,11,12,13,14]. However, the traditional fluid identification methods do not take into account the effect of changes in salinity. With the development of logging technology, some new fluid identification methods, such as nuclear magnetic resonance, array induction logging and imaging logging, can also accurately identify and interpret fluid types [15,16]. However, the high cost of testing and interpretation limit their use. Resistivity logging has been widely used due to its low cost and deep detection depth [17]. Therefore, exploring a new method for fluid type identification using resistivity logging data in the background of regional formation water salinity changes is very important.
In this paper, we first studied the geological and petrophysical characteristics of this area and analyzed the formation water types and variation rules of formation water salinity. According to the actual production of the reservoir and the water saturation limits of 30%, 65% and 80%, the fluid was divided into oil layer, oil–water layer and oil layer, respectively. Then, we modified the traditional resistivity–porosity cross plot method and established three basic plates considering the variation in formation water salinity. Finally, in order to improve the accuracy of fluid identification, we verified the practicability of plates by comparing the results of plate identification with the perforation test results. Considering the effect of changes in formation salinity, the modified resistivity–porosity cross plot method is established, combined with linear interpolation, which can effectively improve the fluid identification accuracy [18,19]. Figure 1 presents the technology roadmap of fluid identification of Chang 8 Member in Ordos Basin.

2. Geological Background and Petrophysical Characteristics

The Zhenyuan area is located at the southern tip of Tianhuan Depression in the southwest of the Ordos Basin, China (Figure 2). With a total area of about 6000 km2, it is adjacent to Qingyang in the east, Jingchuan in the south and Pingliang in the west. The strata are gentle and westward, mainly monoclinic and locally developed low-amplitude nasal uplifts [20]. The sedimentary system is controlled by a wide range of sloping tectonic settings formed by the long-term successional integral up–down movement and forms a complete lacustrine evolution sequence from lacustrine advance to lacustrine retreat. For Chang 81 Member in Zhenyuan area, a large area of reservoir sandstone and source rock are developed in succession and the oil source and storage conditions are favorable [21]. Chang 81 Member, Yanchang Formation in Zhenyuan area belongs to a typical lithologic reservoir, and it is mainly lithic feldspathic sandstone and feldspar lithic sandstone. It is a set of interbedded sedimentary formation composed of gray medium-thick fine sandstone, dark gray mudstone, silty mudstone and dark mudstone. According to the lithology, it can be further divided into Chang 82 and Chang 81 oil reservoir groups from bottom to top. The thickness of the oil reservoir is about 80 m. It is an ultra-low-permeability tight sandstone reservoir. Figure 3 shows the distribution of pore types and interstitial materials content and the range of porosity and permeability in Zhenyuan area. It can be seen that the main pore type of the reservoir is inter-granular pore, and the average of the total rate of face porosity is 3.4%. The content of pore interstitial materials is high, including clay minerals (kaolinite, chlorite, hydromica), ferrocalcite, dolomite, and siliceous as well (Figure 3a). Figure 3b is the histogram of porosity and permeability. The porosity in the study area is mainly distributed from 6% to 12%, with an average of 11.62%, and the permeability is mainly distributed between 0 µm2 and 1 × 10⁻³ μm2, with the average of 0.815 × 10⁻³ μm2. The complex pore types and pore structure lead to the complex rock physical properties of the reservoir, which results in low porosity and low permeability characteristics of Chang 81 Member, Yanchang Formation in Zhenyuan area [22,23]. This is the main cause of low-resistivity oil pays.

3. Characteristics of Formation Water Salinity

According to the Sulin classification method, the formation water type of the study area is mainly CaCl2, followed by MgCl2 and Na2SO4, which reflects that the reservoir fluid is in a relatively closed environment system, and the reservoir preservation conditions are relatively better [24,25]. Exploration wells in the study area for water sample analysis are distributed in the eastern, central and western areas. Figure 4a shows that the formation water salinity in the study area has a large difference, from 7510 ppm to 72,590 ppm, with an average value of 41,743.74 ppm. Figure 4b is the distribution histogram of the formation water salinity and formation resistivity in the eastern, central and western parts of the study area. It can be seen that the formation water salinity rises from east to west, and the formation resistivity has opposite laws. Additionally, there are high-resistivity water layers in the reservoir with low formation water salinity.
According to the analysis of logging and oil test data, the high-resistivity water layers and low-resistivity oil layers coexist, making it difficult to identify fluids in the study area, which is caused by the difference in formation water salinity. Therefore, traditional logging methods have certain difficulties and obstacles to identify fluids in the study area, and it is important to further study fluid identification countermeasures.

4. Results and Discussion

4.1. Traditional Resistivity–Porosity Cross Plot Method

Based on the petrophysical characteristics and formation water salinity characteristics analysis of the study area above, the difference in formation water salinity is an important reason for identifying fluids being difficult in the study area. Resistivity logging has been widely used due to its low cost and deep depth of detection. The resistivity–porosity cross plot method is a type of resistivity logging method and it is a commonly used fluid interpretation technique. It can also be used to obtain water saturation, the formation water resistivity and skeleton parameters.
The basis of Archie’s equation is conventionally used to calculate the water saturation of a formation [26]. It can be expressed as follows:
S w = ( a b R w R t φ m ) 1 n
where: Sw equals water saturation; Rt equals total resistivity as measured by the resistivity logs; φ is the rock porosity in fraction; m is the cementation exponent; n is the saturation exponent; a is the factor related to lithology; b is the constant related to lithology; and Rw is formation water resistivity.
If the formation resistivity is a dependent variable, the formula can be rewritten as follows:
R t   = a φ m R w I = a φ m R w S w n
where I is resistance increasing rate (the value is the ratio of the formation resistivity Rt to the resistivity Ro when the formation is completely water containing).
The formula is deformed, and both sides take the logarithm at the same time,
log R t = m log φ + log a R w + log I
Equation (3) can be used to establish the linear equation in the double logarithmic coordinate system, with the slope of −m. When I = 1, the waterline equation can be obtained. Fluid types can be qualitatively judged according to the resistivity–porosity cross plot method, and the value of the water saturation can also be determined semi-quantitatively.
However, this method is sensitive to formation water salinity. It cannot be directly applied to identify the fluid types when the difference in formation water salinity exists. Hence, taking into account the change in the salinity of the formation water, a new modified resistivity–porosity cross plot method was established as follows.

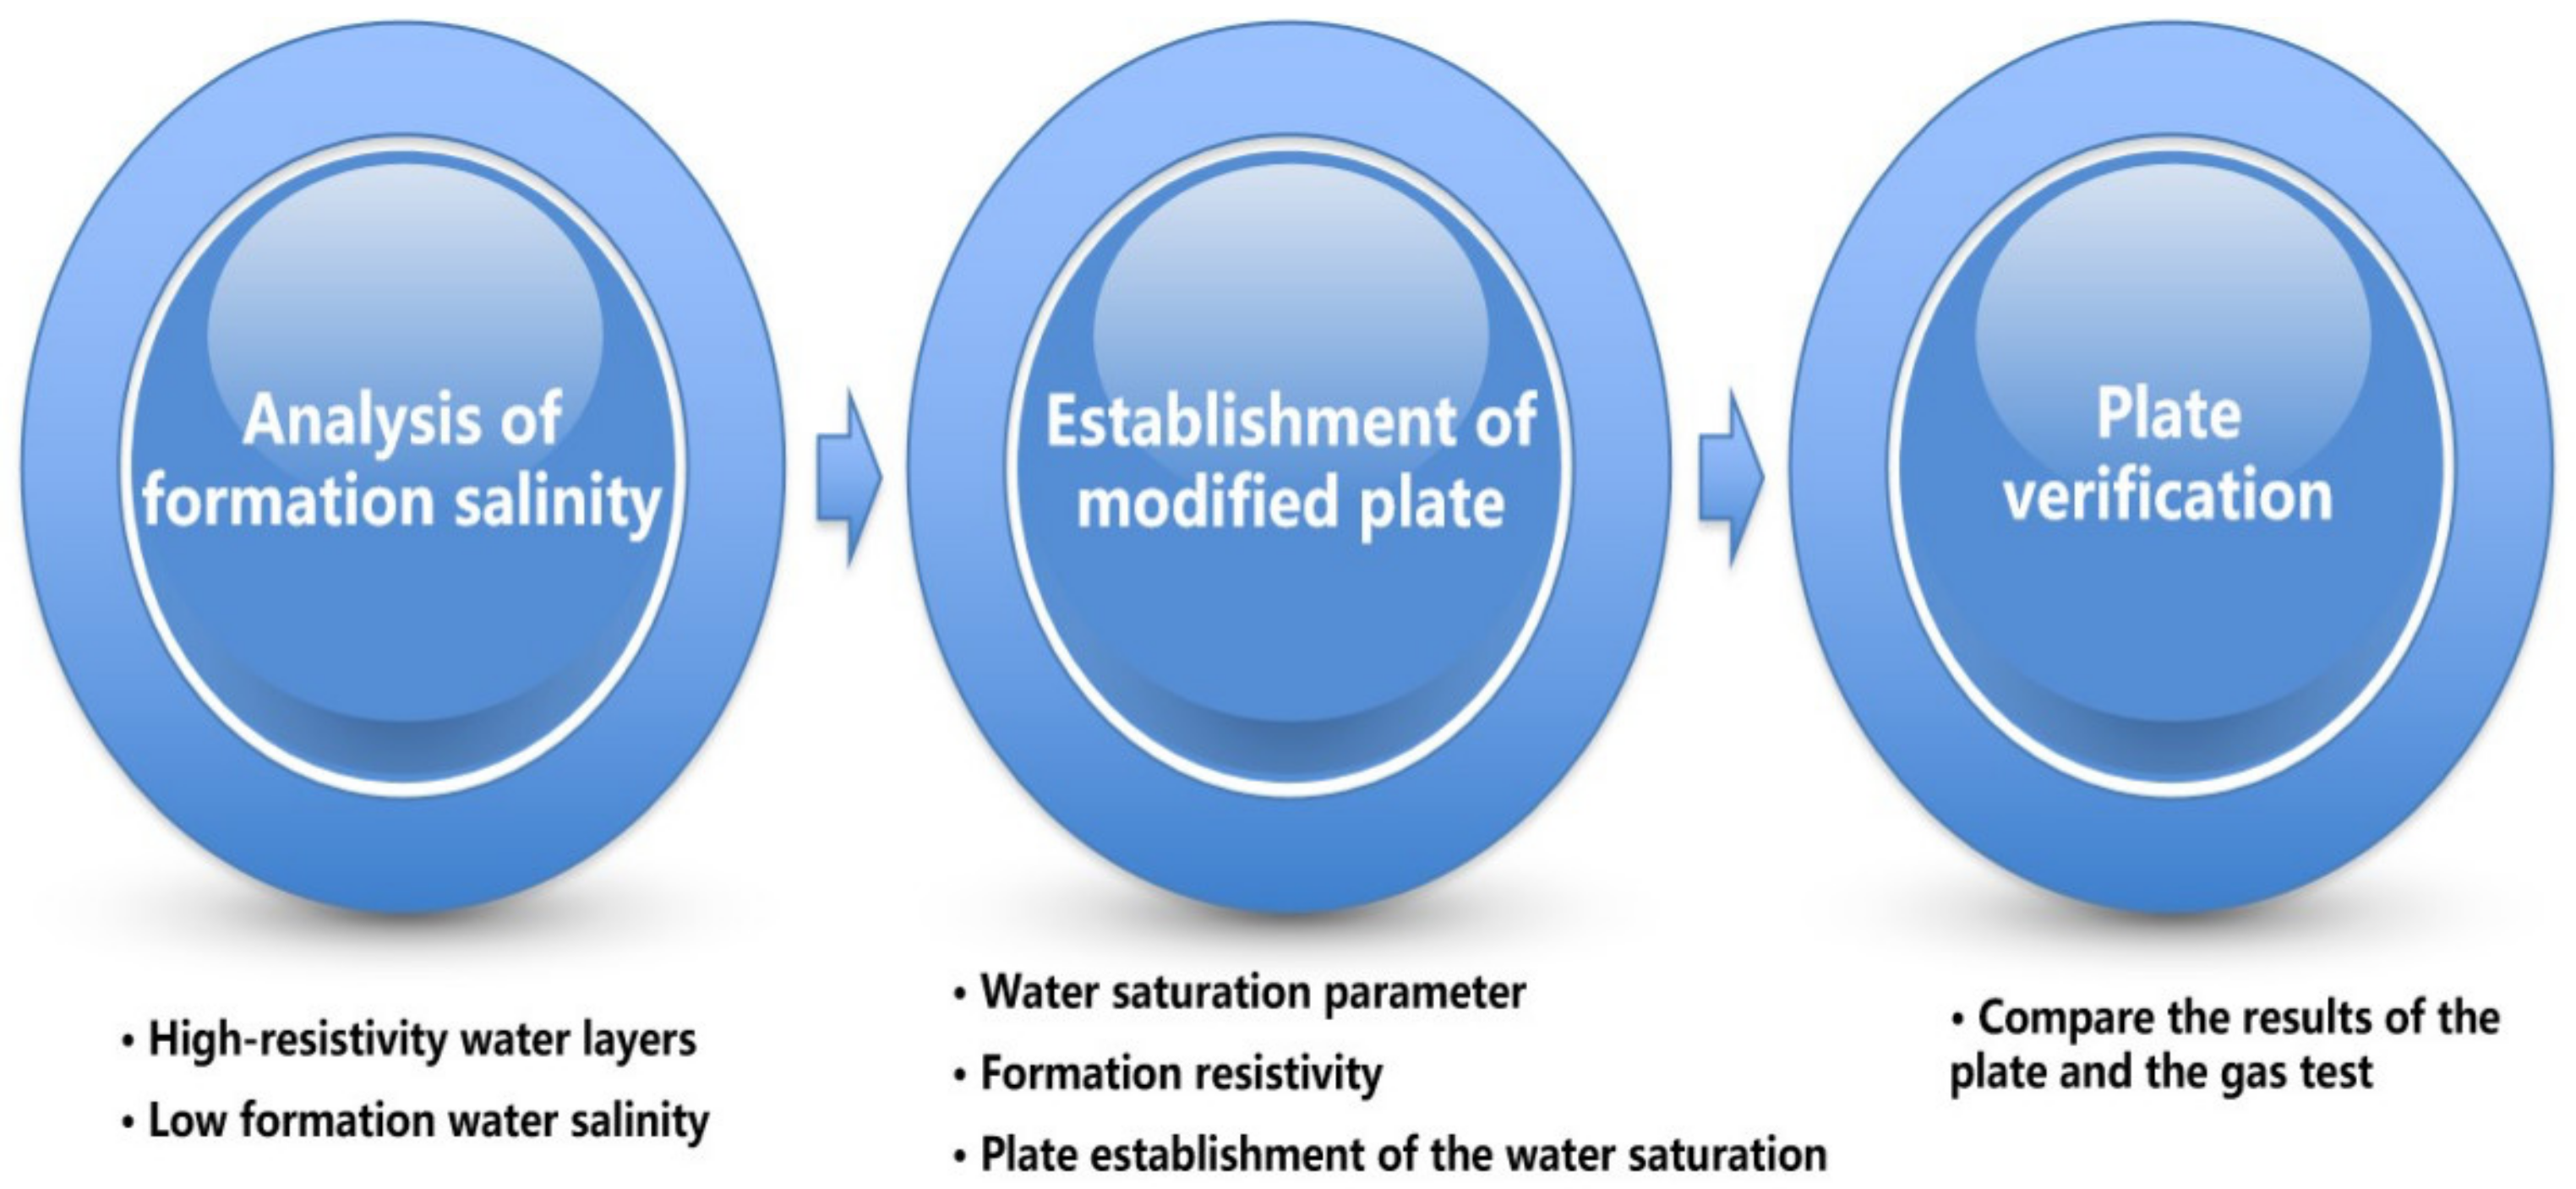
4.2. The Establishment of Modified Plate

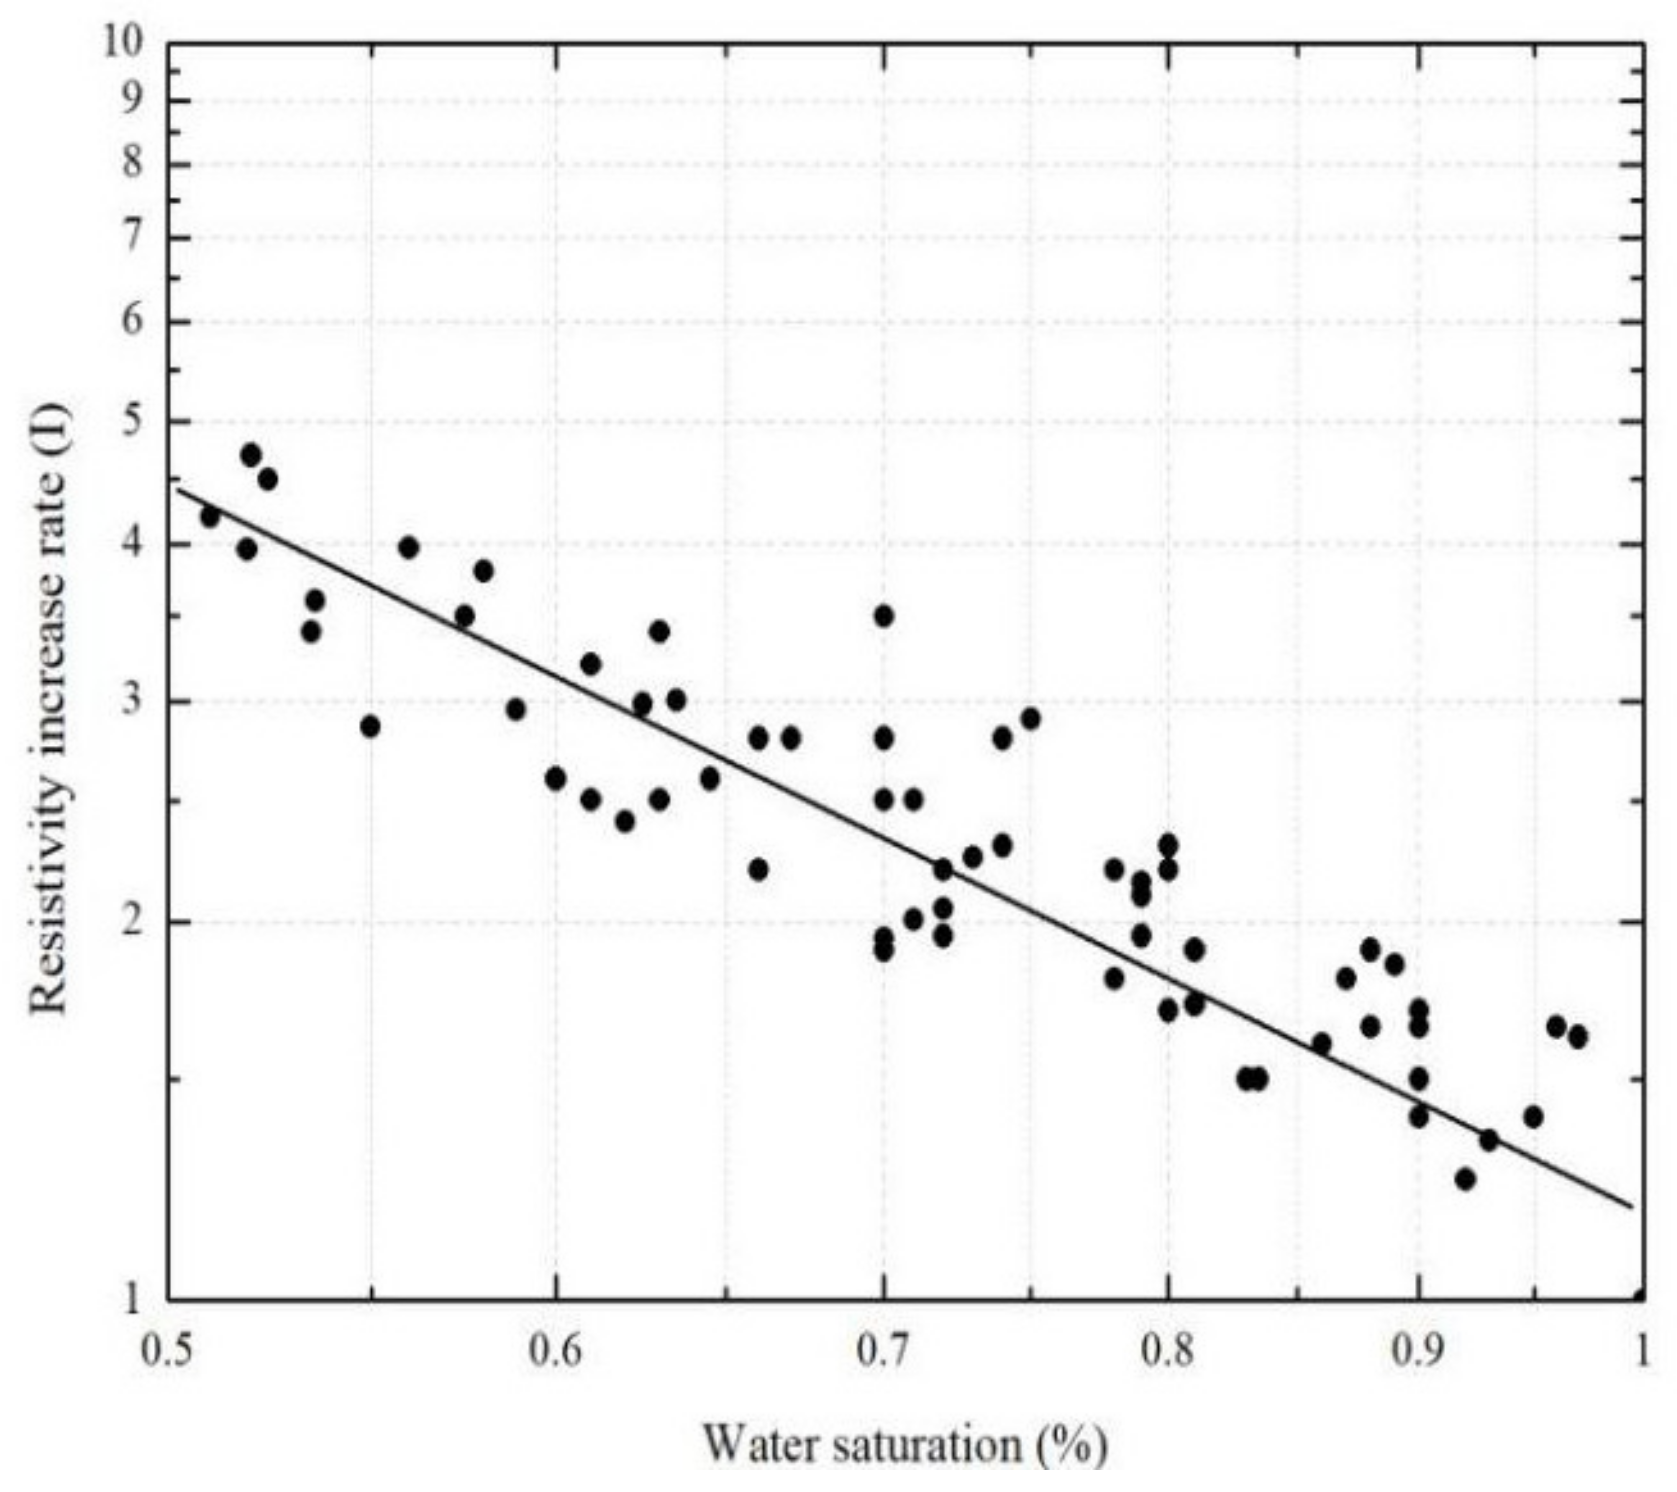
4.2.1. Interpretation of Water Saturation Parameter

A total of 28 rock samples were tested in the study area under the condition of 25 °C, and the water saturation parameters were determined as follows: a = 1.5345, m = 1.627, b = 1.1493, n = 1.9767. Figure 5 shows the relationship between water saturation Sw and resistivity increase rate I, which was obtained by the rock electricity experiment. It can be seen that the water saturation Sw is negatively correlated with the resistivity increase rate I, and the fitting equation is as follows:
I = 1.1355 S w 2.0069

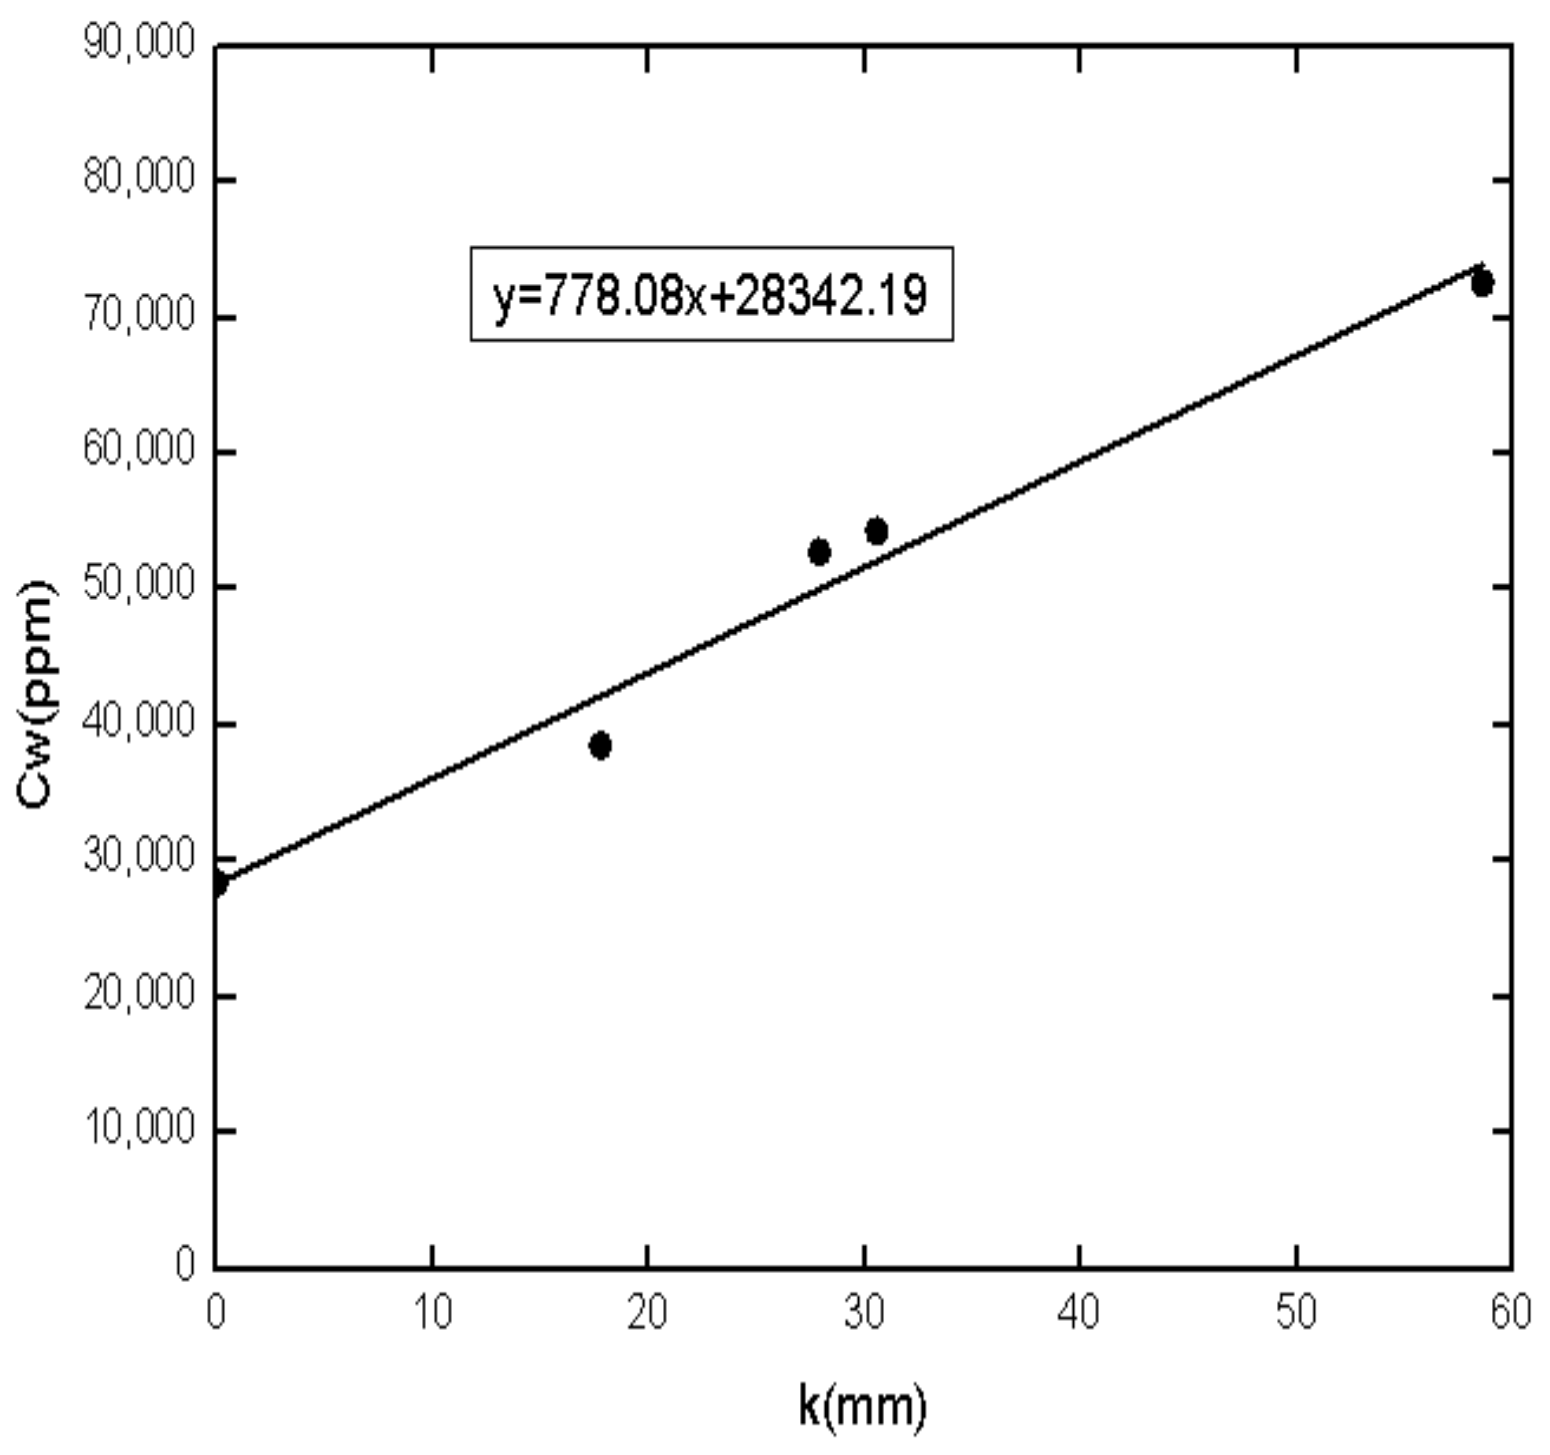
4.2.2. Conversion of Formation Resistivity

According to the production dynamic data and oil test interpretation results, the boundary of the water saturation of the oil layer, the oil–water layer and the water layer are 30%, 65% and 80%, respectively. The formation resistivity before conversion Rt1 and after conversion Rt2 can be obtained by Equation (2).
R t 1 = a φ m R w S w 1 n
R t 2 = a φ m R w S w 2 n
From simultaneous Equations (5) and (6), Rt2 can be obtained as follows:
R t 2 = R t 1 S w 2 n S w 1 n
According to the production materials, the water saturation value of 0–50% is converted to 30%, the water saturation value of 50%–80% is converted to 65% and the saturation of exploration wells with water saturation greater than 80% is converted to 80%. The water saturation before conversion is Sw1 and after conversion is Sw2. Then, Rt2 is obtained from Equation (7).

4.2.3. Plate Establishment of the Water Saturation

When Sw2 is 30%, the porosity, water saturation Sw1 and salinity of the study area are shown in Table 1. Based on these data, a modified plate is established with water saturation of 30%. Firstly, the porosity and Rt2 are plotted on the double logarithmic graph and the value of formation water salinity Cw corresponding to each point is marked. Then, the corresponding trend line is drawn with the slope of −m across each point, and the formation water salinity value on each trend line is equal to the salinity value at that point on the line. In order to obtain the trend line of any formation water salinity from known data points, the smallest Cw is found first. Here, the Z264 well has the smallest Cw of 35,830 ppm, as shown in Table 1, and we set its ‘k’ value as 0, where k is the vertical distance between any formation water salinity trend line and the minimum formation water salinity trend line. Its positive and negative values represent the direction of the trend line. The negative value indicates that this trend line is to the left of the trend line of 35,830 ppm, and the positive value represents the trend line to the right of the trend line of 35,830 ppm. Table 2 is the k value corresponding to the formation water salinity in Table 1. Figure 6 is the relationship between k and Cw, and the fitting equation is Cw = 845.17 k + 32,104.90. On the basis of this fitting relation, the values of k with any Cw can be obtained. We obtain the values of k with Cw of 10,000 ppm, 20,000 ppm, 30,000 ppm, 40,000 ppm, 50,000 ppm, 60,000 ppm and 70,000 ppm, as shown in Table 3, and draw its trend line. Hence, the base plate of the water saturation of 30% is established, as shown in Figure 7.
When Sw2 is 65%, the same as the process of creating the modified plate with a water saturation of 30%, we find the Z353 well has the smallest Cw of 19,472 ppm. Then, we set its ‘k’ value as 0, and the k value corresponding to the formation water salinity is calculated. Figure 8 shows the relationship between k and Cw with Sw2 of 65%, and the fitting equation is Cw = 833.19 k + 16,861.42. We obtain the values of k with Cw of 10,000 ppm, 20,000 ppm, 30,000 ppm, 40,000 ppm, 50,000 ppm, 60,000 ppm and 70,000 ppm and draw its trend line. Hence, the base plate of the water saturation of 65% is established, as shown in Figure 9.
When Sw2 is 80%, we find the Z226 well has the smallest Cw of 28,367 ppm. Then, the k value corresponding to the formation water salinity is calculated. Figure 10 shows the relationship between k and Cw with Sw2 of 80%, and the fitting equation is Cw = 778.08 k + 28,342.19. We obtain the values of k with Cw of 10,000 ppm, 20,000 ppm, 30,000 ppm, 40,000 ppm, 50,000 ppm, 60,000 ppm and 70,000 ppm, and draw its trend line. Hence, the base plate of the water saturation of 80% is established, as shown in Figure 11.

4.3. Plate Verification

In order to verify the practicality of the modified fluid identification methods proposed above, the identification results obtained by the plate we established are compared with perforation test data in the study area. In the process of verification, well data used when creating basic modified plate are excluded. Taking the Z225 well as an example, the verification steps are as follows.
The formation water salinity of Z225 well is 55,764 ppm. We find the trend lines with the salinity of 55,764 ppm on the three basic plates established above, respectively. On the plate with water saturation of 30%, according to the equation y = 845.17 x + 32,104.90, the value of k with Cw of 55,764 ppm is determined to be 22.87 mm, and then a trend line of 55,764 ppm is found. Similarly, the trend lines of 55,764 ppm with water saturation of 65% and 80% are obtained. Finally, the three trend lines are projected onto the same double-logarithmic coordinate plate. After finding the waterline according to the relationship between formation resistivity and saturation, an application plate with Cw of 55,764 ppm is generated (Figure 12).
According to the oil test data, the formation resistivity of the Z225 well is 48.2 Ω·m and the porosity is 11.37%. Then, we project it into Figure 12, and it can be clearly seen that Z225 is a typical water well, which is consistent with the perforation test results. Using the same method, 42 wells are verified. Table 4 is the results of plate verification and the accuracy of the interpretation of the plates is 88.1%, which confirmed that our modified plates are useful.
The traditional fluid identification method often regards the reservoir as the same water system environment, ignoring the influence of formation water salinity on the interpretation results. Therefore, for fluids with large changes in formation water salinity, there is a large error in the recognition results. We modified the resistivity–porosity cross plot method considering variable formation water salinity. The accuracy of the interpretation fluid types using modified plates is 88.1%. It has a good guiding significance for the fluid identification of such low-resistance oil layers.

5. Conclusions and Discussion

(1) The Chang 81 Member, Yanchang Formation in the Zhenyuan area of Ordos Basin, China, is a tight sandstone-dominated reservoir with low porosity and low permeability. It has high clay content, complex pore structure and a great difference in formation water salinity. The traditional fluid identification method often regards the reservoir as the same water system environment, ignoring the influence of formation water salinity on the interpretation results. The difference in formation water salinity results in the low-resistivity oil pay and increases the difficulty of fluid identification.
(2) The resistivity–porosity cross plot method has been widely used to identify fluid types due to its low cost and deep depth of detection, but it is sensitive to formation water salinity. Based on Archie’s equation, the resistivity–porosity cross plot method is modified, considering the effect of changes in formation salinity.
(3) According to the reservoir fluid logging response characteristics, the water saturation boundary of the oil layer, oil–water layer and water layer are determined, which are 30%, 65% and 80%, respectively. After conversion of formation resistivity, modified the resistivity–porosity cross plot method is established, combined with linear interpolation.
(4) In order to verify the practicality of the establishment of three basic plates, based on data such as the porosity, water saturation Sw1 and salinity, the fluid type identification results obtained by the plate established are compared with perforation test data in the study area. The accuracy of the interpretation of the plate is 88.1%. The modified resistivity–porosity cross plot method can effectively improve the fluid identification accuracy of tight sandstone reservoirs with great differences in formation water salinity.
(5) When the basic plate with a water saturation of 80% is established, the number of data points is less and the accuracy of the obtained plate is slightly lower. The new logging technologies such as NMR logging and array acoustic logging have a better log interpretation in tight sandstone reservoirs, but the measurement cost is too expensive. In addition, some advanced machine learning algorithms could be used in fluid typing and provide a new direction for our future research.

Author Contributions

Methodology, Y.Y. and K.L.; validation, Y.Y. and Y.W.; formal analysis, K.L. and Y.W.; investigation, H.D. and J.H.; resources, H.D. and J.H.; writing—original draft preparation, Y.W., K.L. and Y.Y.; writing—review and editing, Z.X. and D.L.; All authors have read and agreed to the published version of the manuscript.

Funding

This research was funded by The National High Technology Research and Development Program of China (863 Program) (Grant No. 2013AA064501), State Key Laboratory of Shale Oil and Gas Enrichment Mechanisms and Effective Development (Grant No. 33550000-20-FW2099-0153) and the National Science and Technology Major Project of China (Grant No. 2017ZX05036003).

Institutional Review Board Statement

Not applicable.

Informed Consent Statement

Not applicable.

Data Availability Statement

The study did not report any data.

Acknowledgments

The authors are grateful for the project support from The National High Technology Research and Development Program of China (863 Program) (Grant No. 2013AA064501), State Key Laboratory of Shale Oil and Gas Enrichment Mechanisms and Effective Development (Grant No. 33550000-20-FW2099-0153) and National Science and Technology Major Project of China (Grant No. 2017ZX05036003).

Conflicts of Interest

The authors declare no conflict of interest.

References

  1. Chu, W.C.; Steckhan, J. A practical approach to determine low-resistivity pay in clastic reservoirs. In Proceedings of the SPE Annual Technical Conference and Exhibition, Denver, CO, USA, 30 October–2 November 2011. [Google Scholar]
  2. Pedram, M.; Hossein, M.; Tahar, A.; Behzad, T. Geometric modelling of the volume of investigation of well logs for thin-bed characterization. J. Geophys. Eng. 2017, 14, 426–444. [Google Scholar]
  3. Qin, H.; Wang, W. Genesis of low resistance of lithic sandstone reservoir in member 2 of Xujiahe Formation in Yuanba area, Northeast Sichuan, China. J. Chengdu Univ. Technol. 2014, 41, 577–581. [Google Scholar]
  4. Feng, C.J.; Gingras, M.; Sun, M.S.; Wang, B. Logging characteristics and identification methods of low resistivity oil layer: Upper cretaceous of the Third member of Qingshankou Formation, Daqingzijing Area, Songliao Basin, China. Geofluids 2017, 4, 1–13. [Google Scholar] [CrossRef] [Green Version]
  5. Fan, R.; Zhou, L.; Wu, J.; Zeng, T.; Zhou, X.F. Research on tight sandstone reservoir fluids identification in Xujiahe formation, northeastern Sichuan Basin. Petrol. Geol. Recov. Effic. 2015, 22, 67–71. [Google Scholar]
  6. Hamada, G.M.; Al-Awad, M.N.J. Petrophysical evaluation of low resistivity sandstone reservoirs. J. Can. Petrol. Technol. 2000, 39, 7–14. [Google Scholar] [CrossRef]
  7. Cheng, X.Z.; Zhou, C.C.; Fan, Y.R.; Wang, Z.H.; Huang, S.X. Genesis and identification of low contrast pay zones in fresh-water reservoirs. J. Oil Gas Technol. 2007, 29, 62–68. [Google Scholar]
  8. Meador, R.A.; Cox, P.T. Dielectric Constant Logging, A Salinity Independent Estimation of Formation Water Volume. In Proceedings of the Fall Meeting of the Society of Petroleum Engineers of AIME, Dallas, TX, USA, 28 September–1 October 1975. [Google Scholar]
  9. Miao, Q.; Li, H.; Zhao, G. Study of identifying fluid property andinterpretation method of Fuyang reservoir in Xingnan Oilfield. Pet. Instrum. 2014, 28, 77–79. [Google Scholar]
  10. Zemanek, J. Low-resistivity hydrocarbon-bearing sand reservoirs. SPE Form. Eval. 1989, 4, 515–521. [Google Scholar] [CrossRef]
  11. Worthington, P.F. Recognition and evaluation of low-resistivity pay. Petrol. Geosci. 2000, 6, 77–92. [Google Scholar] [CrossRef]
  12. Durand, C.; Brosse, E.; Cerepi, A. Effect of Pore-Lining Chlorite on Petrophysical Properties of Low-Resistivity Sandstone Reservoirs. SPE Reserv. Eval. Eng. 2001, 4, 231–239. [Google Scholar] [CrossRef]
  13. Mode, A.W.; Anyiam, O.A.; Aghara, I.K. Identification and petrophysical evaluation of thinly bedded low-resistivity pay reservoir in the Niger Delta. Arab. J. Geosci. 2014, 8, 2217–2225. [Google Scholar] [CrossRef]
  14. Guy, W.J.; John, H.; Doveton, W. Reservoir characterization utilizing a low cost resistivity-porosity crossplot and an interactive spreadsheet. AAPG Bull. 1996, 80, 231. [Google Scholar]
  15. Hamada, N.M.; Al-Blehed, M.S.; Al-Awad, M.N.; Al-Saddique, M.A. Petrophysical evaluation of low-resistivity sandstone reservoir with nuclear magnetic resonance log. J. Petrol. Sci. Eng. 2001, 39, 129–138. [Google Scholar] [CrossRef]
  16. Luo, N.; Zhao, Z.H. Application of New Well Logging Technologies in Guang’an Block. Well Logging Technol. 2007, 3, 249–252. [Google Scholar]
  17. Wang, Z.G. Study on the Russian Through Casing Resistivity Logging and Its Application. Well Logging Technol. 2009, 33, 374–378. [Google Scholar]
  18. Thanh, H.V.; Sugai, Y.; Sasaki, K. Impact of a new geological modelling method on the enhancement of the CO2 storage assessment of E sequence of Nam Vang field, offshore Vietnam. Energy Sour. 2020, 42, 1499–1512. [Google Scholar] [CrossRef]
  19. Thanh, H.V.; Sugai, Y.; Nguele, R.; Sasaki, K. Integrated workflow in 3D geological model construction for evaluation of CO2 storage capacity of a fractured basement reservoir in Cuu Long Basin, Vietnam. Int. J. Greenh. Gas Control 2019, 90, 102826. [Google Scholar] [CrossRef]
  20. Xiao, X.G.; Li, Q. The reservoir characteristics of Chang 8 oil-bearing Formation in the Zhiluo oil field of Ordos Basin. Geol. China 2014, 41, 187–196. [Google Scholar]
  21. Jing, W.; Jiannan, S.; Chengfei, H.; Yuhao, P. Hydrocarbon accumulation modes of Chang 8 oil reservoir group in Zhenyuan area, Ordos Basin, China. J. Chengdu Univ. Technol. 2015, 42, 553–558. [Google Scholar]
  22. Xiaoxia, R.; Aifen, L. Pore Structure of Tight Sandstone Reservoir and Its Influence on Percolation: A Case Study of Chang 8 Reservoir in Maling Oilfield, Ordos Basin. Oil Gas Geol. 2015, 36, 774–779. [Google Scholar]
  23. Zuowei, H.; Yun, L.; Haihong, W.; Changbing, H.; Changyong, W.; Zheng, L. Characteristics of Pore Structure of Ultra-low Permeability Reservoir of Chang 8 Reservoir Formation in Zhenyuan Area, Ordos Basin. Lithol. Oil Gas Reserv. 2014, 26, 15–20. [Google Scholar]
  24. Shaogui, D.; Yiren, F.; Guoxin, L. Influence of formation water salinity on physical properties of argillaceous sandstone. Well Logging Technol. 2006, 30, 113–115. [Google Scholar]
  25. Haiyong, M.; Lifa, Z.; Xiuqin, D. Hydrochemical characteristics and geological significance of the Chang 8 formation of the Yanchang Formation in Jiyuan area, Ordos Basin. J. Northwest. Univ. 2013, 43, 253–257. [Google Scholar]
  26. Archie, G.E. The electrical resistivity log as an aid in determining some reservoir characteristics. Trans. Am. 1942, 146, 41–56. [Google Scholar] [CrossRef]
Figure 1. Technology workflow of fluid identification of Chang 8 Member in Ordos Basin.
Energies 14 06335 g001
Figure 2. Tectonic location map of Zhenyuan area, Ordos Basin, China.
Energies 14 06335 g002
Figure 3. (a) Histogram of the pore types and interstitial materials content; (b) histogram of porosity and permeability.
Energies 14 06335 g003
Figure 4. (a) Contour map of formation water salinity in the study area (ppm); (b) histogram of formation water salinity and formation resistivity.
Energies 14 06335 g004
Figure 5. Water saturation and resistivity increase rate intersection diagram.
Energies 14 06335 g005
Figure 6. The relationship between k and Cw (Sw = 30%).
Energies 14 06335 g006
Figure 7. Modified resistivity–porosity base plate under variable salinity conditions (Sw = 30%).
Energies 14 06335 g007
Figure 8. The relationship between k and Cw (Sw = 65%).
Energies 14 06335 g008
Figure 9. Modified resistivity–porosity base plate under variable salinity conditions (Sw = 65%).
Energies 14 06335 g009
Figure 10. The relationship between k and Cw (Sw = 80%).
Energies 14 06335 g010
Figure 11. Modified resistivity–porosity base plate under variable salinity conditions (Sw = 80%).
Energies 14 06335 g011
Figure 12. Method for identifying salinity fluid using a basic plate.
Energies 14 06335 g012
Table 1. Exploratory well data used to establish the basic plate with water saturation 30%.
Well NumberResistivity (Ω·m)Salinity (ppm)Porosity (%)Water Saturation (%)Post-Conversion
Resistivity (Ω·m)
Z26438.0835,8309.2839.8666.79
Z22548.2046,58211.3729.5346.72
Z27745.3254,05111.5427.9639.43
Z26544.3855,9108.9728.7545.80
Z21358.4057,69011.9822.0031.63
Z32043.8957,80012.7924.6428.24
Z5448.9058,3209.4724.0035.46
Z21863.5070,54012.8717.1521.02
Z35965.2671,0009.6019.1126.76
Z34250.1972,9858.9621.6326.29
Table 2. The k value corresponding to the formation water salinity Cw (Sw = 30%).
K (mm)Cw (ppm)
035,830
8.7746,582
15.9854,051
24.7755,910
24.8957,690
25.6457,800
29.2358,320
41.6670,540
42.1271,000
45.7372,985
Table 3. The value of k corresponding to the target formation water salinity Cw (Sw = 30%).
Cw (ppm)K (mm)
10,000−36.84
20,000−23.79
30,000−10.74
40,0002.30
50,00015.35
60,00028.40
70,00041.44
Table 4. Basic plate verification results.
Well NumberResistivity (Ω·m)Porosity (%)Perforation Test ResultsPlate Interpretation Results
Z13713.978.20Water layerWater layer
Z13618.728.80Water layerWater layer
Z13820.618.90Water layerWater layer
Z31922.388.95Water layerWater layer
Z32433.8611.29Oil-water layerOil-water layer
Z4730.909.51Oil-water layerOil-water layer
Z12566.736.98Oil-water layerOil layer
Z22424.2313.06Oil-water layerOil-water layer
Z21732.9512.28Oil-water layerOil-water layer
Z22960.4610.19Oil-water layerOil-water layer
Z7418.327.81Oil-water layerOil-water layer
Z21629.7010.28Oil-water layerOil-water layer
Z22742.139.81Oil-water layerWater layer
Z21439.2612.04Oil-water layerWater layer
Z14635.398.70Oil layerOil layer
Z21863.5012.87Oil layerOil layer
Z24082.129.98Oil layerOil layer
Z26544.388.97Oil layerOil-water layer
Z25254.1311.49Oil layerOil layer
Z28859.328.77Oil layerOil layer
Z34250.198.96Oil layerOil layer
Z35723.129.77Oil layerOil-water layer
Z5448.909.47Oil layerOil layer
Z12453.7010.28Oil layerOil layer
Z21358.4011.98Oil layerOil layer
Z22139.3010.26Oil layerOil layer
Z24338.1412.02Oil layerOil layer
Z23256.6211.18Oil layerOil layer
Z25442.1210.47Oil layerOil layer
Z25934.1012.21Oil layerOil layer
Z26750.4611.87Oil layerOil layer
Z27052.2410.94Oil layerOil layer
Z27146.509.25Oil layerOil layer
Z32246.4410.04Oil layerOil layer
Z33343.659.40Oil layerOil layer
Z34063.758.66Oil layerOil layer
Z3350.908.60Oil layerOil layer
Z3055.009.20Oil layerOil layer
Z5324.1012.80Oil layerOil layer
Z12059.086.81Oil layerOil layer
Z129125.847.80Oil layerOil layer
Z8840.2911.01Oil layerOil layer
Publisher’s Note: MDPI stays neutral with regard to jurisdictional claims in published maps and institutional affiliations.

