Article

Utilising Cold Energy from Liquefied Natural Gas (LNG) to Reduce the Electricity Cost of Data Centres

by
Maytungkorn Sermsuk
1,2,
Yanin Sukjai
3,
Montri Wiboonrat
4,* and
Kunlanan Kiatkittipong
1
1
Department of Chemical Engineering, School of Engineering, King Mongkut’s Institute of Technology Ladkrabang, Bangkok 10520, Thailand
2
Division of Engineering, Department of Engineering and Maintenance, PTT LNG Company Limited, Rayong 21150, Thailand
3
Department of Mechanical Engineering, Faculty of Engineering, King Mongkut’s University of Technology Thonburi, Bangkok 10140, Thailand
4
KMITL Business School, King Mongkut’s Institute of Technology Ladkrabang, Bangkok 10520, Thailand
*
Author to whom correspondence should be addressed.
Energies 2021, 14(19), 6269; https://doi.org/10.3390/en14196269
Submission received: 5 July 2021 / Revised: 20 September 2021 / Accepted: 23 September 2021 / Published: 1 October 2021

Abstract

:
The Office of the National Broadcasting and Telecommunications Commission has reported that, from 2014 to 2018, Thailand’s internet usage has grown six-fold to 3.3 million terabytes per annum. This market trend highlights one of the policies of Thailand 4.0, with the aim of making Thailand a hub for information transfer in ASEAN. As a result, there will be a massive demand growth for data storage facilities in the near future. Data centres are regarded as the brain and heart of the digital industry and are essential for facilitating businesses in organising, processing, storing and disseminating large amounts of data. As the energy demand for equipment cooling contributes to over 37% of the total energy consumption, the data centres of the world’s leading companies, such as Amazon, Google, Microsoft and Facebook, are generally located in cold climate zones, such as Iceland, in order to reduce operating costs for cooling. Due to this reason, the possibility of data centres in Thailand is limited. Beneficially, PTTLNG, as the first liquified natural gas (LNG) terminal in Thailand, has processed the import, receiving, storage and regasification of LNG. The high abundance of cold energy inherently presented in LNG is normally lost to the surroundings during regasification. Presently, PTTLNG’s LNG receiving terminal utilises a heat exchanger with propane as an intermediate fluid to transfer cold energy from LNG to water. This cold energy, in the form of cold water, is then used in several projects within the LNG receiving terminal: (1) production of electricity via an organic Rankine cycle capacity of 5 MWh; (2) cooling the air inlet of gas turbine generators to increase the generator efficiency; (3) replacing refrigerant heating, ventilation and air conditioning systems within buildings; (4) development of winter plantations with precision agriculture to replace imported products. Therefore, this study focuses on the potential and future use for LNG cold energy by performing a thermodynamic and economic analysis of the use of LNG cold energy as a source to produce cold water at 7 °C, with the total cold energy of 27.77 to 34.15 MW or 7934 t to 9757 t of refrigeration depending on the target pressure of the natural gas to replace the conventional cooling system of data centres. This research has the potential to reduce the cooling operation costs of data centres by more than USD 9.87 million per annum as well as CO2 emissions by 34,772 t per annum. In an economic study, this research could lead to a payback period of 7 years with IRR 13% for the LNG receiving terminal and a payback period of 2.21 years with IRR 45% for digital companies.

1. Introduction

The world has undergone a shift from the industrial revolution era to the digital era. In 2020, mobile phones began to support the 5G platform, marking the advancement of the digital industry through information communication, the internet of things (IoT), smart cities, cloud services, big data analytics, artificial intelligence and self-driving cars [1]. Data centres are the heart and brain of the digital industry and are pivotal to data and information collection. Thus, the data centre industry has rapidly grown in recent years and usually involves tremendous amounts of IT equipment, rack servers and related devices. In 2018, the power consumption of data centres amounted to ~200 TWh [2], i.e., ~3.0% of all electricity usage in the world. Furthermore, this usage is expected to increase to ~4.5% of all electricity usage in 2025 [3]. The end of Moore’s law and IoT combined are anticipated to drive data centre energy needs up to 1287 TWh by 2030 [4].
IT devices cause huge heat release by transforming electrical energy into thermal energy. It is necessary that the temperature and humidity are controlled in data centres by using a cooling and air conditioning system to remove excess heat and to avoid damage to electrical components [5]. Refrigeration and air conditioning account for ~50% of the total electric usage of a data centre [6,7,8]. The energy consumption of air conditioning has a significant impact on the average power usage effectiveness (PUE) of global data centres. This index is normally ~2.00 [9]. Companies, including Amazon, Microsoft, Google and Facebook, have established data centres in geographic locations that can provide free air cooling in order to reduce energy consumption [10,11]. The average PUE of data centres in Ireland, for example, is ~1.15–1.40. The current status of free and applicable cooling technologies consists of airside free cooling, waterside free cooling [5] and heat pipe technology. Both airside free cooling and waterside free cooling can be integrated with other systems (e.g., absorption, solar systems, adsorption, evaporative cooling and geothermal for increased system performance [12]).
The world energy demand is expected to grow by 1.6% per annum. For the past 20 years, energy production has increased by ~39%. The global demand for natural gas (NG) has largely increased by 2.4% annually in recent decades. In contrast, the share of oil in the world energy profile will be dramatically decreased by 2030. NG is predicted to account for 25.9% of the global energy usage [13]. Liquefied natural gas (LNG) demand is forecasted to rise to 600–650 million t per annum (MTPA) by 2030 [14]. LNG is obtained by inputting 850 kW t−1 of LNG to cool it to −162 °C at atmospheric pressure [15].
LNG is colourless, non-toxic, odourless and non-corrosive. The liquefaction of NG is cost-efficient for its long-distance transportation from NG producing countries to LNG importing countries across ocean distances larger than 2000 km [16]. When an LNG ship arrives at the LNG receiving terminal, the LNG will be unloaded for storage in LNG storage tanks in the LNG regasification terminal [17]. LNG is regasified in LNG vaporisers, such as open rack vaporisers (ORVs), submerged combustion vaporisers (SCVs) and intermediate fluid vaporisers (IFVs). ORVs make up 90% of all vaporisers, while SCVs and IFVs each make up 5% [18,19]. During regasification, LNG is changed from the liquid phase (−162 °C) to the gaseous phase (25 °C). Cold energy of 250 KW t−1 of LNG is transferred to seawater in an ORV [20].
The global LNG trade reached a record of 316.5 MTPA in 2018 [21]. This means that 79,125 GW of cold energy, equivalent to 22.67 million t of refrigeration, is released into the ocean every year. One MTPA of LNG has the potential from cold utilisation to save ~74 GWh of electric consumption when compared to standard air conditioning, which is equivalent to 11.1 kt of NG saved and 30.4 kt of CO2-equivalent emissions avoided annually. The yearly net monetary savings would range from USD 0.9 to 4.7 million per MTPA of LNG regasified at local subsidised and international electricity market prices, respectively, with corresponding payback periods of 1.7 and 2.5 years, respectively [22].
The free cooling from LNG cold utilisation of the cooling tower technology in China can reduce energy consumption by ~70% and reduce operating costs by CNY 4798.1 thousand per year, which is ~68% of the operational cost of a conventional refrigeration system [23]. The free cooling from LNG cold utilisation of the district cooling systems in European Union countries has the potential to reduce electricity consumption by ~60% compared to standard air conditioning systems for residential buildings [24]. Two LNG regasification terminals in Malaysia, one in Sungai Udang Melaka (RGTSU) and another in Pengerang Johor (RGTPJ), are 3.8 (500 MMSCFD) and 3.5 (490 MMSCFD) MTPA, respectively. It was estimated that the cold energy from LNG during regasification processes was ~47,214 and 88,383 kWh at RGTPJ and RGTSU, respectively. Converting this energy into refrigeration ton hours (RTh) at 70% thermal efficiency, and taking the commercial rate of 0.549 Sen RTh−1, an internal rate of return of up to 33% and 17% was estimated for RGTPJ and RGTSU, respectively [25].
This research focuses on the potential of harnessing LNG cold energy by developing a new heat exchanger combined with a cryogenic power generation cycle using LNG cold energy as a heat sink to replace the conventional cooling system of data centres. This research has the potential to reduce the cooling costs and CO2 emissions of data centres.

2. Current LNG Cold Energy Utilisation of PTTLNG in Thailand

In 2018, PTTLNG initiated LNG cold energy utilisation by the installation of two units of IFV. An IFV can produce cold water at 5 °C using 27 MW of LNG cold energy. At present, PTTLNG utilises 32 MW of LNG cold energy in four projects:
-
5 MWh electric power generation in a combined cycle power plant (Organic Rankine cycle), requiring LNG cold energy of 17 MW;
-
Temperature reduction in air inlets of gas turbine generators to 15 °C to increase their efficiency by 10–20%, requiring LNG cold energy of 7 MW;
-
Replacement of air conditioning systems of all buildings using LNG cold energy of 3 MW;
-
Planting temperate plants, such as tulips, using LNG cold energy of 5 MW.
PTTLNG is still looking for potential future applications of LNG cold energy. In July 2019, PTTLNG signed a memorandum of understanding with King Mongkut’s University of Technology Thonburi and King Mongkut’s Institute of Technology Ladkrabang for a feasibility study of LNG cold energy utilisation between the LNG receiving terminal and data centres. Using LNG cold energy utilisation to replace the conventional cooling systems, such as chillers and cooling towers, of data centres could potentially reduce electricity consumption and greenhouse gas emissions.

3. Description and Optimisation of Process LNG Receiving Terminal

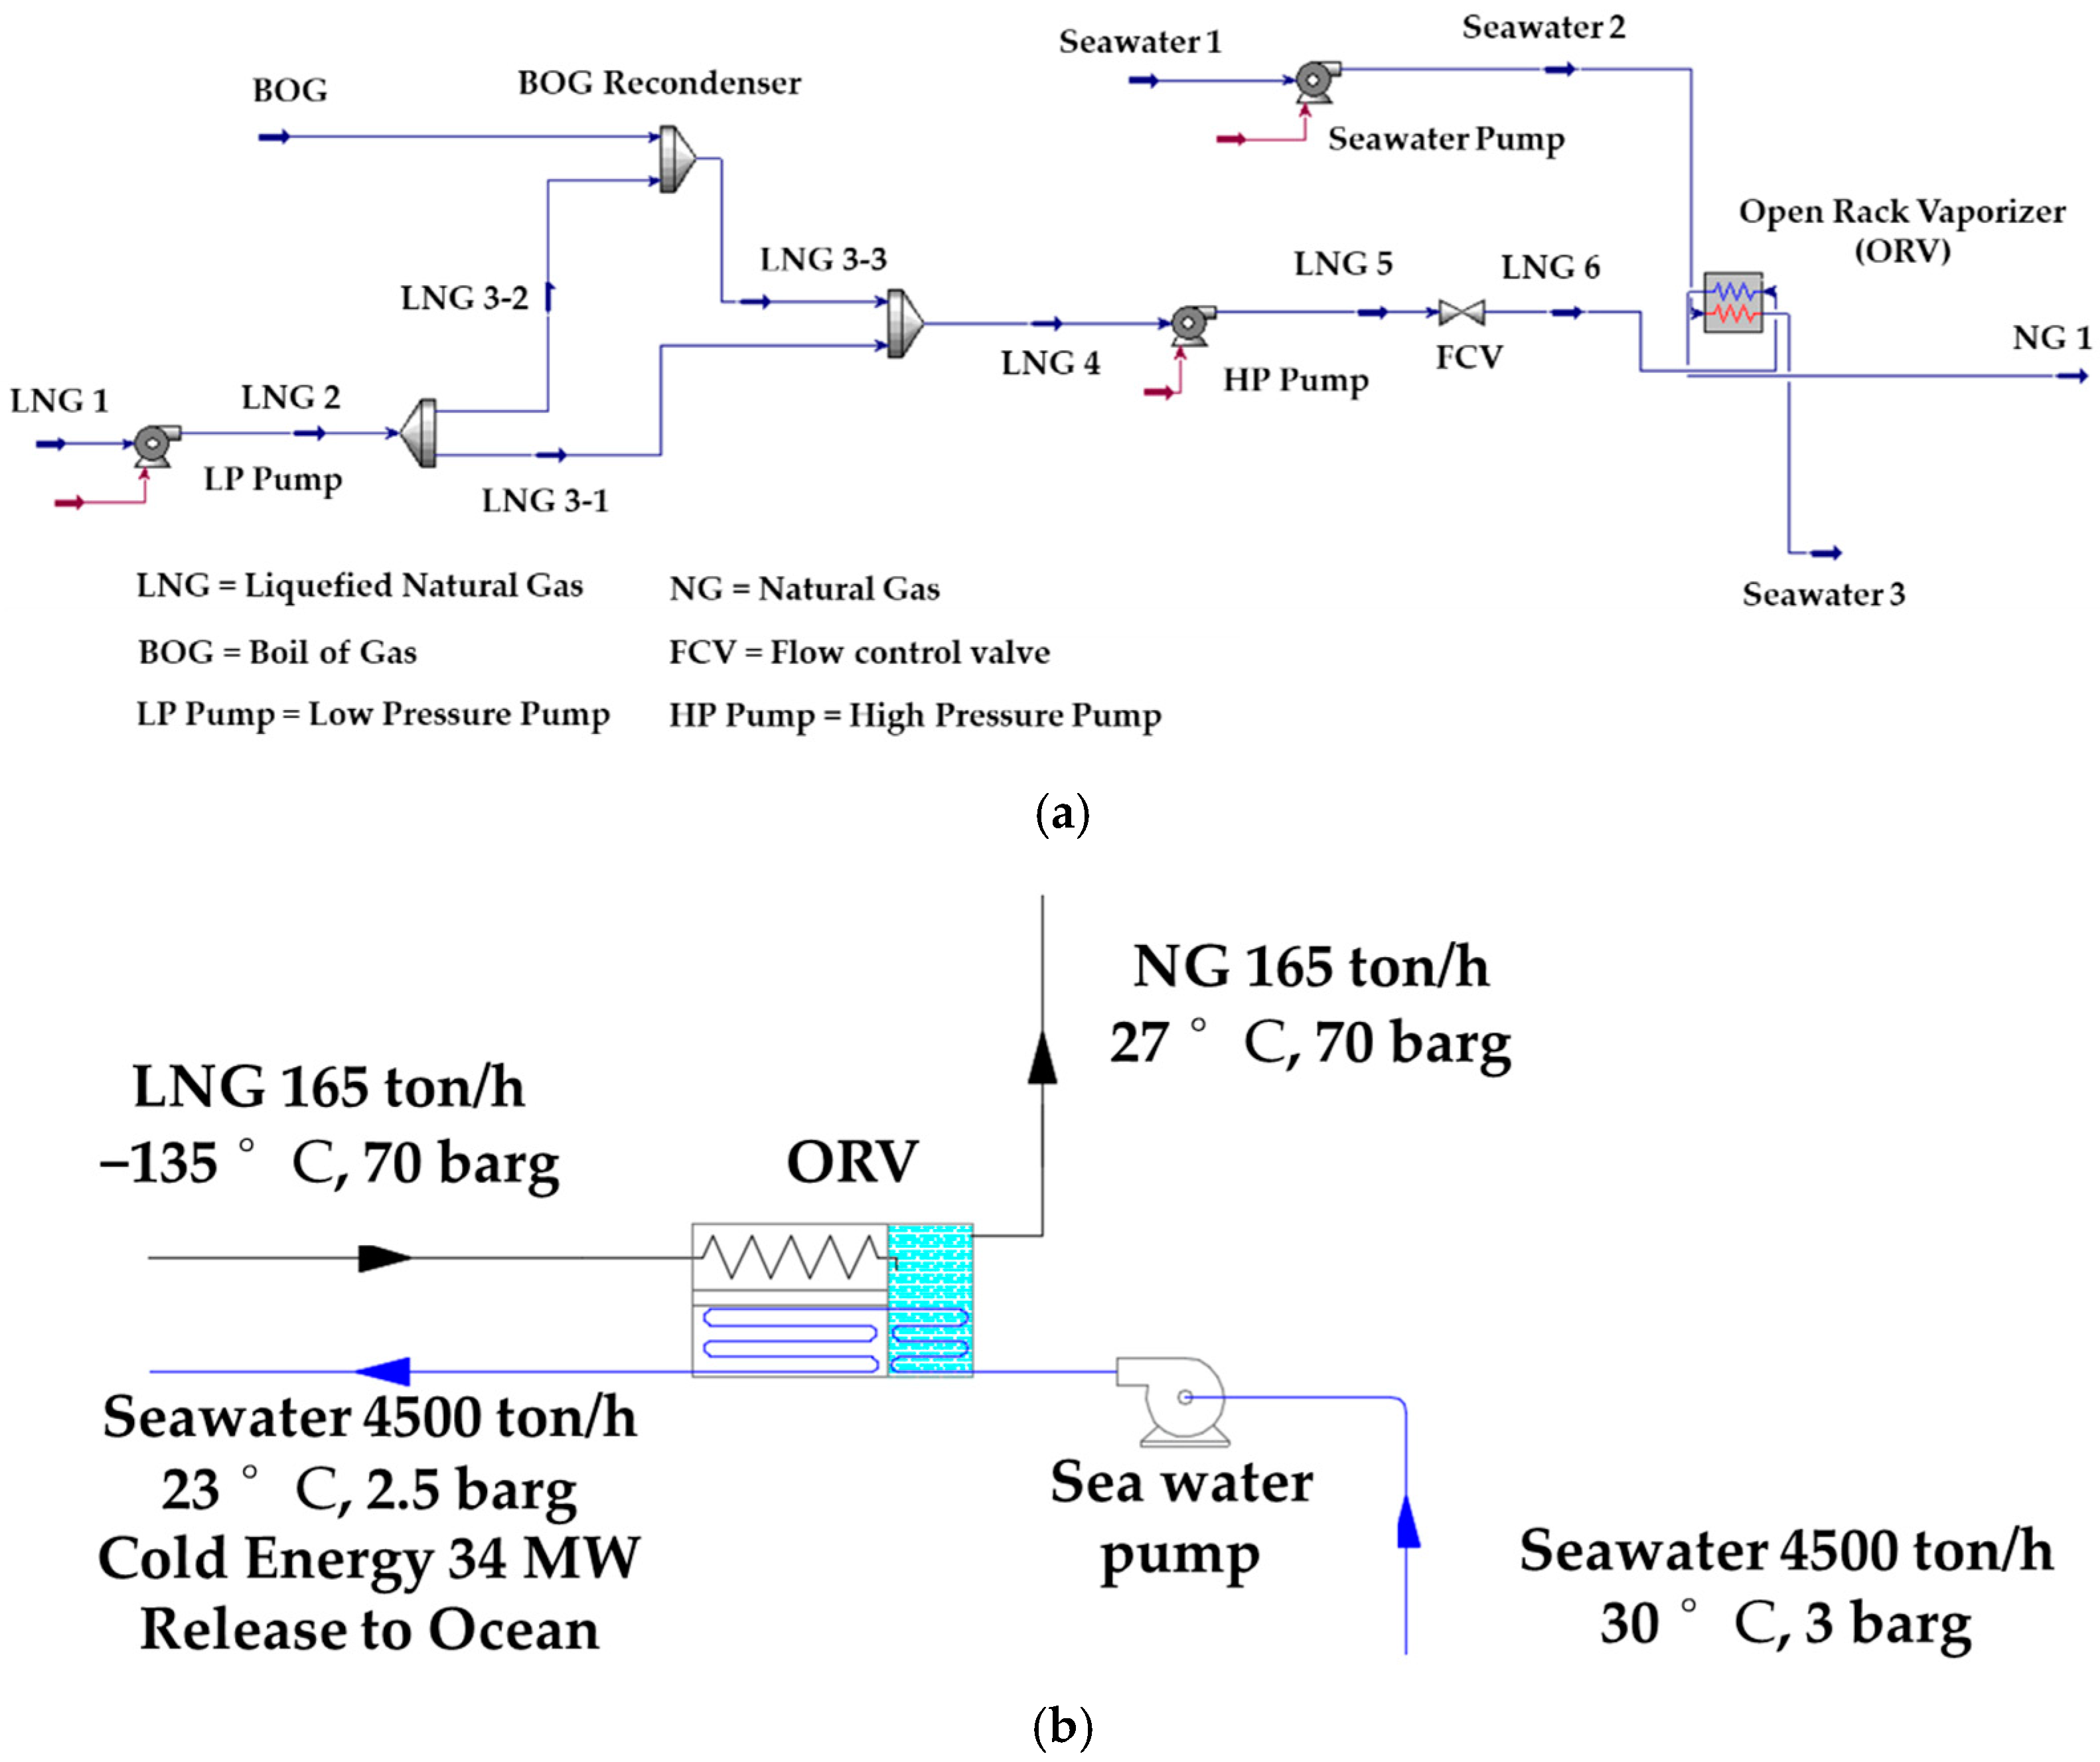
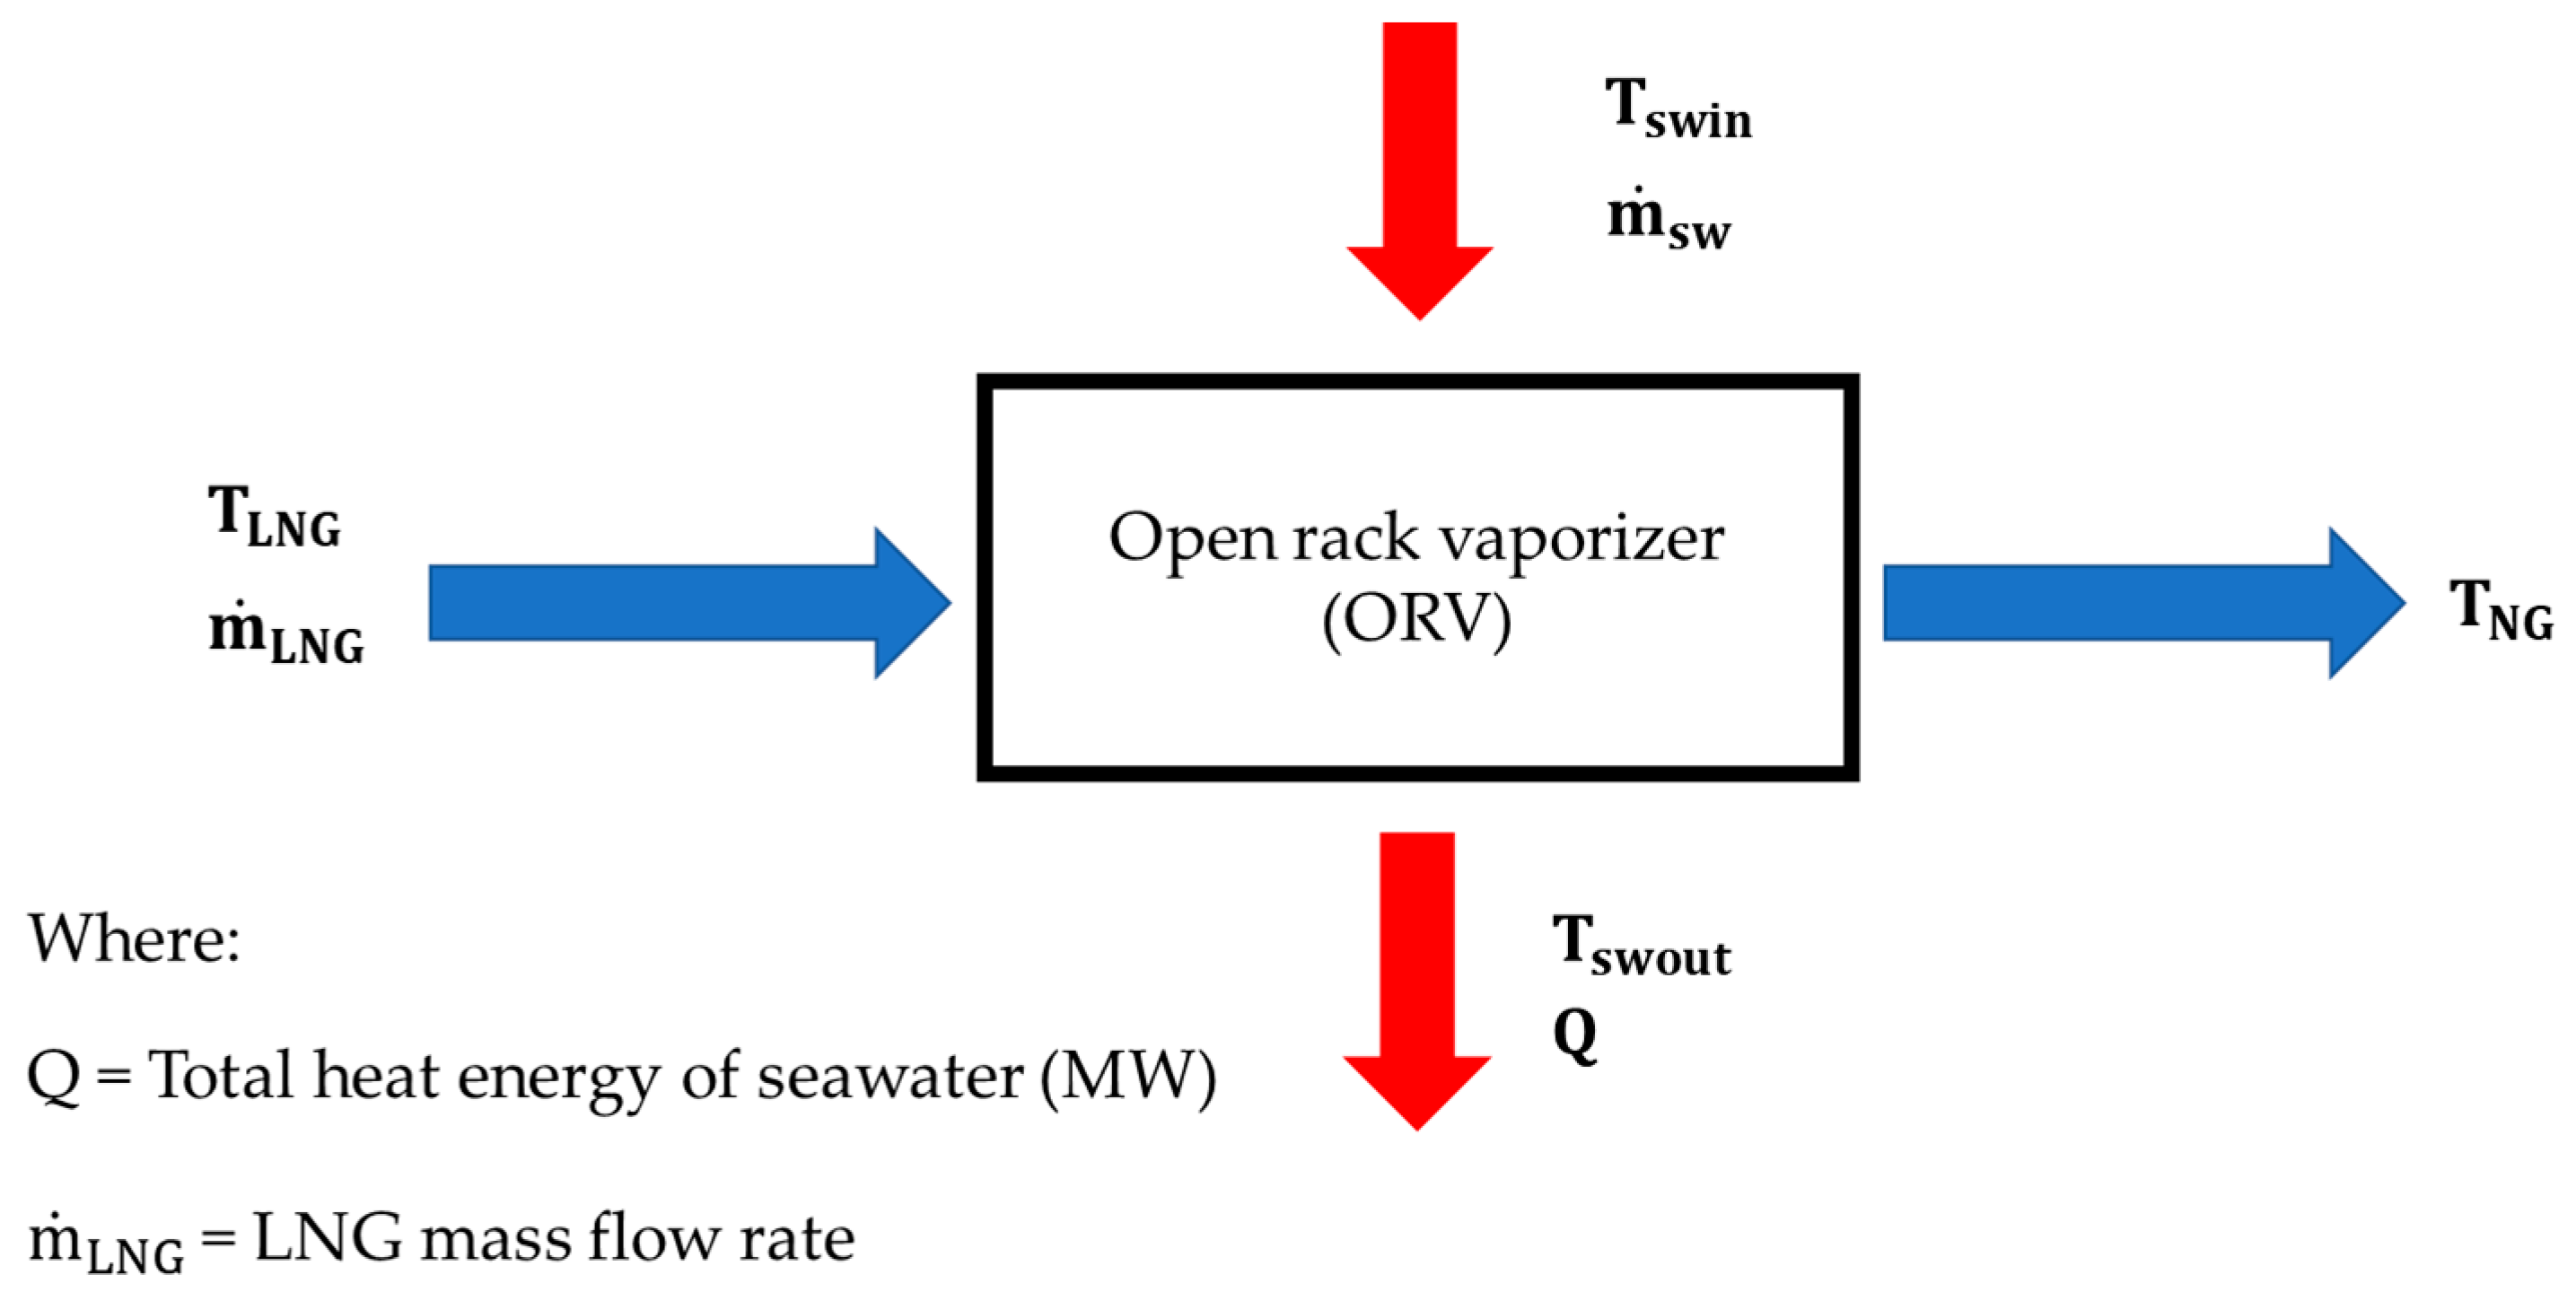
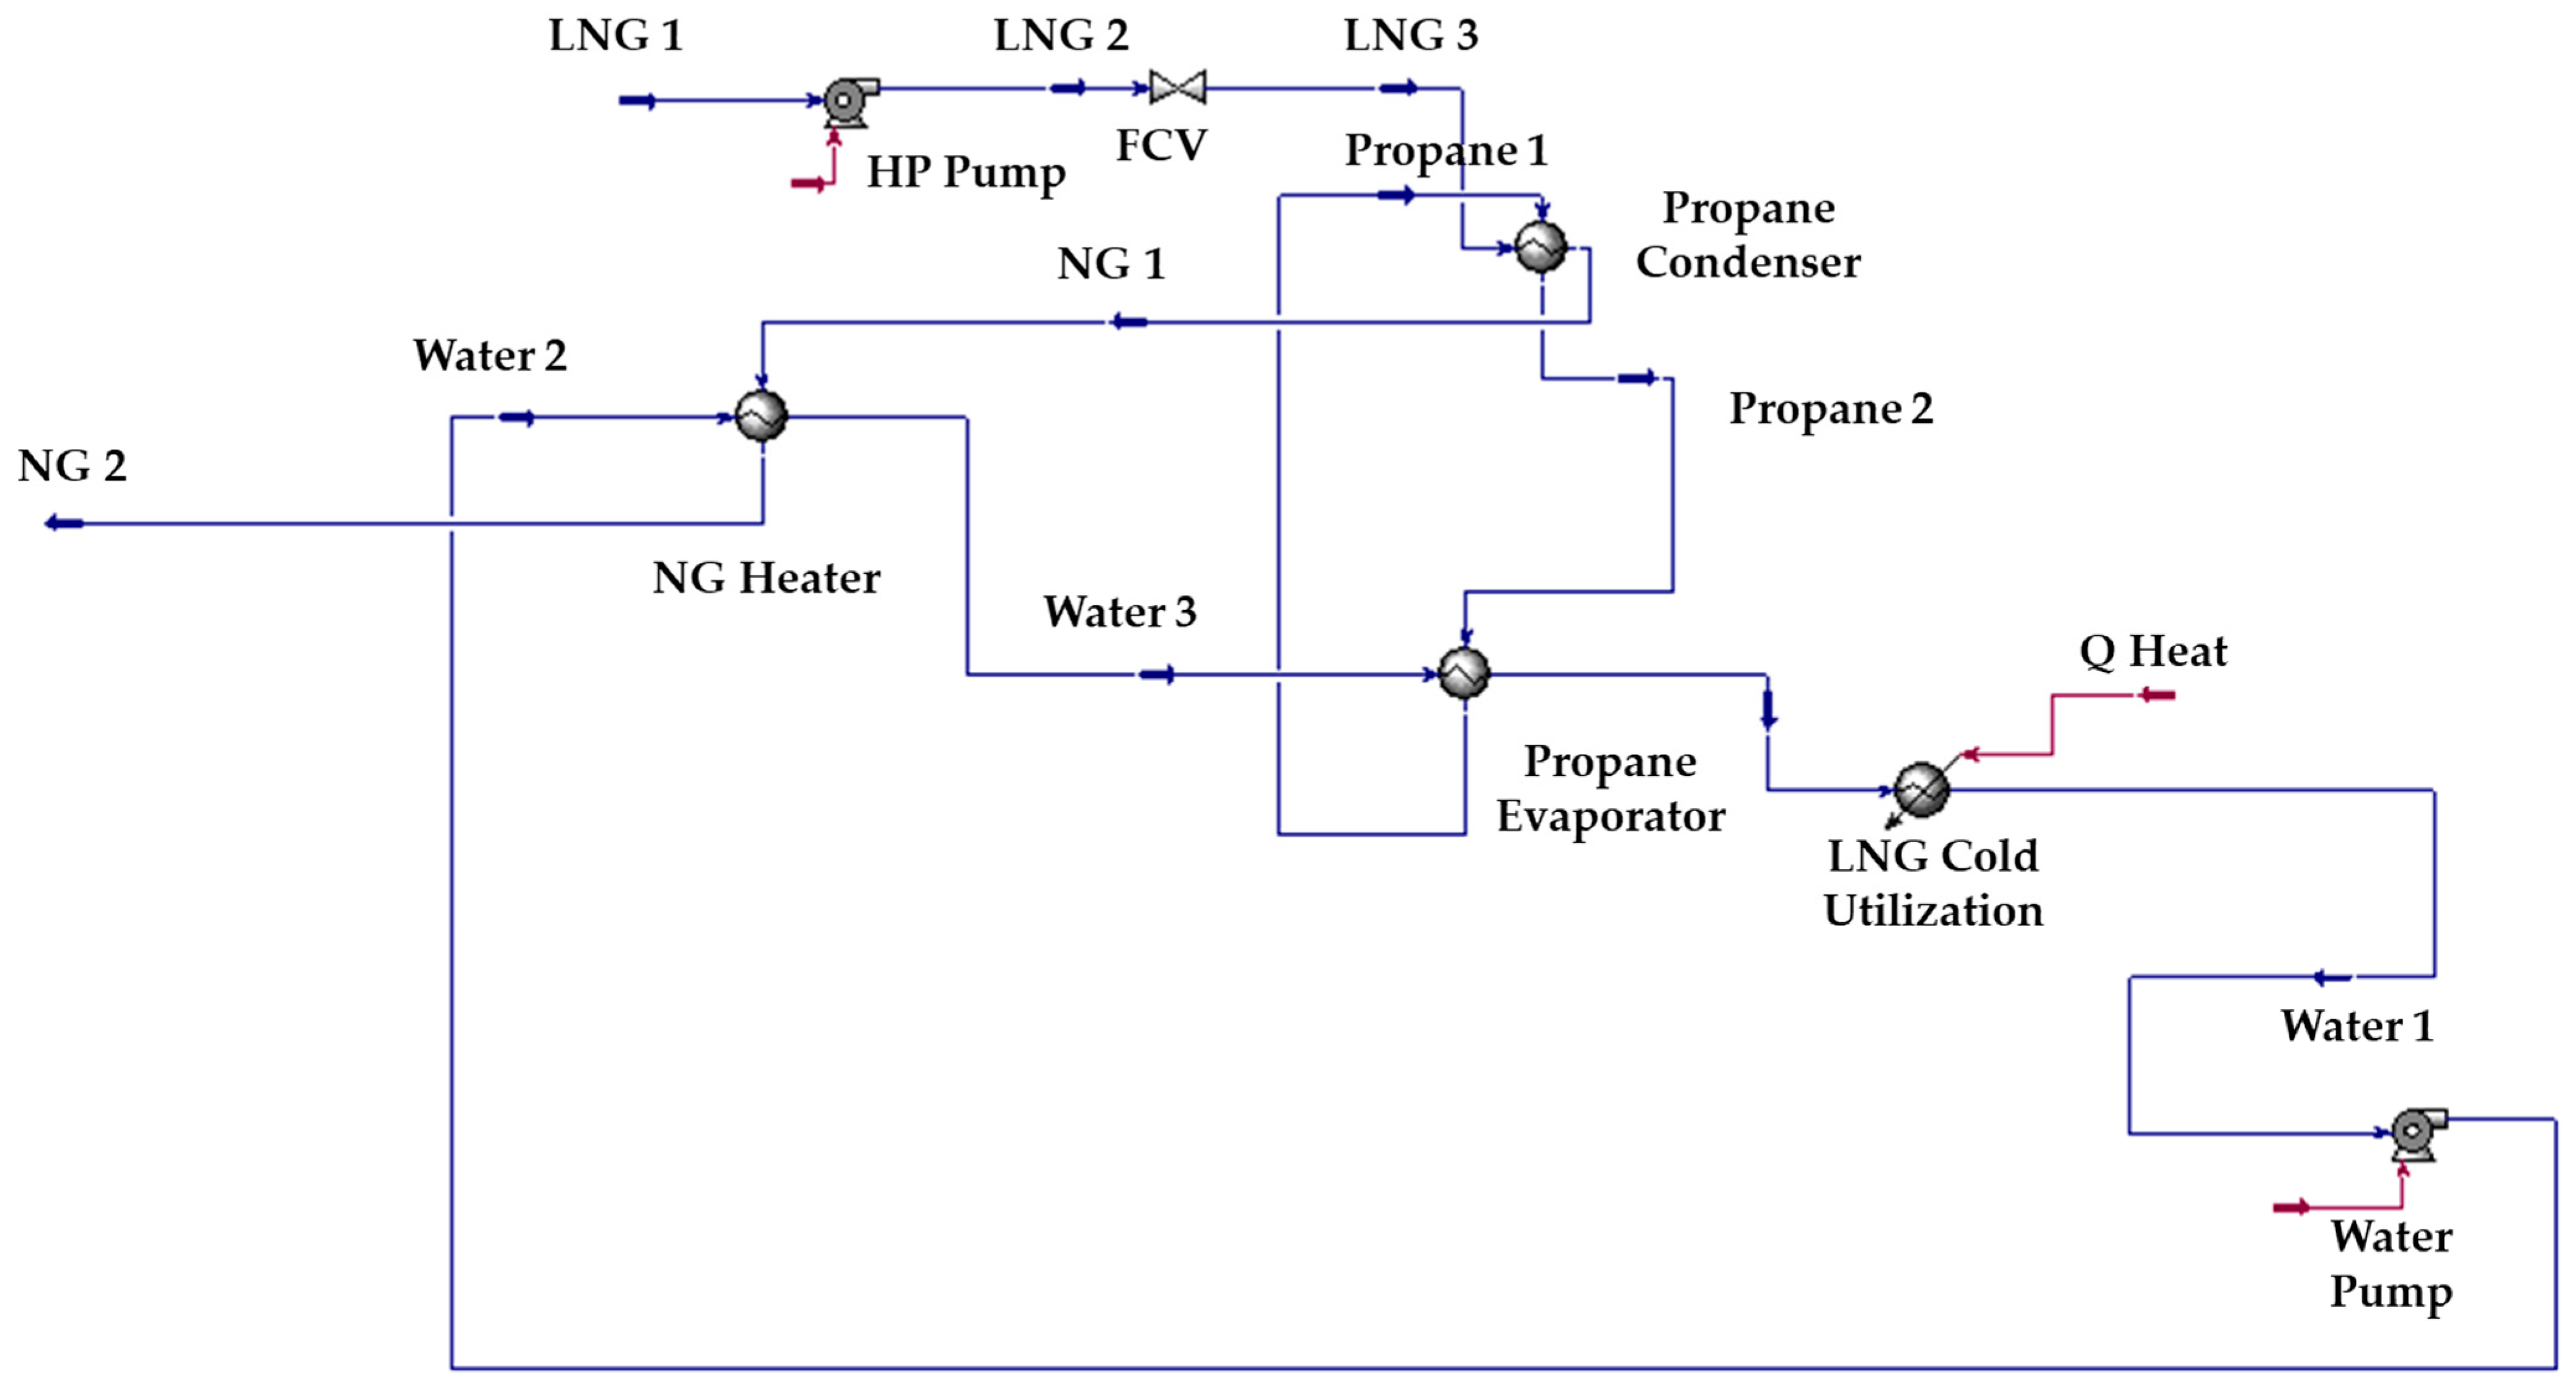
3.1. Conventional LNG Receiving Terminal

In LNG storage tank conditions corresponding to −160 °C and 1.13 bar, LNG, which acts as a heat sink, is pumped out from the storage tank via low-pressure pumps. The pressure of LNG is then increased from 8.3 to 100 bar via high-pressure pumps, which is higher than the gas pipeline of PTT pressure for control purposes. Afterwards, the LNG pressure is reduced to the pressure of the gas pipeline of PTT from 100 to 70 bar in a flow control valve before being sent to an ORV. High pressure is necessary for the pipeline distribution to power plants, gas stations and industry. At the ORV, LNG absorbs heat from seawater as a heat source. The seawater with cold energy is released into the environment. After this, the temperature of LNG increases from −160 to 25 °C, changing its phase to NG before being sent to the gas pipeline of PTT. However, cold energy is still wasted during regasification with seawater to the environment, as presented in Figure 1. Conventional LNG vaporisers release cold energy into seawater and also consume power to operate a seawater pump. Additionally, the temperature of heat sources is decreased after the regasification process. This affects the environment and ecosystem near the LNG receiving terminal, which can lead to complaints from local residents engaged in fishing and aquaculture.
For this process, the cold energy wasted and released into the environment is estimated using the first law of thermodynamics, as in Equation (1):
Q = m sw Cp sw ( T swout   T swin )
where Q, m sw , Cp sw , T swout and T swin are the total heat energy (MW), mass flow rate (ton/h), specific heat capacity (kJ/kg °K) and inlet and outlet temperatures (°C) of seawater, respectively as presented in Figure 2.

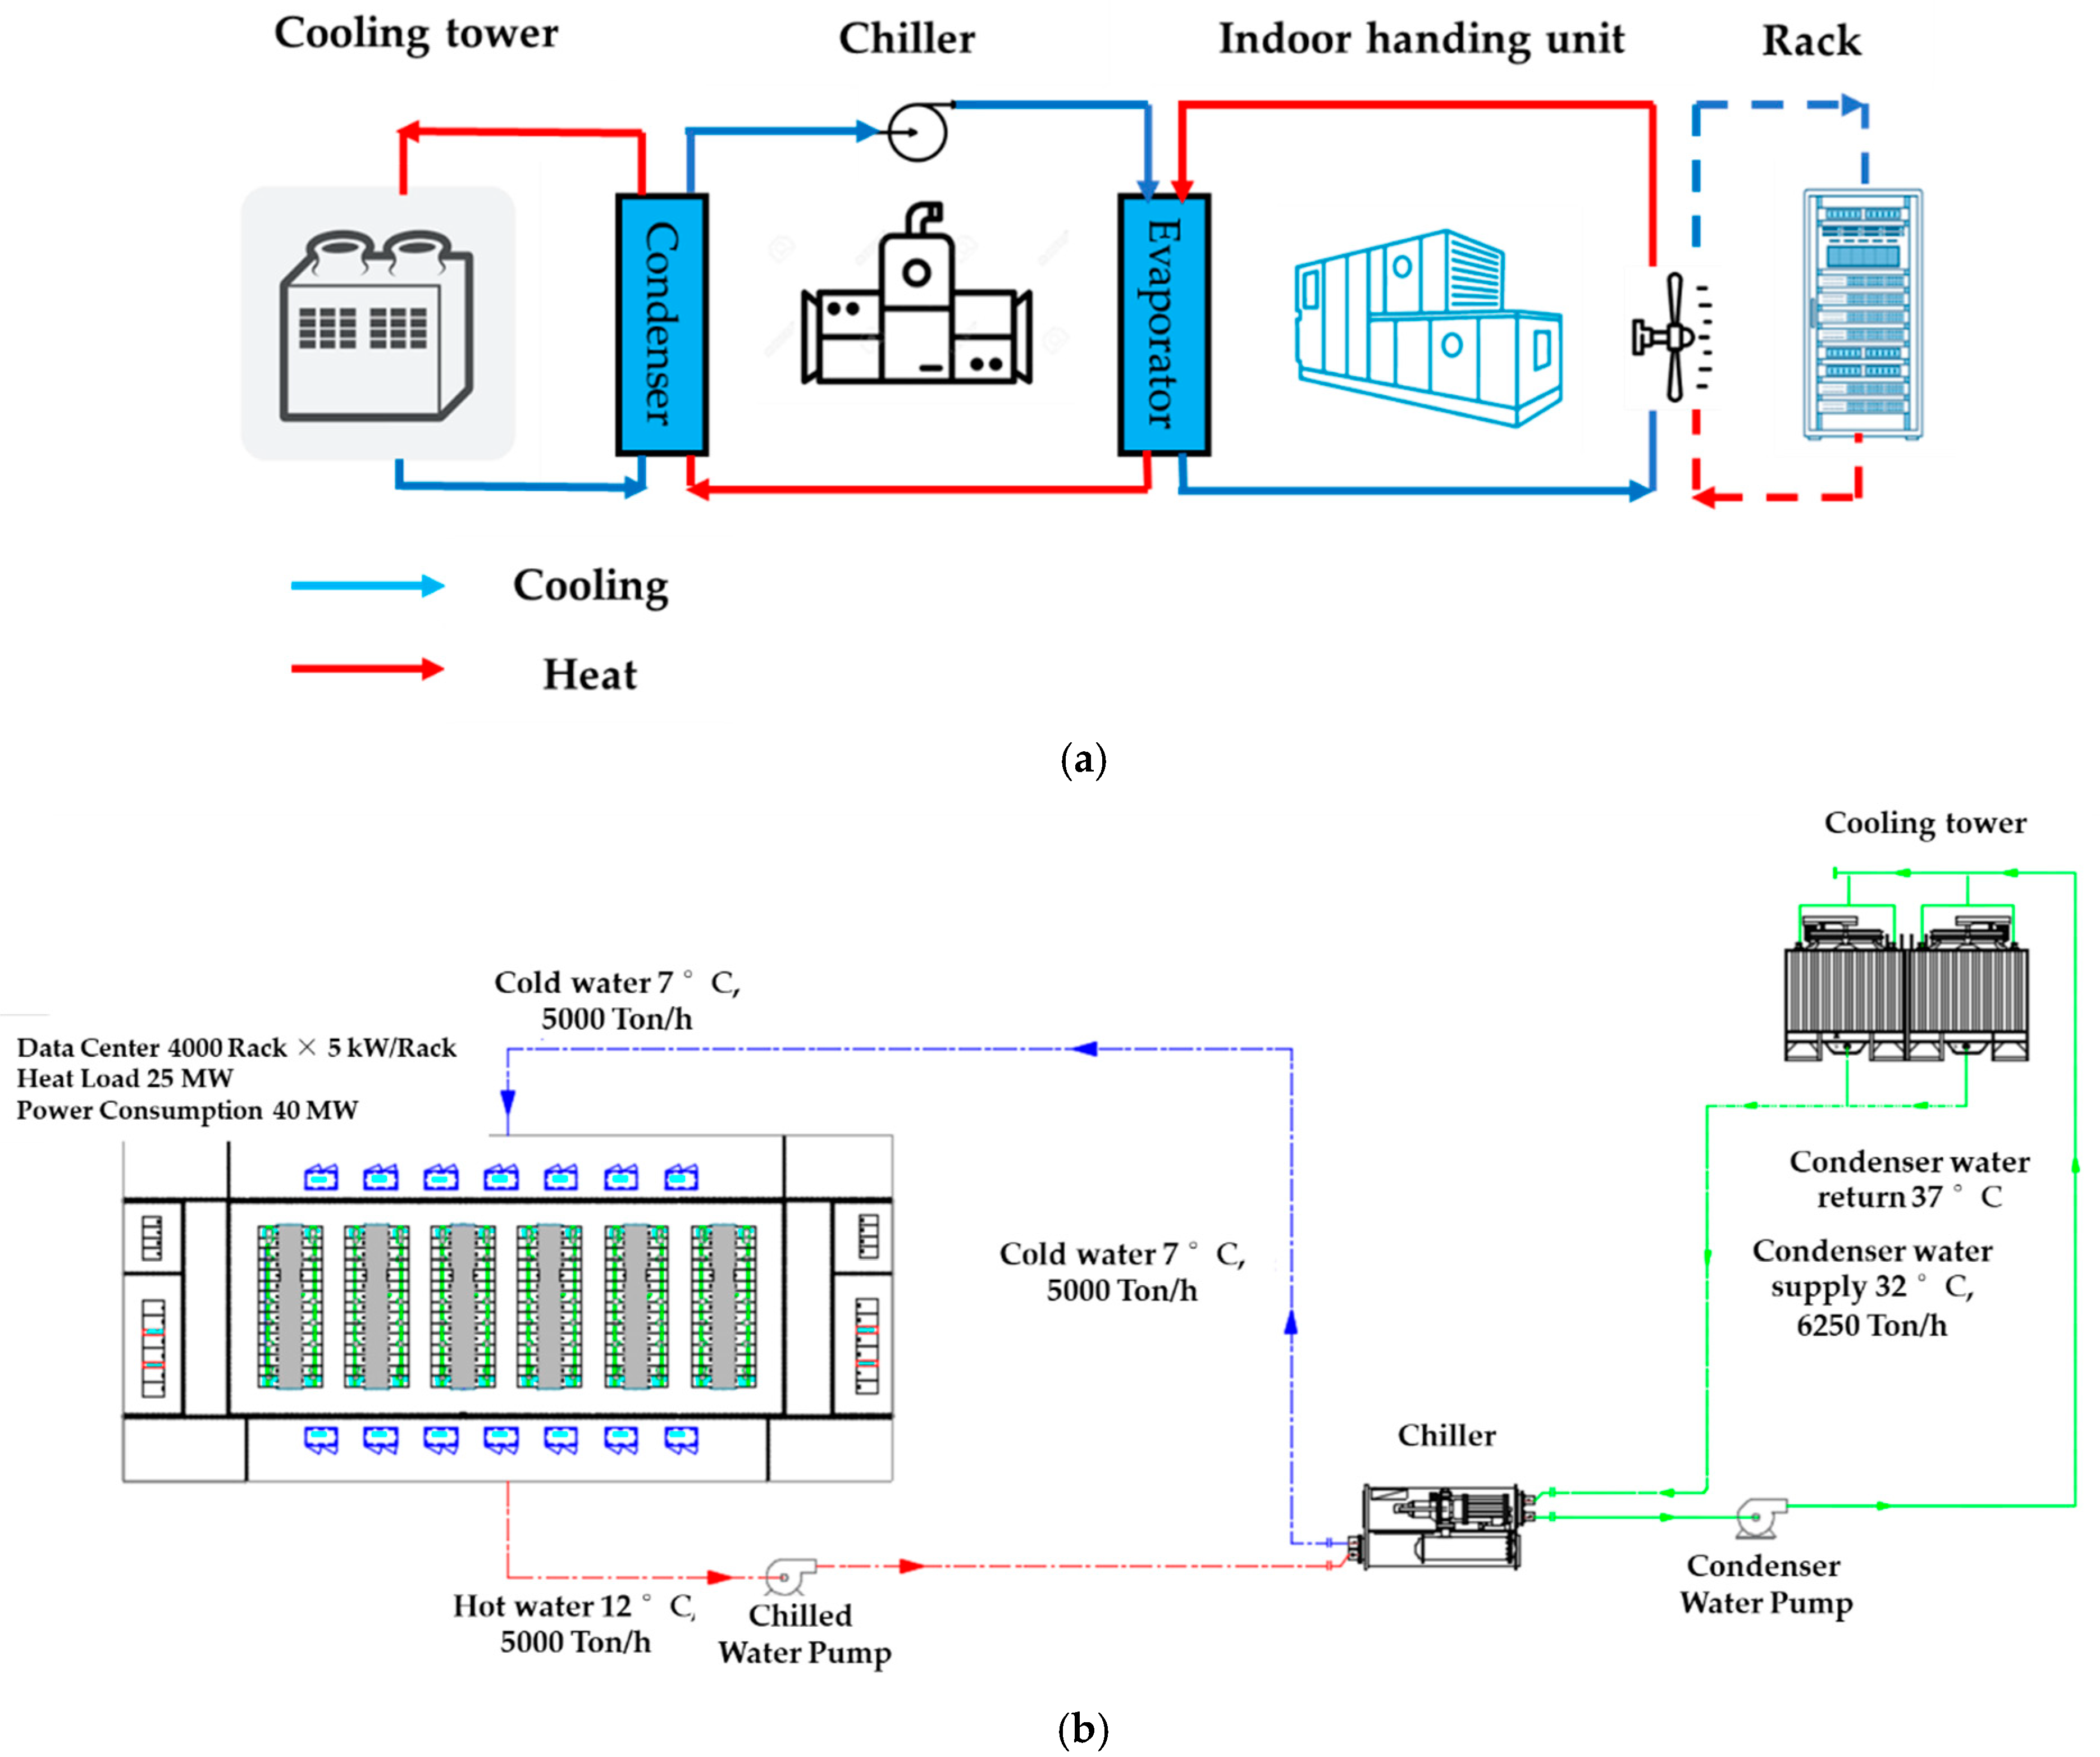
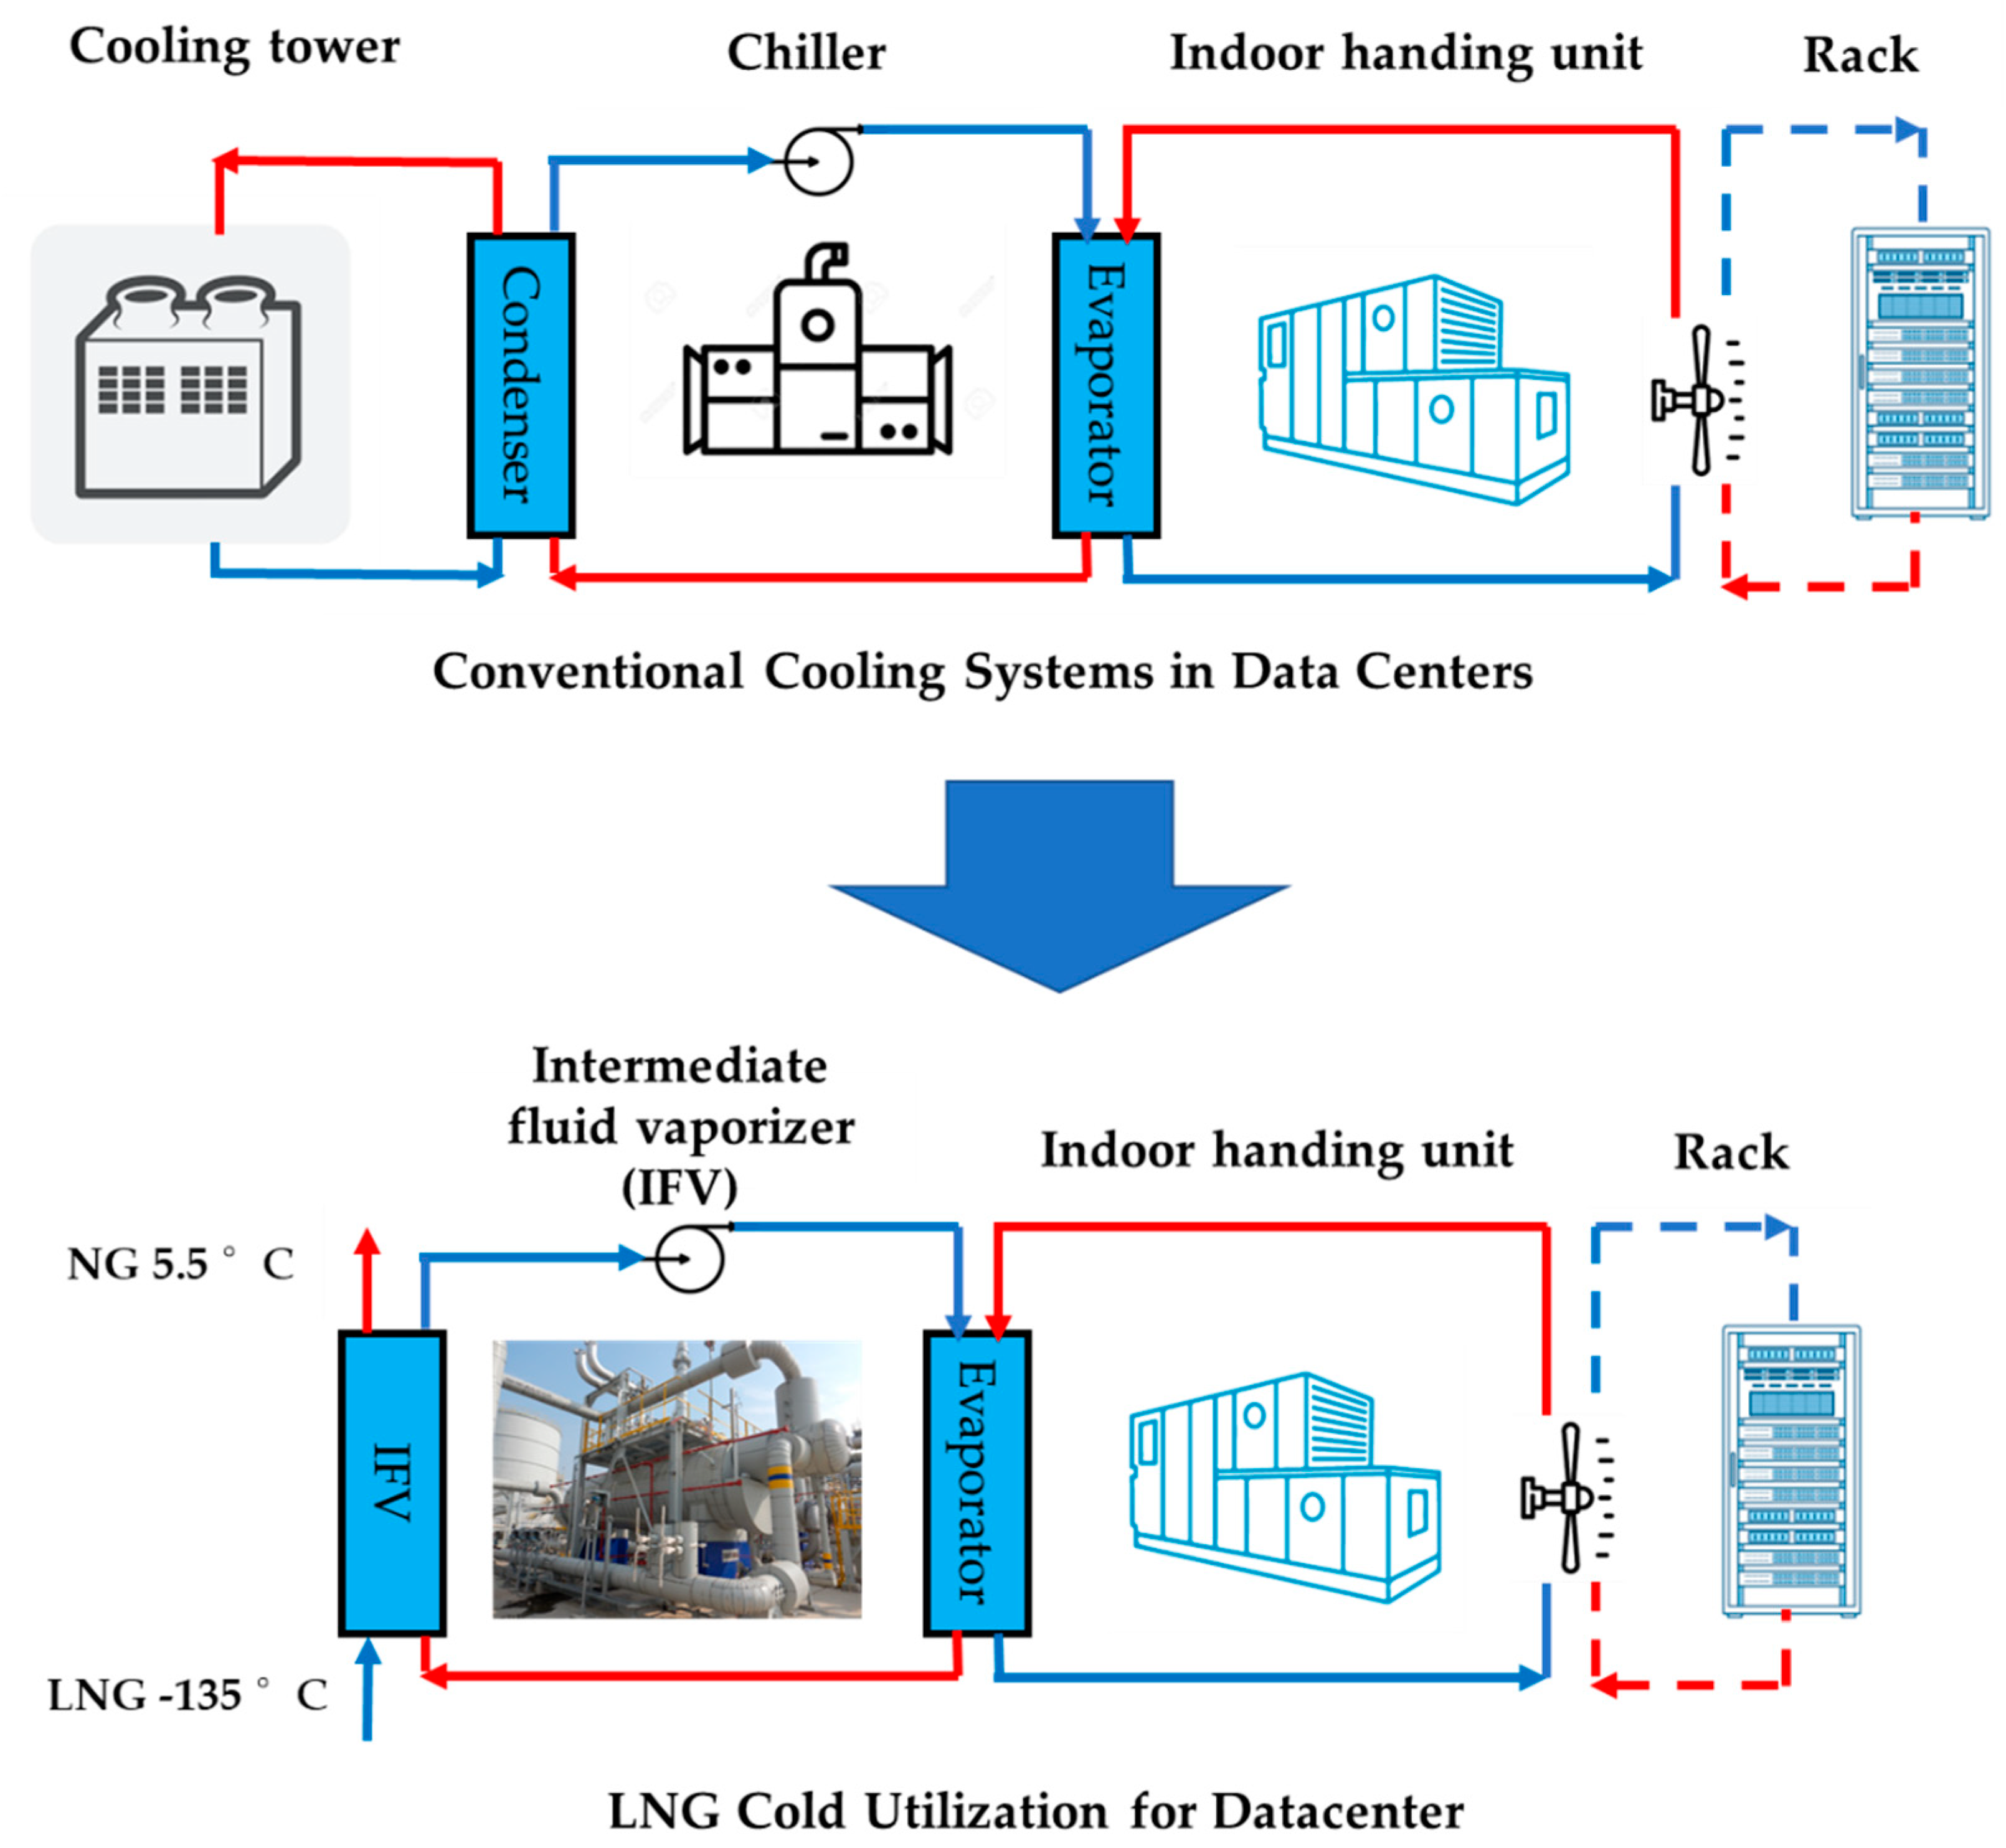
3.2. Conventional Cooling Systems in Data Centres

IT devices release significant amounts of heat by transforming electrical energy into thermal energy. It is necessary that the indoor temperature of 22 ± 2 °C and humidity of 50 ± 5% are controlled in data centres using cooling and air conditioning systems to remove excess heat and to avoid damage to electrical components. The conventional cooling systems in data centres consist of an electrical chiller used to produce low-temperature water in its evaporator, and then the chilled water is delivered to the terminal air handling units to take away the emitted heat from the racks. In contrast, the condensation heat of the chiller is emitted into the environment through the cooling tower, as presented in Figure 3. Refrigeration and air conditioning account for ~50% of the total electric usage of a data centre.
The PUE is a ratio that describes how efficiently a data centre uses energy and how much energy is used by the computing equipment. The PUE can be used to reduce energy consumption and is defined as the ratio of total data centre input power to the power used by the IT equipment, as in Equation (2):
P U E = T o t a l   F a c i l i t y   P o w e r I T   E q u i p m e n t   P o w e r
The ideal PUE value is 1, which means that 100% of the energy goes to powering useful services and ICT equipment rather than being wasted on cooling, i.e., the maximum attainable efficiency with no overhead energy. The higher the PUE, the lower the efficiency of the facility as more “overhead” energy is consumed for powering the electrical load. This means the use of more electric consumption by cooling systems, UPS, fans, pumps, transformers, lighting and other auxiliary equipment, in addition to the consuming IT load.
The chillers and cooling towers operated in cooling systems consume 50% of the total data centre energy. The energy consumption of a cooling system has a significant impact on the average PUE of global data centres. This index is normally ~2.0 [9]. In general, when considering tropical countries, such as Thailand, cooling systems consume more than 50% of the electricity consumption of data centres and result in an average PUE in Thailand of 2.0–2.5, representing almost double the electricity costs compared with cold countries with an average PUE of, for example, 1.15–1.40, as in Ireland. The current status of free and applicable cooling technologies consists of airside free cooling, waterside free cooling [5] and heat pipe technology.

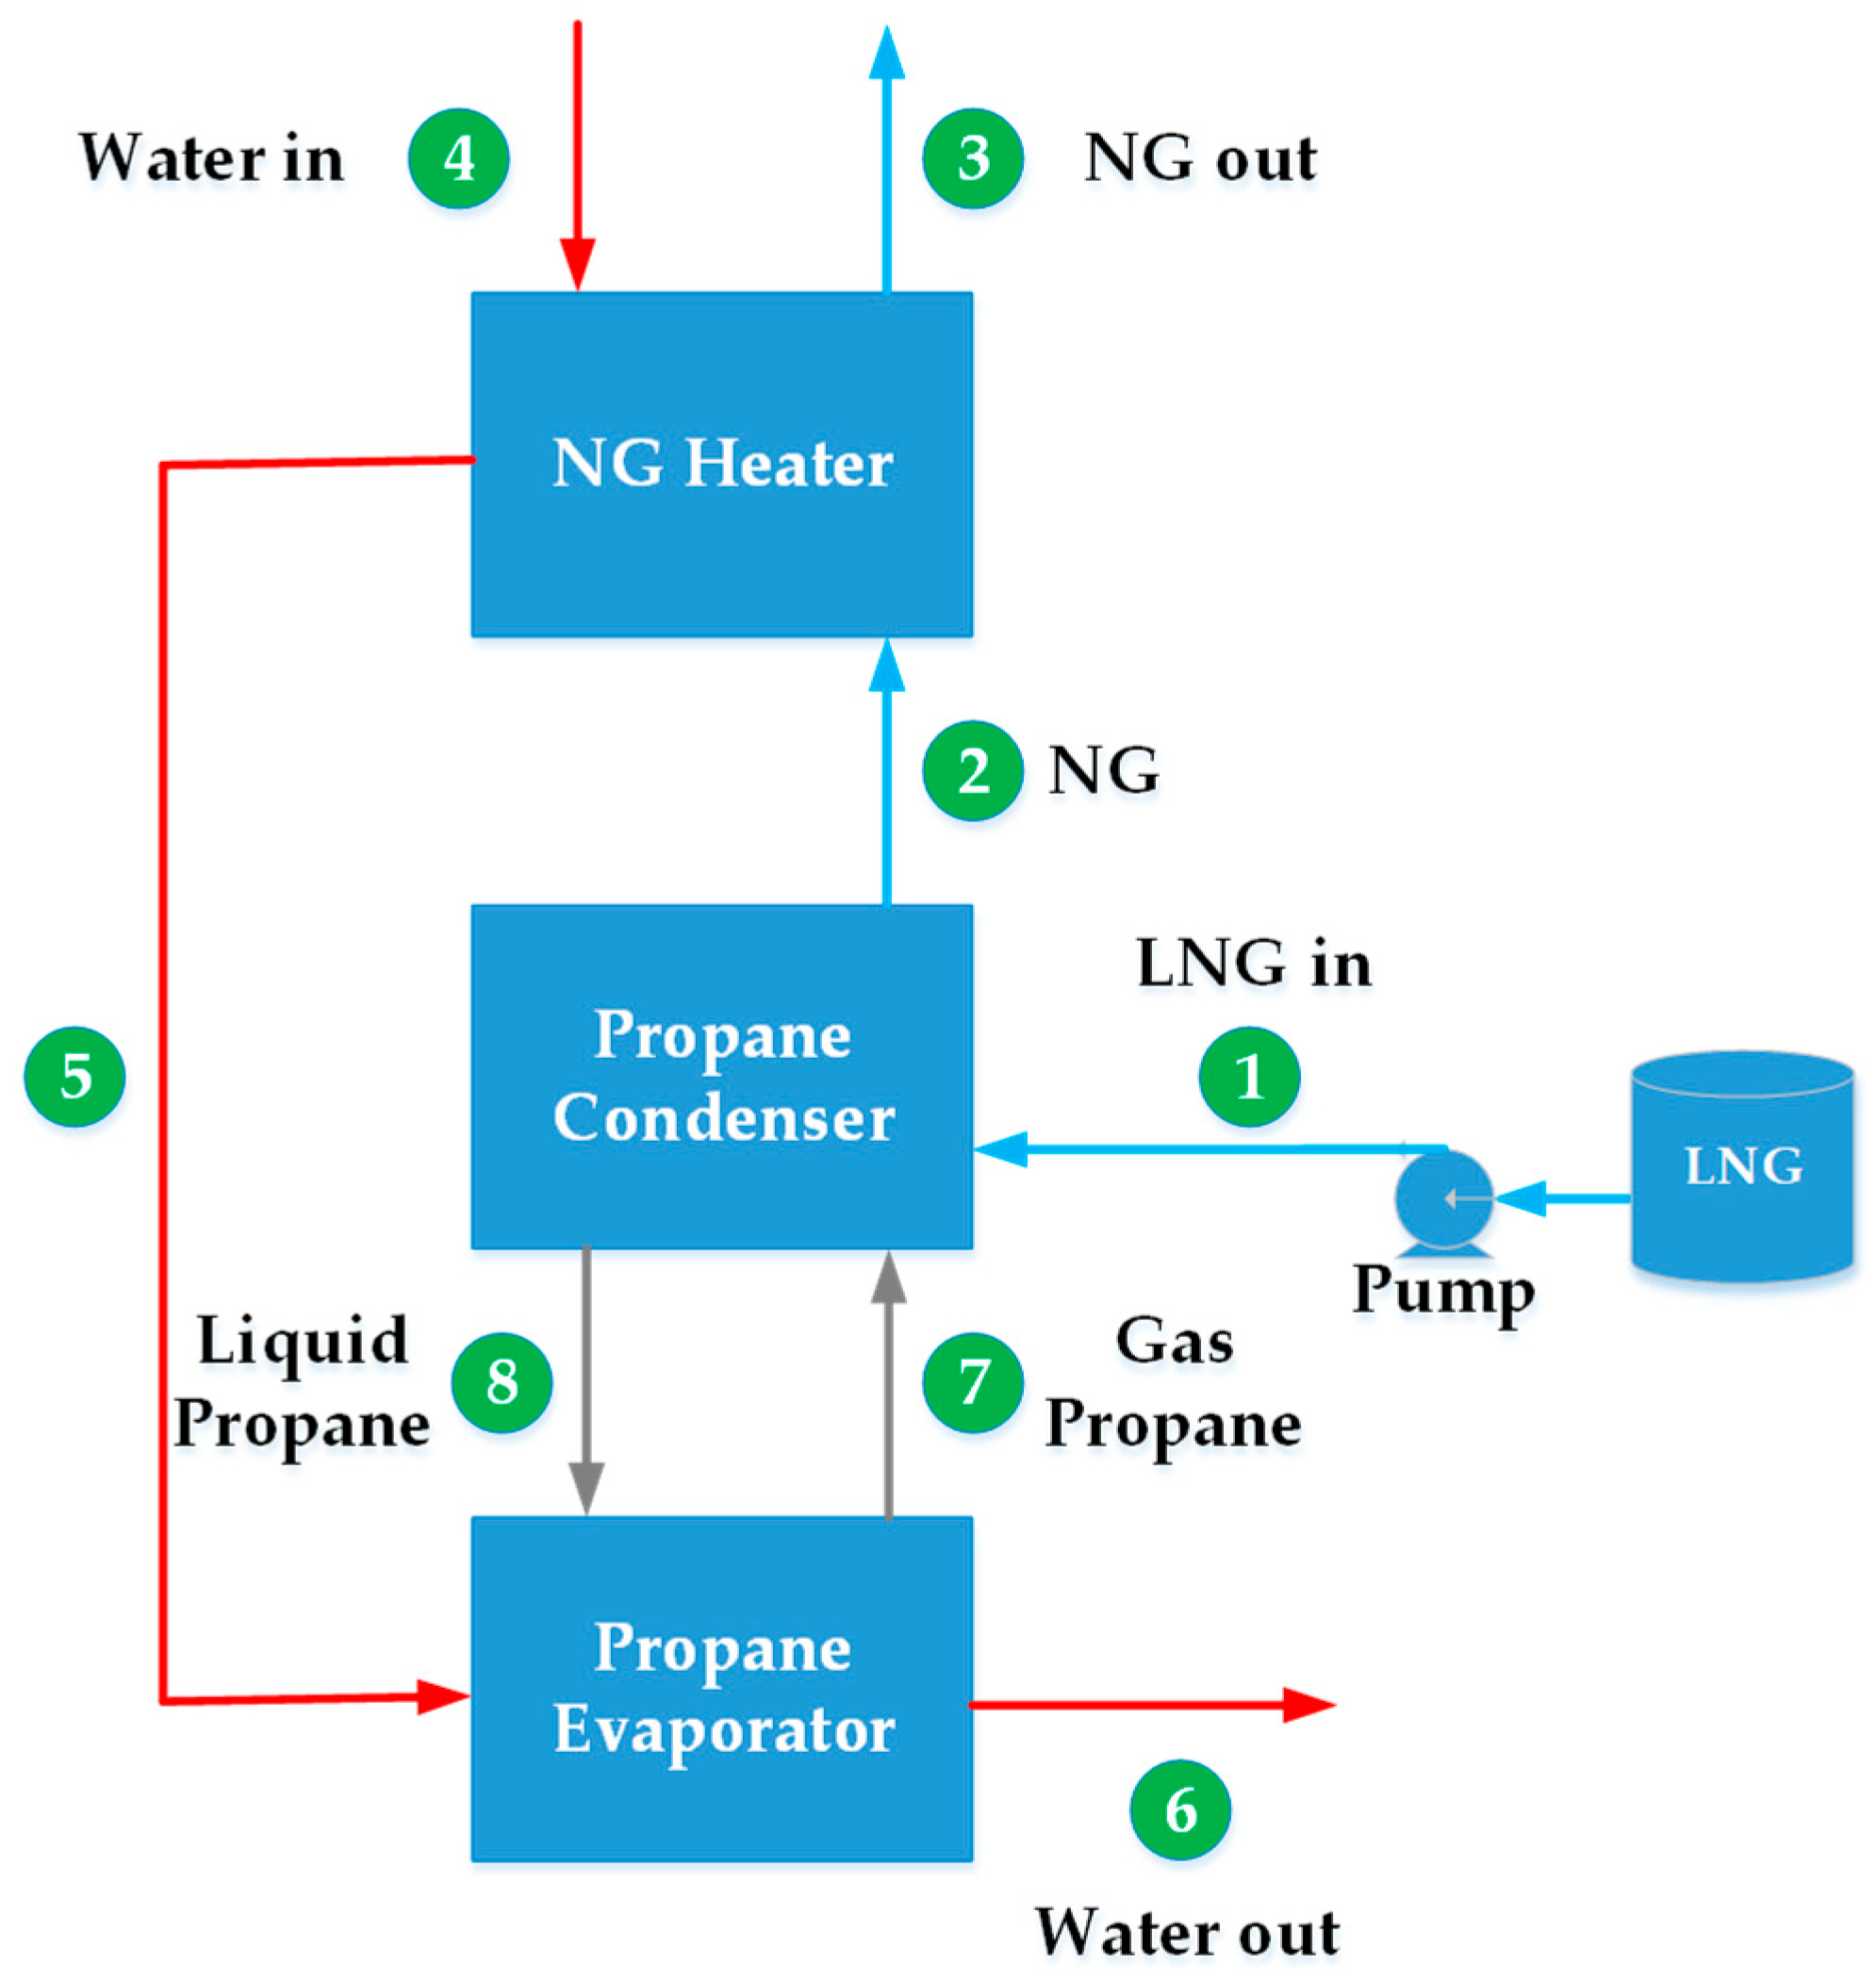
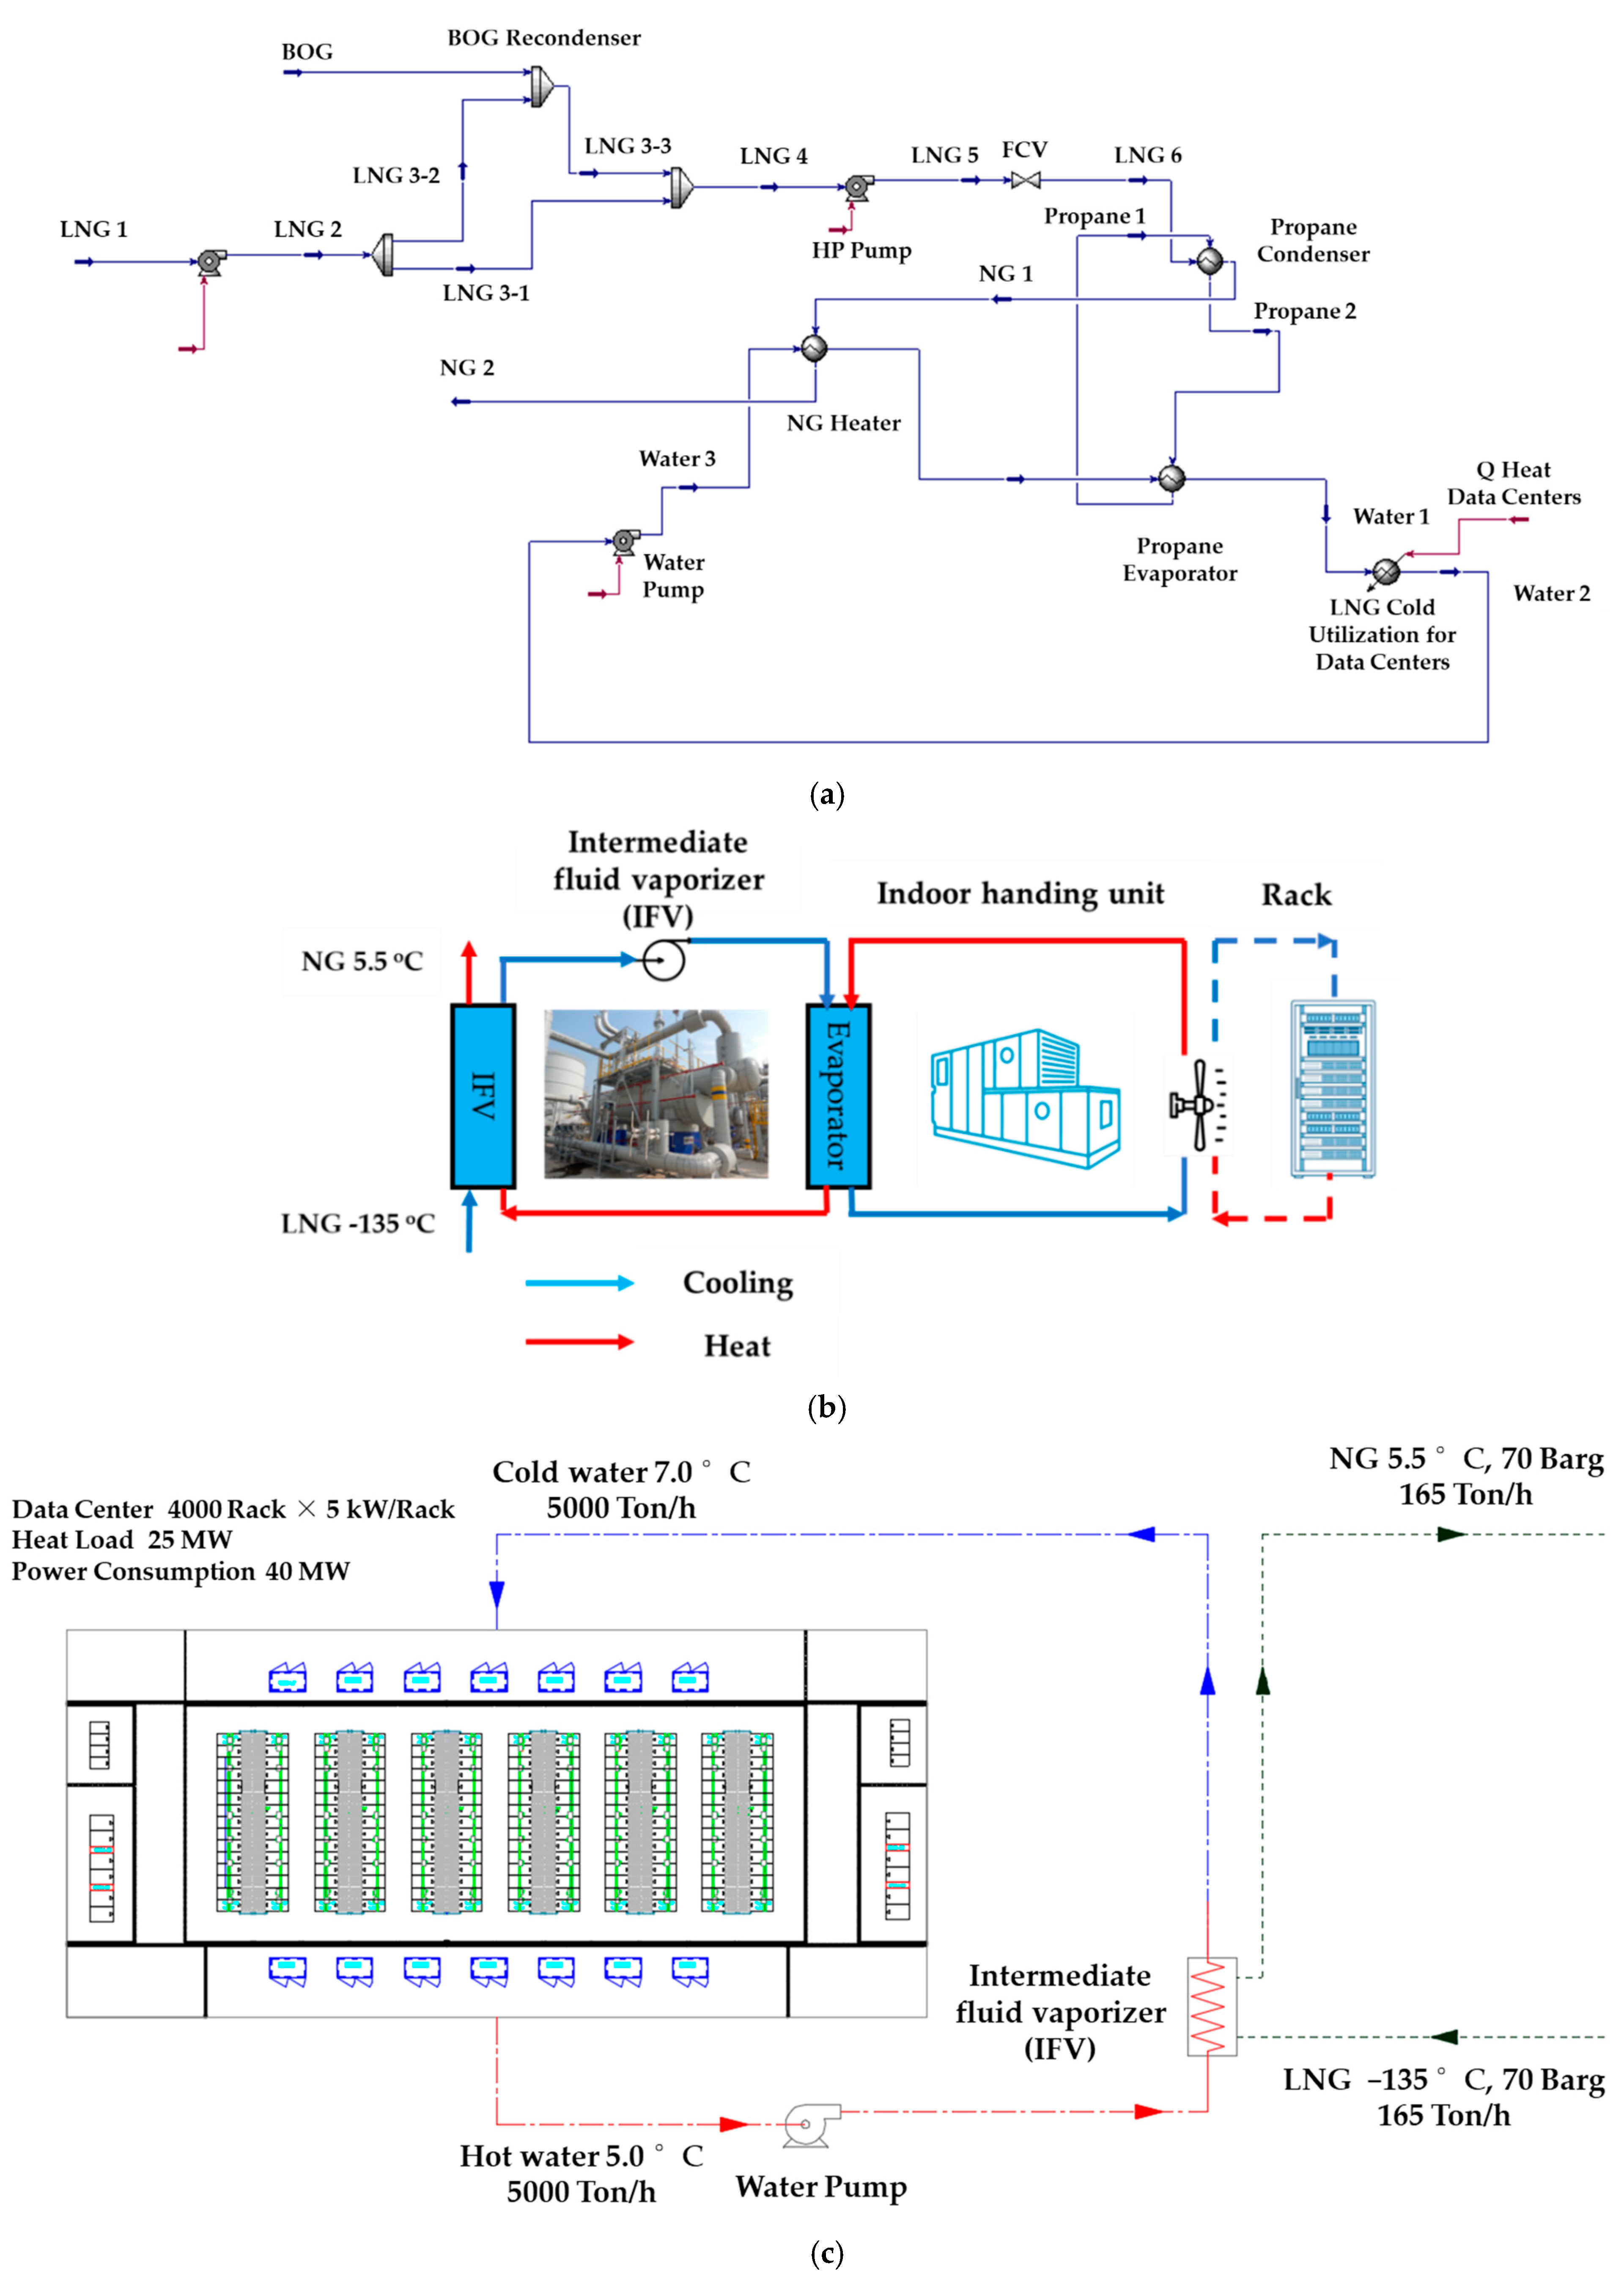
3.3. LNG Cold Energy Utilisation Using Intermediate Fluid Vaporiser (IFV)

One advantage of using propane as the heat transfer fluid is the IFV. IFVs are compact shell-and-tube heat exchangers consisting of three parts: a condenser to release the latent heat of the intermediate fluid (IF) to LNG, an evaporator to vaporise the IF by a heat source and a gas heater to increase the temperature of NG to meet the customer requirements [26,27]. Normally, the condenser and evaporator of an IFV are in one large shell, while the gas heater is installed separately. The shell of an IFV contains an IF with a low boiling point, such as propane, as presented in Figure 4.
This study uses HYSYS V11.0 (AspenTech, Bedford, USA) as the primary simulation tool. The basic calculation for the system is summarised in Table 1. The water outlet from the vaporiser is kept at 5 °C to meet the data centre requirements. Isentropic efficiencies in all pumps and turbines are set at 75%. The LNG, working fluid and cooling water are pure propane and pure water, respectively. The process flow diagram of an IFV is presented in Figure 5.

3.4. LNG Receiving Terminal Combined with a Data Centre Using Intermediate Fluid Vaporiser (IFV)

In this arrangement, the operating conditions of LNG are similar to the existing plant. First, the LNG is pumped out from the LNG storage tank via low-pressure pumps, and high-pressure pumps increase its pressure from 8.3 to 100 bar before the flow control valve reduces its pressure from 100 to 70 bar, before being sent to the IFV. At the IFV, LNG absorb heats from the return water of the data centre. The temperature of this water decreases from 12 to 7 °C. The cooled water is transferred to the cooling system of a data centre as a heat source. The temperature of LNG increases from −160 to 5 °C, changing to NG before being sent to the gas pipeline of PTT. The simulation diagram for LNG cold utilisation with a data centre is presented in Figure 6.
The quality of LNG cold energy utilisation can be evaluated by the “exergy efficiency”, which is defined as the potential or maximum amount of useful work of a system and is an effective tool for evaluating the amount of energy that is lost in the system [28,29]. “Exergy efficiency” is considered one of the indicators representing how efficiently LNG cold energy utilisation is transferred to a target user, as in Equations (3) and (4):
E x e r g y   e f f i c i e n c y = E x e r g y   3 E x e r g y   1 E x e r g y   2
η i = E i u s e r E i L N G
where η i is the exergy input of Targeted User i (%), E i u s e r is the amount of Exergy obtained by the Targeted User at the facility i (kWh/LNG-Ton), E i L N G is the amount of Exergy of LNG cold energy consumed at the facility i (kWh/LNG-Ton), as presented in Figure 7.

4. Results and Discussion

The record data of a project information management system from an operating IFV in an LNG receiving terminal from 1 to 15 December 2020 are used, which is the best period to reflect the operating condition using the data sheet from the manufacturer of the IFV. The result shows that the average temperature approach of the IFV is ~1.25 °C less than the minimum temperature approach of the simulation of 2.5 °C, as presented in Table 2.
A comparison between the simulation IFV on HYSYS V11.0 (AspenTech, Bedford, USA.) and the existing IFV in the LNG receiving terminal shows that the error is ~0.95–2.00%, as presented in Table 3.
The simulation results from HYSYS V11.0 show that the conventional LNG receiving terminal at a flow rate of 165 t h−1 or 1.25 MTPA will produce ~33.23 MW of cold energy, equivalent to 9508 t of refrigeration, which will be released into seawater during regasification with an ORV. This model requires a seawater pump to consume 290 kWh of electrical energy for 365 days.
The LNG receiving terminal combined with a data centre using an IFV will provide ~29.12 MW of cold energy, equivalent to 8320 t of refrigeration. This will produce a 7 °C water supply for the cooling system at a flow rate of 5000 m3 h−1 to absorb the heat generated from the IT equipment of data centres. The temperature of water returning from the cooling system increases to 12 °C and returns to transfer heat to LNG at the IFV. The simulation result with LNG cold energy utilisation on HYSYS V11.0 shows that a propane evaporator with liquid propane at −6 °C would absorb heat from the water and change from liquid to gas at −6 °C. Simultaneously, the gaseous propane will absorb 21.1 MW of cold energy from an LNG flow rate of 168 t h−1. The LNG transforms NG at 2 °C, while propane transforms to a liquid again in the condenser. In the gas heater, water will absorb cold energy of 8.6 MW from the NG, and the NG will warm up to 5 °C, as per the customer requirements. An IFV can produce a 7 °C cold water supply cooling system, at a flow rate of 5000 m3 h−1, by using 29.82 MW of LNG cold energy, equivalent to 8320 t of refrigeration per hour, as presented in Table 4. This model requires a cooling pump to consume 665 kWh of electrical energy for 365 days.
A comparison of the heat duty of the data centre for different natural gas pressure levels for various applications is presented in Table 5. The heat duty of the data centre is directly proportional to the number of server racks installed. The number of server racks increases with the decrease in the natural gas pressure level. For instance, the maximum heat duty of the data centre is 34.15 MW for 6.0 bar of pressure of the natural gas for steam power stations.
A comparison of the simulation results between the conventional LNG receiving terminal and the LNG receiving terminal combined with a data centre using the IFV is presented in Table 6, and this shows that the IFV could reduce the cold energy released into seawater during regasification by 29.82 MW for the replacement cooling system.
According to the American Society of Heating, Refrigerating and Air-Conditioning Engineers [30], a data centre with 1000 racks will normally consume cold energy of 1428.57 t of refrigeration per hour for the IT heat load, 228.57 t of refrigeration per hour for the UPS heat load, 85.71 t of refrigeration per hour for the power distribution heat load, 97.14 t of refrigeration per hour for the lighting heat load, 51.43 t of refrigeration per hour for the people heat load and 472.86 t of refrigeration per hour for the architecture area. The total heat load is ~2364.29 t of refrigeration per hour or 8.27 MW, as presented in Table 7.
Normally, a conventional cooling system producing cold energy at 1 t of refrigeration per hour will consume 0.75 kWh for a water-cooled chiller, 0.13 kWh for a chilled water pump, 0.17 kWh for a condenser pump, 0.15 kWh for a cooling tower and 0.15 kWh for a computer room air conditioning unit (CRAC) [30]. The total electric consumption is 1.35 kWh per ton of refrigeration compared with LNG cold utilisation and will consume electricity of only 0.13 kWh for a chilled water pump and 0.15 kWh for CRAC. Total electricity consumption is 0.28 kWh per tons of refrigeration, as presented in Table 8. The LNG cold utilisation for data centres can reduce the electrical cost by ~79.25% of total electricity consumption for a conventional cooling system with a water-cooled chiller, condenser pump and cooling tower, as presented in Figure 8.
According to the American Society of Heating, Refrigerating and Air-Conditioning Engineers [30], an average data centre with 1000 racks will consume ~4.00 MWh (40%) of electricity for a conventional cooling system, in addition to powering the UPS, fans, transformers, lighting and other auxiliary equipment ~1.00 MWh (10%) and IT load ~5.00 MWh (50%). The total electric consumption of an average data centre is therefore ~10.00 MWh, as presented in Figure 9.
The LNG cold utilisation for data centres can reduce the electrical consumption by ~79.25% for a conventional cooling system, i.e., from 4.00 to 0.83 MWh. This also significantly reduces the PUE of data centres from 2.00 to 1.36, which, for Ireland, is ~1.15–1.40. However, Ireland has a free cooling period of only 6–8 months per year in winter, compared with the LNG cold utilisation for data centres with a free cooling period of 12 months per year from the regasification process, as presented in Table 9.
The simulation results from HYSYS V11.0 show that the values of the exergy pre- and post-LNG cold energy utilisation for a data centre are 266.24, 161.94 and 42.45 kWh t−1 of LNG, respectively. The benefit of LNG cold energy utilisation as evaluated by the “exergy efficiency” is ~43.38% and LNG cold energy utilisation loss to environment is 56.62% compared with LNG cold energy utilisation for the Organic Rankine Cycle (ORC) power generator, air inlet of gas turbine generator cooling, replacement of air conditioning systems (HVAC) of all buildings and planting temperate plants such the “exergy efficiency”, which is only ~36.25% and LNG cold energy utilisation loss to the environment is 63.75%. This study can improve the “exergy efficiency” of the existing project by ~7.13%. Normally, for the conventional LNG receiving terminal with open rack vaporiser (ORV) regasification, LNG cold energy utilisation results in total loss to the environment, as presented in Figure 10.
According to the 21st World Gas Conference 2000 and World Gas Conference 2012, the “exergy efficiency” of the effectiveness of LNG cold utilisation for each of the alternative processes amounts to 33–38% for a cryogenic power generator with propane, 80% for a cryogenic power generator with a propane mixture refrigerant (Freon), 77% for a cryogenic power generator with NG direct expansion, 74% for an ethylene plant, 50–75% for the recovery of LNG boil-off gas (recondenser), 80% for air separation, 43–50% for liquefied CO2 and 36–54% for a cold warehouse [28,31]. In comparison, in this study, the LNG cold utilisation for a data centre is ~43.38%, as presented in Table 10.
The LNG receiving terminal combined with the data centre using an IFV will provide cold energy of 29.82 MW, equivalent to 8320 t of refrigeration per hour, which is sufficient for a large data centre containing 3519 racks of IT equipment. In a conventional data centre with the same amount of racks, it will require ~11,232 kWh of electricity, while the data centre with LNG cold energy utilisation will consume only 2323 kWh. Therefore, the total power saving potential is 8920 kWh.
On average, electricity in Thailand costs 0.125 USD kWh−1. Therefore, LNG cold energy utilisation has the potential to reduce the cooling operation costs of data centres by USD 9.87 million per annum. According to the Ministry Energy of Thailand in 2020, the sources of electricity are as follows: NG—57%, coal—17%, imports from neighbouring countries—12%, renewables—10%, hydro—3% and oil—1%. The CO2 emission intensity of the total electricity generation is 445 g CO2 e/kWh. In this study, the total power saving potential is 8920 kWh and the reduction in CO2 emissions is 34,772 t of CO2 per annum.
According to the economic feasibility and commercial study, this study suggests that the estimated investment costs for the LNG receiving terminal and digital companies are around USD 15 and 20 million per annum, as presented in Table 11. The revenue from the LNG cold energy utilisation for a data centre could give a payback period of 7 years, with an Internal Rate of Return (IRR) of 13% for the LNG receiving terminal, and a payback period of 2.21 years with an IRR of 45% for digital companies, as presented in Table 12.

5. Conclusions

An LNG receiving terminal combined with a data centre using an IFV, will provide cold energy of 29.82 MW, which is sufficient for cooling a data centre with a capacity of 3519 racks. This cold energy has the potential to reduce the cooling operation costs by over USD 9.87 million per annum for the data centre and also reduces the CO2 emissions by 34,772 t per annum. The benefits of studying LNG cold energy utilisation among LNG receiving terminals and data centres are as follows.
First, LNG cold energy utilisation from the regasification process can be used instead of a conventional cooling system to reduce the electrical costs in the cooling system of data centres by over 79.25%. Furthermore, it supports electricity generation, resulting in a decrease in fossil fuel usage. Therefore, it is advantageous as data centres can be operated efficiently and sufficiently in long-term conditions for at least 15 years.
Second, LNG cold energy utilisation can improve the power efficiency and competitiveness of data centres by significantly reducing the PUE of data centres from 2.00 to 1.36, which is close to the PUE of data centres in Ireland (~1.15–1.40). Cold utilisation for data centres has a free cooling period of 12 months per year from the regasification process.
Third, the quality of LNG cold energy utilisation can be evaluated by the “exergy efficiency”, which is ~43.38%. This result has an advantage in the competitiveness of the LNG industry in Thailand.
Fourth, the LNG cold energy utilisation can reduce the CO2 emissions from the electricity consumption of data centres and reduce the released waste cold energy from the regasification process to the ocean, which can promote sustainability and reduce the risks for the environment and society.
Fifth, the economic feasibility study and commercial study regarding the revenue from LNG cold energy utilisation for a data centre indicate a payback period of 7 years and IRR 13% for the LNG receiving terminal and a payback period of 2.21 years and IRR 45% for digital companies.
Finally, this research is for the first data centre in Thailand and the world that uses free cooling from LNG cold energy utilisation in the LNG receiving terminal.
This research can be expanded to cover the average and maximum send-out rate of PTTLNG at 5.0 and 11.5 MTPA, making LNG cold energy of 135 and 300 MW available for data centre capacities of 16,000 and 36,800 racks, and can also reduce CO2 emissions by 223,842 and 497,427 t of CO2 per annum, respectively.

Author Contributions

Conceptualization, M.S. and M.W.; methodology, M.S. and Y.S.; software, M.S.; validation, M.S., Y.S. and K.K.; formal analysis, Y.S.; investigation, M.W. and K.K; resources, M.W.; data curation, M.S.; writing—original draft preparation, M.S.; writing—review and editing, M.S. and Y.S.; visualization, M.W. and K.K.; supervision, M.W. and K.K.; project administration, M.W. and K.K.; funding acquisition, K.K. and Y.S. All authors have read and agreed to the published version of the manuscript.

Funding

This research was supported King Mongkut’s Institute of Technology Ladkrabang (KMITL) Grant no. 2564-02-01-068 and, King Mongkut’s University of Technology Thonburi (KMUTT).

Acknowledgments

This work represents collaborative research among King Mongkut’s Institute of Technology Ladkrabang (KMITL), King Mongkut’s University of Technology Thonburi (KMUTT), and PTTLNG Company Limited, Thailand.

Conflicts of Interest

The authors declare no conflict of interest.

References

  1. Yun, J.J.; Liu, Z.; Zhao, X. Introduction: Ambidextrous Open Innovation in the 4th Industrial Revolution. Science. Technol. Soc. 2021, 26, 183–200. [Google Scholar]
  2. Masanet, E.; Shehabi, A.; Lei, N.; Smith, S.; Koomey, J. Recalibrating global data center energy-use estimates. Science 2020, 367, 984–986. [Google Scholar] [CrossRef] [PubMed]
  3. Liu, Y.; Wei, X.; Xiao, J.; Liu, Z.; Xu, Y.; Tian, Y. Energy consumption and emission mitigation prediction based on data center traffic and PUE for global data centers. Glob. Energy Interconnect 2020, 3, 272–282. [Google Scholar] [CrossRef]
  4. Koot, M.; Wijnhoven, F. Usage impact on data center electricity needs: A system dynamic forecasting model. Appl. Energy 2021, 291, 116798. [Google Scholar] [CrossRef]
  5. Santin, M.; Chinese, D.; Saro, O.; Angelis, D.A.; Zugliano, A. Carbon and Water Footprint of Energy Saving Options for the Air Conditioning of Electric Cabins at Industrial Sites. Energies 2019, 12, 3627. [Google Scholar] [CrossRef] [Green Version]
  6. Ebrahimi, K.; Jones, G.F.; Fleischer, A.S. A review of data center cooling technology, operating conditions and the corresponding low-grade waste heat recovery opportunities. Renew. Sustain. Energy Rev. 2014, 31, 622–638. [Google Scholar] [CrossRef]
  7. Hassan, S.F.; Ali, M.; Perwez, U.; Sajid, A. Free cooling investigation of RCMS data center. Energy Proc. 2015, 75, 1249–1254. [Google Scholar] [CrossRef] [Green Version]
  8. Zhang, H.; Shao, S.Q.; Xu, H.B.; Zou, H.M.; Tian, C.Q. Free cooling of data centers: A review. Renew. Sustain. Energy Rev. 2014, 35, 171–182. [Google Scholar] [CrossRef]
  9. Avgerinou, M.; Bertoldi, P.; Castellazzi, L. Trends in Data Centre Energy Consumption under the European Code of Conduct for Data Centre Energy Efficiency. Energies 2017, 10, 1470. [Google Scholar] [CrossRef]
  10. Miller, R. Microsoft’s Chiller-Less Data Center. Data Center Knowledge. Available online: http://www.datacenterknowledge.com/archives/2009/09/24/microsofts-chiller-less-data-center (accessed on 24 September 2009).
  11. Miller, R. Google’s Chiller-Less Data Center. Data Center Knowledge. Available online: http://www.datacenterknowledge.com/archives/2009/07/15/googles-chiller-less-data-center (accessed on 15 July 2009).
  12. Daraghmeh, H.M.; Wang, C. A review of current status of free cooling in datacenters. Appl. Therm. Eng. 2017, 114, 1224–1239. [Google Scholar] [CrossRef]
  13. Dudley, B. BP Energy Outlook 2035; British Petroleum: London, UK, 2016. [Google Scholar]
  14. Davis, C. Baker Hughes Raises Global LNG Demand Forecast to 2030. Available online: https://www.naturalgasintel.com/baker-hughes-raises-global-lng-demand-forecast-to-2030/ (accessed on 21 April 2021).
  15. Khan, M.S.; Lee, M. Design optimization of single mixed refrigerant natural gas liquefaction process using the particle swarm paradigm with nonlinear constraints. Energy 2013, 49, 146–155. [Google Scholar] [CrossRef]
  16. Kumar, S.; Kwon, H.-T.; Choi, K.-H.; Lim, W.; Cho, J.H.; Tak, K.; Moon, I. LNG: An ecofriendly cryogenic fuel for sustainable development. Appl. Energy 2011, 88, 4264–4273. [Google Scholar] [CrossRef]
  17. Mokhatab, S.; Economides, M.J.; Wood, D.A. Natural gas and LNG trade—A global perspective. Hydrocarb. Process. 2006, 85, 39. [Google Scholar]
  18. Agarwal, R.; Rainey, T.J.; Rahman, S.M.A.; Steinberg, T.; Perrons, R.K.; Brown, R.J. LNG Regasification Terminals: The Role of Geography and Meteorology on Technology Choices. Energies 2017, 10, 2152. [Google Scholar] [CrossRef] [Green Version]
  19. Jin, T.; Wang, M.; Tang, K. Simulation and performance analysis of a heat transfer tube in SuperORV. Cryogenics 2014, 61, 127–132. [Google Scholar] [CrossRef]
  20. He, T.; Chong, Z.R.; Zheng, J.; Ju, Y.; Linga, P. LNG cold energy utilization: Prospects and challenges. Energy 2019, 170, 557–568. [Google Scholar] [CrossRef]
  21. Kang, J.M. 2019 World LNG Report; International Gas Union: Shanghai, China, 2019; pp. 5–7. [Google Scholar]
  22. Ayou, D.S.; Eveloy, V. Integration of Municipal Air-Conditioning, Power and Gas Supplies Using an LNG Cold Exergy-Assisted Kalina Cycle System. Energies 2020, 13, 4599. [Google Scholar] [CrossRef]
  23. Yang, Y.; Wang, B.; Zhou, Q. Air Conditioning System Design using Free Cooling Technology and Running Mode of a Data Center in Jinan. Procedia Eng. 2017, 205, 3545–3549. [Google Scholar] [CrossRef]
  24. Mugnini, A.; Coccia, G.; Polonara, F.; Arteconi, A. Potential of District Cooling Systems: A Case Study on Recovering Cold Energy from Liquefied Natural Gas Vaporization. Energies 2019, 12, 3027. [Google Scholar] [CrossRef] [Green Version]
  25. Majid, M.A.A.; Haji Ya, H.; Mamat, O.; Mahadzir, S. Techno Economic Evaluation of Cold Energy from Malaysian Liquefied Natural Gas Regasification Terminals. Energies 2019, 12, 4475. [Google Scholar] [CrossRef] [Green Version]
  26. Yao, S.; Shen, X.; Yang, Z.; Feng, G.; Xiao, M. Design and optimization of LNG vaporization cold energy comprehensive utilization system based on a novel intermediate fluid vaporizer. Appl. Therm. Eng. 2021, 190, 116785. [Google Scholar] [CrossRef]
  27. Han, H.; Wang, S.; Li, Y.-X. Thermal design optimization analysis of an intermediate fluid vaporizer for liquefied natural gas. Appl. Therm. Eng. 2018, 129, 329–337. [Google Scholar] [CrossRef]
  28. Yamamoto, T.; Fujiwara, Y. The Accomplishment of 100% utilization of LNG cold energy—Challenger in Osaka gas Senboku LNG receiving terminal. In Proceedings of the World Gas Conference, Kuala, Lumpur, 4–8 June 2012. [Google Scholar]
  29. Sadaghiani, M.S.; Mehrpooya, M. Introducing and energy analysis of a novel cryogenic hydrogen liquefaction process configuration. Int. J. Hydrog. Energy 2017, 42, 6033–6050. [Google Scholar] [CrossRef]
  30. Heating, Ventilating, and Air-Conditioning. In Applications. Ashrae Handbook; American Society of Heating Refrigerating and Air-Conditioning Engineers: Atlanta, GA, USA, 2015.
  31. Baudino, M. Report of Working Committee 3 “Liquefied Gases”. In Proceedings of the World Gas Conference, Nice, France, 6–9 June 2000. [Google Scholar]
Figure 1. Process flow diagram of conventional LNG regasification terminal: (a) The simulation of ORV, (b) Schematic configurations of ORV.
Energies 14 06269 g001
Figure 2. Energy balance of conventional LNG regasification terminal by ORV [25].
Energies 14 06269 g002
Figure 3. Schematic configurations of conventional cooling systems in data centres: (a) Typical refrigeration system in data centres, (b) Schematic configurations of conventional cooling systems.
Energies 14 06269 g003
Figure 4. Schematic of cold water production from IFV.
Energies 14 06269 g004
Figure 5. Process flow diagram of cold water production from an IFV.
Energies 14 06269 g005
Figure 6. Process flow diagram of LNG receiving terminal combined with a data centre using an IFV: (a) The simulation of data centre using an IFV, (b) Improved refrigeration system with LNG cold energy utilisation, (c) Schematic configurations of data centre using an IFV.
Energies 14 06269 g006
Figure 7. Concept of “exergy efficiency” [28].
Energies 14 06269 g007
Figure 8. Comparison between conventional cooling systems in data centres and LNG cold utilisation for data centre.
Energies 14 06269 g008
Figure 9. Total electric consumption of data centres.
Energies 14 06269 g009
Figure 10. Comparison of “exergy efficiency and loss” between LNG cold utilisation for data centre, LNG cold energy utilisation for the existing project and conventional LNG receiving terminal by the ORV.
Energies 14 06269 g010
Table 1. Basic calculation data.
LNG11.13 Bar
Pressure Temperature−160 °C
NG2
Pressure70 Bar
Temperature10 °C
Working Fluid
Pressure4 Bar
Temperature−6 °C
Composition100% Propane
Cooling Water
Pressure3.5 Bar
Temperature12 °C
Composition100% Water
Condenser, Evaporator and Gas Heater
Tube Side Pressure Drop0.6 Bar
Shell Side Pressure Drop0.35 Bar
Minimum Temperature Approach (spec)2.5 °C
Table 2. The record data from existing intermediate fluid vaporiser (IFV) in LNG receiving terminal.
DayLNG Flowrate (m3/h)Water Flowrate (m3/h)Temperature NG Inlet °CTemperature NG Outlet °CTemperature
Water Inlet °C
Temperature
Water Outlet °C
Temperature
Approach °C
1176.411503.52−1.2714.1815.3514.611.16
2200.681501.85−4.7113.5615.0414.101.48
3194.271517.52−4.6612.8314.2313.361.40
4179.261515.57−3.6512.1713.4012.641.22
5176.591610.05−2.9112.3113.5012.821.20
6182.281613.62−3.3812.4213.6812.961.26
7182.181620.58−3.6712.0813.3212.611.24
8175.901319.87−1.8112.9714.1613.401.20
9180.291321.92−2.0813.1214.3613.551.24
10183.731326.59−2.3713.1914.4813.641.29
11184.361326.24−2.4813.1714.4513.621.29
12184.181325.82−2.5513.1614.4413.601.28
13181.221329.11−2.6013.1214.3713.551.25
14176.811318.10−2.4113.0614.2813.481.22
15174.161310.54−2.2313.1214.3213.541.20
Table 3. Comparison between the simulation intermediate fluid vaporiser (IFV) on HYSYS V11.0 and existing intermediate fluid vaporiser (IFV) in LNG receiving terminal.
StreamTemperature (°C)%Error
HYSYSExisting
LNG Inlet Condenser−147.6−147.570.02%
NG Outlet Condenser−2.08−2.10.95%
NG Outlet Heater13.513.50.00%
Water Inlet Heater14.0914.090.00%
NG Outlet Heater13.6613.51.19%
NG Outlet Evaporator5.152.00%
Table 4. Heat duty of intermediate fluid vaporiser (IFV) and data centre.
Heat ExchangerHeat Duty (MW)
Evaporator21.10
Gas heater8.68
Data centre29.82
Table 5. Comparison the heat duty of the data centre and data centre containers for different target pressures of natural gas depending on the application.
ApplicationPressure (Bar)Heat Duty (MW)Heat Duty (t of Refrigeration)Data Centre Containers
(Number of Server Racks)
Steam power stations634.1597574127
Combined cycle stations2532.9294053978
Local distribution3032.5993113938
Long-distance distribution7029.8283203519
Direct expansion cycle10027.7779343356
Table 6. Comparison of the simulation on HYSYS V11.0 between conventional LNG receiving terminal and LNG receiving terminal combined with data centre using intermediate fluid vaporiser (IFV).
ModelSimulationORV (MW)Propane
Condenser (MW)
Propane
Evaporator (MW)
NG Heater (MW)Data Centre (MW)
1The conventional LNG receiving terminal33.23----
2Data centre cooling with intermediate fluid vaporiser (IFV)-21.1021.108.6829.82
Table 7. Total cold energy consumption for data centre with 1000 racks [30].
Heat LoadMWTons of Refrigeration per Hour
IT equipment51428.57
UPS0.80228.57
Power distribution0.3085.71
Lighting0.3497.14
People0.1851.43
Architecture area1.65472.86
Total heat load8.272364.29
Table 8. Comparison of electric consumption to produce cold energy equal to 1 ton of refrigeration between conventional cooling system and LNG cold utilisation.
Electric ConsumptionConventional Cooling SystemLNG Cold Utilisation
Water-Cooled Chiller (kWh)0.75-
Chilled Water Pump (kWh)0.130.13
Condenser Pump (kWh)0.17-
Cooling Tower (kWh)0.15-
CRAC (kWh)0.150.15
Total Electricity Consumption (kWh)1.350.28
Reduction in Electrical Cost (%)-79.25
Table 9. Comparison of electricity consumption and power usage effectiveness (PUE) of global, Ireland and LNG cold utilisation data centres.
Electric ConsumptionGlobal Data CentresIreland Data CentresLNG Cold Utilisation
Data Centres
IT Load (MWh)5.005.005.00
Electrical Equipment, Lighting and Other (MWh)1.001.001.00
Cooling System (MWh)4.000.50–1.000.83
Total Electricity
Consumption (MWh)
10.006.50–7.006.83
PUE2.001.15–1.401.36
Free Cooling Period 6–8 months/year12 months/year
Table 10. Comparison of LNG cold utilisation for each of the alternative processes and LNG cold utilisation for data centre [28,31].
ResearchLNG Cold Utilisation Each of the Alternative ProcessExergy Efficiency (%)
Baudino, M. [31]Cryogenic power generator with propane33–38
Baudino, M. [31]Cryogenic power generator with propane mixture refrigerant (Freon)80
Baudino, M. [31]Cryogenic power generator with NG direct expansion77
Yamamoto, T. [28]Ethylene plant74
Baudino, M. [31]Recovery of LNG boil-off gas (Recondenser)50–75
Baudino, M. [31]Air separation80
Yamamoto, T. [28]Liquefied carbon dioxide43–50
Baudino, M. [31]Cold warehouse36–54
LNG cold utilisation for data centre43
Table 11. The estimated investment cost for LNG receiving terminal and digital companies.
InvestorDetailsUnitsCosts (Million USD)
LNG receiving terminal
  • Intermediate fluid vaporiser (IFV)
1 ea.3.5
2.
Cold water pump
1 ea.1.0
3.
Cold water and hot water Pipeline
1400 m3.5
4.
Installation
7.0
Digital companies
  • Data centres in Tier 4
4000 racks200.0
2.
Estate
61,200 sq.m.13.0
3.
Energy storage tank
1 ea.3.35
4.
Hot water tank
1 ea.1.0
5.
Hot water pump
1 ea.1.0
6.
Installation
1.65
Table 12. Economic summary of payback and IRR for LNG cold energy utilisation for data centres.
InvestorCost Saving (Million USD)Payback (Year)IRR (%)
LNG receiving terminal1.97.013.0
Digital companies8.02.245.0
Publisher’s Note: MDPI stays neutral with regard to jurisdictional claims in published maps and institutional affiliations.

