Review

Comparative Life Cycle Assessment of Merging Recycling Methods for Spent Lithium Ion Batteries

1
Key Laboratory of Low-Grade Energy Utilization Technologies and Systems, Chongqing University, Ministry of Education, Chongqing 400044, China
2
Institute of Engineering Thermophysics, Chongqing University, Chongqing 400044, China
*
Author to whom correspondence should be addressed.
Energies 2021, 14(19), 6263; https://doi.org/10.3390/en14196263
Submission received: 2 September 2021 / Revised: 22 September 2021 / Accepted: 28 September 2021 / Published: 1 October 2021
(This article belongs to the Topic Sustainable Energy Technology)

Abstract

:
An urgent demand for recycling spent lithium-ion batteries (LIBs) is expected in the forthcoming years due to the rapid growth of electrical vehicles (EV). To address these issues, various technologies such as the pyrometallurgical and hydrometallurgical method, as well as the newly developed in-situ roasting reduction (in-situ RR) method were proposed in recent studies. This article firstly provides a brief review on these emerging approaches. Based on the overview, a life cycle impact of these methods for recovering major component from one functional unit (FU) of 1 t spent EV LIBs was estimated. Our results showed that in-situ RR exhibited the lowest energy consumption and greenhouse gas (GHG) emissions of 4833 MJ FU−1 and 1525 kg CO2-eq FU−1, respectively, which only accounts for ~23% and ~64% of those for the hydrometallurgical method with citric acid leaching. The H2O2 production in the regeneration phase mainly contributed the overall impact for in-situ RR. The transportation distance for spent EV LIBs created a great hurdle to the reduction of the life cycle impact if the feedstock was transported by a 3.5–7.5 t lorry. We therefore suggest further optimization of the spatial distribution of the recycling facilities and reduction in the utilization of chemicals.

1. Introduction

The utilization of lithium-ion batteries (LIBs) has increased dramatically due to the accelerated adaptation of electric vehicles (EVs) and portable electronics. It is predicted that 11 million tons of spent LIBs will be produced worldwide by 2030 [1]. However, to satisfy the operation safety requirement and to ensure the road haul of EV, the LIBs need to be replaced once their capacity decays to below 80% [2]. Consequently, there is an increasing demand for the disposal of spent LIBs in the forthcoming years. However, only less than 5% of spent LIBs are recycled currently [1]. Direct disposal of spent LIBs leads to serious release of toxins such as heavy metals and organic chemicals [1]. On the other hand, valuable metals (e.g., Ni, Co, Li) present in the spent LIBs are at very high levels, even higher than those found in natural ores. Therefore, the recycling of major components from spent LIBs is regarded as an extremely important way to prevent environmental pollution and to meet the requirement of sustainable utilization of valuable metals.
To address the issue of recycling spent LIBs, pyrometallurgical or hydrometallurgical approach, which derived from cobalt or nickel extraction metallurgy have been adopted by many companies. Specifically, pyrometallurgical methods like the Umicore, Inmetco, Accurec, and Glencore processes have been commercialized at an industrial scale [3,4,5,6,7], but the high energy requirement and hazardous gas emissions are the main drawbacks of these technologies. As for hydrometallurgical methods such as GEM High-Tech, Brunp, Retriev, and Recupyl processes [3,4,5,6,7], large amount of leachants are required to ensure a high leaching efficiency, posing a key challenge for waste water treatment and waste acid recovery [6]. To solve these problems, many novel methods, such as ultra-high temperature (UHT) method [3], hydrometallurgical methods with organic or inorganic acid leaching [8,9,10,11,12,13,14], and in-situ reduction roasting (in-situ RR) method [15,16,17,18,19,20,21,22,23,24] has been developed [25]. However, most of the studies are dedicated to developing processing method and/or optimizing operational conditions at bench scale, but the scaled-up industrial application is still absent. Although some excellent reviews [5,26,27,28] provided insightful suggestions and development orientation on recycling spent LIBs, a systematic quantitative estimation of these emerging methods in industrial application was still lacking, causing a huge gap between academic research and commercialization.
Life cycle assessment (LCA) is a “cradle to grave” approach to evaluate the life cycle impacts generated during the entire life cycle of products, processes and systems. It also helps the decision maker to find out the optimal design and the critical step required for improvements [29]. Although valuable insights have been gained by the LCA study of the recycling processes like Umicore, BIT, Toxco and EcoBat processes in previous studies [30,31,32,33,34,35], the energy consumption and the environmental burden of the emerging methods in an industrial scale was still unknown. Therefore, a systematical and comprehensive evaluation on these methods is needed for the development and application of LIB recycling technology and lowering the risk of commercial failures.
In this work, the emerging methods for LIB recovery, namely UHT, hydrometallurgical methods with organic or inorganic acid leaching, and in-situ RR method were briefly reviewed. Then, an industrial-scaled spent LIB recycling system based on these processes was proposed. The life-cycle impacts (i.e., energy and material consumption and greenhouse gas (GHG) emissions) of these methods were quantified by the process-based LCA approach. Additionally, the sensitivity analysis of each method was evaluated based on the uncertainties caused by changing the key parameters. The reasonable opportunities for reducing the life cycle impacts were also analyzed in this paper. To our best knowledge, this paper is the first comparative study of these methods by LCA approach and may provide direction guidance for the industrial application of spent LIB recycling technology in the future.

2. Description of the Merging Recycling Methods for LIBs

To establish a basis for the modeling of spent LIB recycling systems for LCA, the three merging recycling methods proposed in previous studies were provided in this section [7,8,9,10,11,12,13,14,15,16,17,18,19,20,21,22,23,24].

2.1. UHT Method

Traditional pyrometallurgical method usually involve UHT smelting and purification steps [6,27]. During these steps, spent LIBs was usually smelted with other types of batteries (e.g., NiMH), or ores and industrial wastes. In some cases (e.g., Umicore), batteries are directly smelted with process slag in the furnace at a temperature above 1450 °C to optimize valuable metal recovery efficiencies. The main products of UHT smelting is Co or Ni-based alloys. Then, the alloys undergo a series of hydrometallurgical processes (i.e., leaching and solvent extraction) to obtain purified products.
Recently, a LIB-dedicated UHT method with a component recovery efficiency of ca. 50% was developed based on the traditional pyrometallurgical method [3]. Figure 1 depicts the LIB dedicated UHT process according to refs. [3,36,37]. In this scale-up process, an electric arc furnace is replaced by a shaft furnace to avoid the agglomeration of the electrode materials and the excess graphite in the electrodes is used as fuel. Prior to the smelting step, spent LIB cells undergo a serials of pretreatment steps, (i.e., discharging, crushing, and material separating) to obtain the Cu, Fe, and Al metal scraps, plastic, and a mixture of anode and cathode electrode materials. Then, along with process slag (e.g., limestone sand and slag), the mixture are fed into the UHT furnace where the Co compounds are converted to Co alloy, a majority of Li enters into flue dust, and Al and Mn go into the slag. The smelted products then undergo a series hydrometallurgical processes to regenerate LiCoO2 (LCO). Li in the dust is then extracted by sequential leaching and chemical precipitation steps to obtain Li2CO3. And the alloy is firstly leached by H2SO4 at 55–85 °C [38,39], and then is oxidized to Co3O4 by H2O2 at room temperatures [3,36]. Finally, the recovered Li2CO3 and Co3O4 are sintered to regenerate LCO. During the regeneration step, additional virgin Li2CO3 are usually needed to compensate the considerable Li loss in flue dust.
In general, the LIB dedicated UHT method offers a number of attractive advantages compared to the traditional pyrometallurgical one such as a higher productivity, a substantial improvement in component recovery efficiency, and a marketable or directly utilizable products for LIBs [3]. However, the UHT method also has distinct disadvantages of high energy consumption, hazardous gas emission, need of adding additional Li sources, and its economic feasibility being highly dependent on the content of valuable metals in LIBs.

2.2. Hydrometallurgical Method

The hydrometallurgical method typically includes a leaching step that dissolves the metallic components in spent LIBs, and the subsequent purification, separation and recovery process [8,9,10,11,12,13,14]. To ensure a high recovery efficiency, strong acids, such as H2SO4, HCl, HNO3, were usually adopted at an excess dosage [26], but these chemicals also lead to an extra environmental burden. To alleviate this issue, organic acids like citric, oxalic, and malic acids with a high biodegradability and strong acidity were proposed as the leachant in recent studies [26]. After the sequential purification, separation and regeneration steps, the dissolved metallic ions can be recovered in different forms (e.g., Co, Li salts, or metal oxides) [6,27].
Figure 2 illustrates a typical hydrometallurgical process modified from refs. [8,9,10,11,12,13,14,40,41,42]. To reduce the leachant dosage, pretreatment process is needed to separate the anode and cathode materials so that the cathode active materials can be leached individually. Then, the valuable metals in the powdery mixture of electrode materials are leached by inorganic or organic acid with the help of reducing agents (such as H2O2, glucose) at elevated temperatures of 40–90 °C to enhance the leaching efficiency. Then, the residue (mainly graphite) is filtered, and the metal ions in the solution were precipitated as CoCO3 and Li2CO3, which was solid-state sintered to regenerate LCO.
Compared with the LIB-dedicated UHT method, the hydrometallurgical method has many advantages, including higher purity products (95.9~99.9%), a higher leaching efficiency (90~100%), and a lower operation temperature (40~95 °C) [28]. However, the disadvantages of the hydrometallurgical method is also obvious, such as the need for manual sorting, complex operation steps for purification and separation, and serious environmental issues caused by the harmful waste acids [26,27,28].

2.3. In-Situ RR Method

In-situ RR method was firstly proposed by Xu et al. in 2016 [16]. Similar to the methods mentioned above, the spent LIBs are pretreated to obtain the powdery mixture of the electrode materials. Then the mixture was roasted at a mild temperature lower than 1000 °C under oxygen-free conditions. In in-situ RR process, the cathode materials are converted to Li2CO3, metal and metal oxide by carbothermal reduction. Then Li2CO3 is recovered from the roasted products by water [16] or carbonated water leaching [38,39], while the magnetic products (i.e., Co or Ni metal) can be recovered by magnetic separation.
Figure 3 illustrates a typical in-situ RR process. Like the UHT and hydrometallurgical method, the spent LIBs are pretreated to obtain the powdery mixture of the electrode materials for further processing. Then, the mixture of the electrode active materials was subjected to reduction roasting in an electrical furnace. Subsequently, Li2CO3 in the roasted products are separated by carbonated water leaching [38,39]. Like in the UHT method, Co metal in the residue is then magnetically separated and leached with H2SO4 to produce CoSO4. In a following step, it is oxidized by H2O2 to produce Co3O4 [38]. Finally, the recovered Li2CO3 and Co3O4 are solid-state sintered to regenerate LCO.
This method has the advantages of: (1) a lower processing temperature (≤1000 °C) that is lower than the boiling point of the transition metals, (2) no need of extra reductants, and (3) a much simplified separation processes for the roasted products. However, the emission of hazardous gases during roasting process is obvious [26].

3. Materials and Methods

3.1. Goal and Scope Definition

The system boundary of this study is shown in Figure 4. In this system, we defined 4 phases: collection and transportation of spent LIB packs (LIBPs), pretreatment of spent LIBPs, pyrometallurgical or hydrometallurgical conversion, and regeneration phases. The functional unit (FU) was 1 t spent EOL (end-of-life) EV LIBPs. In the collection and transportation phase, we a transportation distance of 500 km by a lorry of the size class >32 t gross vehicle weight and Euro III emissions class was taken as the base case. To provide a more precise estimation on the effect of transportation on the spent LIB recovery in China, the supply chain of spent LIBs was also established based on a network dataset was created in Excel. The collection points of the spent LIBPs was assumed to be the EOL vehicle dismantling plants according to the measures on Management of EOL Vehicle Recycling. Data on the location of 769 listed EOL vehicle disassembly plants and 26 listed domestic LIB treatment facilities in China were sourced from the website of Ministry of Commerce of the People’s Republic of China and Minstry of Industry and Information Technology of the People’s Republic of China [32,43,44]. The transportation distance from the EOL vehicle disassembly plant to the closest LIB treatment facilities was estimated by using Baidu Map software. The LIBPs was assumed to be transported by 3.5–7.5 t lorry due to the lorry restriction rule in the urban area of most Chinese cities. The energy consumption for transportation ( E t , MJ FU−1) could be obtained according to Equation (1):
E t = E t ¯ × L
where E t ¯ is the energy consumption of transportation per kilometer (MJ-eq (t·km)−1), L is transport mileage (km). The energy consumption with different types of lorry were listed in Table S1.
The spent LIBs were transported by road, and the distance from the collection site to the recycling plant was 500 km, and the energy consumption of the lorry was 1.56 MJ (t·km)−1 (lorry > 32 t, Ecoinvent v3.5 (Sphera, Hauptstrasse, Germany)). As shown in Figure S1, when one FU of spent LIBPs was inputted in the system, the total energy consumption for the collection and transportation phase was 781 MJ. But in the case that the LIBPs was transported by 3.5–7.5 t lorry, a transportation distance of 500 km was resulted in an energy consumption of 4120 MJ due to the much higher E t ¯ value of a 3.5–7.5 t lorry.
In the pretreatment phase, the spent LIBPs underwent a series of pretreatment to separate the components for further processing. In the conversion phase, the mixture of the electrode materials was processed by pyrometallurgical or hydrometallurgical method. To investigate the effect of leachants on the life-cycle impacts, LIB recycling systems using the hydrometallurgical method with two typical types of leachants (sulfuric acid (HM-SA) and citric acid (HM-CA)) were compared. To study the role of roasting condition on the life-cycle impact of the in-situ RR method, the LIB recycling systems in which the electrode materials were roasted under N2 atmosphere (RR-N2) and vaccine conditions (RR-Vac) were also established. In regeneration phase, valuable materials recovered in the previous phases were heat-treated to regenerate LCO.
Although many types of cathode materials (such as nickel cobalt manganese oxide, lithium manganate, and LCO) has been used in commercialized LIBs, LCO is still the mainstream of cathode materials in spent LIBs due to its excellent performances and prolonged usage [45] Therefore, LIBs with LCO were used in this study. It should be mentioned that although EV LIBPs (material inventories for EV LIBs and the carbon-containing components in lithium-ion battery cells listed in Tables S2 and S3)) were used as the analysis scenario, the recycling methods investigated in this study were also valid for other scenarios (such as portable electronics and energy storage system with different battery chemistries) except for a slight difference in the disassembling process.

3.2. Evaluation Methodology and Data Sources

This work was carried out using an OpenLCA software (GreenDelta, Berlin, Germany) based on the methods introduced by ISO 14041 and 14044 [26]. According to the regulations, four basic processes (i.e., goal and scope defined, inventory analysis, impact assessment, and result interpretation and recommendations) were involved in this study. The ReCiPe Midpoint (H) Method was adopted to evaluate the environmental impacts of different recycling methods based on the input/output of materials, energy and environmental emissions within the life cycle inventories. In this work, the data on the energy flow and material flow for different recycling methods were mainly derived from our experimental results, patents, academic literature, similar industrial processes, the Ecoinvent v3.5 database or theoretical calculations due to the limited industrial data arising from the immaturity of the methods investigated in this study. The process-level calculation included collection and transportation phase, pretreatment phase as well as conversion phase were exhibited in detail in Supplementary Files (Figures S1–S7).
The GHG emissions generated from the carbonaceous materials containing in spent LIBs were calculated based on the assumption that they were converted to CO2 during recycling. To achieve a reasonable comparison, it was also assumed that the carbonaceous residues of spent LIBs during hydrometallurgical conversion were converted into CO2 and accumulated in the total GHG emissions. For the in situ-RR method, the carbonaceous materials were completely converted to CO2, except for the fixed carbon in Li2CO3. The energy consumption and the related GHG emissions derived from the LIBP transportation and the production of chemicals used in LIB recycling processes also came from the same database and summarized in Tables S1 and S4, respectively. The GHG emissions generated by electricity production were also calculated based on the electricity grid structure of Guangdong, Shandong, and Sichuan province (data from Ecoinvent v3.5, Table S5). Unless mentioned, the material consumption in this study was calculated based on the theoretical stoichiometric data, and the loss of substances during the processing was not considered. The reagent consumptions during sulfuric acid and citric acid leaching were estimated based on the average laboratory data shown in Tables S6 and S7.

3.3. Life Cycle Impact Assessment

The life-cycle impacts were evaluated in terms of total energy consumption and GHG emissions. The primary contribution to the GHG emissions is associated with CO2, CH4 and N2O. The three GHG emissions are integrated into the CO2 equivalence (CO2-eq) of 1, 25, and 298, respectively, in accordance with a time horizon of 100 years [46].
The reduction rate of energy consumption ( ξ E , % ) and GHG emissions ( ξ G , %) of various methods were defined based on the following equations:
ξ E = E v E r E v
ξ G = G v G r G v
where E v is energy consumption for producing virgin materials (MJ FU−1), E r is energy consumption for recovering electrode materials from LIBPs (MJ FU−1), G v is GHG emissions for producing virgin materials (kg CO2-eq FU−1), and G r is GHG emissions for recovering electrode materials from LIBPs (kg CO2-eq FU−1).
To investigate the effect of the change in the recovery rate of Co and Li as well as the electricity structure on the energy consumption and GHG emissions of the system, sensitivity analysis were carried out according to the following equations:
E = E ° E i E °
G = G ° G i G °
where   E is the changes in energy consumption (MJ FU−1), E ° is the initial energy consumption (MJ FU−1), E i is the altered energy consumption (MJ FU−1), G is the changes in GHG emissions (kg CO2-eq FU−1), G ° is the initial GHG emissions (kg CO2-eq FU−1), and G i is the altered GHG emissions.

4. Results

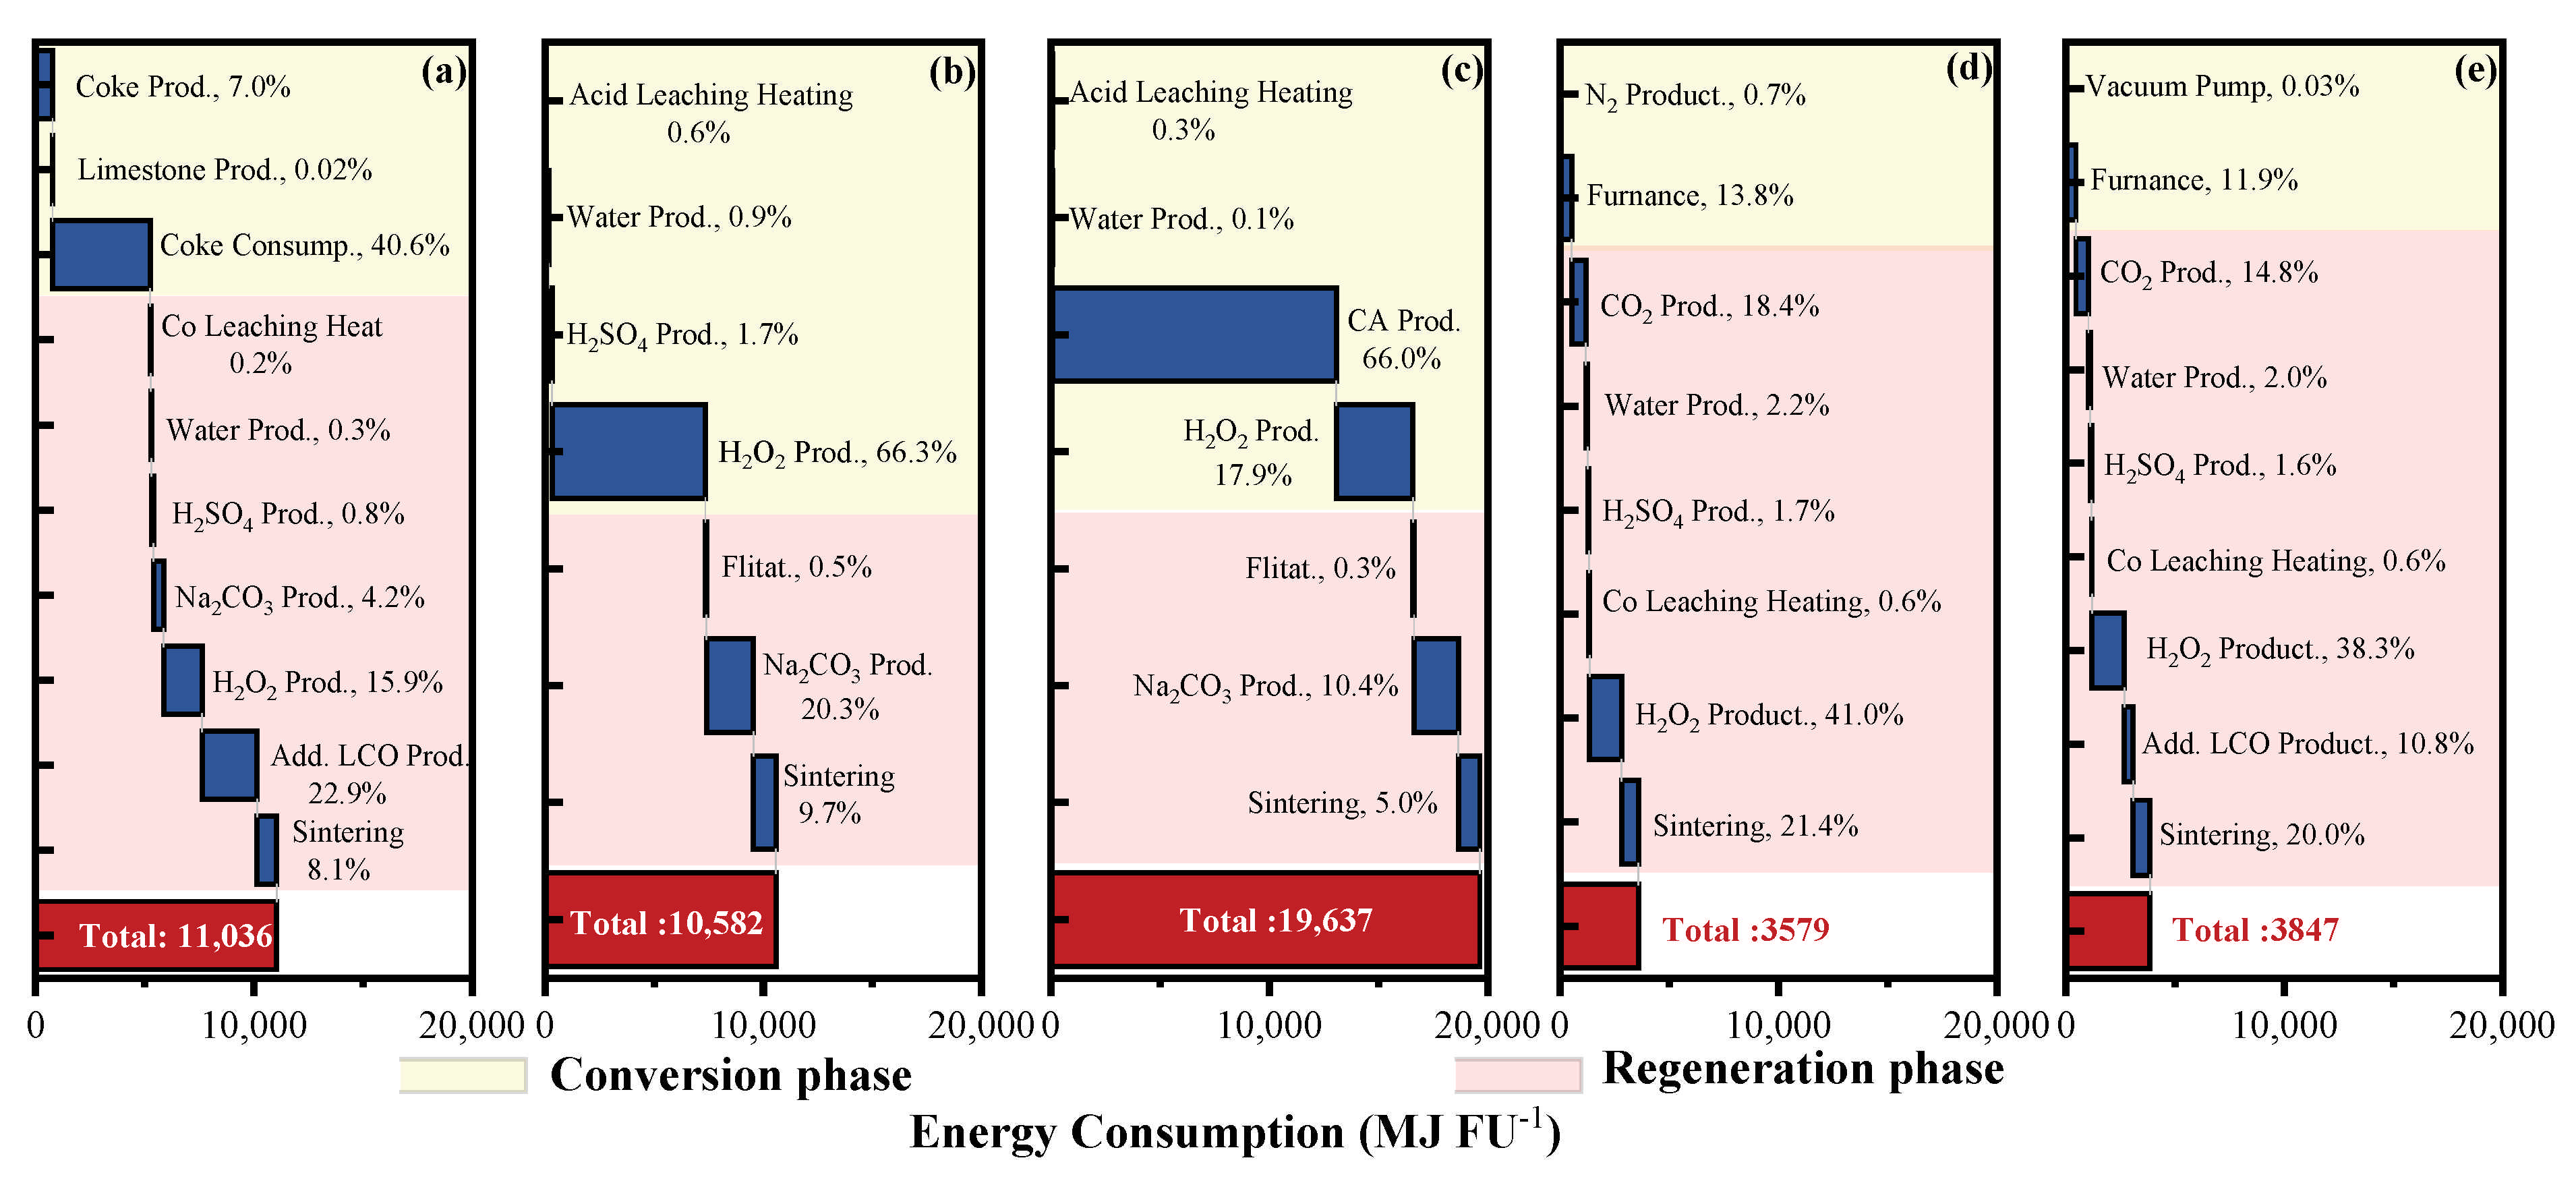
4.1. Energy Consumption Analysis

Our calculation (Figure 5, Figures S4–S7) shows that 284.2, 275.5, 261.0, 273.0, 274.3 kg LCO can be recovered from one FU by the UHT, HM-SA, HM-CA, RR-N2 and RR-Vac method, respectively. Figure 5 also shows that, if only LCO recovery was considered, the energy consumption of all recycling methods were significantly lower than that for producing an equivalent weight virgin LCO in industry (38,367~41,777 MJ [45]). Among the five methods, HM-CA was the most energy intensive method which had an energy consumption of 20,892 MJ FU−1 during the whole process, while RR-N2 consumed the least amount of energy (4833 MJ FU−1). The ξ E value for UHT, HM-SA, HM-CA, RR-N2 and RR-Vac was 71%, 71%, 46%, 88% and 87%, respectively. All methods exhibited the same energy consumption for the collection & transportation and pretreatment phase of 781 and 474 MJ FU−1, respectively, accounting to only a small faction (6% (HM-CA)~26% (RR-N2) of the total energy consumed. From Figure 5, it is clear that the main contributor of the total energy consumption for each method was different. For the UHT method, the conversion and regeneration phases were mainly responsible to the total energy consumption, and the energy consumption of these two phases was rather similar. For the hydrometallurgical methods (HM-SA and HM-CA), the major part of the total energy consumption was the conversion phase, while the regeneration phase was identified as the main contributor for the total energy consumption in the case of in-situ RR methods (RR-N2 and RR-Vac) due to the much low processing temperature (800~850 °C).
A detailed analysis of the energy consumption in the conversion and regeneration phase for the five different recycling methods are displayed in Figure 6.
The total energy consumption of HM-CA in the conversion and regeneration phase is 19,637 MJ FU−1, which was more than five times higher than that of the in-situ RR methods and about 1.7 times higher than that of UHT. The upstream production of citric acid and H2O2 are the main contributor of the total energy consumption for the conversion and regeneration phase of HM-CA, accounting for 66.0% and 17.9% of the energy consumption of these phases, respectively (Figure 6c). UHT (11,036 MJ FU−1) consumed a slightly higher energy as compared to HM-SA (10,582 MJ t−1 FU) in these phases. The coke consumption and H2O2 production in the conversion phase is the main contributors of the UHT and HM-SA methods, accounting for 40.6% and 66.3% of the total energy consumption, respectively (Figure 6a,b). From Figure 6, it is also derived that although the energy consumption composition of the regeneration phase for various methods were different, the energy consumption of HM-SA, HM-CA, RR-N2 and RR-Vac is rather close, ranging from 3059 MJ FU−1 for RR-N2 to 3390 MJ FU−1 for RR-Vac, UHT method possess the highest energy consumption (5780 MJ FU−1) in the regeneration phase as compared with other methods because of the extra energy consumption in the production of virgin Li2CO3 for the compensation of the significant Li loss in the conversion phase (Figure 6a).

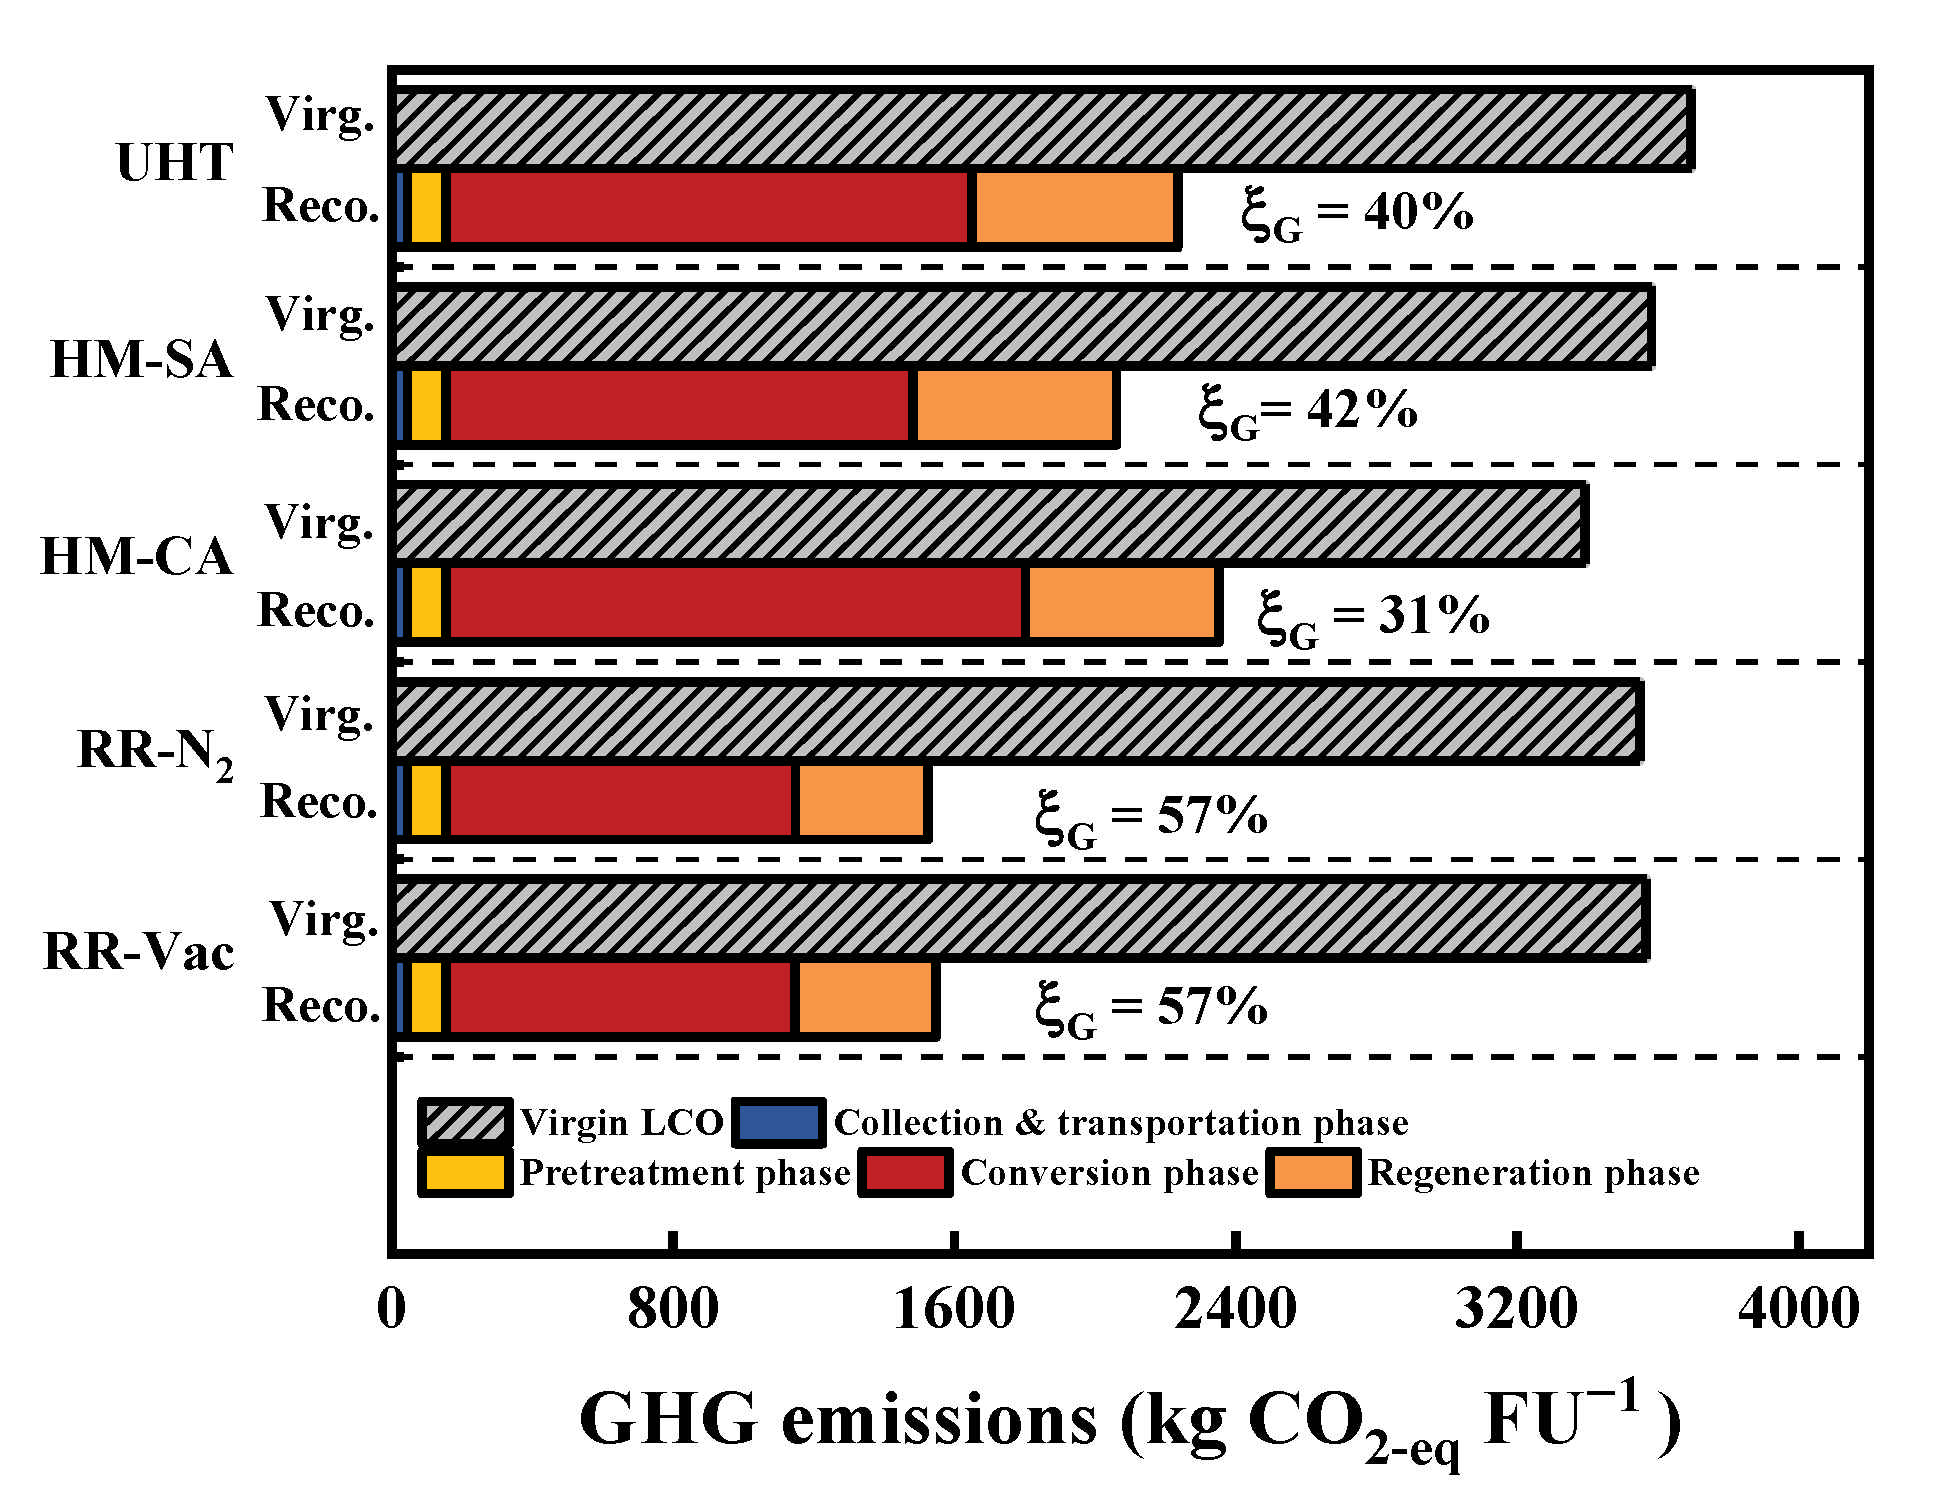
4.2. GHG Emission Analysis

From Figure 7, it is clear that the reduction in the GHG emission of different recycling methods for recovering an equivalent weight LCO from one FU is evident compared to virgin LCO production. The ξ G values for UHT, HM-SA, HM-CA, RR-N2 and RR-Vac were 40%, 42%, 31%, 57%, and 57%, respectively. RR- N2 and RR-Vac has a lowest total GHG emissions of 1525 kg CO2-eq FU−1, while the HM-CA method exhibited the highest amount of GHGs (2351 kg CO2-eq FU−1) among the five methods. Consistent with the energy consumption data (Figure 6), the GHG emissions of both collection and transportation and pretreatment phase were the same and only contribute to a small fraction of the total GHG emissions, ranging from 7% (HM-CA) to 10% (RR-N2). Figure 7 demonstrates that the conversion phase dominated the GHG emissions during the recycling processes. The proportion of conversion phase in the total GHG emission for UHT, HM-SA, HM-CA, RR-N2 and RR-Vac are 66%, 64%, 70%, 65%, and 64%, respectively. A detailed analysis of the GHG emissions in this phase (Figure 8) shows that they were mainly caused by the conversion of carbonaceous components in spent LIB cells, which were 45.2%, 49.3%, 42.8%, 64.0%, and 63.6%, for UHT, HM-SA, HM-CA, RR-N2, and RR-Vac, respectively. The GHG emission from the regeneration phase of UHT, HM-SA, HM-CA, RR-N2 and RR-Vac were 584, 580, 550, 377, and 400 kg CO2-eq FU−1, respectively, indicating that it was also an important contributor to the total GHG emissions. The GHG emissions of this phase were mainly derived from the electricity consumption for sintering, chemical production and the decomposition of Li2CO3.

4.3. Benefits of Resource Recovering

When the recovering of Cu and Al were considered, the energy consumption and GHG emissions of Cu and Al recovering processes were calculated based on the similar process flows in Ecoinvent v3.5 and a Chinese case [47] (relevant data shown in Table S4) by assuming a recovery rate of 85%. The production of virgin Cu and Al with raw materials was also estimated based on the same data sources. The energy and environmental benefits of recovering Cu, Al together with LCO were quantified by ξ E and ξ G (Figure 9). It can be seen that when Cu, Al and LCO are recovered, ξ E can reach 68% (HM-CA)~88% (RR-N2/Vac) and   ξ G increased to 59% (HM-CA)~72% (RR-N2/Vac). As shown in Figure 9a,b, although Cu and Al recovery has a different impact on the ξ E and   ξ G values of the methods, RR-N2 and RR-Vac still exhibited the higher reduction in energy consumption and GHG emissions as compared with UHT, HM-SA, and HM-CA. These results suggest that in-situ RR method (RR-N2 and RR-Vac) is more suitable for recycling spent LIBs than the UHT and hydrometallurgical methods (HM-CA and HM-SA).

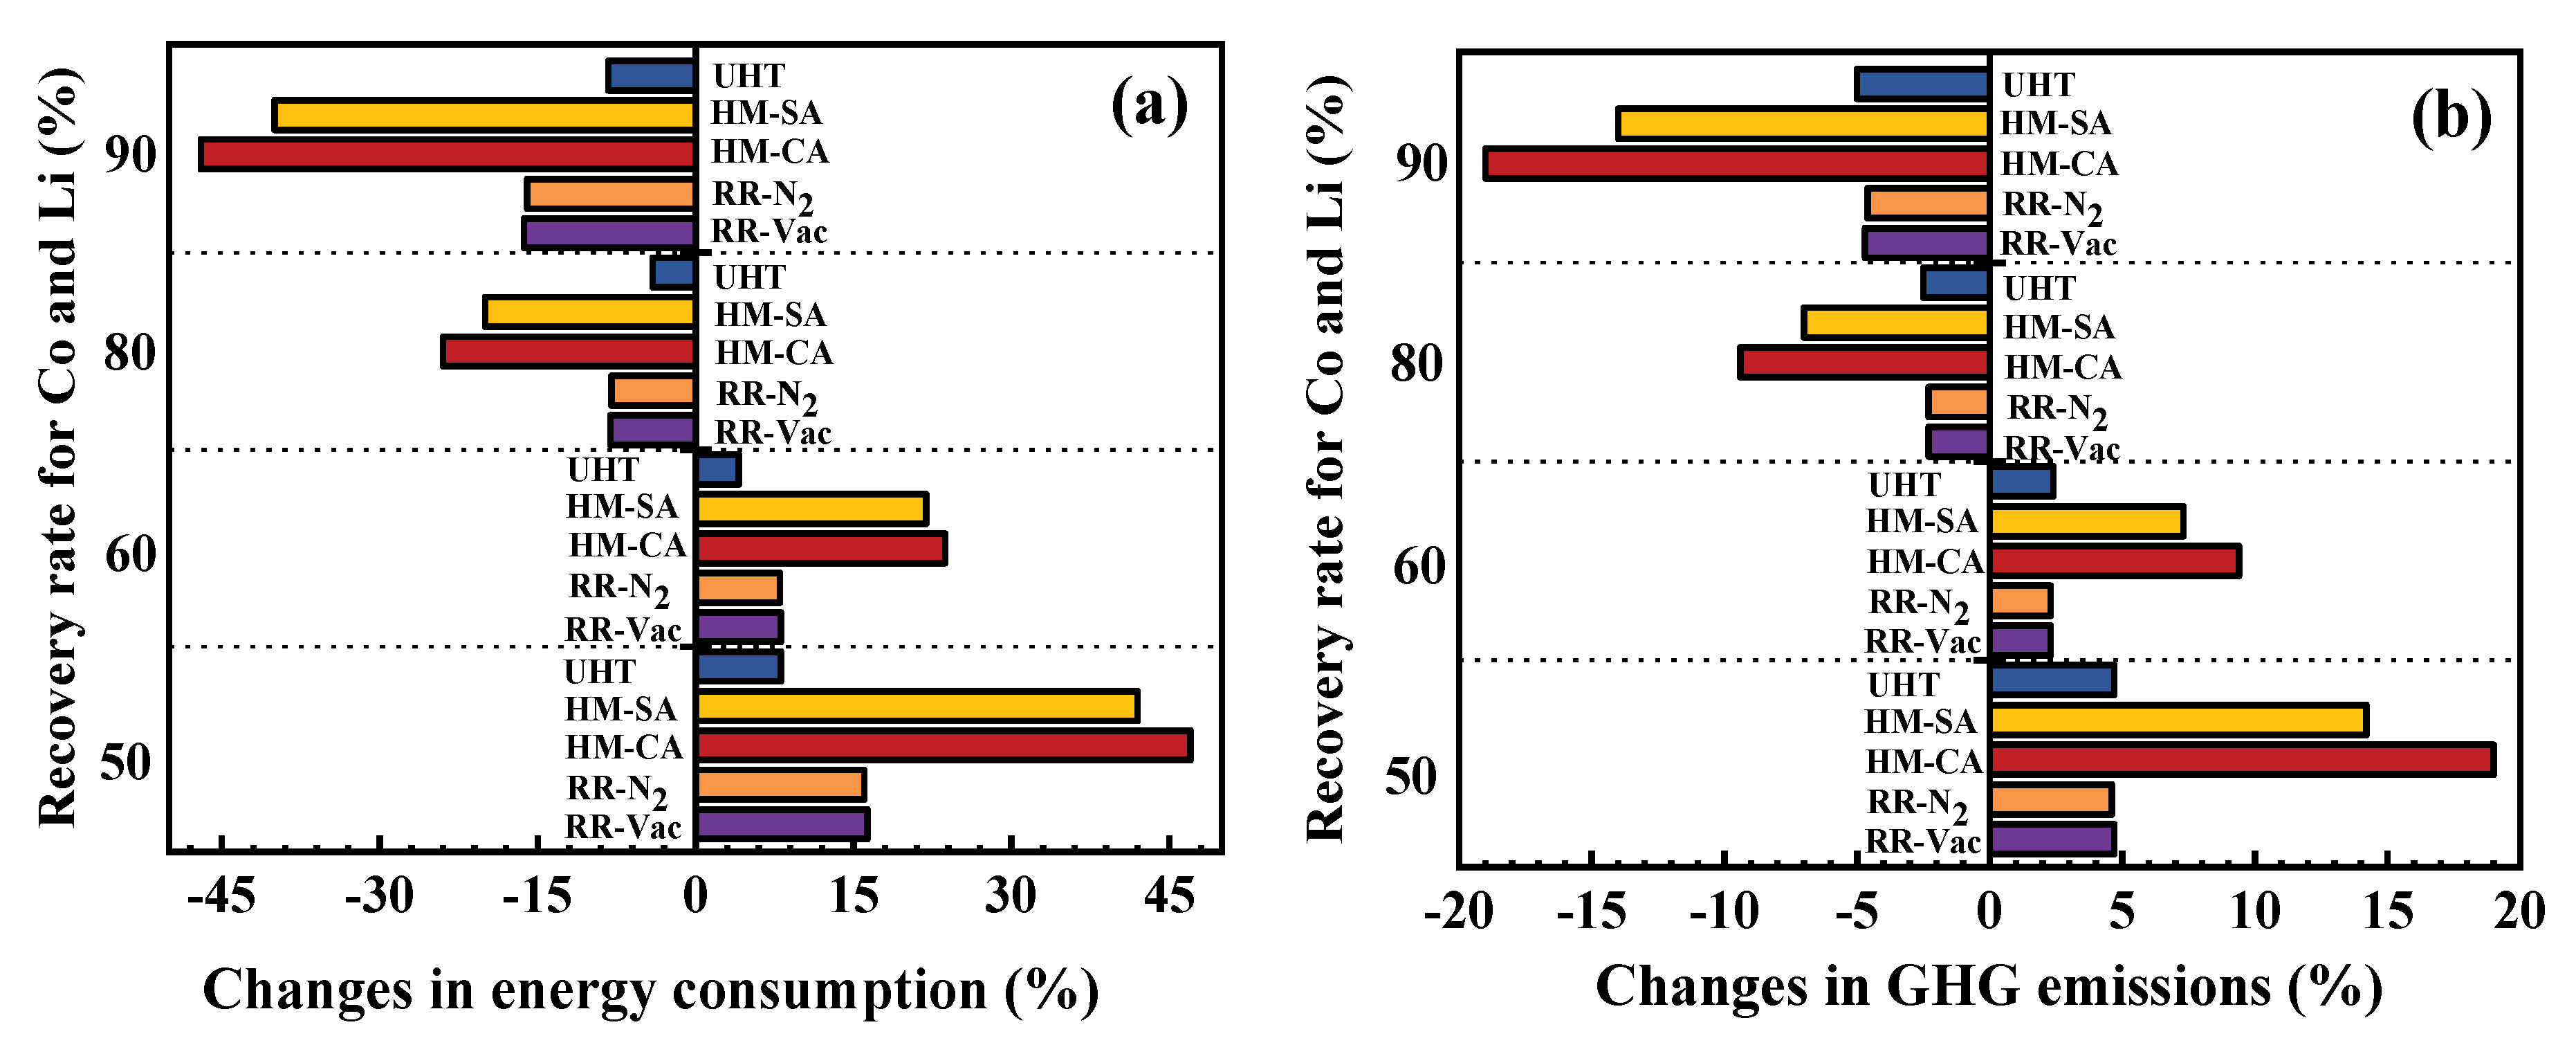
4.4. Sensitivity Analysis

Since the industrial application of the methods evaluated in this study is still in infancy, its energy consumption and GHG emission faces significant uncertainties. Therefore, a sensitivity analysis (Figure 10 and Figure 11) is carried out to assess the impact of the key parameters on the evaluation results. It is seen from Figure 10 that both energy consumption and GHG emissions of the methods were sensitive to the recovery rate of Li and Co. However, changes in the recovery rate of Li and Co have a diverse impact on different methods. For instance, when a recovery rate of 70% was taken as the benchmark, changing the recovery rate of Li and Co from 50% to 90% had a substantial impact on the energy consumption of the HM-CA and HM-SA (from 45% to −44%), whereas this parameter only causes a variation of 8% to −8% in the energy consumption of UHT. Changing this parameter had a similar influence on the GHG emissions of the methods. That is, the influence degree of HM-CA and HM-SA (19%~−19% and 16%~−16%, respectively) was significantly higher than that of the rest methods (from 5% to −5%).
Figure 11 shows the sensitivity analysis of the GHG emissions in different recycling methods when using different electricity structures.
It can be seen from Figure 11 that when the electricity structure was changed from a hydropower-dominated grid (Sichuan electricity grid mixes) to a coal-dominated one (Shandong electricity grid mixes), the GHG emissions of in-situ RR method showed the most obvious impact of −10% to 18%. By contract, HM-CA exhibits the least change in GHG emissions of only −2% to 4%. These results are understandable because in the case of RR-N2 and RR-Vac, the electricity consumption accounts for a considerable large proportion of the total energy consumption (Figure 6), while the electricity consumption for HM-CA was the least within our system boundary.

5. Discussion

5.1. Collection and Transport Phase

As shown in Figure 5 and Figure 7, the proportion of the energy consumption and GHG emissions for the collection and transport phase only accounts for 4~16% and 2~3% of the total energy consumption and GHG emissions for different recycling methods, respectively, based on the assumption of a transportation distance of 500 km by a 32 t lorry. Considering that there is usually a heavy-duty lorry restriction rule in the urban area of most Chinese cities, it is more realistic to transport the spent EV LIBPs by a 3.5–7.5 t lorry in China. Thus, the effect of transportation distance by a 3.5–7.5 t lorry on the energy consumption (dark red circles) and GHG emission (dark blue squares) of the collection and transportation phase was estimated and compared to those of the rest part of the recycling phases (Figure 12). It is seen that the transportation distance can make a significant contribution to the energy consumption of the LCO recovery if a 3.5–7.5 t lorry was used to transport the spent EV LIBPs. For instance, the energy consumption for a transportation distance of above 300 km by a 3.5–7.5 t lorry alone would exceed half of that for the rest part of the in-situ RR process.
Based on public data [43,44,45], we also estimated the spatial distribution of the transportation distance of spent EV LIBs from the vehicle dismantling plant to the closest LIB treatment facilities in China. It is found that the transportation distance was strongly correlated with the distribution of the spent LIB treatment facilities, as demonstrated in Figure 13. The provinces with a high distribution density of LIB treatment facilities, such as Guangdong, Fujian, Zhejiang, Jiangxi has a reasonable transportation distance of less than 200 km, but in the case of Sichuan province, a transportation distance of above 200 km is needed due to the low distribution density of LIB treatment facilities in Southwestern China. Based on the fact that Shandong, Shanxi, Chongqing, Guizhong, Guangxi, Yunnan, and Hainan significantly contribute to the national EV parc, additional treatment facilities are suggested to be established in these provinces.
From Figure 13, it is also seen that due to the poor cold-temperature performance of LIBs, the EV parc of the provinces in northeast and northwest China is limited, resulting in the absence of the treatment facilities in these provinces, and therefore an unacceptable long transportation distance of above 1000 km.
It also should be noted that the collection and sorting of variety spent LIBs according to the battery chemistry also has a considerable impact on the manpower and other resource investment during this phase. Thus, a safe and efficient collection system is urgently needed to be established so as to reduce the recycling costs and corresponding environmental impacts. Here we can refer to the currently mature solution of lead-acid batteries [48]. To achieve safe and efficient collection and sorting of spent LIBs by using existing infrastructure, the government can formulate corresponding incentive policies to encourage consumers to return spent LIBs, and manufacturers can establish corresponding measures through their existing sales or after-sales channels.

5.2. Pretreatment Phase

Although the pretreatment of spent LIBPs only consumed 2% (HM-CA)~10% (RR-N2) of the total energy consumption, corresponding to 5% (HM-CA)~7% (RR-N2) of the total GHG emissions, most of the LIB packs is manually disassembled at present due to the diversity of cell types, cell chemistries, and pack structures produced by various manufacturers. This would greatly increase labor costs and reduce the benefits for recycling spent LIBs. Therefore, it is necessary to standardize the production of LIBs for facilitating automatic disassembly in the future. It should be noted that although it is assumed that the components (e.g., Al, Cu, separator) are separated from the powdery mixture of electrode materials by physical separation in our study, there is still a big challenge to achieve such a high-purity enrichment of electrode materials in practical operation [28]. These impurities will have a notable impact on the subsequent treatment, and thus additional purification steps are usually required, which increase the cost and complexity of the process. In addition, the emissions generated must be treated effectively during this phase due to its flammability and toxicity [49,50].

5.3. Conversion Phase

5.3.1. UHT Method

The LIB dedicated UHT method is still facing the problem of excessive energy consumption and GHG emissions due to its high operating temperature. Moreover, this method is not conducive to the Li recovery due to the high Li loss in the flue dust and slag [6]. When the method is used to process LIBs with electrode chemistries like lithium manganate and lithium phosphate, its feasibility will be greatly reduced due to the limited Li recovery. Nevertheless, compared with the conventional pyrometallurgical methods that LIBs are directly smelted in a shaft furnace, only the powdery electrode mixture are smelted in the furnace, the LIB dedicated UHT method substantially reduce the processing materials by 40%, and thus a decrease of 20% in energy consumption (43 MJ (kg recovered-LCO)−1 of this study) as compared with 54 MJ (kg recovered-LCO)−1 for the Umicore Process [51]. These results also highlight the importance of pretreatment phase on spent LIB recycling and valuable component enrichment. Thus, our estimation indicated that UHT method has a potential for solving the excessive energy consumption problem of the traditional pyrometallurgical method.

5.3.2. Hydrometallurgical Method

It is well known that the leachant dosage play a crucial role on the leaching efficiency of the valuable metals. Li et al. reported [52] that the leaching efficiency of Co and Li in HM-CA was only ~34% and 58% when the dosage of citric acid and H2O2 were about 4 and 2 times of stoichiometric requirement. While the leaching efficiency of Co and Li can increase to 90% and 99% when the dosage of citric acid and H2O2 were about 6 and 3 times of stoichiometric requirement, respectively [52]. Therefore, to ensure an acceptable leaching efficiency, the latter stoichiometric dose of citric acid and H2O2 were used in this study. Our calculation indicates that HM-CA consumed the most energy for producing an equivalent weight LCO (80 MJ (kg recovered-LCO)−1) among the five methods even based on the assumption that that 90% consumed citric acid was recovered. This value is nearly twice higher than the results obtain by Dunn (42 MJ (kg recovered-LCO)−1 [51]). These results are understandable because their estimation was based on 1.1 times the stoichiometric dosage [36,51,53]. Our calculation also demonstrated that HM-CA consumed a 2.3-fold of energy and emitted a 1.9-fold of GHGs compared to HM-SA for reagent production during this phase. Thus, in terms of life-cycle impacts, organic acid leaching is not a suitable solution for migrating the environmental issues of strong acid leaching.
In LIBs, the valuable metals are basically at the cathode active material. Therefore, to solve the problem of excessive leachant consumption, the separation of cathode and anode materials before hydrometallurgical processes is highly recommended. However, it is still rather challenging to achieve a complete separation of anode and cathode materials in an industrial scale [22,54]. Fortunately, He et al. demonstrated that the effective separation between anode and cathode materials can be achieved by Fenton assisted flotation. However, the impacts of its application on the downstream processing have not yet to be studied.

5.3.3. In-Situ RR Method

Our results indicated the in-situ RR method is a promising method for spent LIB recycling. For example, the total energy consumption of RR-N2 only accounted for 39% of UHT and 23% of HM-CA, corresponding to 68% and 65% of the total GHG emissions. This reduction can be mainly attributed to the considerable reduction in processing temperature from >1450 to 800 °C. Additionally, the in-situ RR method can significantly reduce the amount of electrode active materials by converting the cathode active materials into Li2CO3, Co and other metal oxides (depending on the chemistries of cathode). This is important to the following regeneration phase because it can greatly reduce the reagent consumption.
However, this method still has some shortcomings, such as a low Li recovery rate of ~70%, and the emission of the F-containing gases during the roasting step. In addition, although our estimation was based on the assumption that graphite is completely converted to CO2, transition metals existed in metallic form, and Li is completely converted to Li2CO3 during the roasting step, previous studies showed that considerable carbonaceous materials remained after roasting [17] and part of the transition metals exists in high valence oxides. To overcome these issues, roasting the electrode active materials in a reductive atmosphere can be an attractive solution. In such an atmosphere, the carbon content in electrode materials can be converted into gaseous fuels (such as H2, CO) or the energy required for roasting. Besides, cathode materials can be reduced into metals or low valence metal oxides (e.g., Co or CoO), which consumes much less reductant in the sequential leaching steps.
It should be pointed out that the profitability of the merging methods for LIBs is also one of the most important issues affecting the commercialization of these methods. However, the profitability of the LIBs recycling method may vary because of the diverging emission standards for pollutants and the labor costs of different regions and countries. Therefore, it is extremely difficult to compare the profitability of the merging methods for LIBs, and only energy consumption and GHG emissions were compared in this study. Recently, many novel methods with for industrial spent LIBs recycling also had been developed [55,56]. For example, the company TOXCO in Canada has adopted liquid nitrogen freezing crushing and physical separation technology to recycle metals such as Cu, Fe and Al from spent LIBs, and are reported to be capable of dismantling of 4500 tons of spent LIBs per year. Duesenfeld GmbH, a company in Germany, proposed a combination of mechanical, thermodynamic, and hydrometallurgical treatment processes to recycle Ni and Co from spent LIBs, and the recycling rates of main metals can reach 75%. In addition, Contemporary Amperex Co. Ltd. (CATL, Fujian, China), one of the biggest lithium-ion battery manufacturers in China, reported a novel hydrometallurgical process combined with solvent extraction for recovering cathode materials from spent LIBs, and the recovery rate of Ni, Co and Mn can reach 99.3%. Lastly, it should be noted that our estimation is based on our experimental and basic industrial data. Additional steps are still needed to process the recovered electrode material to achieve the same battery performance as the virgin materials. Nevertheless, the results can still provide the information on whether the emerging recycling methods can provide energy and environmental benefits, and which method is more commercially competitive.

6. Conclusions

In this work, five merging technologies for spent LIB recycling were reviewed and a quantitative analysis to evaluate the life cycle impacts of these technologies was conducted. It is shown that the five emerging methods for spent LIB recycling have significant potential for reducing energy consumption and GHG emissions when only LCO recovery was considered. Among the five different methods, in-situ RR method consumed the least energy coupled with the least GHG emissions, showing significant advantages. While, HM-CA exhibited significant disadvantages, which has about 3.3 times higher energy consumption than that for in-situ RR method, corresponding to 1.4 times higher GHG emissions. Further reduction in energy consumption and GHG emission can be achieved if the recycling of Cu and Al are also taken into account. It is also found that transportation distance has a significant effect of life cycle impacts of the spent LIB recycling technologies in China. For a province without recycling facilities, the energy consumption for collection and transportation would become unacceptably high. We also proposed that further investigation on the in-situ RR method should focus on the removal of carbonaceous residues and complete conversion of valuable content into metals or low valence metal oxides.

Supplementary Materials

The following are available online at https://www.mdpi.com/article/10.3390/en14196263/s1, Figure S1. Energy and material flows for the collection and transportation phase of spent LIB recycling system. Figure S2. Energy and material flows in the pretreatment phase of spent LIB recycling system. Figure S3. Flow diagram of the UHT method. Figure S4. Flow diagram of the HM-SA method. Figure S5. Flow diagram of the HM-CA method. Figure S6. Flow diagram of the RR-N2 method. Figure S7. Flow diagram of the RR-Vac method. Table S1: Energy consumption and GHG emissions associated with different transportation modes. Table S2: Material invento-ries for EV LIBs. Table S3: Carbon-containing components in lithium-ion battery cells and their carbon contents. Table S4: Energy consumption and GJG emissions associated with chemicals used in LIB recycling. Table S5: GHG emissions associated with different electricity structure. Table S6: Sulfuric acid leaching conditions for recycling of valuable metals from LIBs. Table S7: Citric acid leaching conditions for recycling of valuable metals from LIBs.

Funding

This research was funded by the National Natural Science Foundation of China (No. 52076022), and Program for Back-up Talent Development of Chongqing University (No. cqu2018CDHB1A03).

Institutional Review Board Statement

Not applicable.

Informed Consent Statement

Informed consent was obtained from all subjects involved in the study.

Data Availability Statement

Not applicable.

Conflicts of Interest

The authors declare no conflict of interest.

References

  1. Natarajan, S.; Aravindan, V. Burgeoning prospects of spent lithium-ion batteries in multifarious applications. Adv. Energy Mater. 2018, 8, 1802303. [Google Scholar] [CrossRef]
  2. Wang, W.; Wu, Y. An overview of recycling and treatment of spent LiFePO4 batteries in China. Resour. Conserv. Recycl. 2017, 127, 233–243. [Google Scholar] [CrossRef]
  3. Georgi-Maschler, T.; Friedrich, B.; Weyhe, R.; Heegn, H.; Rutz, M. Development of a recycling process for Li-ion batteries. J. Power Sour. 2012, 207, 173–182. [Google Scholar] [CrossRef]
  4. Al-Thyabat, S.; Nakamura, T.; Shibata, E.; Iizuka, A. Adaptation of minerals processing operations for lithium-ion (LiBs) and nickel metal hydride (NiMH) batteries recycling: Critical review. Miner. Eng. 2013, 45, 4–17. [Google Scholar] [CrossRef]
  5. Lv, W.; Wang, Z.; Cao, H.; Sun, Y.; Zhang, Y.; Sun, Z.H. A critical review and analysis on the recycling of spent lithium-ion batteries. ACS Sustain. Chem. Eng. 2018, 6, 1504–1521. [Google Scholar] [CrossRef]
  6. Pinegar, H.; Smith, Y.R. Recycling of end-of-life lithium ion batteries, part I: Commercial processes. J. Sustain. Met. 2019, 5, 402–416. [Google Scholar] [CrossRef]
  7. Harper, G.; Sommerville, R.; Kendrick, E.; Driscoll, L.; Slater, P.; Stolkin, R.; Walton, A.; Christensen, P.; Heidrich, O.; Lambert, S.; et al. Recycling lithium-ion batteries from electric vehicles. Nature 2019, 575, 75–86. [Google Scholar] [CrossRef] [Green Version]
  8. Shin, S.M.; Kim, N.H.; Sohn, J.S.; Yang, D.H.; Kim, Y.H. Development of a metal recovery process from Li-ion battery wastes. Hydrometallurgy 2005, 79, 172–181. [Google Scholar] [CrossRef] [Green Version]
  9. Xu, J.; Thomas, H.R.; Francis, R.W.; Lum, K.R.; Wang, J.; Liang, B. A review of processes and technologies for the recycling of lithium-ion secondary batteries. J. Power Sour. 2008, 177, 512–527. [Google Scholar] [CrossRef]
  10. Kang, J.; Senanayake, G.; Sohn, J.; Shin, S.M. Recovery of cobalt sulfate from spent lithium ion batteries by reductive leaching and solvent extraction with Cyanex 272. Hydrometallurgy 2010, 100, 168–171. [Google Scholar] [CrossRef] [Green Version]
  11. Chen, X.; Luo, C.; Zhang, J.; Kong, J.; Zhou, T. Sustainable recovery of metals from spent lithium-ion batteries: A green process. ACS Sustain. Chem. Eng. 2015, 3, 3104–3113. [Google Scholar] [CrossRef]
  12. Chen, X.; Fan, B.; Xu, L.; Zhou, T.; Kong, J. An atom-economic process for the recovery of high value-added metals from spent lithium-ion batteries. J. Clean. Prod. 2016, 112, 3562–3570. [Google Scholar] [CrossRef]
  13. Almeida, J.R.; Moura, M.N.; Barrada, R.V.; Barbieri, E.M.S.; Carneiro, M.T.; Ferreira, S.A.D.; Lelis, M.D.F.F.; Freitas, M.; Brandão, G.P. Composition analysis of the cathode active material of spent Li-ion batteries leached in citric acid solution: A study to monitor and assist recycling processes. Sci. Total Environ. 2019, 685, 589–595. [Google Scholar] [CrossRef]
  14. Yu, M.; Zhang, Z.; Xue, F.; Yang, B.; Guo, G.; Qiu, J. A more simple and efficient process for recovery of cobalt and lithium from spent lithium-ion batteries with citric acid. Sep. Purif. Technol. 2019, 215, 398–402. [Google Scholar] [CrossRef]
  15. Li, J.; Lai, Y.; Zhu, X.; Liao, Q.; Xia, A.; Huang, Y.; Zhu, X. Pyrolysis kinetics and reaction mechanism of the electrode materials during the spent LiCoO2 batteries recovery process. J. Hazard. Mater. 2020, 398, 122955. [Google Scholar] [CrossRef]
  16. Li, J.; Wang, G.; Xu, Z. Environmentally-friendly oxygen-free roasting/wet magnetic separation technology for in situ recycling cobalt, lithium carbonate and graphite from spent LiCoO2/graphite lithium batteries. J. Hazard. Mater. 2016, 302, 97–104. [Google Scholar] [CrossRef]
  17. Xiao, J.; Li, J.; Xu, Z. Recycling metals from lithium ion battery by mechanical separation and vacuum metallurgy. J. Hazard. Mater. 2017, 338, 124–131. [Google Scholar] [CrossRef]
  18. Xiao, J.; Li, J.; Xu, Z. Novel approach for in situ recovery of lithium carbonate from spent lithium ion batteries using vacuum metallurgy. Environ. Sci. Technol. 2017, 51, 11960–11966. [Google Scholar] [CrossRef]
  19. Mao, J.; Li, J.; Xu, Z. Coupling reactions and collapsing model in the roasting process of recycling metals from LiCoO2 batteries. J. Clean. Prod. 2018, 205, 923–929. [Google Scholar] [CrossRef]
  20. Huang, Z.; Ruan, J.; Yuan, Z.; Qiu, R.-L. Characterization of the materials in waste power banks and the green recovery process. ACS Sustain. Chem. Eng. 2018, 6, 3815–3822. [Google Scholar] [CrossRef]
  21. Zhang, Y.; Wang, W.; Fang, Q.; Xu, S. Improved recovery of valuable metals from spent lithium-ion batteries by efficient reduction roasting and facile acid leaching. Waste Manag. 2020, 102, 847–855. [Google Scholar] [CrossRef]
  22. Wang, W.; Zhang, Y.; Zhang, L.; Xu, S. Cleaner recycling of cathode material by in-situ thermite reduction. J. Clean. Prod. 2020, 249, 119340. [Google Scholar] [CrossRef]
  23. Wang, W.; Han, Y.; Zhang, T.; Zhang, L.; Xu, S. Alkali metal salt catalyzed carbothermic reduction for sustainable recovery of LiCoO2: Accurately controlled reduction and efficient water leaching. ACS Sustain. Chem. Eng. 2019, 7, 16729–16737. [Google Scholar] [CrossRef]
  24. Wang, W.; Zhang, Y.; Liu, X.; Xu, S. A simplified process for recovery of li and co from spent LiCoO2 cathode using al foil as the in situ reductant. ACS Sustain. Chem. Eng. 2019, 7, 12222–12230. [Google Scholar] [CrossRef]
  25. Liu, C.; Lin, J.; Cao, H.; Zhang, Y.; Sun, Z. Recycling of spent lithium-ion batteries in view of lithium recovery: A critical review. J. Clean. Prod. 2019, 228, 801–813. [Google Scholar] [CrossRef]
  26. Zhang, X.; Li, L.; Fan, E.; Xue, Q.; Bian, Y.; Wu, F.; Chen, R. Toward sustainable and systematic recycling of spent rechargeable batteries. Chem. Soc. Rev. 2018, 47, 7239–7302. [Google Scholar] [CrossRef]
  27. Chen, M.; Ma, X.; Chen, B.; Arsenault, R.; Karlson, P.; Simon, N.; Wang, Y. Recycling end-of-life electric vehicle lithium-ion batteries. Joule 2019, 3, 2622–2646. [Google Scholar] [CrossRef]
  28. Xiao, J.; Li, J.; Xu, Z. Challenges to future development of spent lithium ion batteries recovery from environmental and technological perspectives. Environ. Sci. Technol. 2020, 54, 9–25. [Google Scholar] [CrossRef]
  29. Wang, H.; Wu, J.-J.; Zhu, X.; Liao, Q.; Zhao, L. Energy–environment–economy evaluations of commercial scale systems for blast furnace slag treatment: Dry slag granulation vs. water quenching. Appl. Energy 2016, 171, 314–324. [Google Scholar] [CrossRef]
  30. Gaines, L.; Sullivan, J.; Burnham, A.; Belharouak, I. Paper No. 11-3891. Life-cycle analysis for lithium-ion battery production and recycling. In Proceedings of the Transportation Research Board 90th Annual Meeting, Washington, DC, USA, 23–27 January 2011. [Google Scholar]
  31. Dewulf, J.; van der Vorst, G.; Denturck, K.; van Langenhove, H.; Ghyoot, W.; Tytgat, J.; Vandeputte, K. Recycling rechargeable lithium ion batteries: Critical analysis of natural resource savings. Resour. Conserv. Recycl. 2010, 54, 229–234. [Google Scholar] [CrossRef]
  32. Dunn, J.B.; Gaines, L.; Sullivan, J.; Wang, M.Q. Impact of recycling on cradle-to-gate energy consumption and greenhouse gas emissions of automotive lithium-ion batteries. Environ. Sci. Technol. 2012, 46, 12704–12710. [Google Scholar] [CrossRef]
  33. Dunn, J.B.; Gaines, L.; Kelly, J.C.; James, C.; Gallagher, K.G. The significance of Li-ion batteries in electric vehicle life-cycle energy and emissions and recycling’s role in its reduction. Energy Environ. Sci. 2015, 8, 158–168. [Google Scholar] [CrossRef]
  34. Ciez, R.E.; Whitacre, J.F. Examining different recycling processes for lithium-ion batteries. Nat. Sustain. 2019, 2, 148–156. [Google Scholar] [CrossRef]
  35. Xiong, S.; Ji, J.; Ma, X. Environmental and economic evaluation of remanufacturing lithium-ion batteries from electric vehicles. Waste Manag. 2020, 102, 579–586. [Google Scholar] [CrossRef]
  36. Dunn, J.B.; Gaines, L.; Barnes, M.; Wang, M.; Sullivan, J. Material and Energy Flows in the Materials Production, Assembly, and End-of-Life Stages of the Automotive Lithium-Ion Battery Life Cycle; Argonne National Lab. (ANL): Argonne, IL, USA, 2012. [Google Scholar]
  37. Cheret, D.; Santen, S. Battery Recycling. U.S. Patent No. 71692062007, 18 April 2005. [Google Scholar]
  38. Hu, J.; Zhang, J.; Li, H.; Chen, Y.; Wang, C. A promising approach for the recovery of high value-added metals from spent lithium-ion batteries. J. Power Sour. 2017, 351, 192–199. [Google Scholar] [CrossRef]
  39. Zhang, J.; Hu, J.; Zhang, W.; Chen, Y.; Wang, C. Efficient and economical recovery of lithium, cobalt, nickel, manganese from cathode scrap of spent lithium-ion batteries. J. Clean. Prod. 2018, 204, 437–446. [Google Scholar] [CrossRef]
  40. Haibo, Y.; Hui, L.; Jicheng, H.; Ping, L. Research on structure and properties of LiCoO2 prepared from spent lithium ion batteries. Rare Met. Mater. Eng. 2006, 35, 836–840. [Google Scholar]
  41. Granata, G.; Moscardini, E.; Pagnanelli, F.; Trabucco, F.; Toro, L. Product recovery from Li-ion battery wastes coming from an industrial pre-treatment plant: Lab scale tests and process simulations. J. Power Sour. 2012, 206, 393–401. [Google Scholar] [CrossRef]
  42. Wang, B.; Lin, X.-Y.; Tang, Y.; Wang, Q.; Leung, M.K.; Lu, X.-Y. Recycling LiCoO2 with methanesulfonic acid for regeneration of lithium-ion battery electrode materials. J. Power Sour. 2019, 436, 226828. [Google Scholar] [CrossRef]
  43. Heelan, J.; Gratz, E.; Zheng, Z.; Wang, Q.; Chen, M.; Apelian, D.; Wang, Y. Current and prospective Li-ion battery recycling and recovery processes. JOM 2016, 68, 2632–2638. [Google Scholar] [CrossRef] [Green Version]
  44. Sun, C.; Xia, A.; Liao, Q.; Fu, Q.; Huang, Y.; Zhu, X. Life-cycle assessment of biohythane production via two-stage anaerobic fermentation from microalgae and food waste. Renew. Sustain. Energy Rev. 2019, 112, 395–410. [Google Scholar] [CrossRef]
  45. Ning, D.; Gao, F.; Wang, Z.; Gong, X. Comparative analysis of primary aluminum and recycled aluminum on energy consumption and greenhouse gas emission. Chin. J. Nonferrous Met. 2012, 22, 2908–2915. [Google Scholar]
  46. Gaines, L. The future of automotive lithium-ion battery recycling: Charting a sustainable course. Sustain. Mater. Technol. 2014, 1, 2–7. [Google Scholar] [CrossRef] [Green Version]
  47. Diaz, F.; Wang, Y.; Weyhe, R.; Friedrich, B. Gas generation measurement and evaluation during mechanical processing and thermal treatment of spent Li-ion batteries. Waste Manag. 2019, 84, 102–111. [Google Scholar] [CrossRef] [PubMed]
  48. Yang, T.; Lu, Y.; Li, L.; Ge, D.; Yang, H.; Leng, W.; Zhou, H.; Han, X.; Schmidt, N.; Ellis, M.; et al. An effective relithiation process for recycling lithium-ion battery cathode materials. Adv. Sustain. Syst. 2020, 4. [Google Scholar] [CrossRef] [Green Version]
  49. Li, L.; Ge, J.; Wu, F.; Chen, R.; Chen, S.; Wu, B. Recovery of cobalt and lithium from spent lithium ion batteries using organic citric acid as leachant. J. Hazard. Mater. 2010, 176, 288–293. [Google Scholar] [CrossRef] [PubMed]
  50. Li, L.; Dunn, J.B.; Zhang, X.X.; Gaines, L.; Chen, R.J.; Wu, F.; Amine, K. Recovery of metals from spent lithium-ion batteries with organic acids as leaching reagents and environmental assessment. J. Power Sour. 2013, 233, 180–189. [Google Scholar] [CrossRef]
  51. Zhang, T.; He, Y.; Wang, F.; Ge, L.; Zhu, X.; Li, H. Chemical and process mineralogical characterizations of spent lithium-ion batteries: An approach by multianalytical techniques. Waste Manag. 2014, 34, 1051–1058. [Google Scholar] [CrossRef]
  52. Zhang, T.; He, Y.; Wang, F.; Li, H.; Duan, C.; Wu, C. Surface analysis of cobalt-enriched crushed products of spent lithium-ion batteries by X-ray photoelectron spectroscopy. Sep. Purif. Technol. 2014, 138, 21–27. [Google Scholar] [CrossRef]
  53. He, Y.; Zhang, T.; Wang, F.; Zhang, G.; Zhang, W.; Wang, J. Recovery of LiCoO2 and graphite from spent lithium-ion batteries by Fenton reagent-assisted flotation. J. Clean. Prod. 2017, 143, 319–325. [Google Scholar] [CrossRef]
  54. Chen, Y.; Liu, N.; Jie, Y.; Hu, F.; Li, Y.; Wilson, B.P.; Xi, Y.; Lai, Y.; Yang, S. Toxicity identification and evolution mechanism of thermolysis-driven gas emissions from cathodes of spent lithium-ion batteries. ACS Sustain. Chem. Eng. 2019, 7, 18228–18235. [Google Scholar] [CrossRef]
  55. Jung, J.C.-Y.; Sui, P.-C.; Zhang, J. A review of recycling spent lithium-ion battery cathode materials using hydrometallurgical treatments. J. Energy Storage 2021, 35, 102217. [Google Scholar] [CrossRef]
  56. Diekmann, J.; Rothermel, S.; Nowak, S.; Kwade, A. The LithoRec process. In Recycling of Lithium-Ion Batteries; Kwade, A., Diekmann, J., Eds.; Sustainable Production, Life Cycle Engineering and Management; Springer: Cham, Switzerland, 2018; pp. 33–38. [Google Scholar]
Figure 1. Schematic of the Ultra-high treatment method of spent LIB recycling system.
Energies 14 06263 g001
Figure 2. Schematic of the hydrometallurgical method of spent LIB recycling system.
Energies 14 06263 g002
Figure 3. Schematic of the In-situ reduction roasting method of spent LIB recycling system.
Energies 14 06263 g003
Figure 4. System boundary of spent LIB recycling used in this study.
Energies 14 06263 g004
Figure 5. Contribution analysis of the total energy consumption for the five different methods. Each pair of bars represents a method, where the bottom bar represents the energy consumption distribution of each phase for 1 FU, the top bar is the energy consumption for producing an equivalent weight virgin LCO in industry, and the numbers indicate the reduction rate of energy consumption and recovered LCO from 1 FU for each method.
Energies 14 06263 g005
Figure 6. Contribution analysis of the energy consumption in the conversion and regeneration phase for the five different recycling methods. (a) UHT method, (b) HM-SA, (c) HM-CA, (d) RR-N2, and (e) RR-Vac. The percentage labeling indicates the proportion of the energy consumption associated with the manufacture of the materials or active electrode material processing needed for the treatment of 1FU in the conversion and regeneration phase. The red bar indicates the total energy consumption of the conversion and regeneration phase for the five different recycling methods.
Energies 14 06263 g006
Figure 7. Contribution analysis of total GHG emissions for the five different recycling methods. Each pair of bars represents a method, where the bottom bar indicated the GHG emissions distribution of each phase for 1 FU, the top bar is the GHG emissions for producing an equivalent weight virgin LCO in industry, and the difference represents the GHG emission reduction. The numbers indicate the reduction rate of GHG emission for each method.
Energies 14 06263 g007
Figure 8. Contribution analysis of the GHG emissions in the conversion and regeneration phase for the five different recycling methods. (a) UHT method, (b) HM-SA, (c) HM-CA, (d) RR-N2, and (e) RR-Vac. The percentage labeling indicates the proportion of the GHG emission resulting from the manufacture of the materials or active electrode material processing needed for the recycling 1FU in the conversion and regeneration phase. The red bar indicates the total GHG emissions of the conversion and regeneration phase for the five different recycling methods.
Energies 14 06263 g008
Figure 9. Contribution analysis of energy consumption (a) and GHG emissions (b) for the five different recycling methods. Each pair of bars is related to a method, where the bottom bar represents the energy consumption (a) or GHG emissions (b) required for each recycling method and Cu and Al recovering processes for 1 FU, the top bar is the energy consumption (a) or GHG emissions (b) for an equivalent weight virgin LCO and primary Cu and Al production in industry, and the difference represents the energy saving. The numbers indicate the reduction rate of energy consumption (a) or GHG emissions (b) from 1 FU for each method.
Energies 14 06263 g009
Figure 10. Sensitivity analysis of the total energy consumption (a) and GHG emissions (b) for different recycling methods by changing the recovery rate of Li and Co.
Energies 14 06263 g010
Figure 11. Sensitivity analysis of the GHG emissions for the recycling methods with different electricity sources.
Energies 14 06263 g011
Figure 12. Effect of transportation distance (using lorry 3.5–7.5 t) in spent LIB recycling systems on the energy consumption (dark red circles) and GHG emission (dark blue squares) of the collection and transportation phase as compared to those of the rest part of the recycling methods.
Energies 14 06263 g012
Figure 13. Spatial distribution of the transportation distance of spent EV LIBs from the vehicle dismantling plant to the closest LIB treatment facilities in China. The numbers indicate the average closest transportation distance of spent EV LIBs for each province.
Energies 14 06263 g013
Publisher’s Note: MDPI stays neutral with regard to jurisdictional claims in published maps and institutional affiliations.

