1. Introduction
Interest in the use of solar power to produce electrical energy has been increasing for many years [
1]. The peak value of the power installed in photovoltaic installations nowadays exceed 714 GW [
2]. In the European Union, 13% of the electrical energy produced is obtained in photovoltaic installations [
3].
Photovoltaic systems are used in households and objects of public utility [
4,
5,
6,
7] as well as in the supply system of mobile devices [
8,
9]. One such installation is located in the Gdynia Maritime University, Poland. Such installations can be connected to the electroenergy net or they can operate in a smart grid [
10]. The typical isolated photovoltaic system consists of the following components: Photovoltaic panels, batteries, and switch-mode voltage regulators with DC–DC or DC–AC converters [
6,
11].
At present, intensive research works are being carried out on various components of photovoltaic installations [
2]. The photovoltaic panels used are of key importance in the efficiency of such installations. According to the information contained in [
2,
12], various semiconductor materials are used in the production of photovoltaic cells, and the photovoltaic conversion efficiency for these cells even reaches 47% for multi-junction monolithic cells (with the concentration of solar radiation). The most commonly used silicon photovoltaic cells are characterized by photovoltaic conversion efficiency of up to 24% [
13]. A separate problem arises with efficient inverters cooperating with photovoltaic installations and energy storage systems [
2,
14,
15,
16,
17,
18,
19,
20,
21].
Different tools are used in the computer analyses of electronic networks. Popular programs are MATLAB/Simulink [
22,
23], PLECS [
24], and SPICE [
25]. The SPICE program is often used in the analyses of electronic and power electronics networks [
25]. Due to its 50-year presence on the market, SPICE is a well-known computation tool for engineers.
Previous research [
22] presents a method of modeling a photovoltaic installation with the use of MATLAB/Simulink software. The computer analyses typically use very simple models of photovoltaic panels proposed in previous papers [
26,
27]. These models take into account the influence of temperature changes on the operation of panels but ignore the influence of thermal phenomena on the properties of these panels.
In turn, the results of investigations of the stand-alone photovoltaic (PV) system are presented in [
23]. The presented analyses are performed using MATLAB/Simulink software. The system under consideration includes a PV generator, a battery bank, and DC–DC and DC–AC converters. It operates with AC or DC loads. Thermal phenomena are omitted in these analyses. A simple method of determining values of the parameters of the solar cell model is proposed in [
28,
29].
Previous research [
30] describes the results of computer analyses of a photovoltaic system connected to the power grid. The analyses take into account the optical and electrical properties of photovoltaic panels and power electronics systems. However, the thermal properties of these devices are ignored.
In [
31], a PV array model is proposed, and its correctness is verified. In particular, the current–voltage characteristics of a solar cell are described using a model that contains only five parameters.
In [
32], a compact electrothermal model of the solar photovoltaic array is proposed. In the cited paper, various mechanisms influencing the efficiency of heat dissipation generated inside individual photovoltaic cells are analyzed, but there is no statement of how to determine the value of power losses in the photovoltaic cell. The thermal properties of photovoltaic cells are characterized by the use of the parameters of individual layers forming the photovoltaic panel.
Another paper [
33] presents a model of a solar cell that takes into account the influence of its temperature changes on current–voltage characteristics. A thermal model illustrating the heat flow between both sides of the solar cell is also presented. Yet, no results of electrothermal analyses are presented.
In [
34], an electrothermal model of photovoltaic cells and photovoltaic panels is proposed. Using the COMSOL package and a special algorithm, a focused thermal model is formulated for each solar cell contained in the panel. The developed model only takes into account the self-heating phenomenon, while ignoring the heat absorbed by the panel as a result of solar radiation. The considered model enables the performance of DC and transient analyses. It also makes it possible to take into account the difference in the internal temperature of the individual solar cells placed on the panel.
In [
13], a temperature-dependent solar panel model is presented. In this model, one temperature characterizes the whole solar panel.
In order to perform computer simulations of the considered system, models of all the components of such a system, prepared in the form dedicated to the applied software for the analysis of electronic circuits, are indispensable. In such analyses, SPICE software is very helpful and is used very often [
11,
35]. The degree of complexity of the considered system means there is no reason to use the scheme of this system or introduce the models of components of this system to proper places, because this would lead to an unacceptably long duration of computations or even problems in obtaining the convergence of computations [
36]. Therefore, it is advisable to elaborate a supplementary diagram of the considered system in the form of a macromodel for SPICE software. The macromodel consists of components connected to each other, accessible in SPICE software, containing far fewer elements than the modelled system while simultaneously making it possible to obtain the correct description of the terminal characteristics of this system [
37].
In the authors’ earlier papers, e.g., [
38], models dedicated to SPICE software of photovoltaic panels, batteries, and DC–DC converters used in the system to supply power to laptops were proposed. The system analyzed in the cited paper contained only one photovoltaic panel, and investigations were conducted in a light-tight chamber with the power density of radiation, whose value did not change in the function of time. In the system considered in the cited paper, only DC–DC converters were used to transform the electrical energy. In [
39], an electrothermal model of a solar cell dedicated to the SPICE program is proposed and its practical usefulness is demonstrated. The correctness of the model was verified only by comparing the obtained computation results to another model in the literature.
As it is known from the literature [
11,
40,
41,
42], the course of characteristics of solar cells and photovoltaic panels depends on temperature. Similarly, as for other semiconductor devices, their internal temperature is a sum of both the ambient temperature and additional components, which are the result of self-heating [
43,
44] and the absorption of optical radiation [
45].
This paper, which is an extended version of a conference paper [
46], proposes an electrothermal model of the actual photovoltaic installation in the form of a subcircuit dedicated to SPICE software. This model consists of electrothermal models of the components of the considered installation, such as photovoltaic panels chains and inverters. The influence of selected weather parameters on photovoltaic panels chains is taken into account. In the elaborated model, the self-heating phenomenon affects the properties of both photovoltaic panels and inverters. For modeling the characteristics of inverters, the idea of electrothermal averaged models, proposed e.g., in [
46,
47], is used. The usefulness of the elaborated model is experimentally verified for the photovoltaic installation situated in the Gdynia Maritime University, Poland. In comparison to the previous paper [
46], in this article, a new model of photovoltaic installation is proposed. In this model, the influence of the angle of incidence of solar beams on the surface of the solar panel is also taken into account. This modification in the model of solar panels makes it possible to improve the accuracy of modeling the properties of the actual photovoltaic installation. New computation and measurement results are presented and discussed in this article. These results illustrate the usefulness of the proposed model to describe electrical and thermal properties of the investigated photovoltaic installation operating in four seasons.
2. Photovoltaic Installation
The investigated photovoltaic installation is situated in the Gdynia Maritime University (GMU), Poland. It is characterized by a peak power of 10.4 kW
p. This installation contains forty silicon photovoltaic modules with a peak power of 260 kW
p. The considered installation produces electrical energy with sinusoidal voltage. The RMS value of this voltage is equal to 230 V. This installation is used to supply one of the GMU laboratories.
Figure 1 presents the block diagram of the considered photovoltaic installation.
The analyzed installation contains 40 photovoltaic panels connected in 4 chains of 10 panels. Two chains are built from monocrystalline panels of the Axitec AC-260M/156-60S type (AXITEC Energy GmbH & Co., Böblingen, Germany) [
48] and the two other chains are from poly-crystalline panels Axitec AC-260P/156-60S [
49]. The azimuth angle of each panel is fixed at 205°. It is possible to manually regulate the elevation angle of these panels in a range from 20° to 65° with a step of 15°.
The second most important components in the considered photovoltaic installation are network inverters. Two network inverters, Sunny Boy 5000TL-21 (SMA Solar Technology AG, Niestetal, Germany) [
50], operating in the two-phase configuration and the insular inverter Sunny Island 6.0H (SMA Solar Technology AG, Niestetal, Germany) are used. Each network inverter has two inputs for two chains of photovoltaic modules connected in parallel to each other. The first inverter cooperates with monocrystalline modules only, whereas the other inverter operates with polycrystalline modules only. The value of the input voltage of each inverter can change depending on the irradiation, but the maximum allowable value of this voltage is equal to 500 V. The considered inverters convert the DC voltage obtained with photovoltaic panels into sinusoidal voltage with a frequency equal to 50 Hz and an RMS value equal to 230 V. In compliance with the catalogue data of these inverters [
50], they operate correctly over a wide range of input voltage (from 175 V to 500 V) and the energy efficiency of power conversion is high and amounts up to about 97%.
The insular inverter is used to transform the DC electrical energy aggregated in the DC battery (built by four gel batteries connected in series) into the energy of the alternating current. The nominal value of each gel battery is equal to 12 V and its capacity is 220 Ah. Production of additional energy follows in the case of too-weak sun irradiation (e.g., large cloudiness, night-time, winter) or damage to the energy network. In the case of failure of the energy network, this insular inverter with the relay switching circuits converts the two-phase network into a single-phase network with a delay of about 7 s [
51].
The bi-directional energy meter is used to download the energy from the public energy network if energy shortages occur. This meter also makes it possible to transfer the excess of the energy produced by the photovoltaic installation to the public network.
The local Internet network with a router is used to perform the communication between the components of the considered installation. The values of parameters characterizing properties of the installation are periodically sent, up to date, to the Internet service Sunny Portal. It allows for remotely managing and monitoring this installation.
3. Model of the Photovoltaic Panels Chains
The electrothermal model of the set of two chains of photovoltaic panels connected in parallel is proposed in this Section. This model has the form of a subcircuit for SPICE and was formulated on the basis of the model of photovoltaic panels given in previous papers [
51,
52].
Figure 2 shows the network form of this model.
The presented model belongs to the group of compact electrothermal models. Such models of many semiconductor devices are presented in previous papers [
37,
43,
53,
54]. While formulating this model, it is assumed that the temperature of each panel is the same, and a quasi-uniform distribution of temperature in each panel is observed. This temperature is the same for all the panels operating in one chain due to the same irradiation and cooling conditions as well as the same value of dissipated power. Additionally, it is assumed that the electrical properties of each panel are the same.
The elaborated model consists of two blocks: The electrical model and the thermal model. The electrical model contains equations describing the current–voltage characteristics of the considered devices, taking into account the influence of the device’s internal temperature. In contrast, the thermal model is used to compute the value of the device’s internal temperature Tj taking into account both the changes in the ambient temperature Ta and a self-heating phenomenon.
Each of the considered panels contains 60 photovoltaic cells connected in series and there are 10 panels in every chain. This means that every inverter is supplied by the voltage obtained from two chains connected in parallel, and there are 600 cells connected in series in every considered chain. To describe all the photovoltaic panels contained in the considered chains, one can use the model of the photovoltaic panel presented in a previous paper [
52]. In order to simplify the model form, in the presented model, the protecting diodes, contained in each panel before its inverse connection, are omitted.
In the electrical model, Vout denotes voltage on the chains of photovoltaic panels connected in series and Iout is the sum of currents flowing through such chains connected in parallel. The controlled current source G1 represents the photoelectric current; in turn, the controlled current source G2 represents the component of the diffusion current of the p–n junctions. The current flowing through resistor RR models the leakage current of the panels, whereas resistor RS represents the series resistance of all the panels at the reference temperature T0. The controlled voltage source ERS models the dependence of the series resistance on temperature. In the presented model, the influence of the component of the generation-recombination current on characteristics of the considered panel chain is omitted.
In order account for the influence of weather conditions and seasons (of the year) on characteristics of solar panels, the controlled voltage source EP is used. The voltage on this source represents the waveform of the power density of irradiation Pe for the whole day in which the analysis is performed. The output voltage of this source is described with the use of piece-wise linear functions. In turn, the controlled voltage source Eφ describes changes in the angle of incidence of solar beams on the surface of the solar panel φ in the time between sunrise and sunset.
Due to the assumption that all the panels in a chain are identical, the whole considered chain of panels can be described by means of the model of the photovoltaic panel taking into account the scaling of voltage.
The photoelectric current is described by the following formula
where
S is the sum of the active areas of the solar cells included in each panel connected in series,
m2 is the number of panels connected in series,
η is the efficiency of photovoltaic conversion,
x is the coefficient equal to 1 V
−1,
αT is the temperature coefficient of the photoelectric current,
Tj is the internal temperature of the solar cell,
Imax denotes the maximum value of the panel current, whereas
MIN( ) is the SPICE standard function, the value of which is equal to the value of a smaller argument of this function. The number 2 occurring in Equation (1) results from modeling two chains connected in parallel. The function
f(
φ) describes the dependence of the photocurrent on the angle
φ by the formula of the following form [
47]
where
w3,
w2,
w1, and
w0 are the coefficients of the approximation polynomial.
The diffusion current of the p–n junctions is given with the formula [
46]
where
J0 is the parameter of saturation current density,
n is the emission factor of the junction,
m1 is the number of solar cells contained in the panel,
Ugo is the voltage corresponding to the silicon band-gap,
v1 is the voltage on the current source G
2,
k is the Boltzmann’s constant, and
q is the electron charge.
In turn, the influence of temperature on equivalent series resistance of the panels included in two chains is modeled using the controlled voltage source
ERS, the output voltage of which is given by the linear dependence [
47]:
where
αRS is the temperature coefficient of series resistance, whereas
VRSO is the voltage on resistor
RS. The
RS resistance has a value equal to one half of the sum of the series resistance of the panel chain connected in series.
The thermal model makes it possible to compute the internal temperature
Tj of the used photovoltaic panels. This temperature is the same for all the panels operating in one chain due to the same irradiation and cooling conditions as well as the same value of dissipated power. The value of temperature
Tj corresponds to the voltage on terminal
Tj of the proposed model. The controlled current source
Pth, contained in the thermal model, describes the sum of power dissipated in one panel and the power of solar irradiation absorbed by this panel. The power
Pth is given by the following equation [
46]:
where the parameter
γ is the ratio of irradiation energy conversion into heat and
SPV is the solar panel area.
In the network representation of the thermal model, the classical Foster network is used. In this model, the controlled current source Pth represents the power dissipated in each panel and the power of the absorbed irradiation, and the passive components Rth1, …, Rthn and Cth1, …, Rthn represent thermal resistances and thermal capacitances occurring in the heat flow path between the panel and the surroundings. Values of the mentioned RC components can be obtained with the use of the measured waveform of transient thermal impedance of the photovoltaic panel. The voltage source VTa represents the ambient temperature Ta.
4. Model of Inverters
The system assuring the operation of photovoltaic panels at the point of maximum power is applied in the used inverters. This refers to the variation of the inverter input resistance to the maximum input power of this inverter at the current conditions of exposition to the sun. On the other hand, the inverter load is the energy network. This network can consume all the energy produced by the photovoltaic installation. The value of this energy is limited by solar irradiation and the inverter energy efficiency.
Taking into account the mentioned information, a compact model of the inverter was formulated. In formulating the presented model, the idea of compact average models of power converters described e.g., in [
35,
55,
56] is used. According to this method, instead of waveforms of the actual values of voltages and currents in the considered converter, the averaged values of these currents and voltages are used. Due to this operation, high-frequency components of currents and voltages are not taken into account and the computations can be performed much faster. The use of the averaged models can reduce the computation time up to ten thousand times.
Figure 3 shows the network representation of the inverter model.
This model contains two controlled current sources and two controlled voltage sources. The current source
Gin describes the input current of the inverter using the formula [
46]:
In this formula, Vin is the inverter input voltage, Imp and Vmp are the current and voltage of the photovoltaic panel at the point of the maximum power at the nominal value of power density of irradiation Penom; Pemax is the maximum value of power density of irradiation on the analyzed day and αV is the temperature coefficient of voltage Vmp.
The voltage source
Eout represents the inverter output voltage. This voltage is expressed by the following spline function [
46]:
where time is denoted by the letter
t.
Equation (7) shows that the expected waveform of the voltage on the inverter output can be observed only in the case where the inverter input voltage exceeds 175 V. The current source
Gout describes the load current of the photovoltaic installation with the formula [
46]:
where the output current amplitude
I0 is given by [
46]:
In Equation (9), ηINV is the inverter energy efficiency, whereas Iin denotes the output current of the source Gin.
The inverter energy efficiency is modelled by the voltage source
EηINV with the following empirical formula [
46]:
In this formula, ηmin and ηmax are the minimum and maximum values of the inverter energy efficiency, respectively, while Pout is the output power of the inverter and P1 is a model parameter.
5. Investigations Results
In order to verify the practical usefulness of the described models and investigate properties of the considered photovoltaic installation, some computations and measurements were performed. In the performed computations, the battery and the island inverter are neglected, because the main objective of these computations is to investigate the influence of irradiation, temperature, and the time of sunset and sunrise on properties of this installation operating at the optimum load—the energy network. This network can accept all the produced energy.
Parameter values of the proposed models were estimated with the use of data of the applied photovoltaic panels [
48,
49] and the inverters [
50] given by their producers. Solar irradiation is a primary source of the energy converted by the photovoltaic installation. Changes in the value of the power density of this irradiation are observed as a result of changes in the time of the day, different seasons, and the degree of cloudiness. In the computations, the waveforms of the power density of irradiation measured by means of the weather station were used. This station is located near the investigated installation and described in a previous paper [
51]. These measured waveforms were modeled by means of the voltage source, the output voltage of which is described with the piece-wise linear function (PWL).
The measured (solid lines) and computed (dashed lines) waveforms of the power density of solar irradiation are presented in
Figure 4. The test results refer to the selected days corresponding to the four seasons of the year in the workplace of the tested installation.
As is visible, the calculated and measured waveforms fit well. The average value of the difference between these results does not exceed 2.6 W/m2. Visible short-term noises in the irradiation power density value result from the changes in cloud cover at particular times of the considered days. It is also noticeable that due to the high latitude of Gdynia (54.5° north latitude), there are essential differences visible within both the duration time of exposition of the photovoltaic panels to solar irradiation and the maximum values of the power density of this irradiation. In July, the exposure time even exceeds 16 h, whereas in December, it is equal to only 7 h. Additionally, the maximum value of the power density of irradiation decreases from 1100 W/m2 in July to only 300 W/m2 in December. The energy density of solar irradiation on the considered days decreases from 32.8 kWh/m2 in July to only 4.39 kWh/m2 in December. This means that this energy density changes more than seven times depending on the season.
Figure 5 shows changes in the energy density in solar irradiation at the location of the tested photovoltaic installation on selected days of the year.
As can be seen, the lowest values of the energy density of solar irradiation were obtained on December 24, and the highest at the end of May. These values differ up to nine times between each other. The observed change results from both the difference in the duration of the day, in particular the seasons of the year, and the differences in the maximum value of the angle of the sun’s rays. At the location of the tested photovoltaic installation, the length of the day varies from about 7 to 17 h, and the height of the sun above the horizon changes from about 12° during the winter solstice to about 59° during the summer solstice. In the tested photovoltaic installation, the panels are positioned at an angle of 35° in relation to the horizon line. Therefore, the maximum angle of incidence of the sunlight on solar panels varies from 47° in winter to 94° during the summer solstice.
Figure 6 presents the computed (line) and catalogue data (points) dependencies of the energy efficiency of the inverter on output power.
It is easy to observe that the computation results and the catalogue data fit well. The average value of the difference between them is less than 0.002. The energy efficiency is an increasing function of the inverter output power. Its maximum value is equal to 97%. At low output power, a lower value of energy efficiency, equal even to 85%, is observed.
In the analyses of the considered photovoltaic installation, the classical case was considered when the load of this installation was the power grid, which consumes all the electricity generated. Therefore, the impact of the island inverter and the battery bank on the installation operation was ignored. Of course, the performance of the installation under consideration depends on the weather conditions and the season.
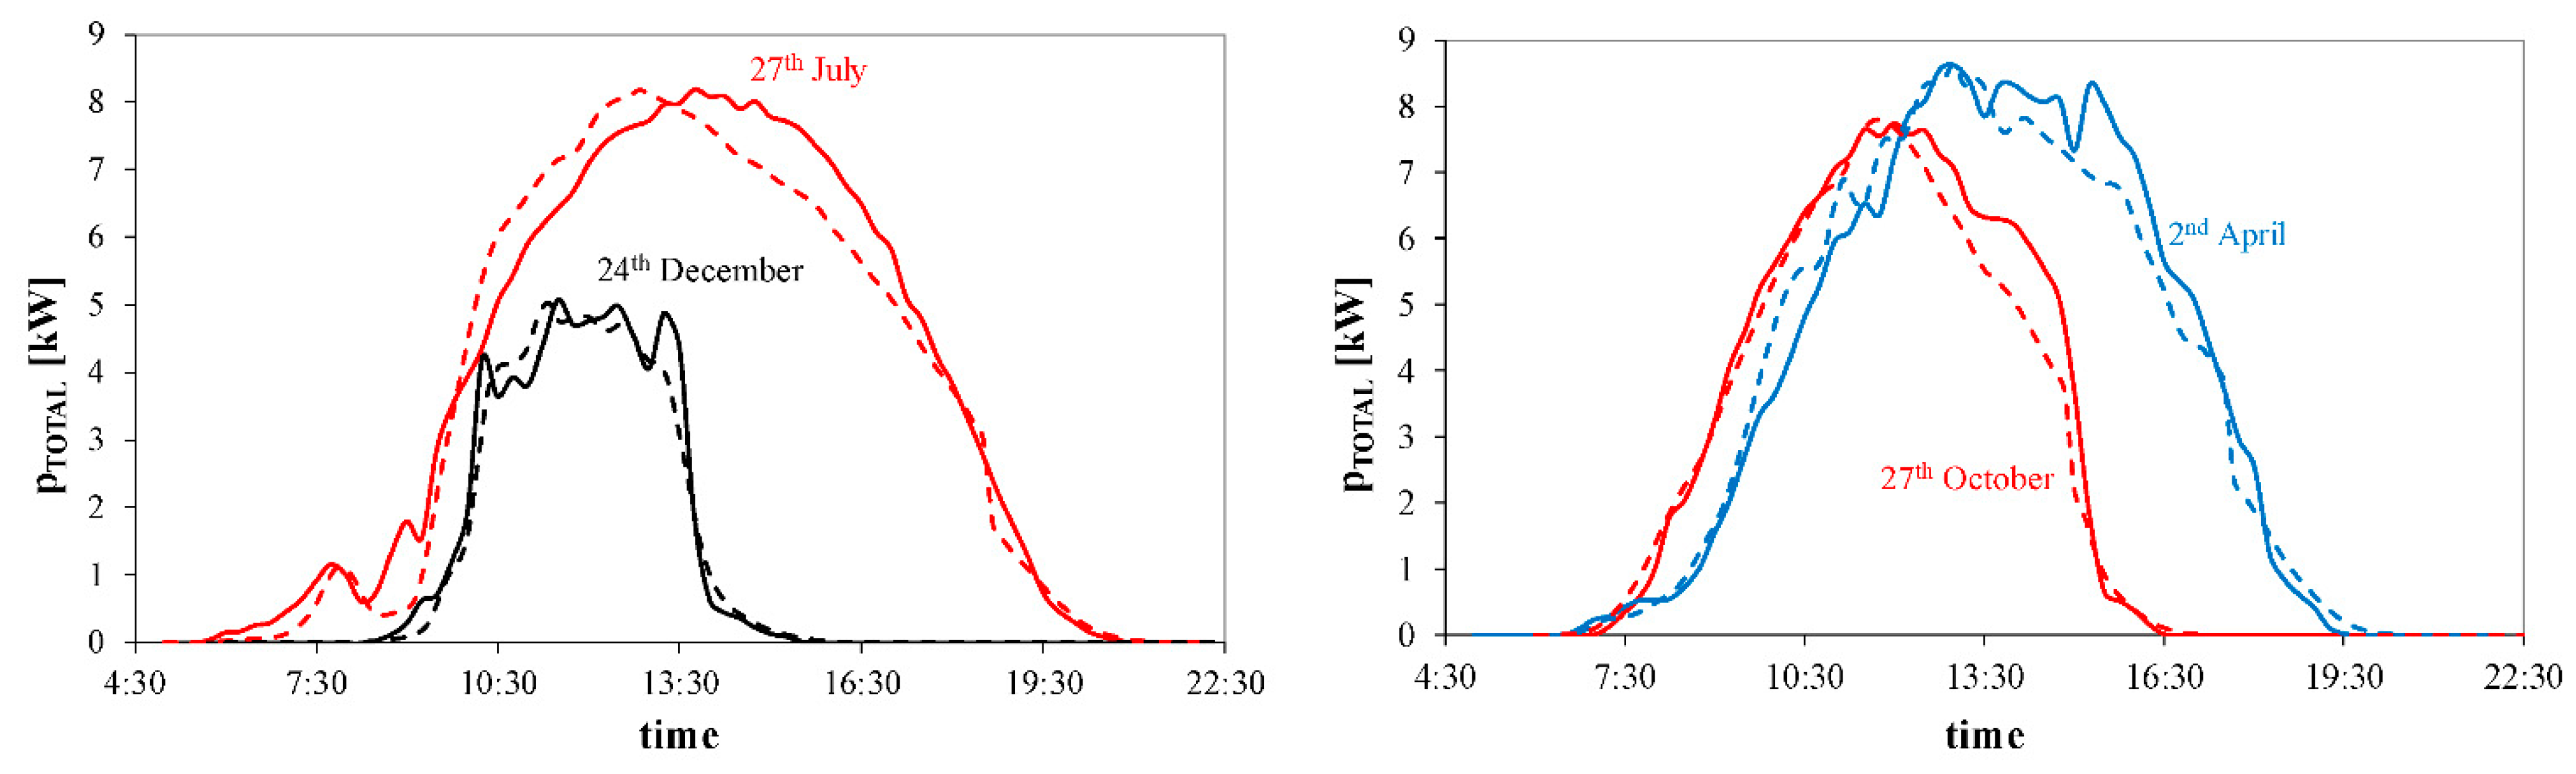
Figure 7 shows the computed (dashed lines) and measured (solid lines) waveforms of the total electrical power
PTOTAL produced by the investigated photovoltaic installation. The investigation results correspond to the selected days of the year.
As is visible, the shape of the presented waveforms
PTOTAL(
time) is similar to the waveforms
Pe(
time) shown in
Figure 4. Particularly, it is worth noting that the maximum value of the
PTOTAL exceeds even 8 kW in the period between April and October, whereas in December it is much lower and is equal to only 5 kW. This maximum is typically observed at sunny noon. Additionally, the time intervals in which the energy is produced depend on the time of sunrise and sunset. After the integration of the presented waveforms, one can obtain the value of the energy produced each day. In the period from April to August, the considered installation produces about 60 kWh daily, whereas in December and January, this installation produces only about 20 kWh daily. The differences between the results of measurements and computations are acceptable. The standard deviation of the differences between these results is less than 560 W. The value of this standard deviation is lowest for the data corresponding to 24 December and highest for 27 October.
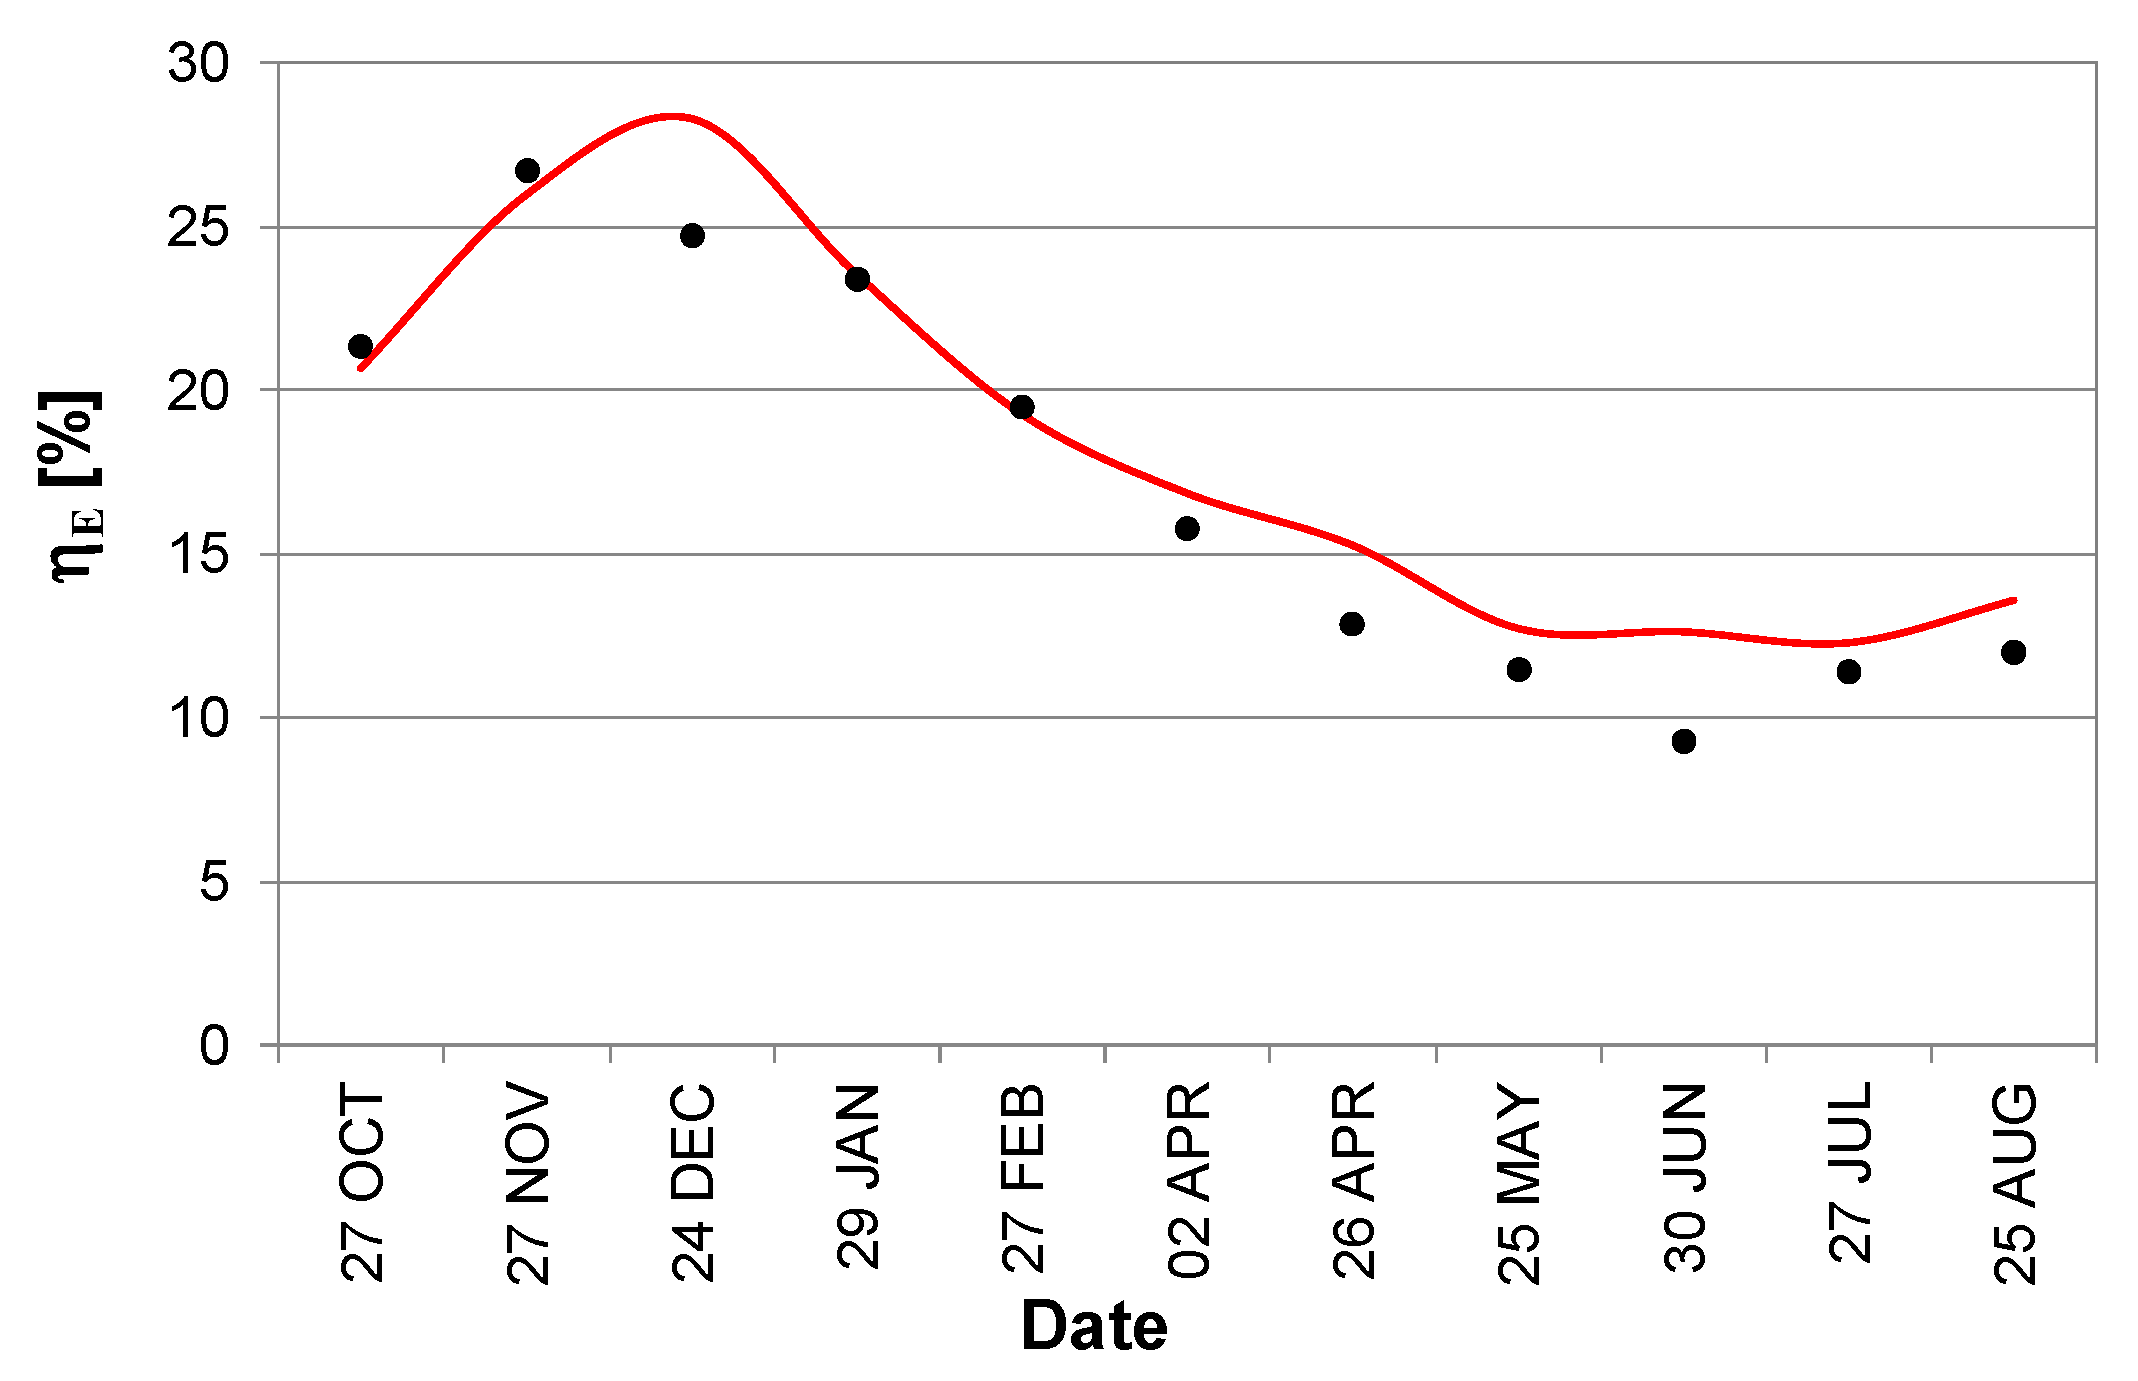
For photovoltaic installations, it is very important to obtain a high value of energy efficiency. Such energy efficiency depends on both the energy efficiency of photovoltaic conversion and the energy efficiency of power converters. In
Figure 8, the computed (line) and measured (points) values of the energy efficiency
ηE of the conversion of solar energy into electrical energy with the use of the investigated photovoltaic installation are compared. This efficiency was calculated for selected days using the following formula:
As can be observed, the values of
ηE change visibly within a year. The lowest values of
ηE are equal to just 9% and are observed at the end of June, in contrast to the highest value of this parameter observed at the end of November equal to 27%. This means that the investigated installation is characterized by the highest value of energy efficiency in autumn and winter, whereas this parameter is lowest in spring and summer. The observed dependence could be a result of an increase in the internal temperature of the photovoltaic panels in spring and in summer, which causes a decrease in voltage on the panels and, consequently, a decrease in the value of the electrical power produced [
38,
40]. This causes a decrease in the energy efficiency of photovoltaic panels in summer and an increase in winter. The standard deviation of the differences between the results of measurements and computations is equal to 1.84%.
Figure 9 presents the computed waveforms of the internal temperature of the photovoltaic panels used on selected days.
As is seen, values of the internal temperature of the photovoltaic panels used visibly change over a day and across the seasons of the year. The maximum values of Tj temperature are observed at noon in winter and in the afternoon in summer. In winter, this temperature increases mostly as a result of the self-heating phenomenon, whereas in summer, it is a result of the absorption of the infrared irradiation emitted by the sun. The daily changes in temperature Tj that occur are less than 10 K in winter and about 40 K in summer. It is worth emphasizing that due to the differences in the values of ambient temperature, the maximum values of Tj on both considered days even exceed 50 K.
6. Conclusions
This article describes the SPICE models of the components of an actual photovoltaic installation. These models take into account thermal phenomena. Particularly, the electrothermal model of photovoltaic panel chains and the model of the inverter are proposed. With the use of the formulated models, it is possible to compute waveforms of electrical quantities such as voltage and current of the photovoltaic panel chains and the output voltage of the inverter. Additionally, it is also possible to compute the internal temperature of photovoltaic panels at selected values of the ambient temperature and selected weather conditions. Parameter values of the models can be estimated on the basis of the data published by the producers of components of the investigated photovoltaic installation.
Characteristics of selected components of the investigated photovoltaic installation were computed using the proposed models and SPICE software. In order to investigate the influence of daily and seasonal changes in solar irradiation on the properties of this installation, computations of the waveforms of power generated by this installation on selected days were performed. The results of these computations were compared to the results of measurements. Such investigations were performed for the photovoltaic installation situated in Gdynia Maritime University, Poland. The results of these investigations show the usefulness of the elaborated models and their accuracy in describing both the electrical and thermal properties of the investigated installation.
The results of the present investigation show the considerable influence of weather conditions, as well as daily and seasonal changes in solar irradiation and ambient temperature, on the value of the electrical energy produced. It is also shown that due to changes in the height of the sun, the maximum daily value of produced power can change by even 60%. The influence of thermal phenomena can cause a change in temperature of the panels by even 50 K yearly and 40 K daily. In the summer months, a decrease in energy efficiency of the conversion of solar energy into electrical energy in comparison to winter months is also visible and can even be twofold. These results also prove that thermal phenomena are important in describing the properties of actual photovoltaic installations.
The models of components of the photovoltaic installation proposed in this article and the presented computation and measurement results can be useful for designers of photovoltaic systems. These models can help designers optimize the cooling conditions of the photovoltaic panels used.


