Article

Simulation and Experimental Analysis of Multi-Chamber Arc-Quenching Arresters (MCAA) for 10 kV Transmission Lines

1
Department of Mechanical and Control Engineering, Guilin University of Technology, Guilin 541000, China
2
The Key Laboratory of High Voltage, Department of Electrical Engineering, Guangxi University, Nanning 530004, China
*
Author to whom correspondence should be addressed.
Energies 2021, 14(19), 6185; https://doi.org/10.3390/en14196185
Submission received: 14 July 2021 / Revised: 9 September 2021 / Accepted: 17 September 2021 / Published: 28 September 2021
(This article belongs to the Topic Power Distribution Systems)

Abstract

:
Since conventional lightning protection measures do not effectively extinguish subsequent arcs of electrical frequency after the passage of lightning, it is impossible to prevent lightning-related accidents on the distribution lines. To solve this problem, a 10 kV multi-chamber arc-quenching arrester (MCAA) applicable to transmission lines of different voltage levels is developed. In order to research the arc-quenching characteristics of the MCAA, COMSOL software was used to simulate and analyze the high-speed airflow coupled arc process. Under the action of a strong airflow at high speed, the arc is segmented, the temperature of the arc falls sharply, and eventually, the arc is extinguished. In the simulation process, the conductivity of the arc and the clouds of change of air speed were achieved. It may be concluded that arc segmentation time and airflow generation time are at a subtle level. Meanwhile, an experimental circuit was established to conduct the arc-quenching experiment. A high-speed camera was used to observe the experimental process and the oscilloscope was used to record the arc-quenching waveform. The experimental results show that the MCAA had a good arc-extinguishing effect and that the arc was extinguished within 0.35 ms. The current amplitude of the frequency arc was 1.2 kA.

1. Introduction

In the current power system, the number of trips caused by lightning strikes on transmission lines accounts for 40% to 70% of the total number of trips [1,2,3,4]. The line trip statistics published by the International Conference on Large Power Grids (CIGRE) in 12 countries, including the United States and the former Soviet Union, for three consecutive years showed that the number of lightning strikes accounted for 60% of the total number of trips in transmission lines with voltage levels of 275 kV to 500 kV and a total length of 32,700 km [5,6,7]. Therefore, lightning is the most frequent cause of overhead transmission and distribution lines trip outs in many countries, which have a significant impact on the electric power quality supplied to the customers [8].
At present, lightning protection measures can be divided into “type of blockage” and “type of dredging” depending on the management model [9,10,11,12]. China primarily adopts the “type of blockage” method of lightning protection. Its principle is to make the line flashover, which leads to complicated lightning protection issues. The actual operation data show that the current traditional “Blocking type” lightning protection measures against lightning are not ideal. This is due to the line’s lightning resistance level, ground network resistance, lightning steepness, insulation level, and lightning strike mode factors, lightning intensity exceeds the probability of lightning resistance level, which are uncontrollable factors, resulting in a high probability of insulation impact flashover, and no measures to inhibit the electric frequency arc, resulting in increases in the lightning accident rate, lightning trip rate, and lightning disconnection rate. Therefore, China has installed a large number of line arresters on transmission lines from different voltage levels to improve the lightning resistance level of transmission lines and reduce the lightning trip rate [13,14,15,16]. A line surge arrester application is today a reliable solution thanks to advanced design of the polymer-housed arresters and the performance of the metal oxide technology [17]. However, the heating capacity of the lightning arresters operating in the lines is limited. When high amplitude lightning currents or multiple lightning events occur, the arrester will generate heat accumulation on the surface, and eventually the arrester will be damaged by a severe overload of electrical energy [18,19,20].
In order to effectively prevent lightning accidents caused by lightning flashover, a 10 kV multi-chamber arc-quenching arrester (MCAA) of a suppressing arc-establishing type is developed. The mechanism of the device is that an AC power frequency arc can be guided from the high-voltage electrode to the low-voltage electrode to prevent the insulators from being burned; meanwhile, the gap arc will be intensely forced to stretch and distort, and to diffuse and cool rapidly, and eventually it will be cut off and extinguished by strong airflow. In this paper, an MCAA is introduced; and simulation analysis and experiment results are presented. Furthermore, the application effect of MCAA is analyzed, thus verifying the validity and reliability of MCAA.

2. Structure and Operation Principle of the Multi-Chamber Arc-Quenching Arrester (MCAA)

2.1. Components of the MCAA

Figure 1a shows the developed multi-chamber arc-quenching arresters. As shown in the figure, the MCAA consists of a flash electrode, a main body, a basic interface and multiple arc-quenching chambers. The flash electrode is mainly used to guide the arc into the structure of the arc-quenching chamber. The material of the arc-quenching chamber is made from ceramic material, which can withstand high temperature and high pressure. The arrangement of the arc-quenching chambers shows a spiral structure as a whole. Figure 1b shows the structure of arc-quenching chamber. As shown in Figure 1b, the arc is guided into the arc-extinguishing chamber through the spherical electrode. At this point, the state of the arc is compressed, the pressure in the arc-extinguishing chamber increases abruptly, and the arc-extinguishing air flow acts on the arc longitudinal.

2.2. Arc Energy Destruction Mechanism

Since the energy of the impulse arc increases sharply, the energy of the impulse arc is converted into the energy of the shock wave. The impulse arc is coupled with the airflow in the semi-enclosed space. At the same time, the spiral multi-chamber arc-quenching structure is used to decouple the arc and the airflow. The conductivity of the arc in the arc-quenching chamber drops abruptly, forming multiple points of arc break; the arc power supply channel is cut off and the arc is finally extinguished.
The arc segmentation mechanism analysis process is as follows:
Ideal gas condition equation:
P V = m R T
where, P denotes the pressure in the arc-quenching chamber; V denotes the volume of the arc-quenching chamber; m denotes the gas mass; R denotes the universal gas constant; and T denotes the temperature inside the arc-quenching chamber.
The difference between the Joule heat generated by the arc in the arc-quenching chamber and the energy dissipated by the arc can result in a high pressure in the arc-quenching chamber.
d m c v T + P V = d Q d E
where, cv is the constant volume specific heat of the gas; Q is the energy given to the interrupter by the arc; and E is the energy emitted by the gas through the gas flow outlet.
d Q = K p u a r c i d t
where, uarc and i are the voltage and current of the arc, respectively.
d E = K / K 1 P / ρ α A ρ n v n d t
where, A is the airflow outlet area; and ρ is the arc density.
d P d t = R C v + R K p u a r c i K K 1 · P ρ α ρ n v n A
The rate of change of the pressure inside the arc-quenching chamber increases with the arc energy and decreases with the increase of the airflow outlet area. The energy thrust of the impulse arc advances the process of air generation interruption, while the generation of the impulse arc reduces the exit zone of the airflow, making the arc prone to energy fracture, forming multiple fractures in multiple arc-quenching chambers.

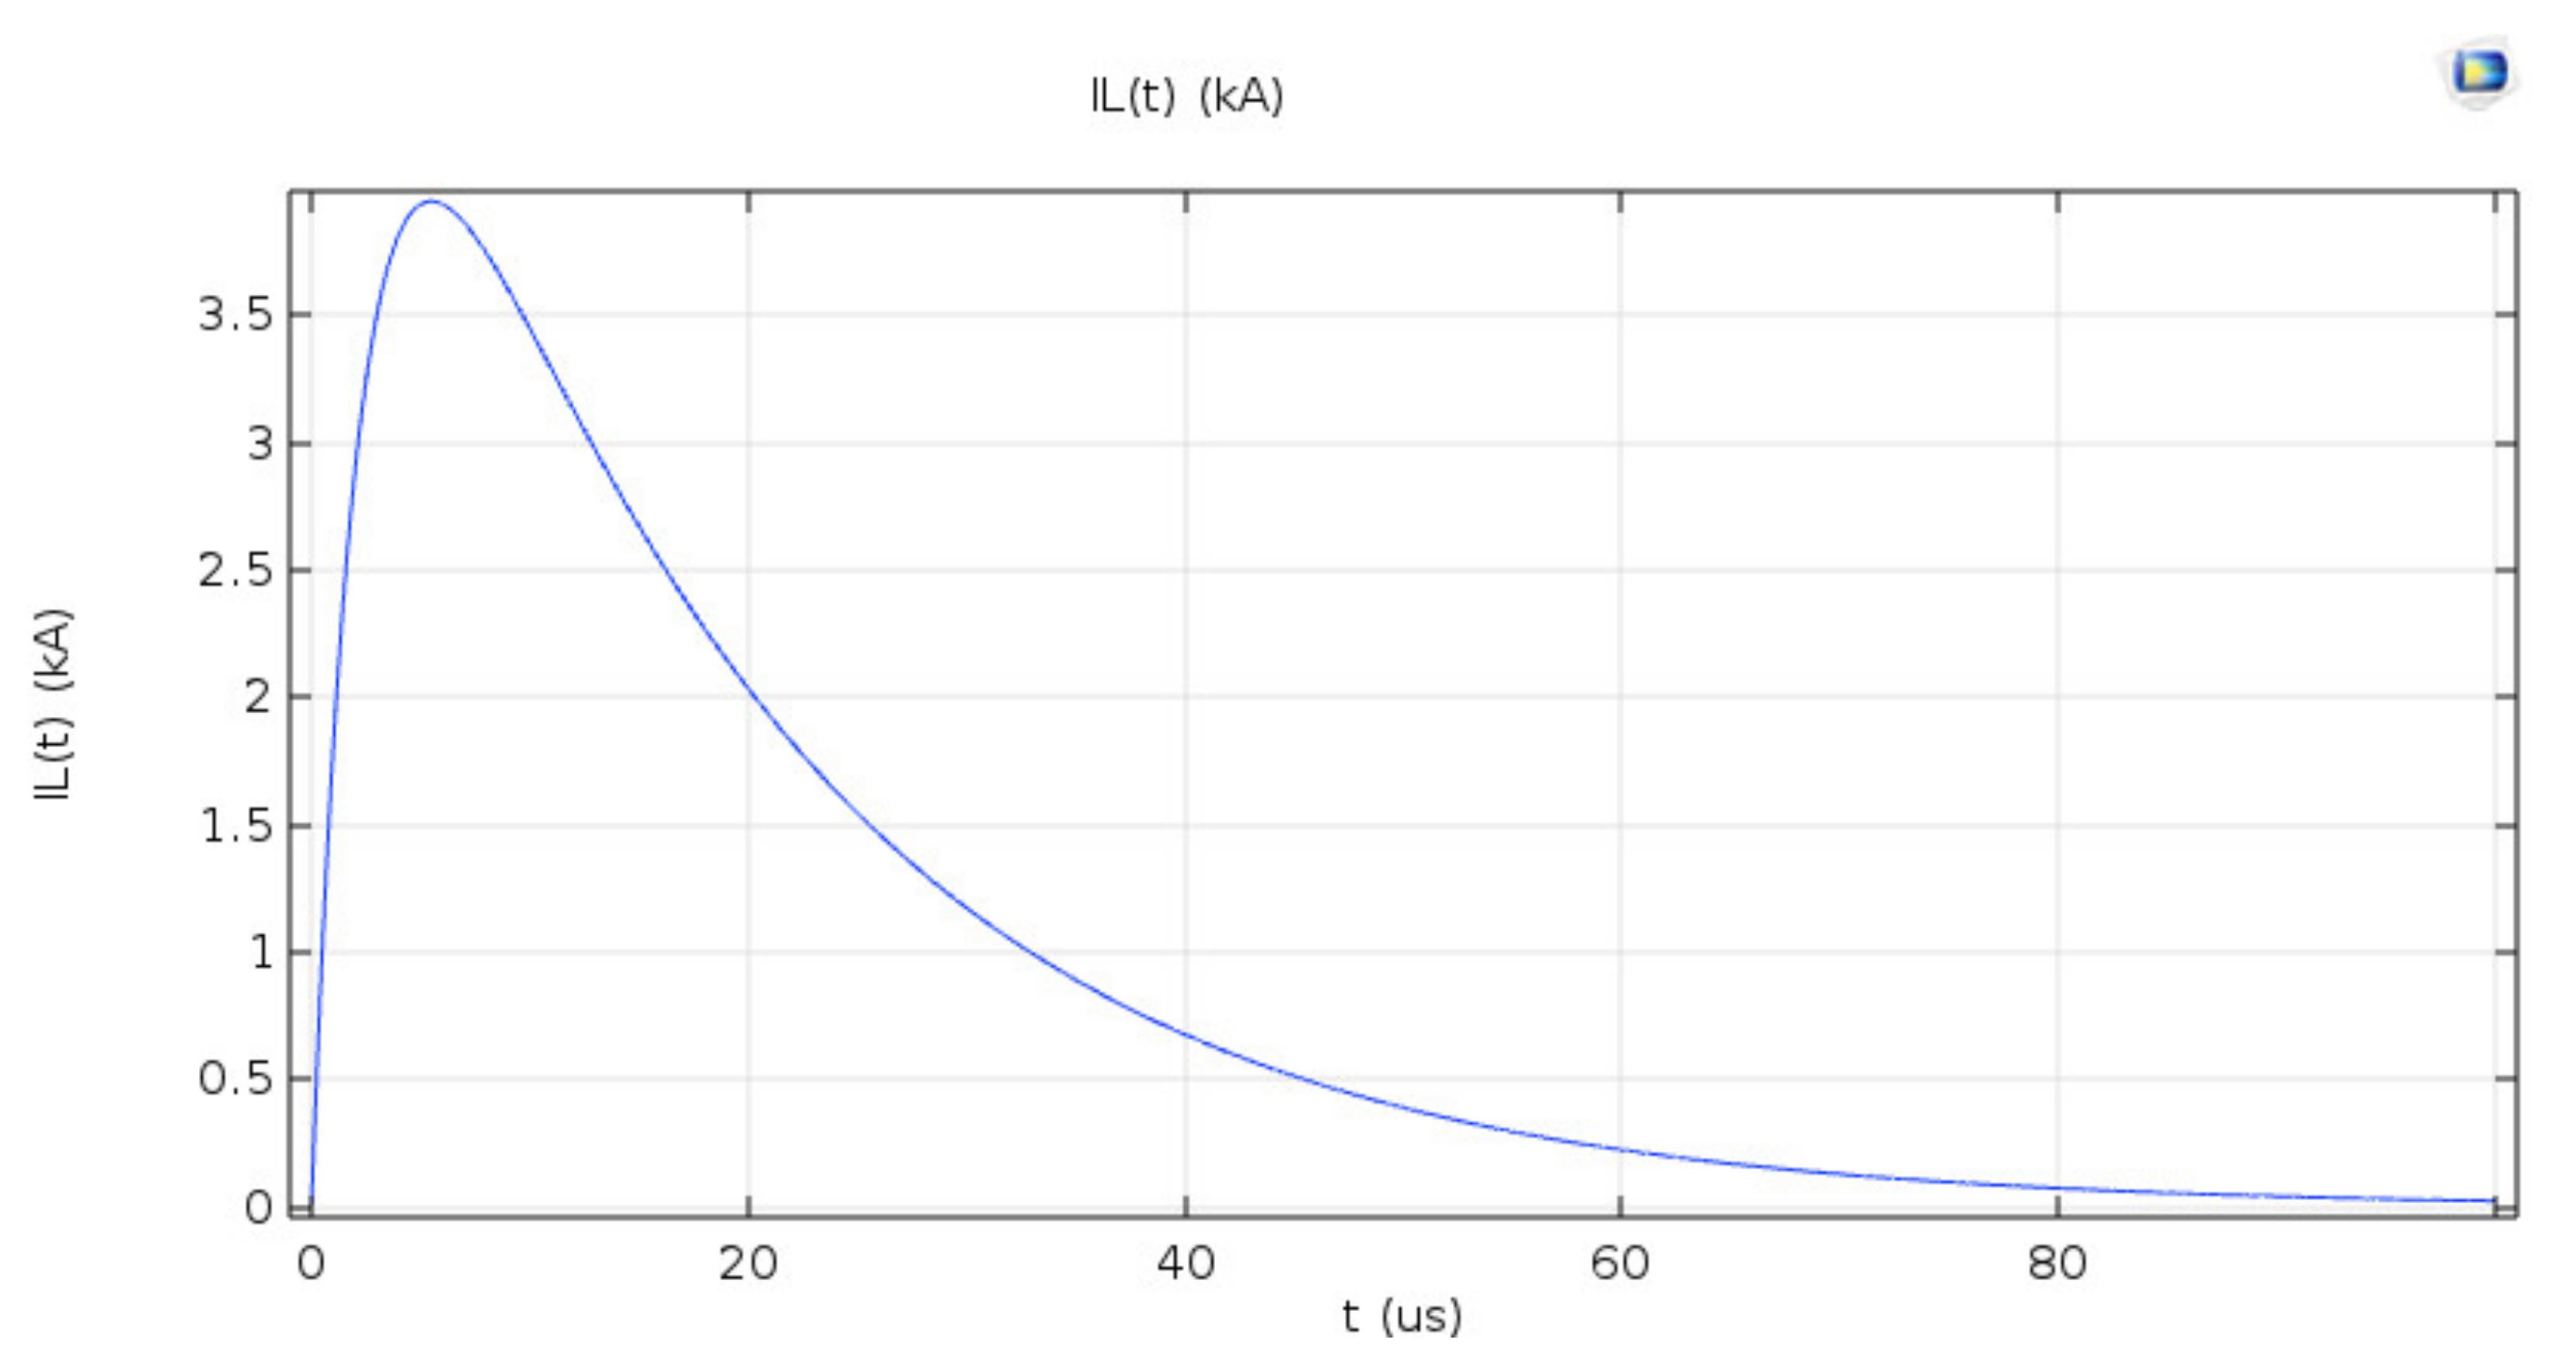
3. Simulation of Arc-Quenching Process in the Impulse Phase

This MCAA uses the energy of the impulse arc to extinguish the power frequency arc, and so it is very important to analyze the transient arc construction stage of the impact arc. This may help in the following arc extinguishing test to assist in the analysis of the gas flow change law and dynamic arc change law during the arc construction stage of the impulse arc. The finite-element method and COMSOL software were used to simulate the arc-coupled airflow process. The change process of velocity and conductivity at key parts was studied to analyze the mechanism of arc-quenching and reignition under the action of airflow.

3.1. Establishing Mathematical Model of Airflow Coupled Arc

The flow control equations are established.
Mass-conservation equation:
ρ t + · ρ u = 0
where, ρ is the density; t is the time; and u is the velocity vector.
Momentum conservation equation:
ρ u t + ρ u · u = · [ p I + μ u + u T ] + J × B
where, p is the pressure; I is the unit matrix; μ is the kinetic viscosity coefficient; J is the current density; and B is the magnetic induction intensity.
Energy conservation equation:
ρ C p T t + ρ C p u · T · k T = T 5 k B T 2 q T · J + E · J + Q r a d
where, T is the temperature; k is the thermal conductivity; E is the electric field strength; kB is the Boltzmann coefficient; q is the electron charge; Cp is the specific heat capacity at a constant pressure; and Qrad is the radiation source term. The arc energy loss includes enthalpy transfer, joule heating, and net loss of volume radiation.
Arc radiation equation:
Q r a d = 4 k α T 4 T 0 4
where, α is the absorption coefficient; and T0 is the ambient temperature.
Gas equation of state:
p = β ρ R T
where, β is the gas state correction coefficient; and R is the gas constant.
Current conservation equation:
· σ · ϕ = 0
where, ϕ is the electric potential.
Magnetic field equation:
× A = B
where, A is the magnetic potential.
Initial conditions and boundary conditions:
The initial temperature of the arc hardening chamber shall be fixed at 300 K. Figure 2 shows the simplified model of arc-quenching chamber. As shown in the Figure 2, the walls of the arc-quenching chambers are non-slip and insulated. The output pressure is adjusted to the standard atmospheric pressure. The left side of the arc-extinguishing chamber is the entrance of the arc, and the right side of the arc-extinguishing chamber is the exit of the arc. The high-voltage electrode (anode) is on the left, and cathode is on the right. The current density J1 is added to the high-voltage electrode (anode):
J 1 = J exp b r 2 + z 2 m a x
where, Jmax and b are both constants.
The boundary conditions of the high-voltage electrode (anode) should satisfy the following equation:
n · k T = Q b
Q b = J · n φ
The boundary conditions of the low-voltage electrode (cathode) should satisfy the following equation:
Q b = J e l e c Φ + J i o n V i o n
Meanwhile, it should satisfy Formula (9).
The constant pressure thermal capacity, the dynamic viscosity, the electrical conductivity and the thermal conductivity of the arc curves with the temperature obtained during the simulation are shown in Figure 3, respectively. These adjusted curves are obtained from the original data of the real trials. As shown in Figure 3, the constant pressure thermal capacity, dynamic viscosity, electric conductivity, and thermal conductivity of the arc are assumed to be the only dependent variables for a single temperature variable. Figure 3a shows the arc constant pressure thermal capacity curves with temperature, Figure 3b shows the dynamic viscosity curves with temperature, Figure 3c shows the electric conductivity curves with temperature and Figure 3d shows thermal conductivity of arc curves with temperature.

3.2. Geometric Modeling

The arc-quenching unit structure is established in Figure 4. Meanwhile, two observation points (A, B) are set up in the structure. The unit structure consists of an arc-quenching chamber, and the entire arc-quenching chamber structure is cylindrical. As the entire arc-extinguishing chamber is a symmetrical structure, only the one-sided structure should be meshed. In this article, the triangular mesh method is used. This simulation mainly observes the existence and extinguishing process of the arc. According to the purpose of this simulation, the simulation step size is set to 10−6 s.
Figure 5 shows the lightning current waveform in simulation. As shown in Figure 5, the lightning current is time-dependent and the lightning current amplitude is 3.9 kA.

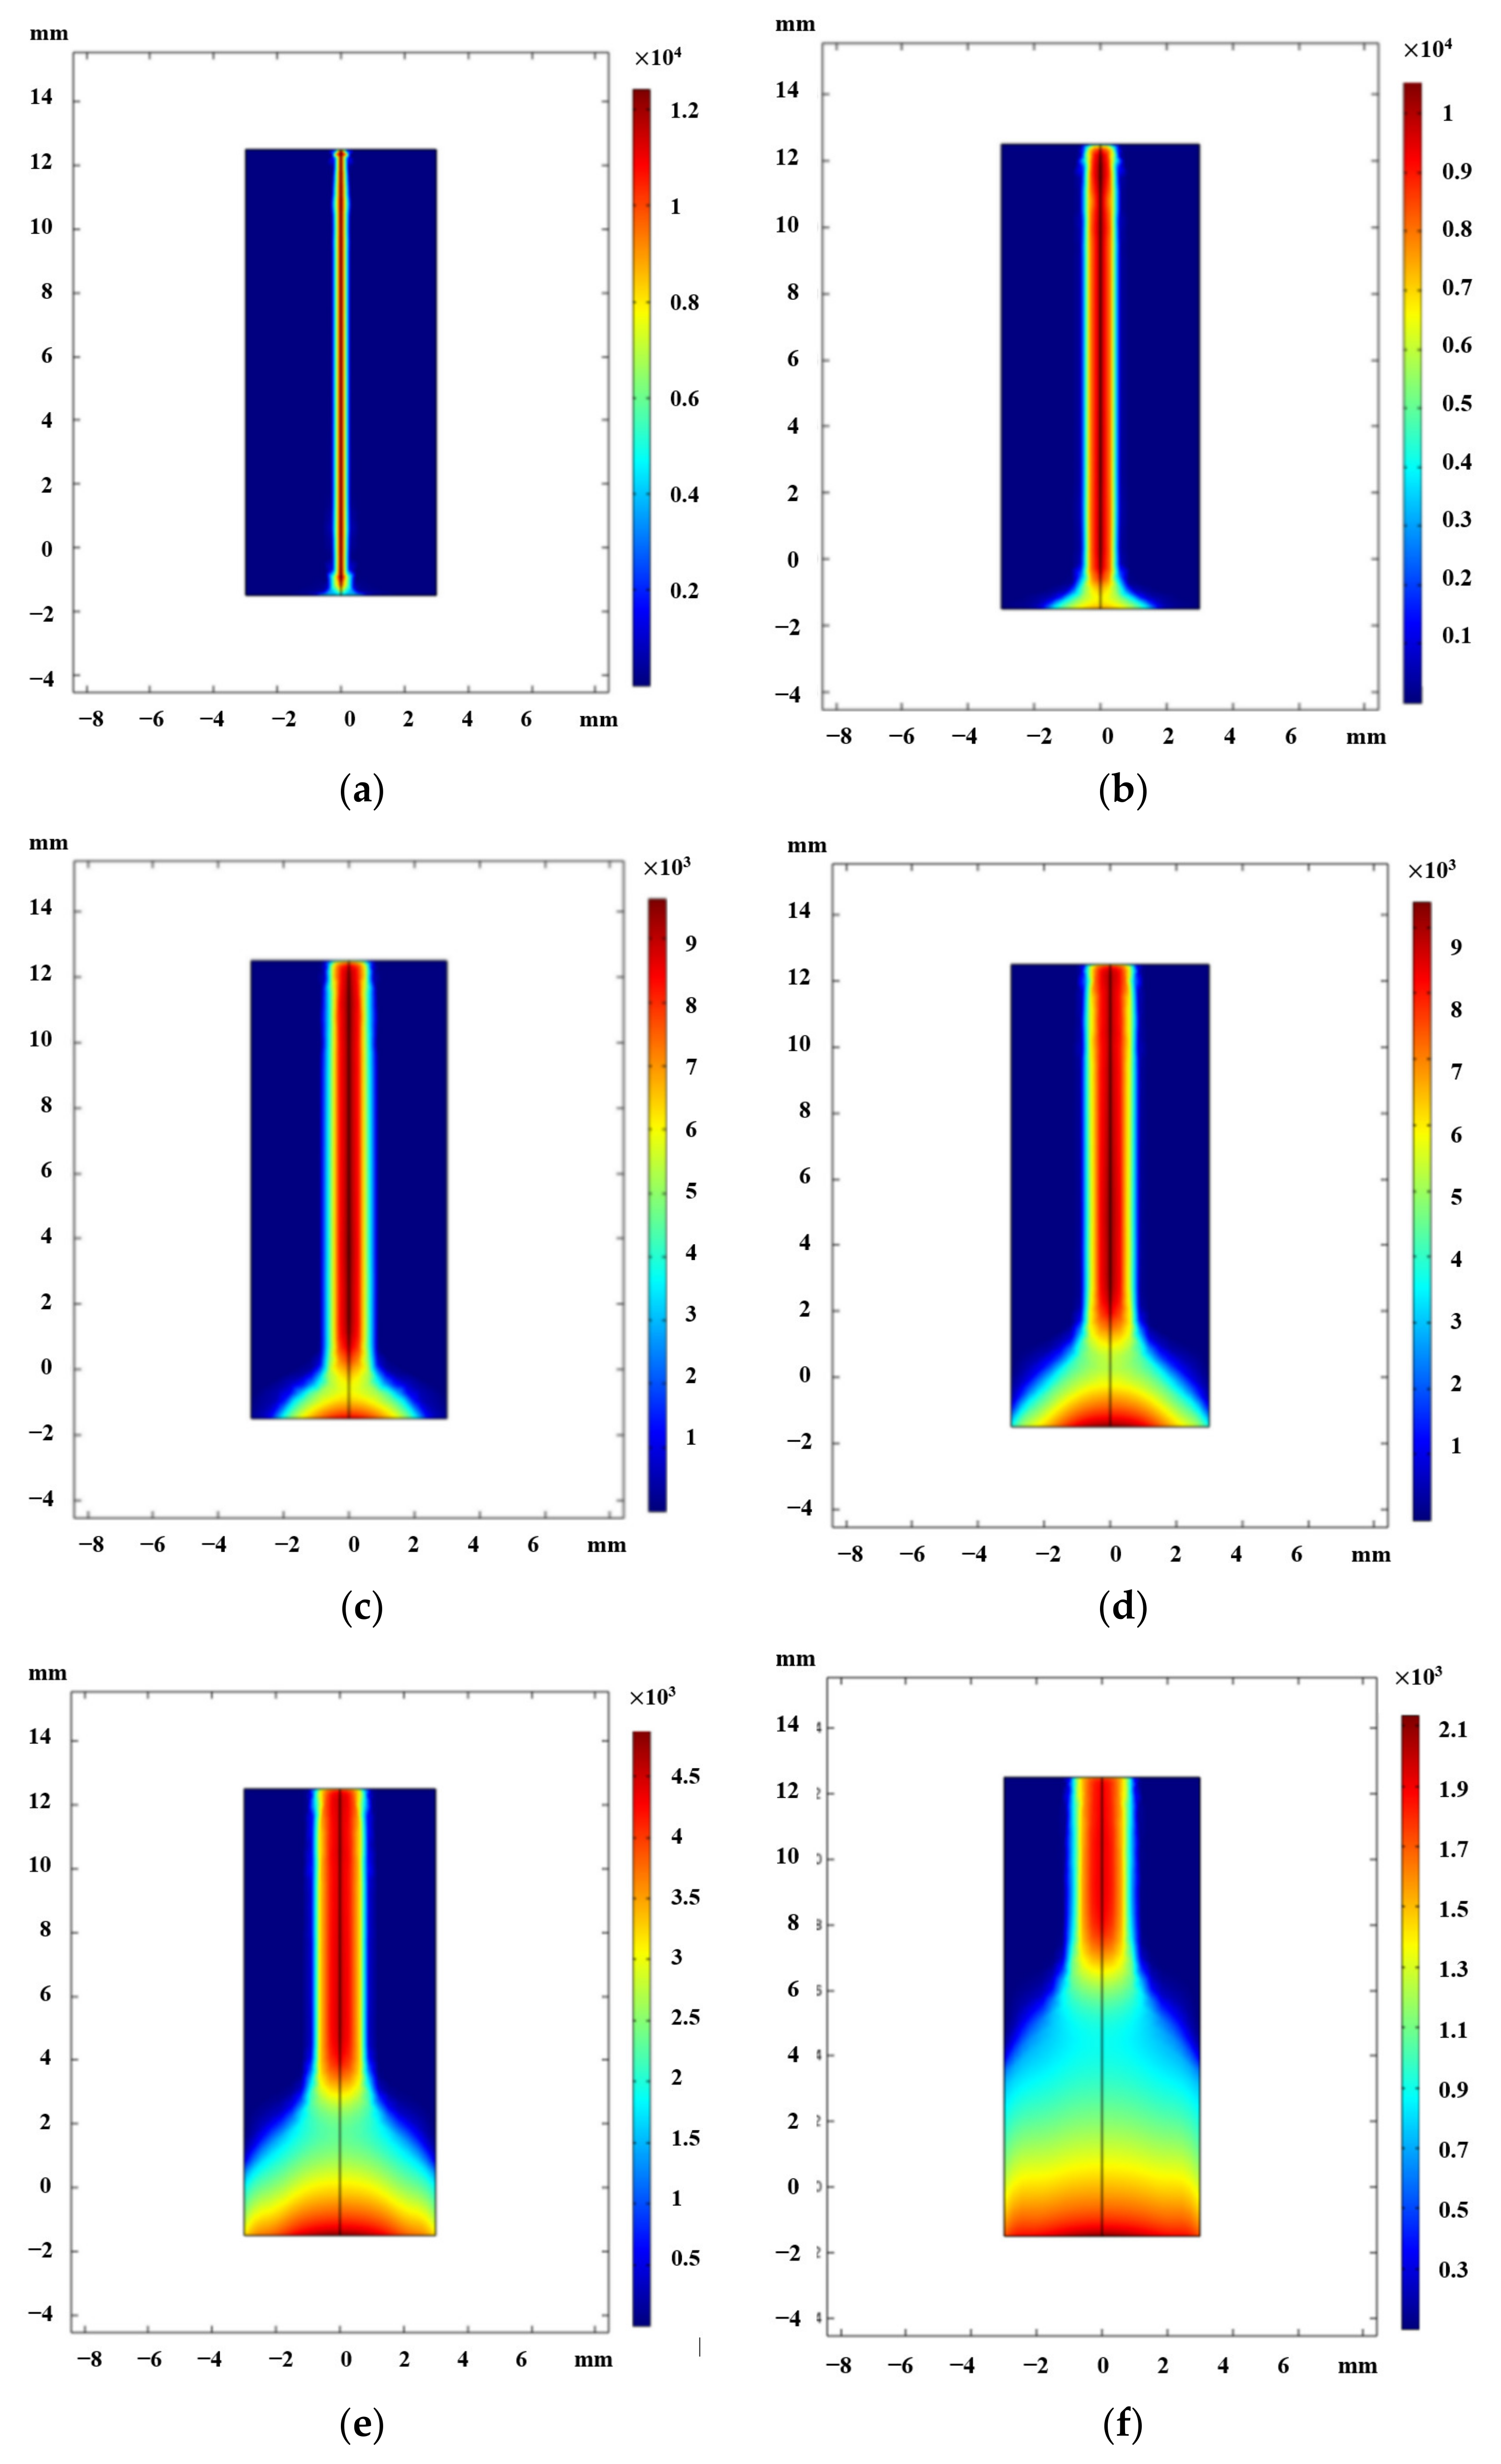
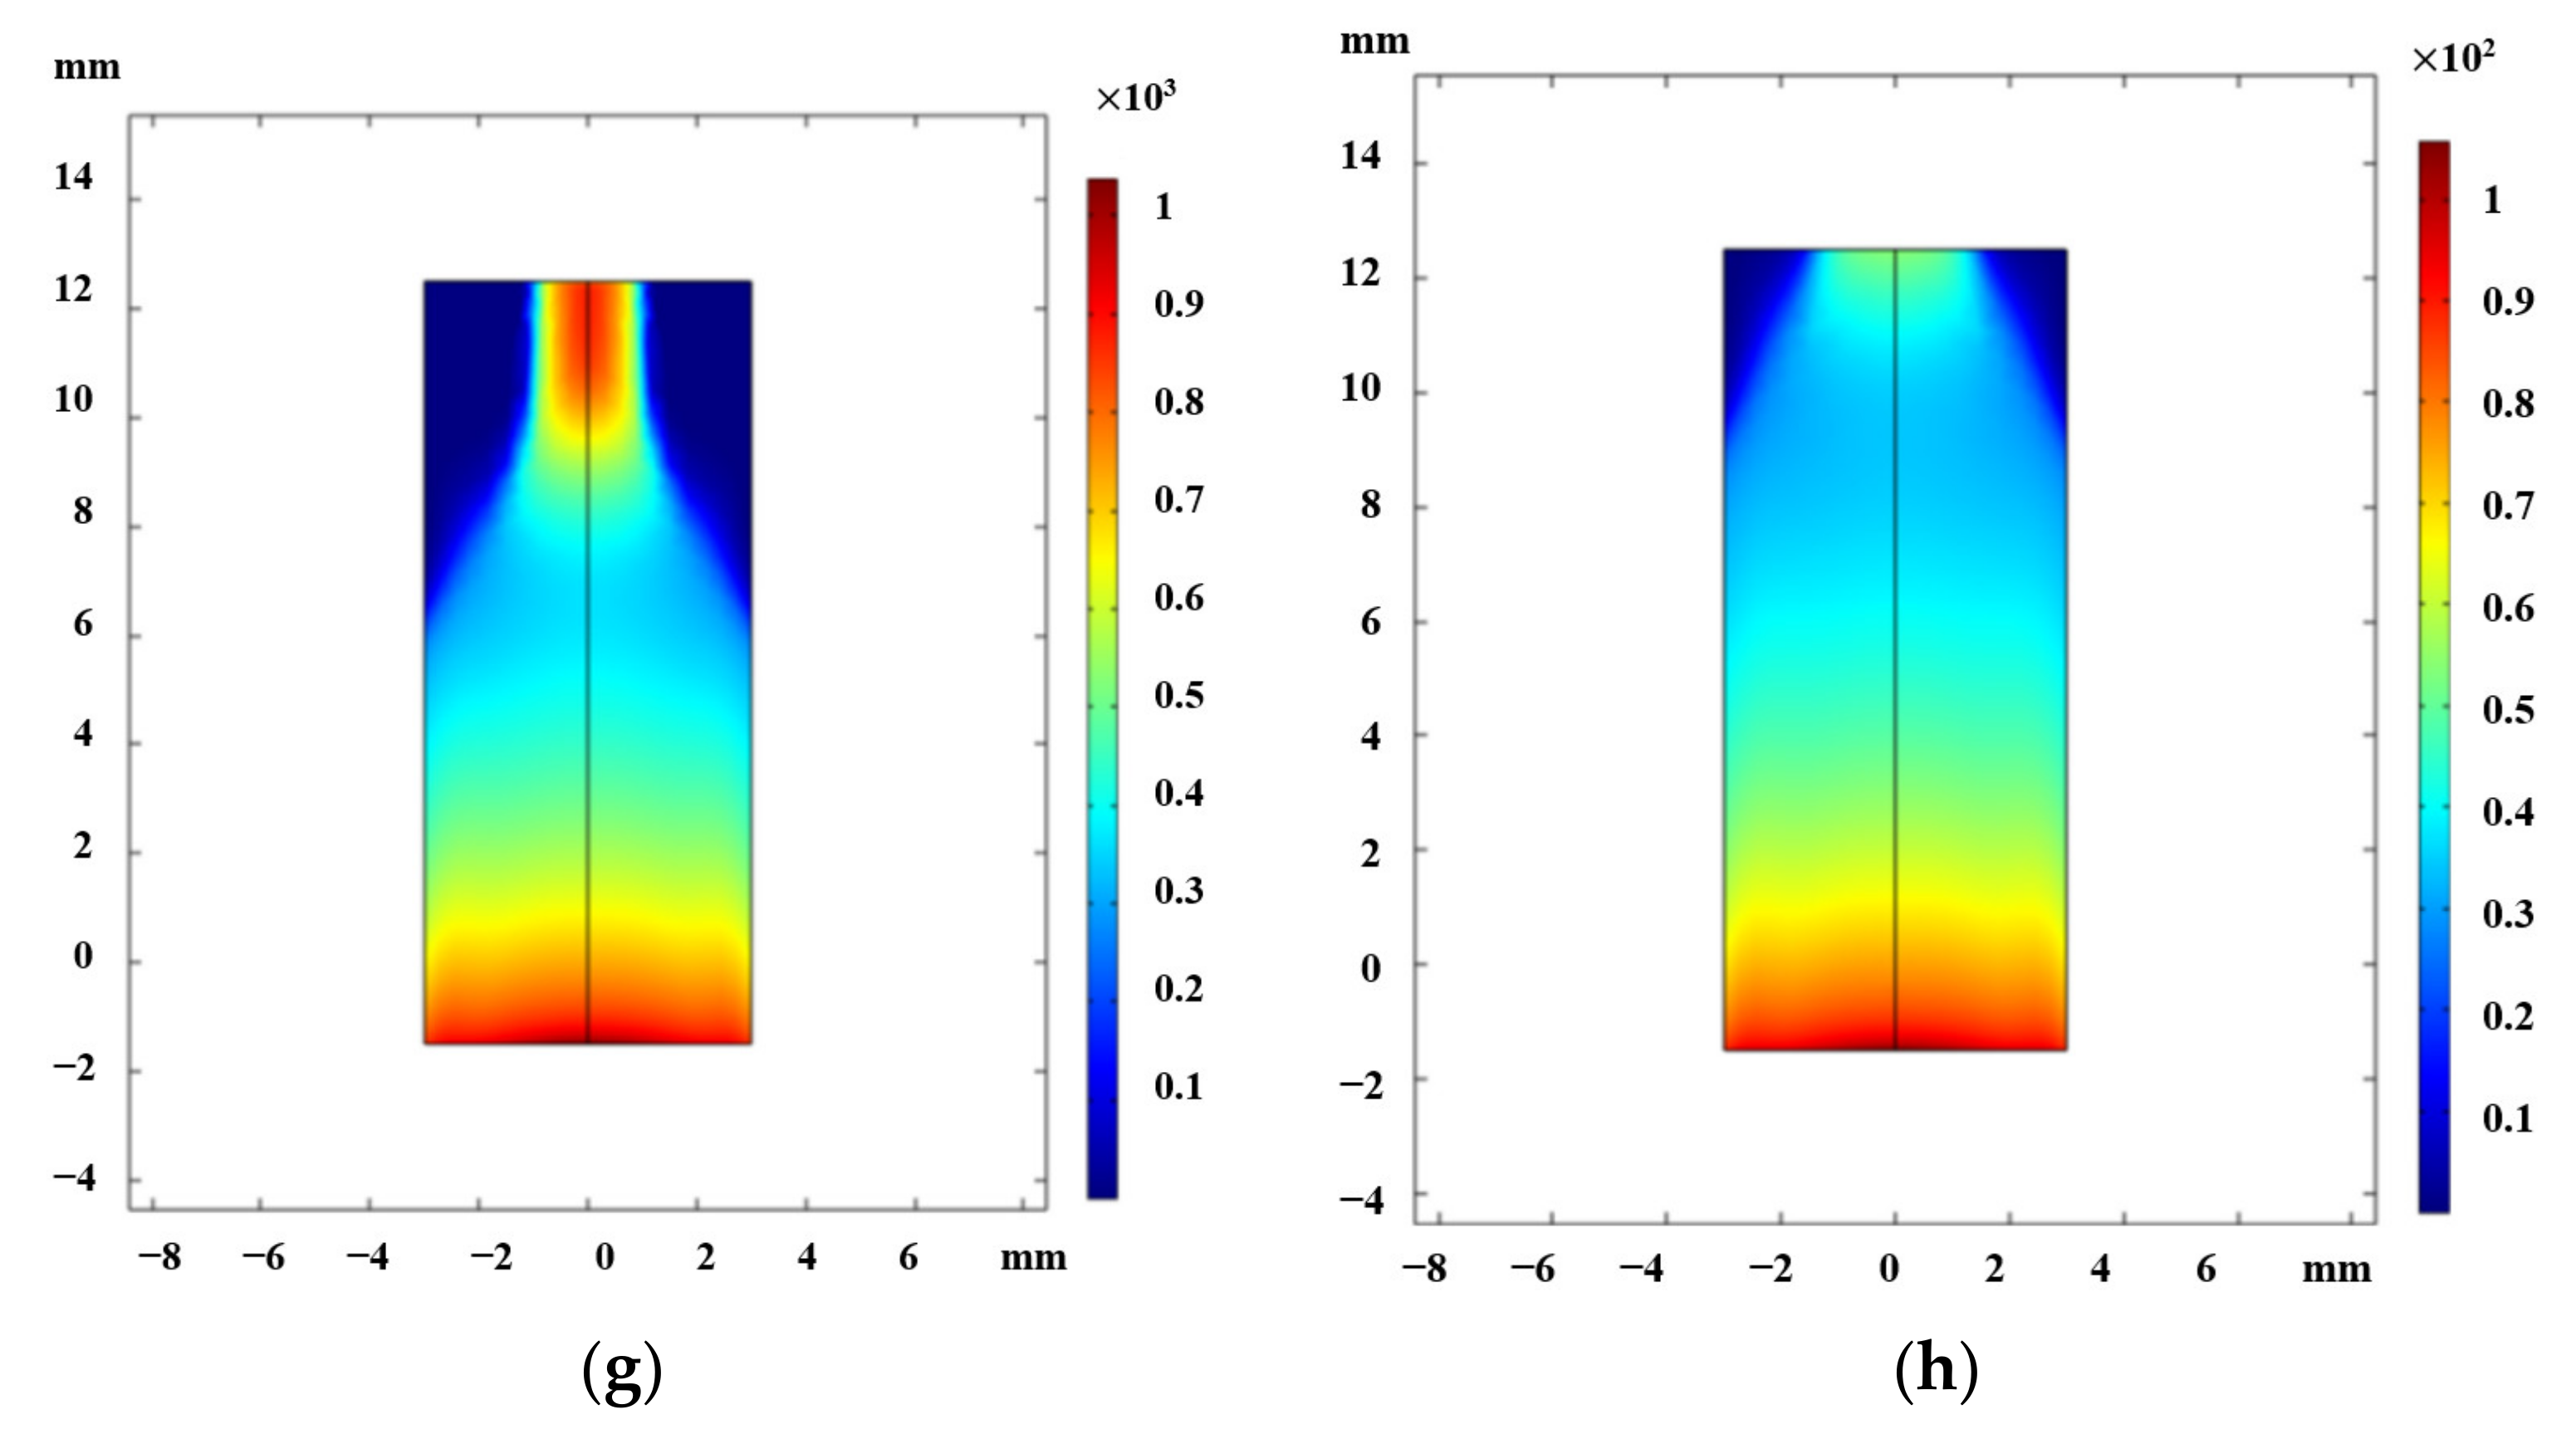
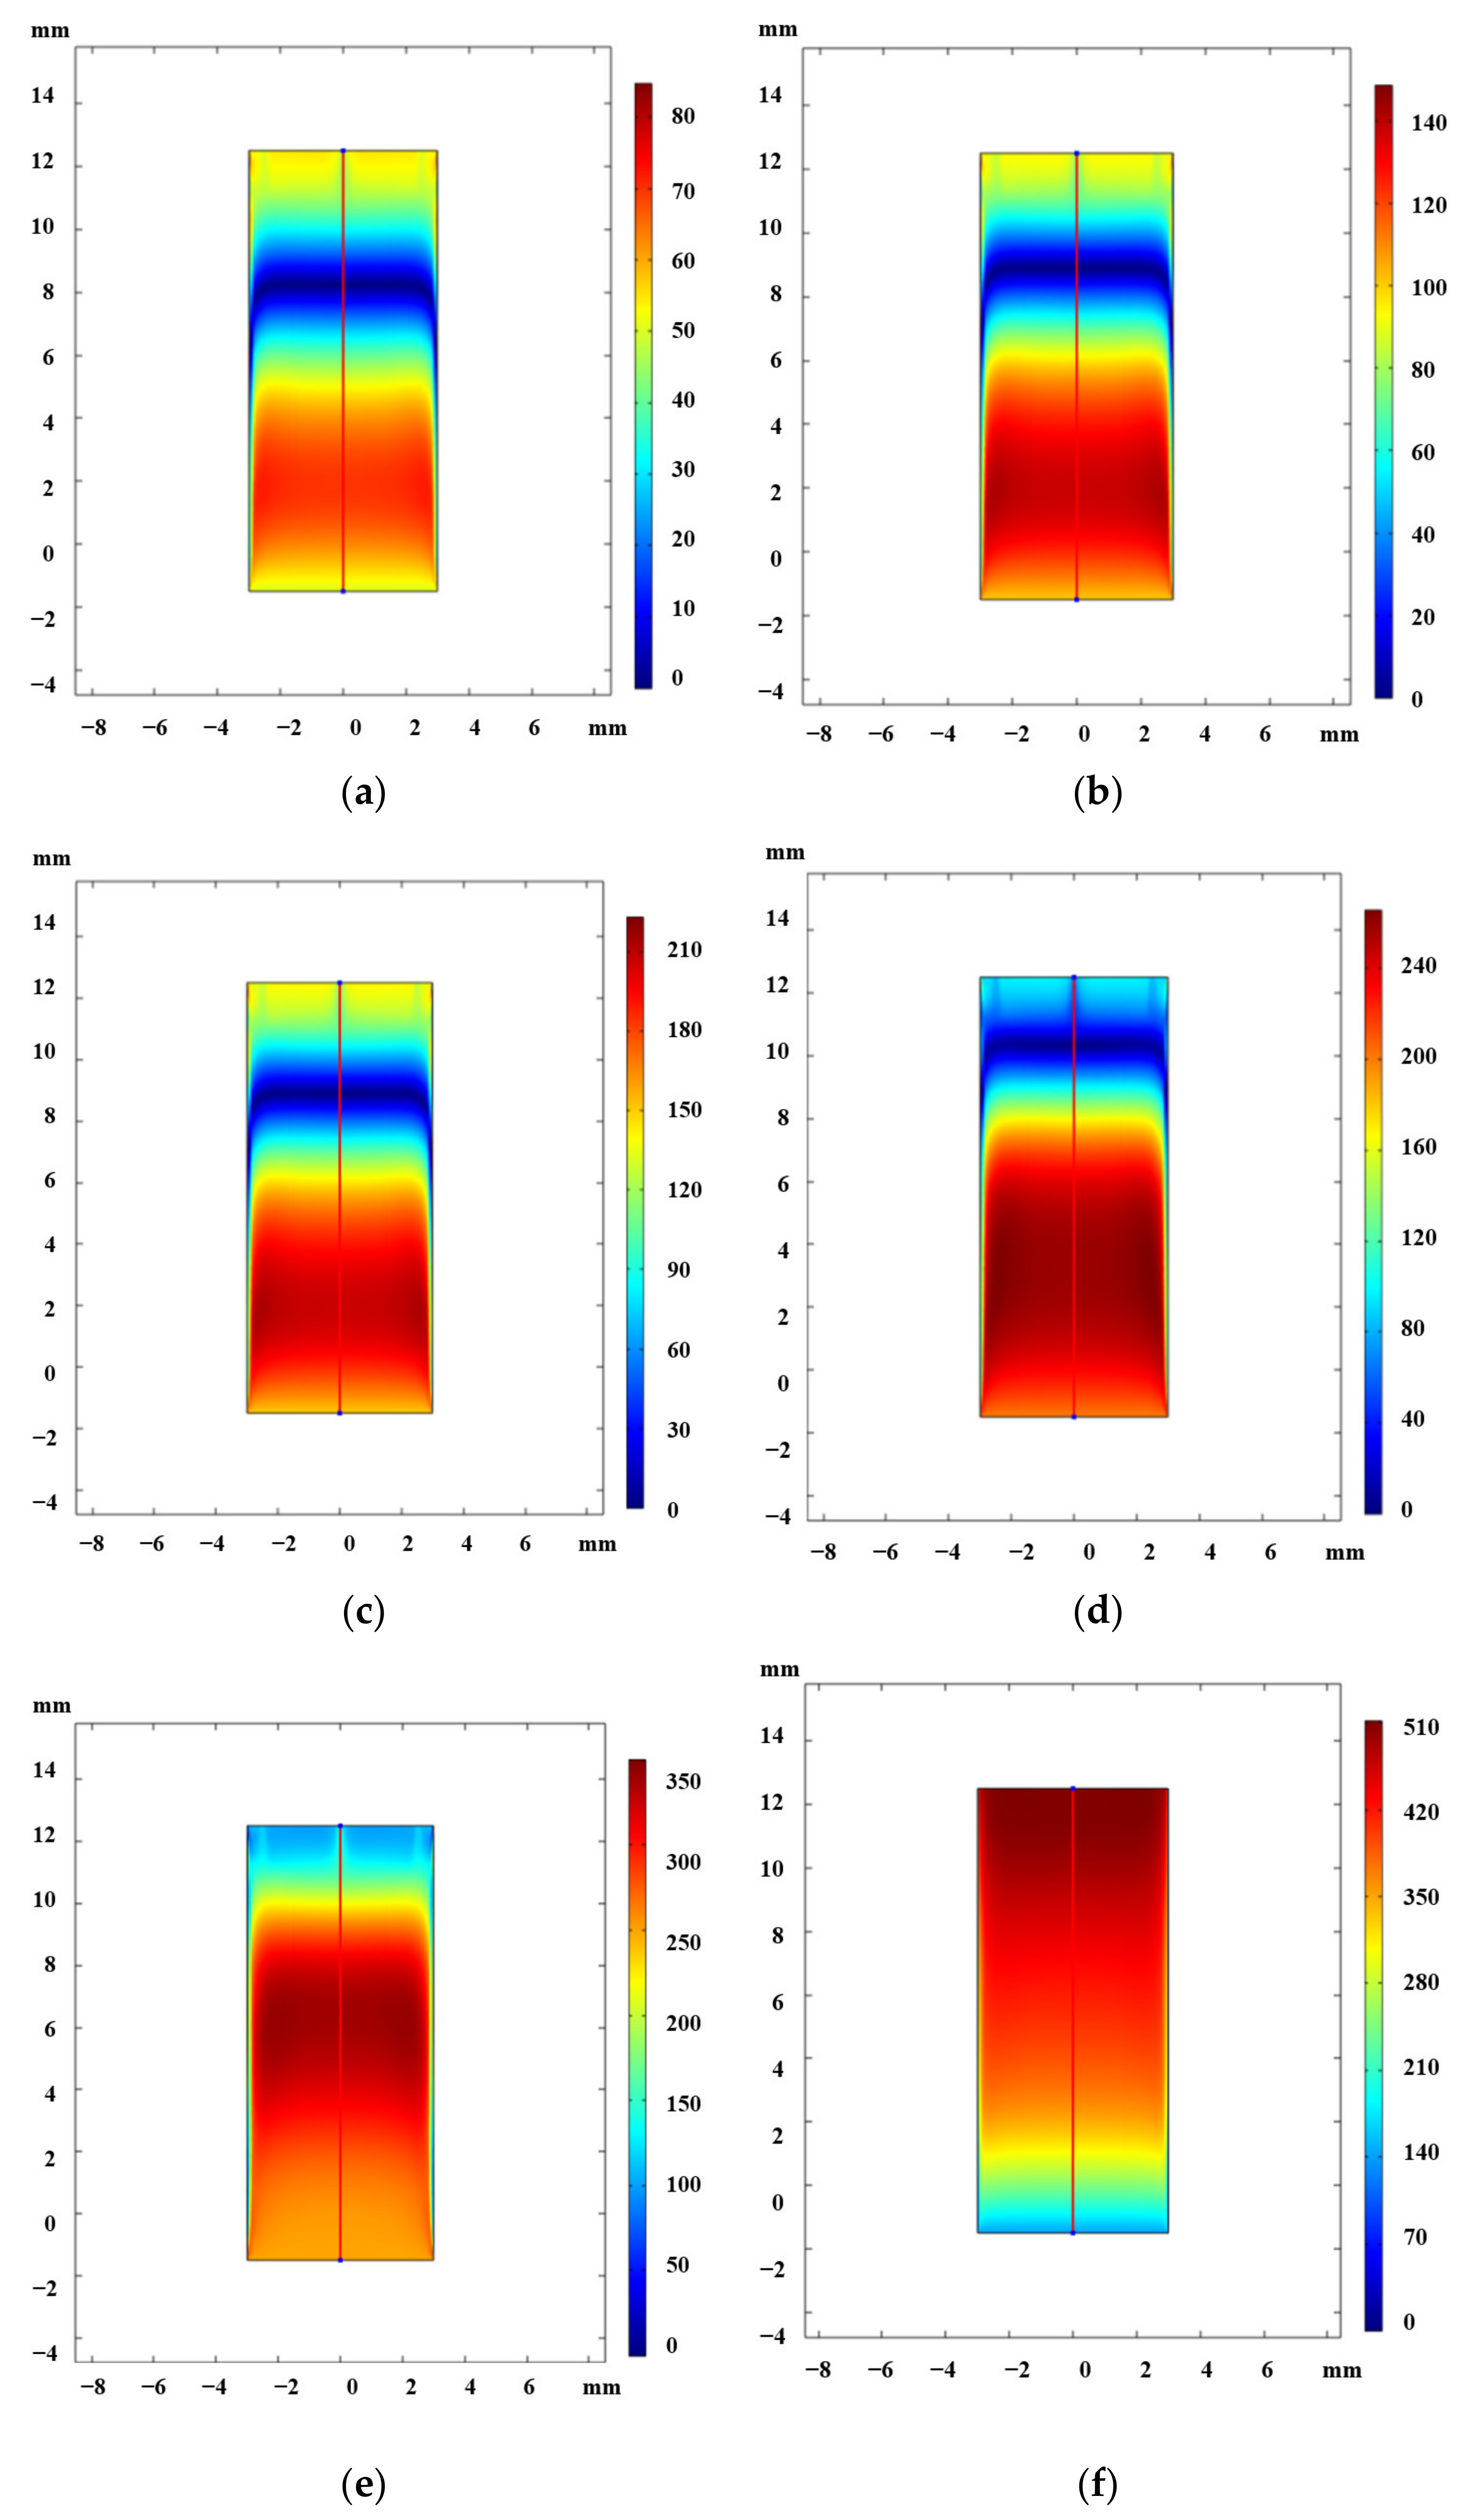
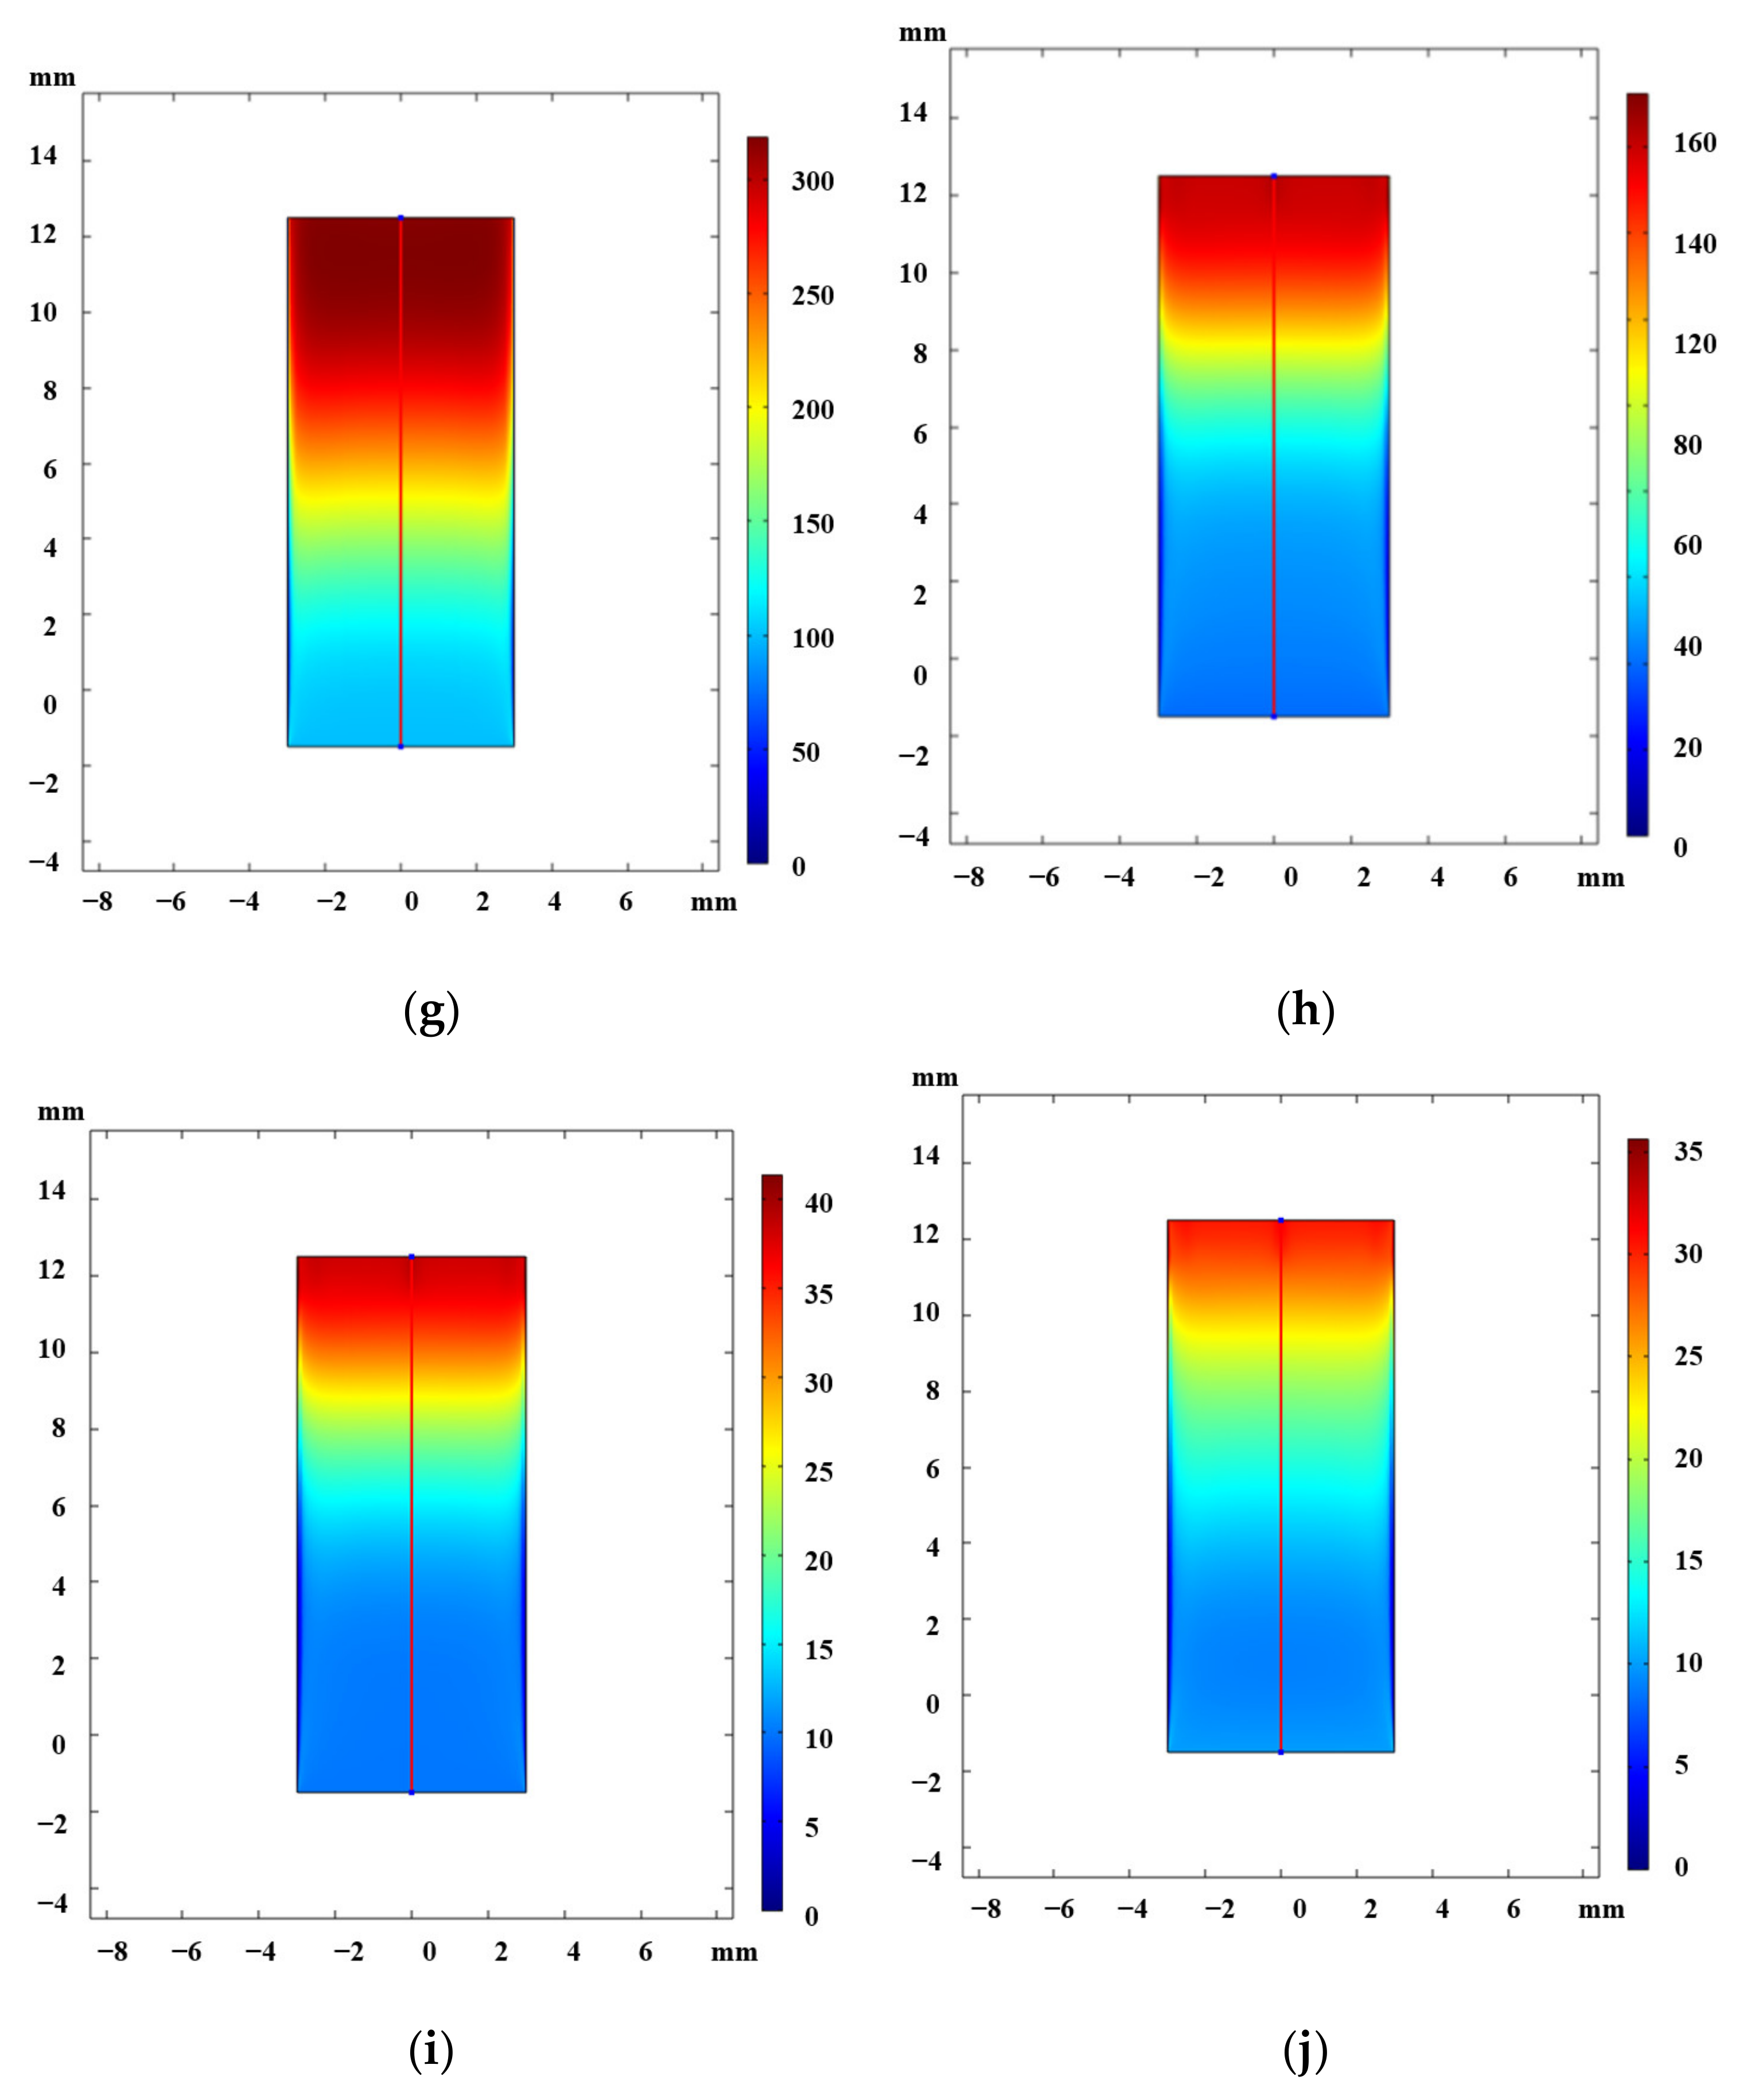
3.3. Simulation Result Analysis

Arc conductivity is an important performance indicator for measuring the arc extinction and the presence of energy breakpoints. Therefore, in this simulation, the performance index is solved by previously established governance equations and cloud diagrams are drawn, which are shown in Figure 6.
From the above clouds of conductivity distribution at different time periods, it can be seen that the conductivity values of the arc in this region are very high because of the high temperature at the center of the impulse arc column. Meanwhile, the initial position of the airflow is at the root of the arc. Under the action of the high-speed airflow, the conductivity of the arc begins to decrease, and point B of the original conductive state shifts into an insulating state, thus forming the arc energy breakpoint. With the development of the shock wave formed by the airflow, it gradually moves to the exit of the arc-quenching chamber, and the number of arc energy breakpoints gradually increases, and finally the arc energy breakage is formed. The arc energy cannot be fully supplied, and the arc is extinguished.
The radius of the arc gradually increases during the time period from 1 μs to 5 μs, and hence the energy of the arc will increase. Near the observation point B, the conductivity begins to change and gradually decreases, when the airflow has just been generated, which can be obtained from the analysis of heat conduction theory. The blue area at the observation point B in the cloud chart increases from 9 μs to 23 μs, indicating that the changed conductivity has significantly dropped and the arc energy breakpoints have begun to form. During this process, the de-freezing effect is strengthened; the positive and negative particles accelerate the recombination, thereby exhibiting the insulating properties from the outside. With the gradual transformation of the arc energy into the energy of the shock wave, the arc is blown out of the arc-quenching chamber as a whole, forming a jet at the exit of the arc-quenching chamber. Meanwhile, the number of arc break points gradually increases, and then an arc fracture is formed. Finally, the conductivity of the arc at observing point A decreases to 40 S/m. At this point, the arc temperature in the modified area is extremely low, and it is possible to determine that the arc has been extinguished.
Due to the compressed arc and heat conduction effect in the arc-quenching chamber, the pressure in the arc-quenching chamber changes, and finally a high-energy compression wave is formed, resulting in a sudden drop in arc conductivity. The generation and development process of the airflow needs to be studied. Therefore, the airflow velocity is an important factor affecting the whole arc-quenching process, so the velocity distribution cloud charts are calculated by simulation software, which are shown in Figure 7.
The impulse arc enters the arc quenching chamber from 1 μs to 6 μs, the energy of the arc and the energy exchange of the surrounding air, the gas is heated and enlarged, resulting in arc elimination. The gas flow velocity gradually increases. During this process, the arc-quenching airflow is generated by the change of pressure in the arc-quenching chamber. The airflow at the furthest end of the outlet began to gain momentum, with the maximum speed reaching 210 m/s. At t = 12 μs, the maximum airflow velocity in the arc-quenching chamber reaches 350 m/s. Meanwhile, most of the charged particles in the arc column are blown out of the arc-quenching chamber, and the arc is under the action of the airflow at this time; by then the arc has formed a breaking point. At t = 15 μs, the maximum speed of the airflow reaches 510 m/s, and the airflow acts on the arc to reach the most efficient moment, forming a strong airflow acting on the arc. As the wall of the arc elimination chamber is made of rigid material, the material will not be deformed under the condition of thermal expansion of the surrounding air, so it will move to the exit of the arc elimination chamber and form a jet to act on the arc. This process will break the arc energy balance structure. Corresponding to the electrical conductivity cloud charts, the arc will break at this time, and the arc energy supply channel will be cut off. After this period of time, the pressure in the arc-quenching chamber gradually decreases, and the generated arc-quenching airflow speed also decreases. However, the arc-quenching airflow will not suddenly disappear, but will slowly drop, still blowing the arc. The arc column was completely ejected from the arc-quenching chamber. During this process, the arc breaking point continues to expand; the arc energy supply channel is cut off, and the arc cannot burn stably. Subsequently, in the period of time from 18 μs to 27 μs, the speed of the air begins to decrease, which means that the energy of the arc has begun to disintegrate.

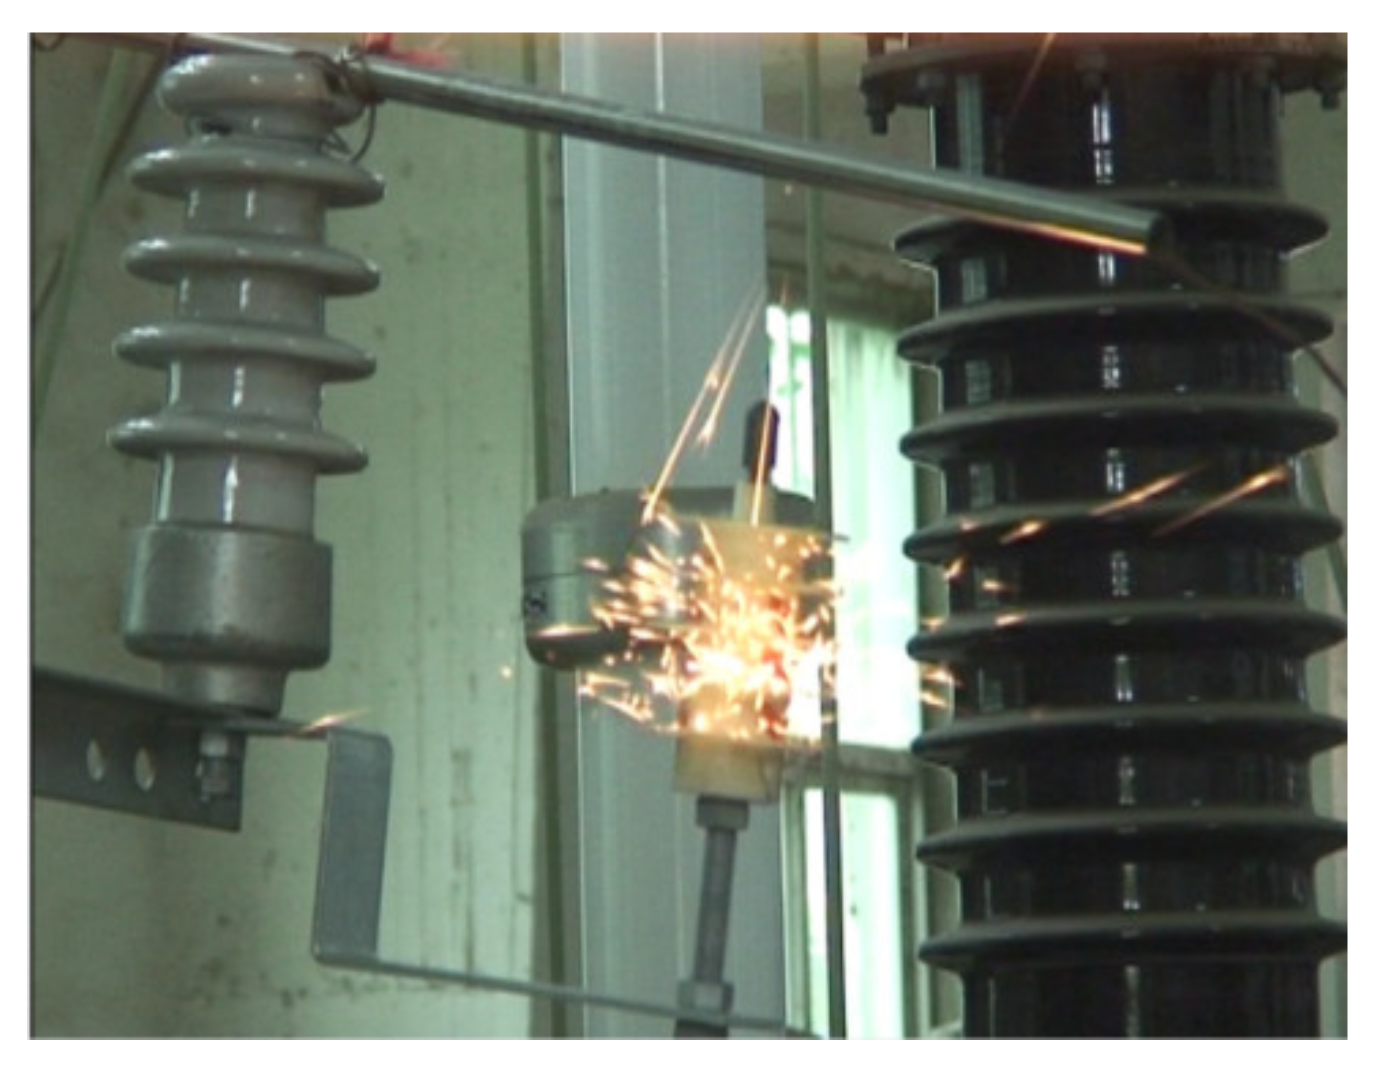
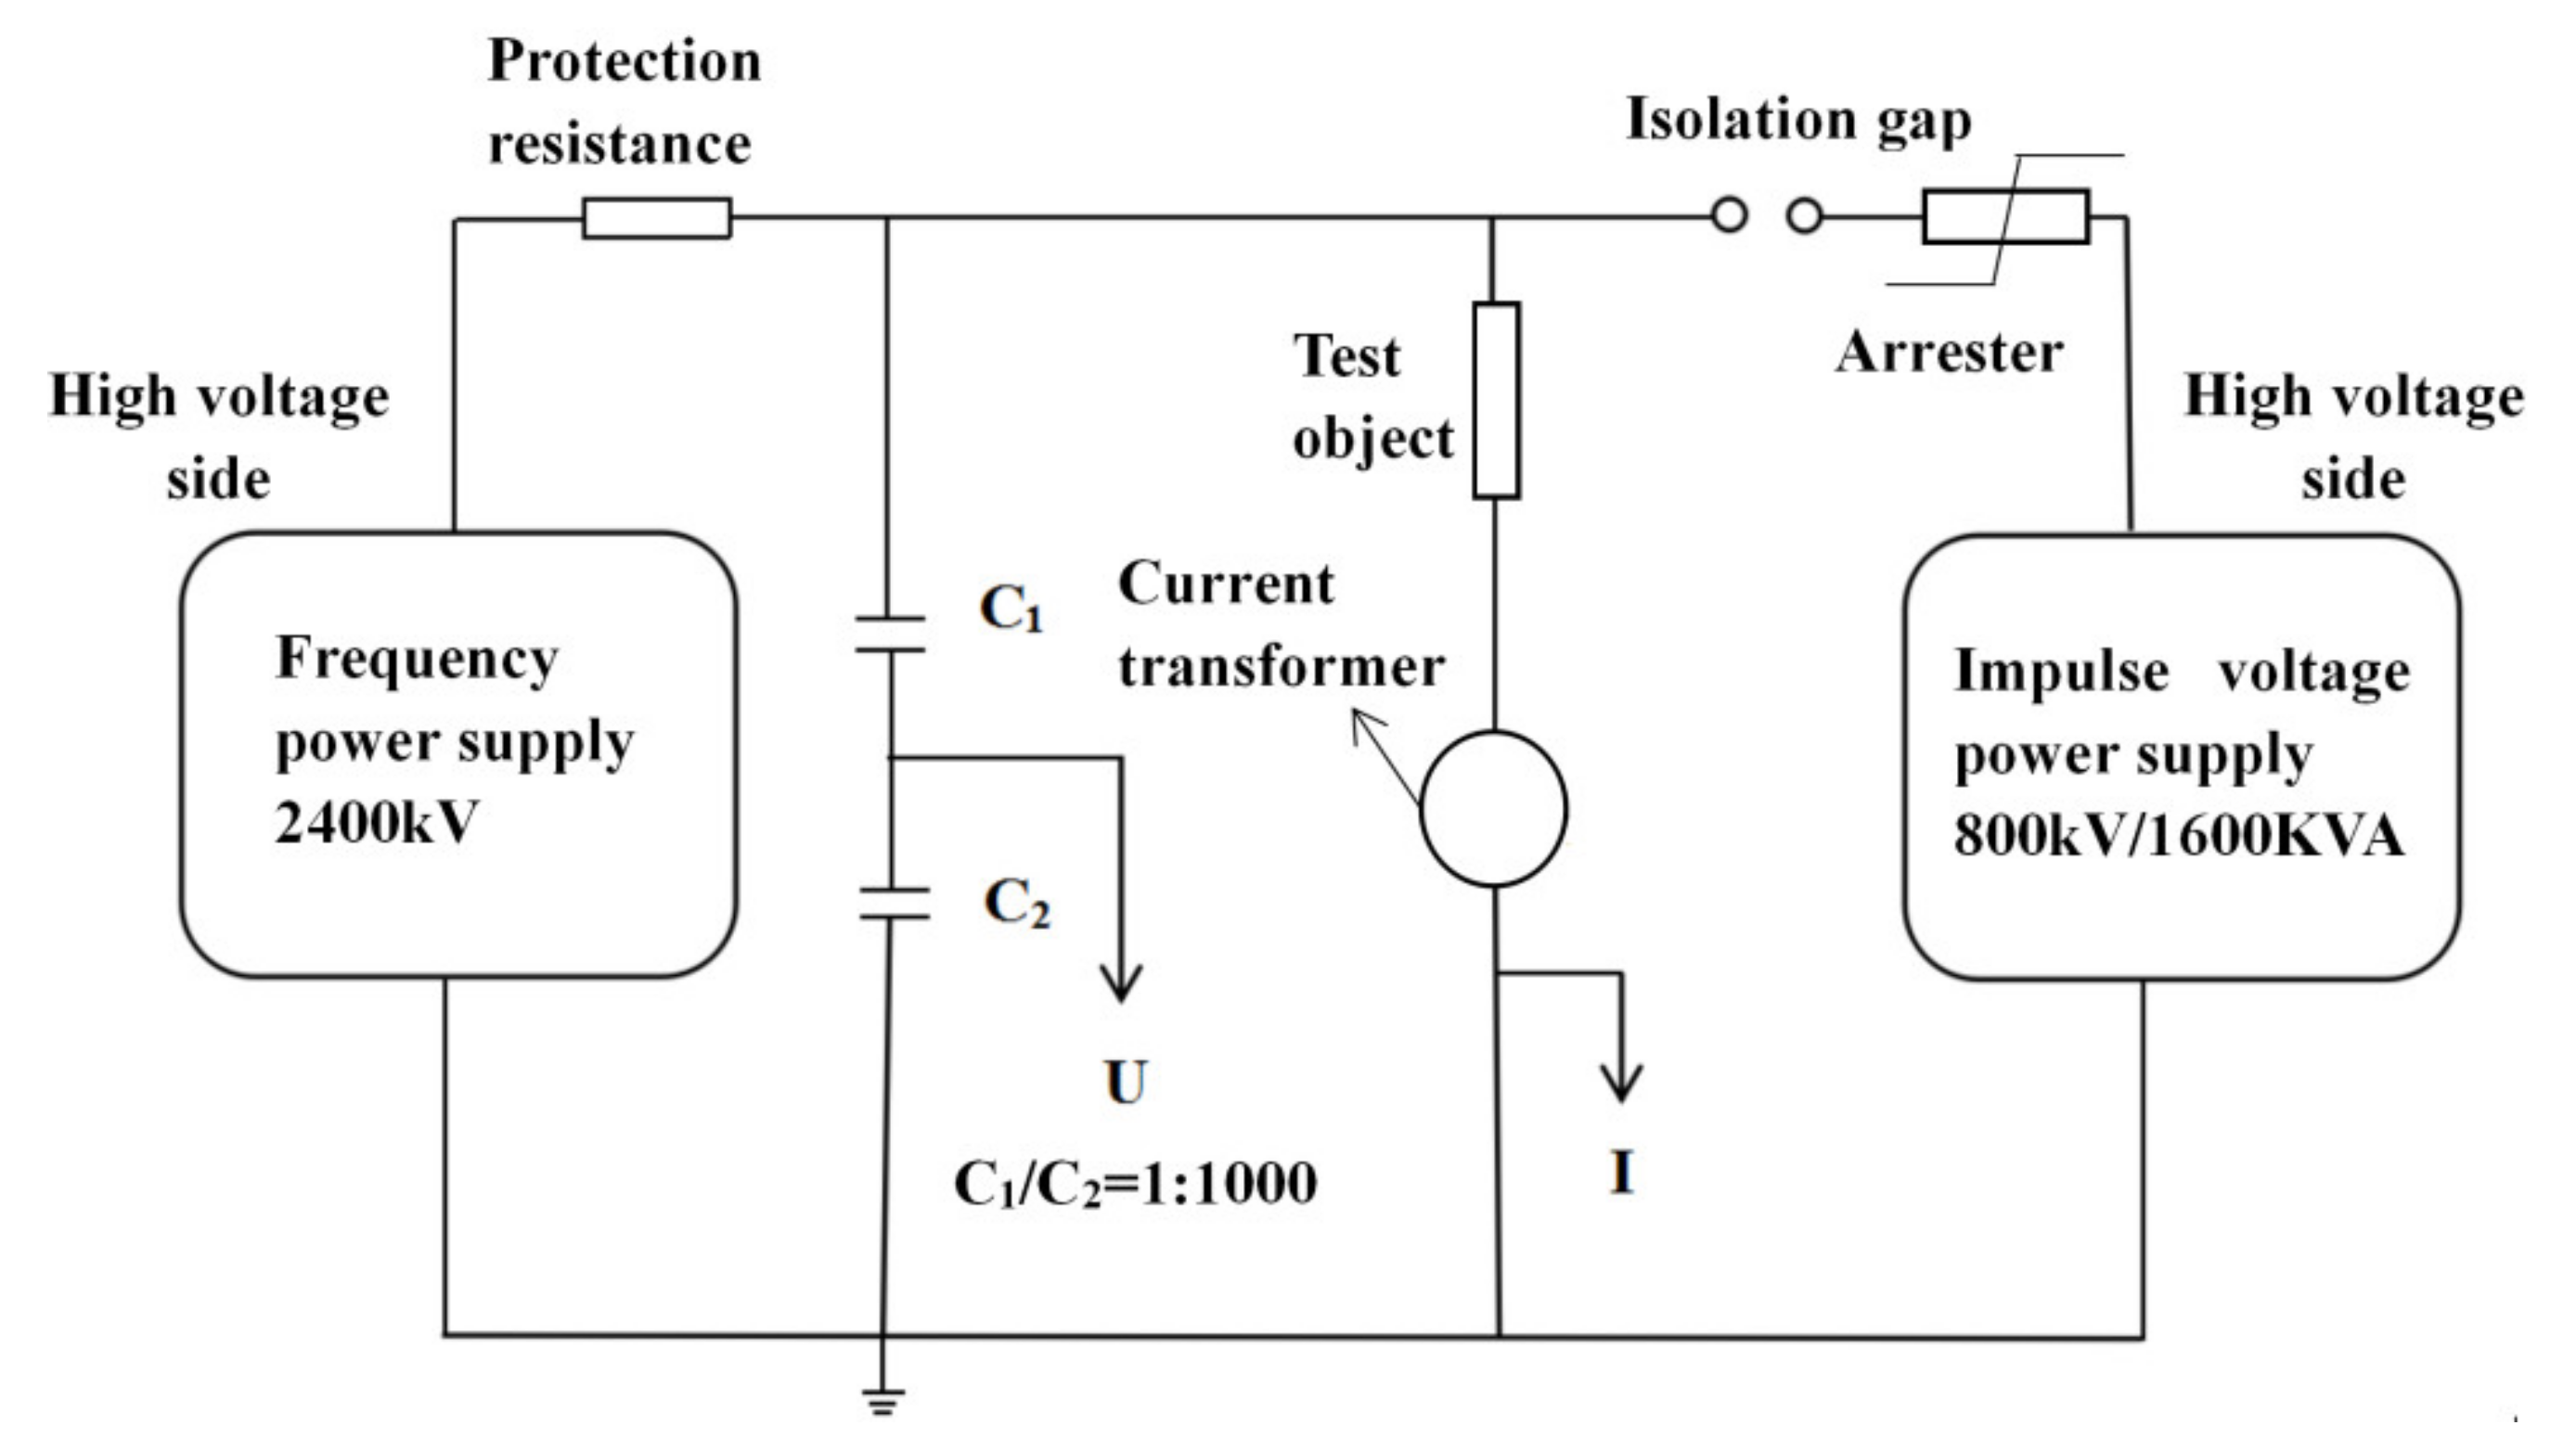
4. Experimental Verification

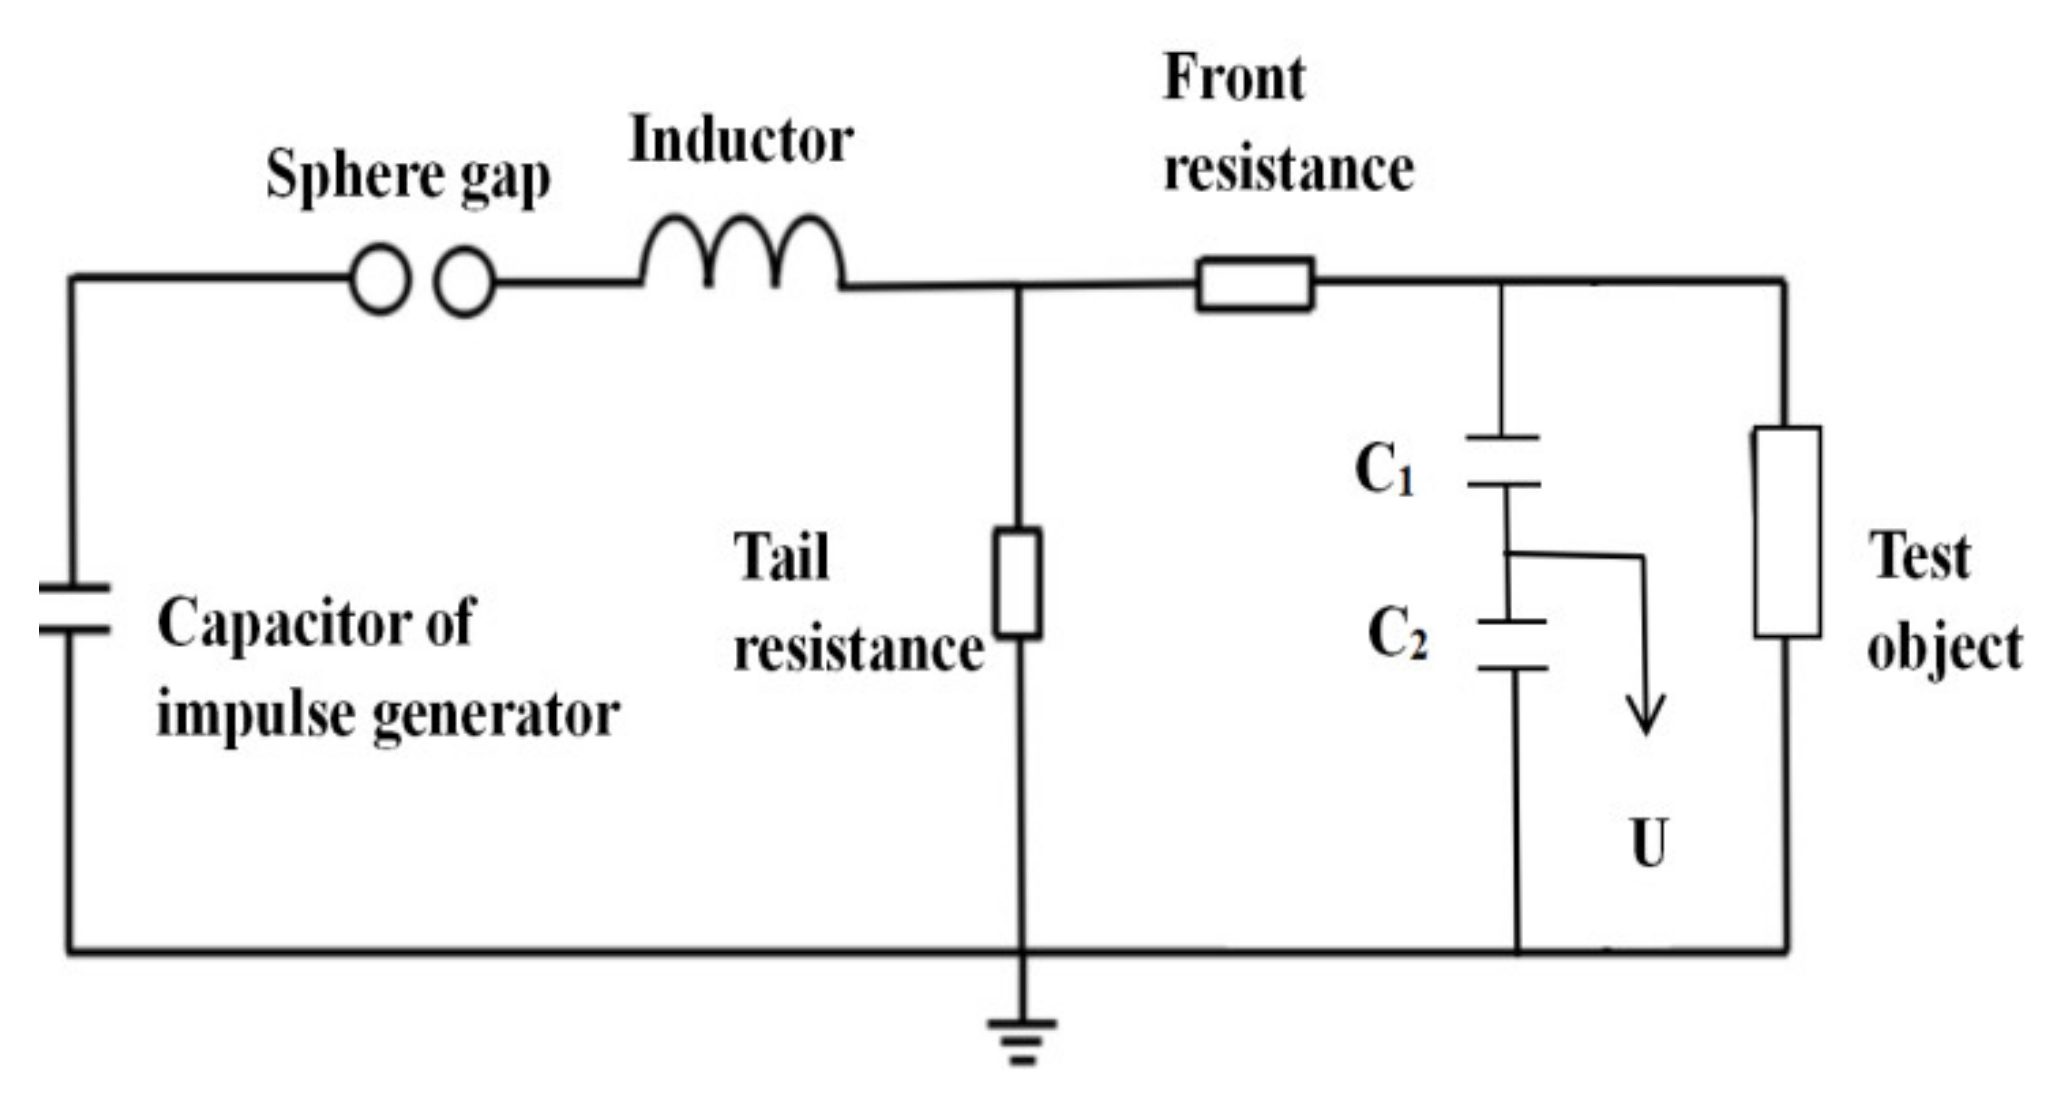
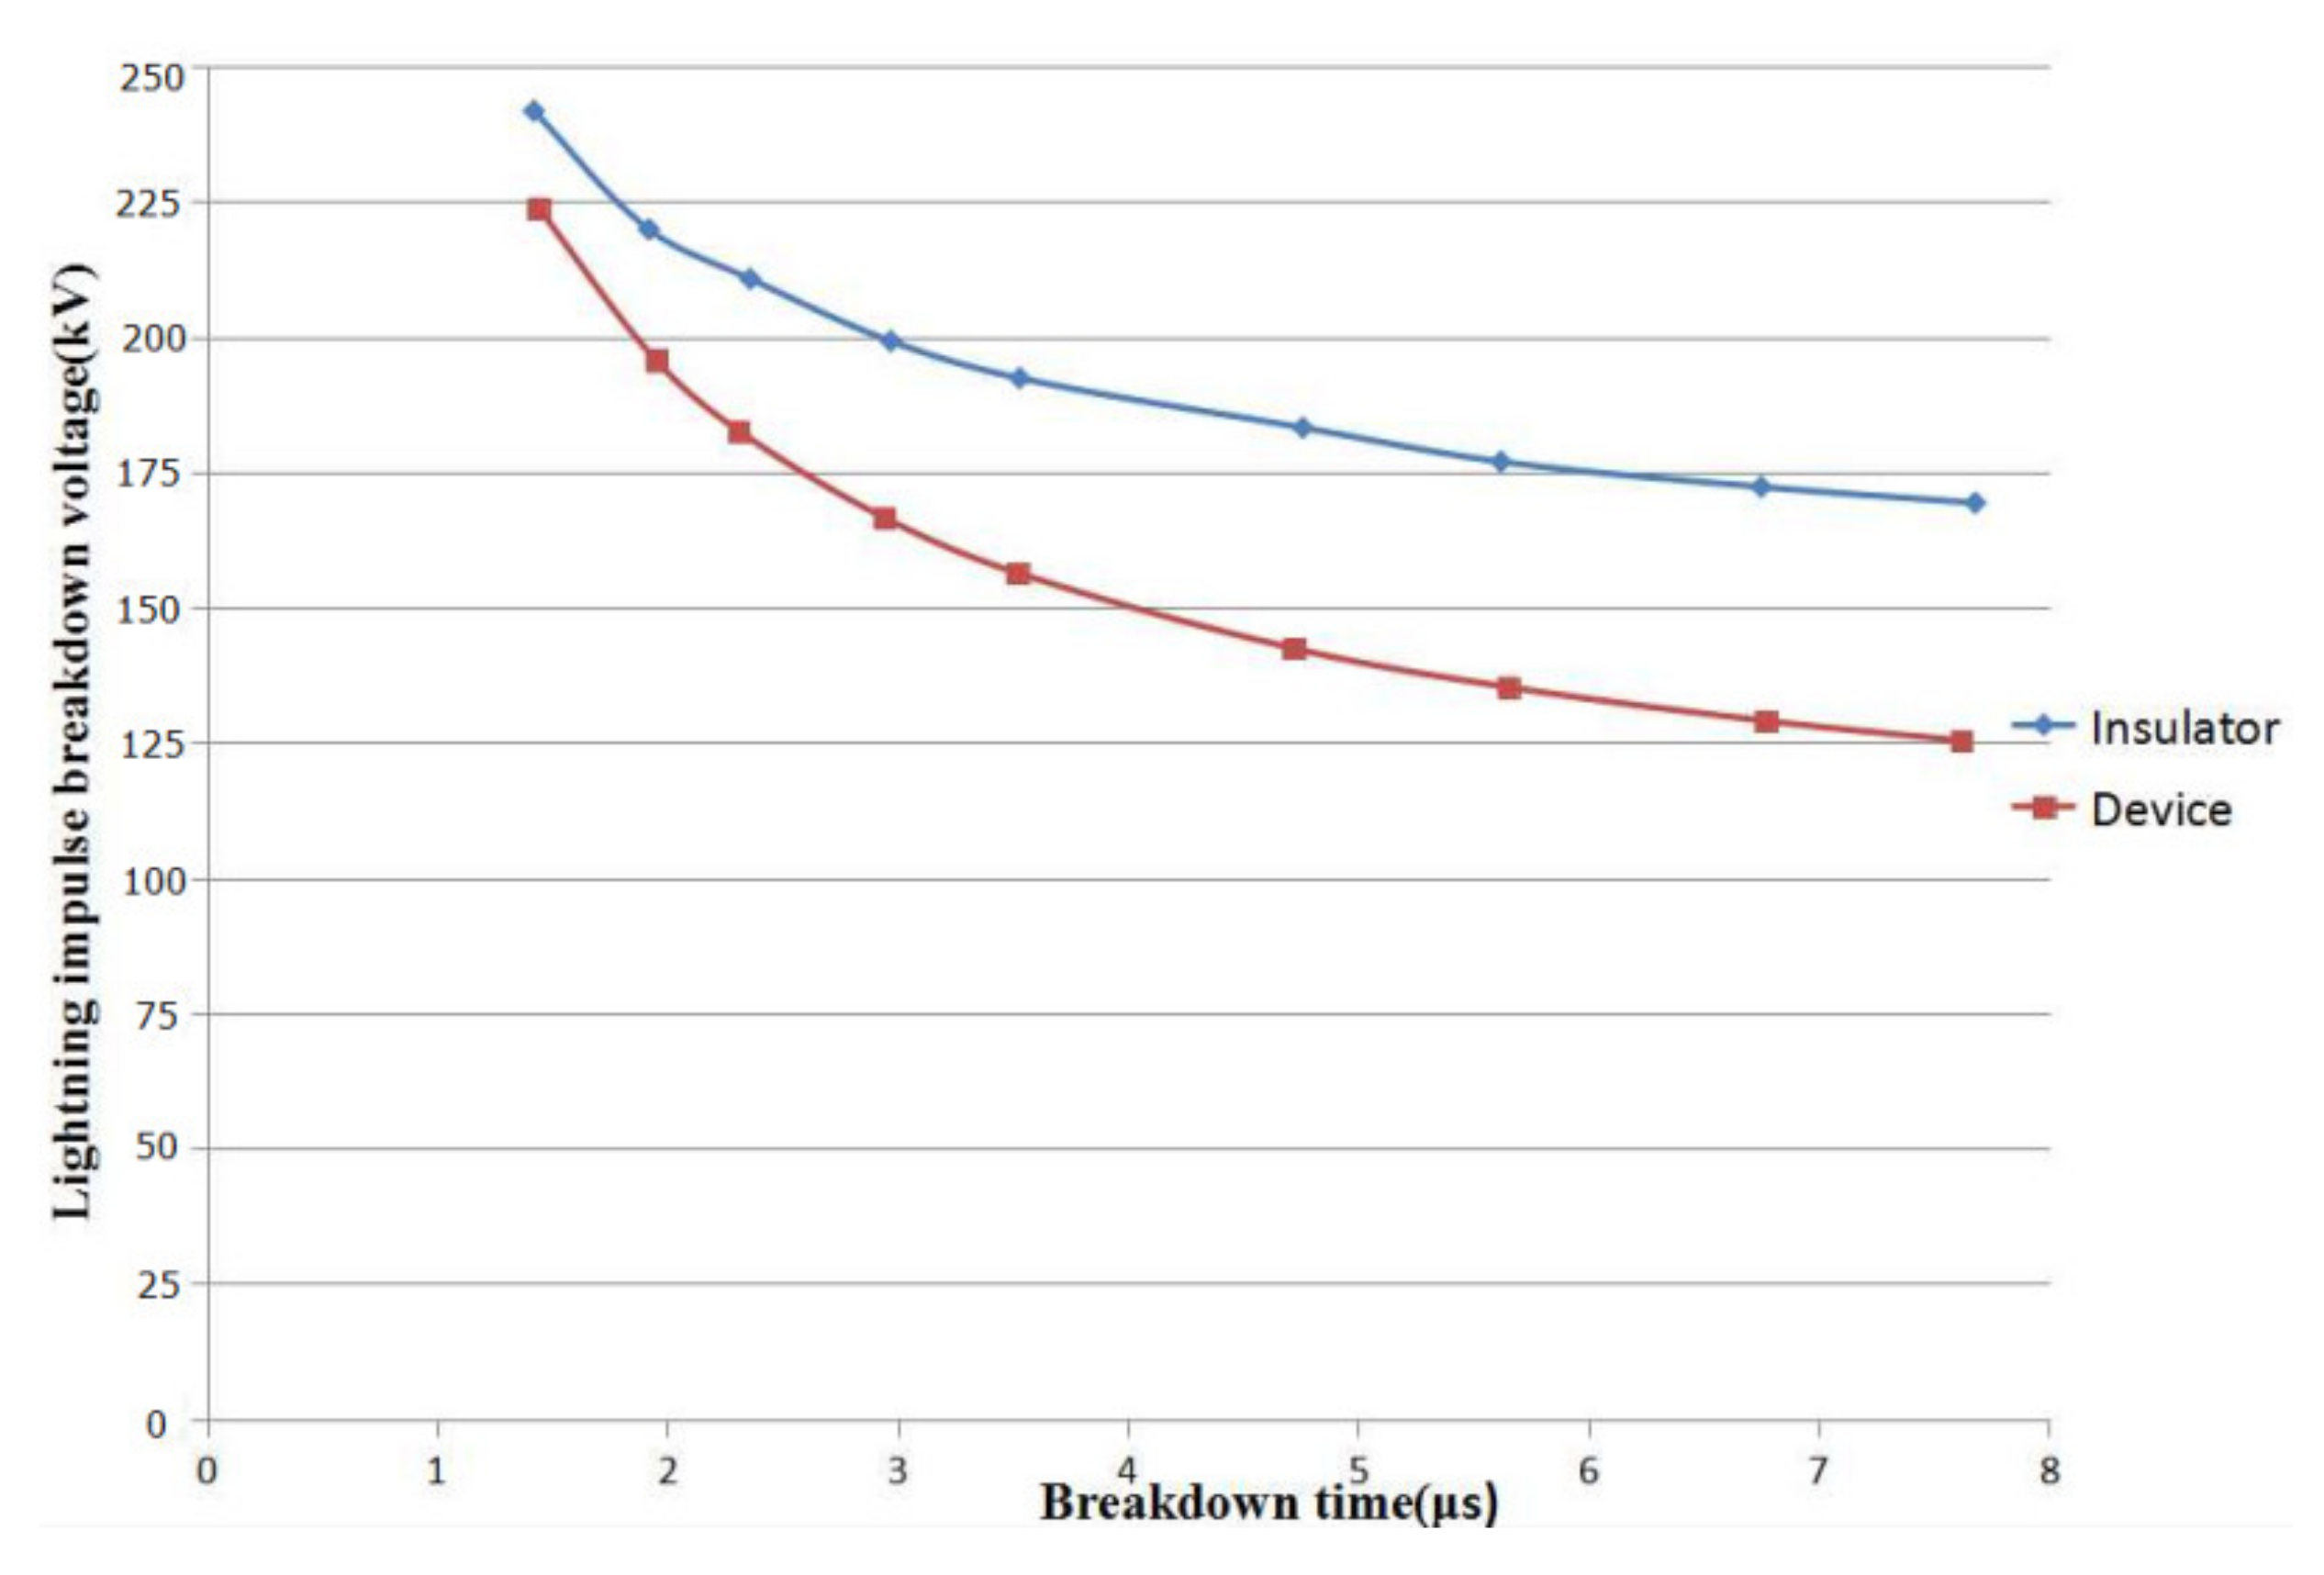
4.1. Lightning Volt-Second Characteristic Test

The voltage amplitude and voltage duration of the gap affect the protection characteristics of the device at the same time. The lightning volt-second characteristic test is carried out to analyze of the degree of protection of insulators by arc extinguishing devices. The equivalent circuit diagram of lightning impulse discharge test circuit is shown in Figure 8.
After a number of repeated tests, the final determination of the distance between the arc-extinguishing device and the simulated wire shall be 8.5 cm. Figure 9 shows the action snapshot of the MCAA. As shown in the Figure 9, there is a multi-directional jet phenomenon on the outside of the aircraft, which is due to the content of the interrupting device setting up a number of horizontal and vertical blow offs, driving the arc to the interrupting device outside the movement. Meanwhile, the arc is ejected outward at a large distance, indicating at this time the impact of the arc-induced formation of compression wave speed and helps to extinguish the arc.
The step-up method is used to carry out the lightning volt-second characteristics of the test. The V-t curves of the insulator and device were plotted by multiple sets of experimental data, which is shown in Figure 10. As seen from the Figure 10, when the breakdown time is 2 s, the lightning breakdown voltage value of the interrupter is 15% smaller than that of the insulator. According to the national standard, the device plays a protective role for insulators.

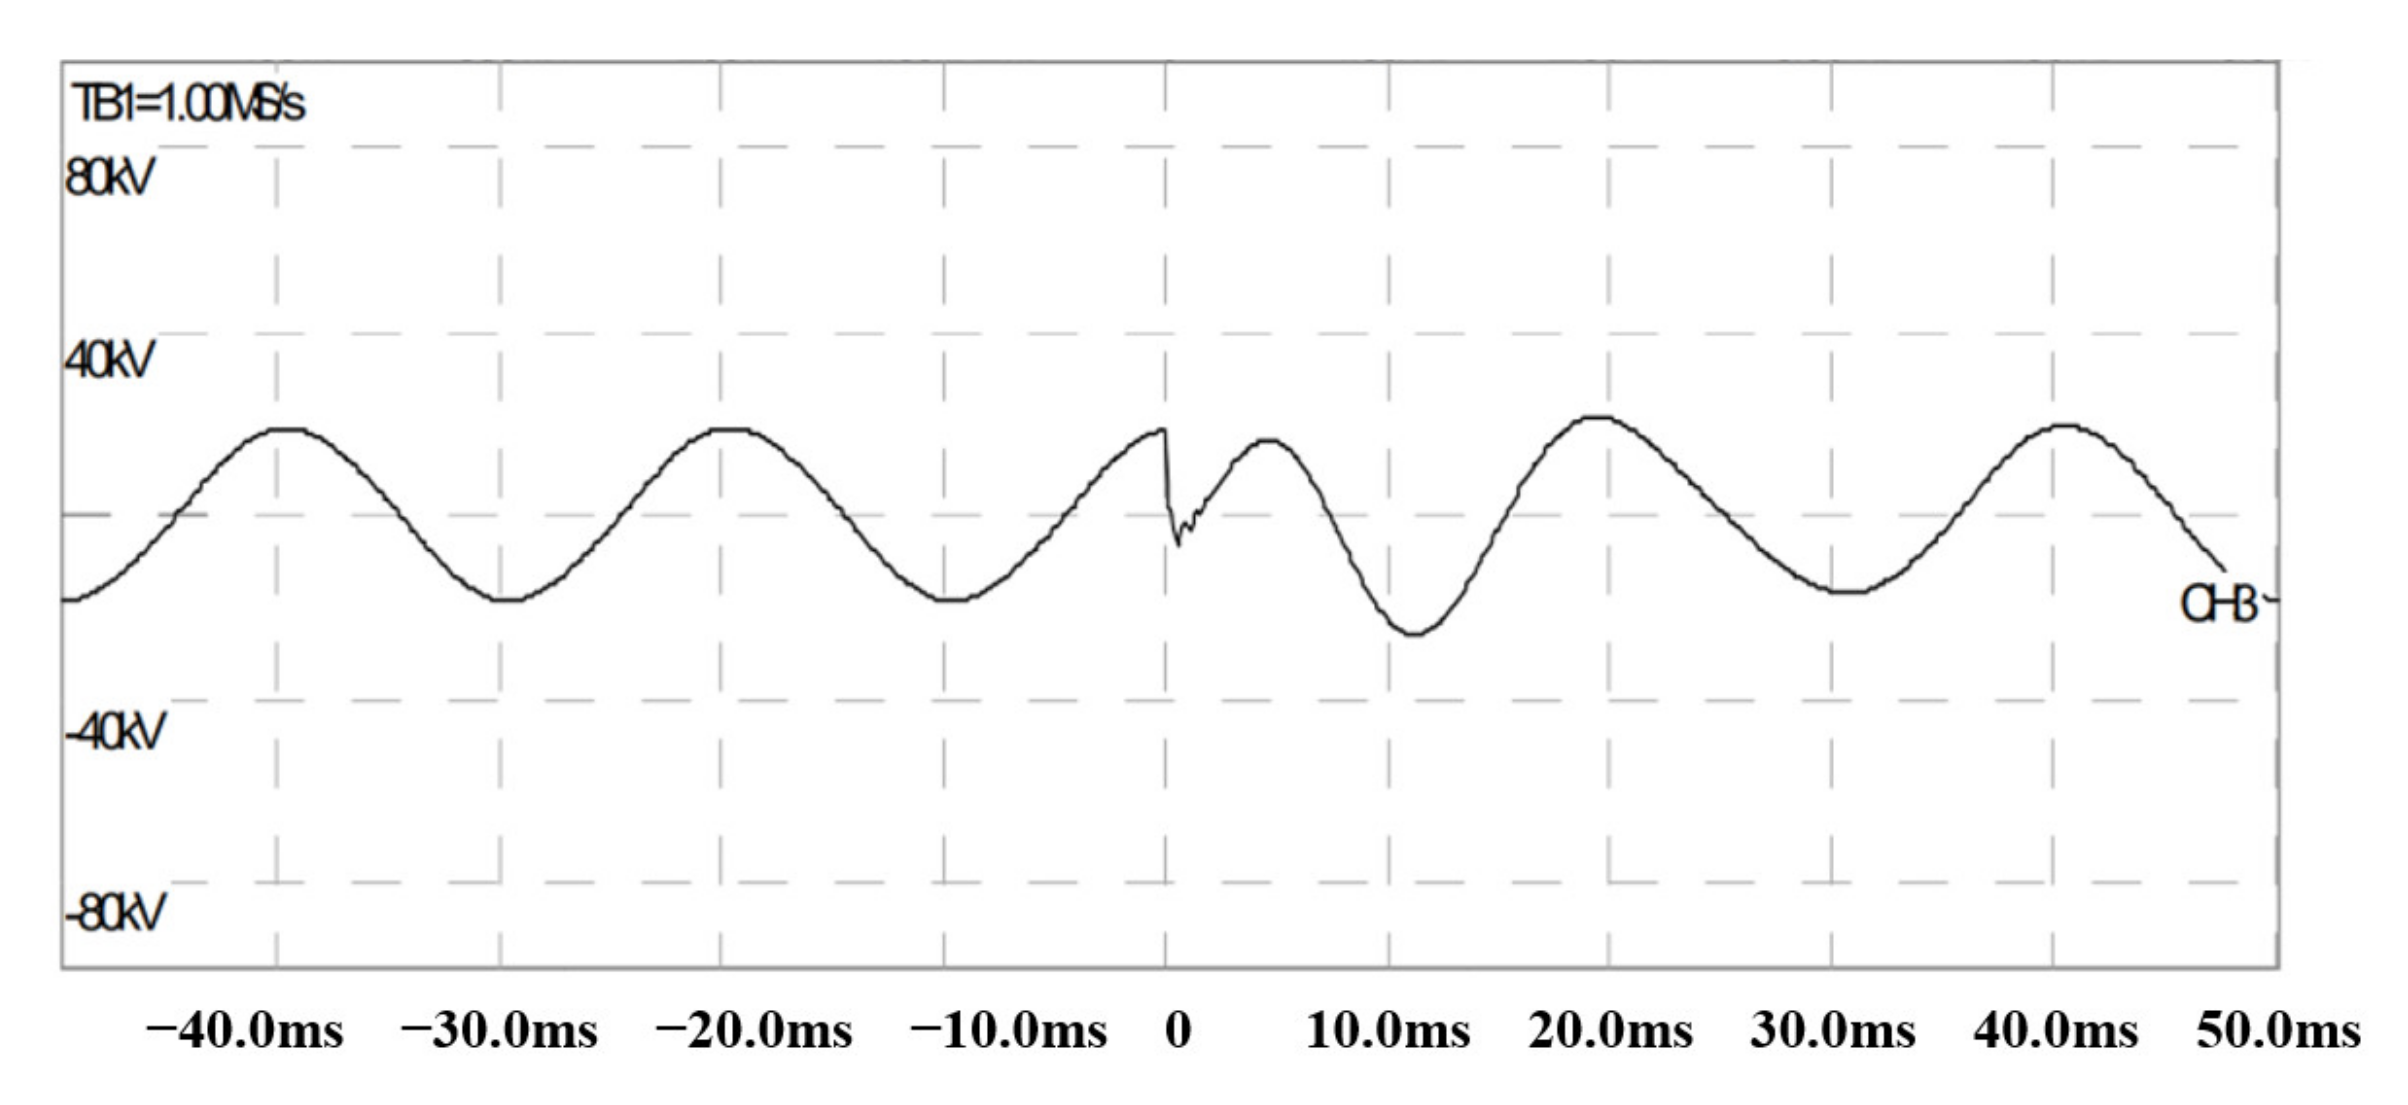
4.2. Frequency Continuity Blocking Test

In order to test the arc-quenching effect of MCAA under the action of impulse arc, an experiment simulating the condition when a 10 kV insulator is struck by a lightning flashover was carried out. The test circuit is shown in Figure 11. The use of impulse voltage power supply and frequency power supply superimposed method for the frequency continuity blocking test. As shown in the Figure 11, the protection resistors, insulation gap and lightning arresters are used to prevent short-circuit currents from surging into the power supply on both sides and causing damage to the power supply equipment. The impulse voltage power supply can generate standard lightning waves (1.2/50 μs) and the rated voltage of the surge voltage generator is 800 kV, and the rated energy is 1600 kVA.
The frequency supply is increased to 13.2 kV, and the phase angle of the impulse voltage trigger is set to 90 degrees. The air gap inside the MCAA is broken down after adjusting the impulse voltage button, and the arc extinguishing figure is captured with the high-speed camera, as shown in Figure 12. The high-speed camera model is a MotionProY3-classic, with a maximum resolution of 1280 × 1024 pixels and a maximum shooting speed of 120,000 fps. As seen from Figure 10a, an impulse arc is formed on the device side and the left side of the device has an arc jet phenomenon. It can be seen that the arc is coupled with the strong airflow, and the arc is blown out of the arc-quenching chamber by the strong airflow at t = 0.01 ms, which is corresponding to the simulation stage, the subtle air velocity has reached 240 m/s. It can be obviously seen that the arc moves along the spiral pipe inside the arc-extinguishing chamber from 0.05 ms~0.1 ms, so the jet flow is spiral in shape. In this process, the arc is divided into several small arcs at the exit of the arc-quenching chamber due to the special structure of the interrupter tube. At the same time, the arc-quenching airflow cuts off the arc at the turning point to form a breaking point, so that the arc energy cannot be fully supplied. As can be seen from Figure 12, the strong airflow still exists from 0.2~0.35 ms. Subsequently, the arc had immediately cooled down and decayed, and finally is extinguished in Figure 10f. The duration of the entire arc burn time is 0.35 ms, and the duration of the arc extinguishing airflow is longer and can help restore the insulation strength inside the interrupting chamber.
The arc voltage waveform is recorded by an oscilloscope in Figure 13. As shown in the figure, the arc voltage drops to zero at t = 0.05 ms, which is the effective time to extinguish the arc. Subsequently, the arc voltage reaches to a certain value, which is less than the initial arc voltage. This process is accompanied by the recombination of positive and negative ions, which indicates that the energy of the arc is extremely reduced.
The arc current waveform is recorded by an oscilloscope in Figure 14. As seen from Figure 14, the whole frequency arc current amplitude is 1.2 kA and the arc current value will reach zero when t = 0.35 ms. This leads to the conclusion that the arc quenching time is 0.35 ms. After 0.35 ms, the arc did not reignite.

5. Application Effect

Lightning trip-out accidents occur frequently in the region of intensified lightning in South China. Therefore, the MCAA had been installed on a number of distribution lines to reduce lightning trip rate. Figure 15 shows pictures of the application of the MCAAs.
The line parameters table is shown in Table 1.
The actual operation record of the devices on 10 kV line is shown in Table 2. In 2019, an arc-extinguishing system was not installed on the line while the MCCAs were installed on the line in 2020. The distribution line had been struck 15 times, which was same as the lightning trip-out times. The distribution line had been struck 10 times by lightning in the year 2020, which was the same as the operation time in 2020, while lightning trip-out time was zero in 2020. Therefore, it can be concluded that the devices defend against the lightning effectively. The lightning outage rates are calculated by real-time monitoring data.

6. Conclusions

This paper describes the simulation and experiments of multi-chamber arc-quenching arresters (MCAA) for 10 kV transmission lines.
(1)
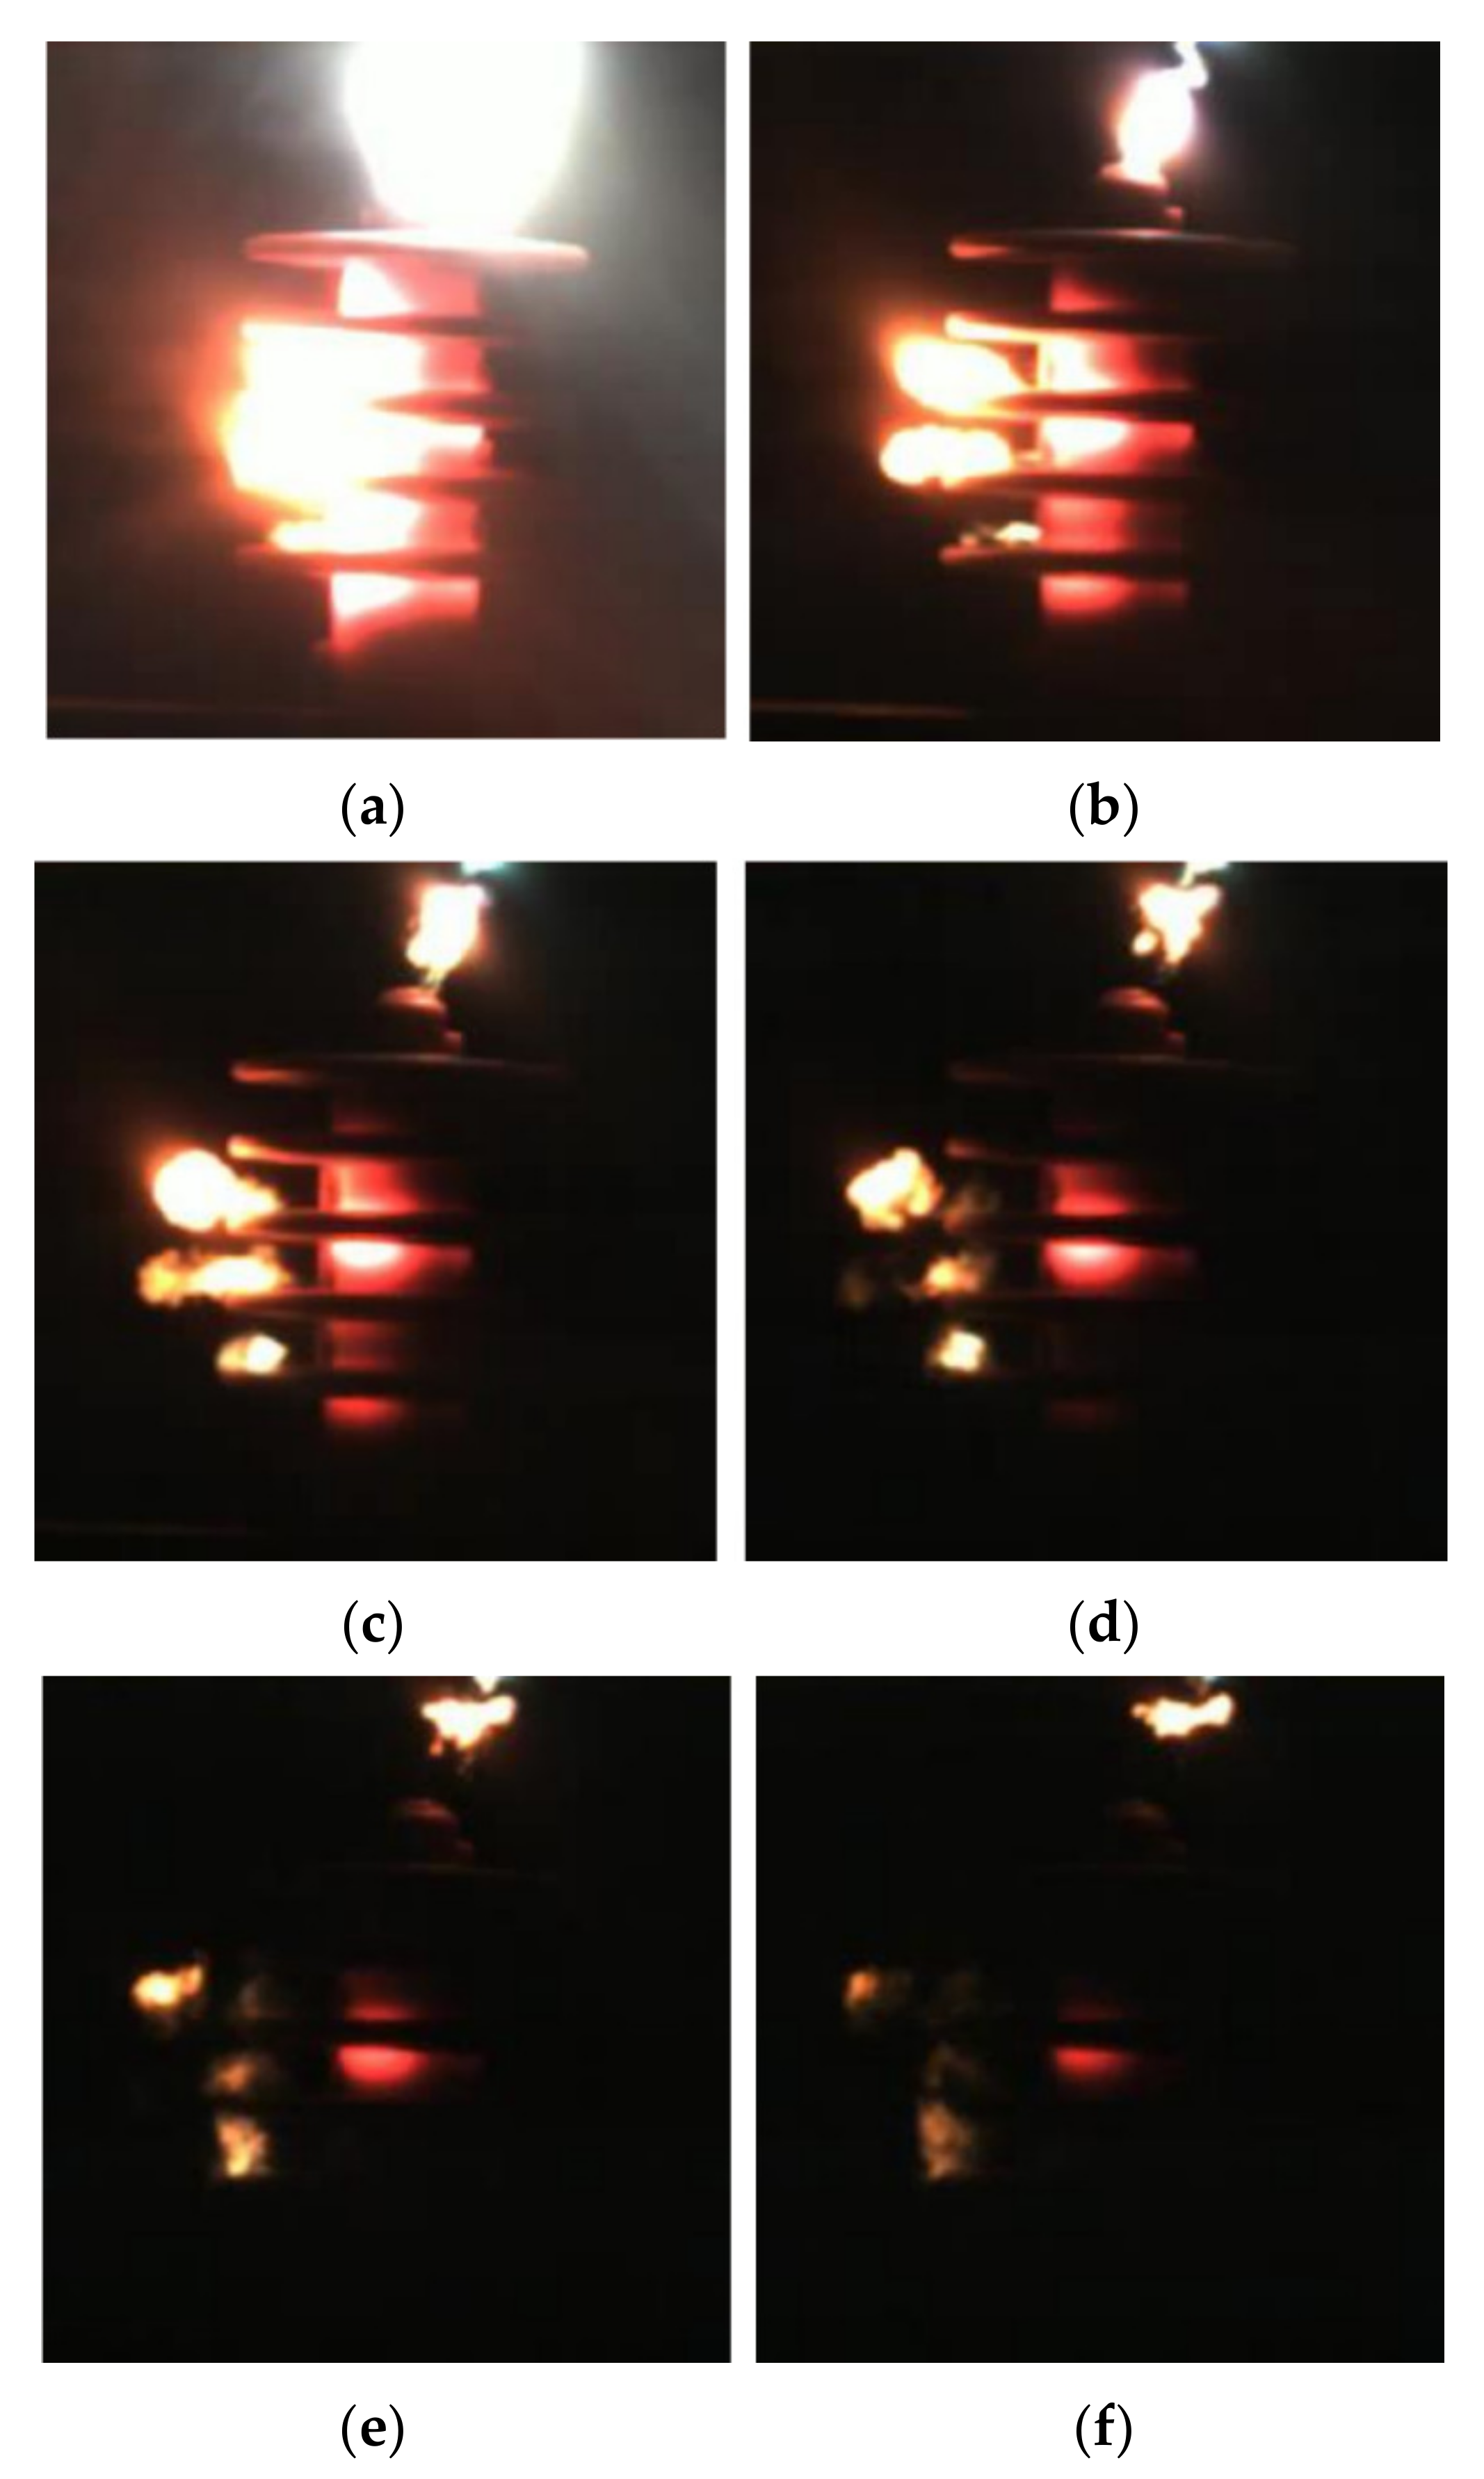
The arc energy can be used to generate strong airflow with high speed and high pressure to extinguish the arc. The energy of the impulse arc is transformed into the energy of the compression wave, which helps to extinguish the arc.
(2)
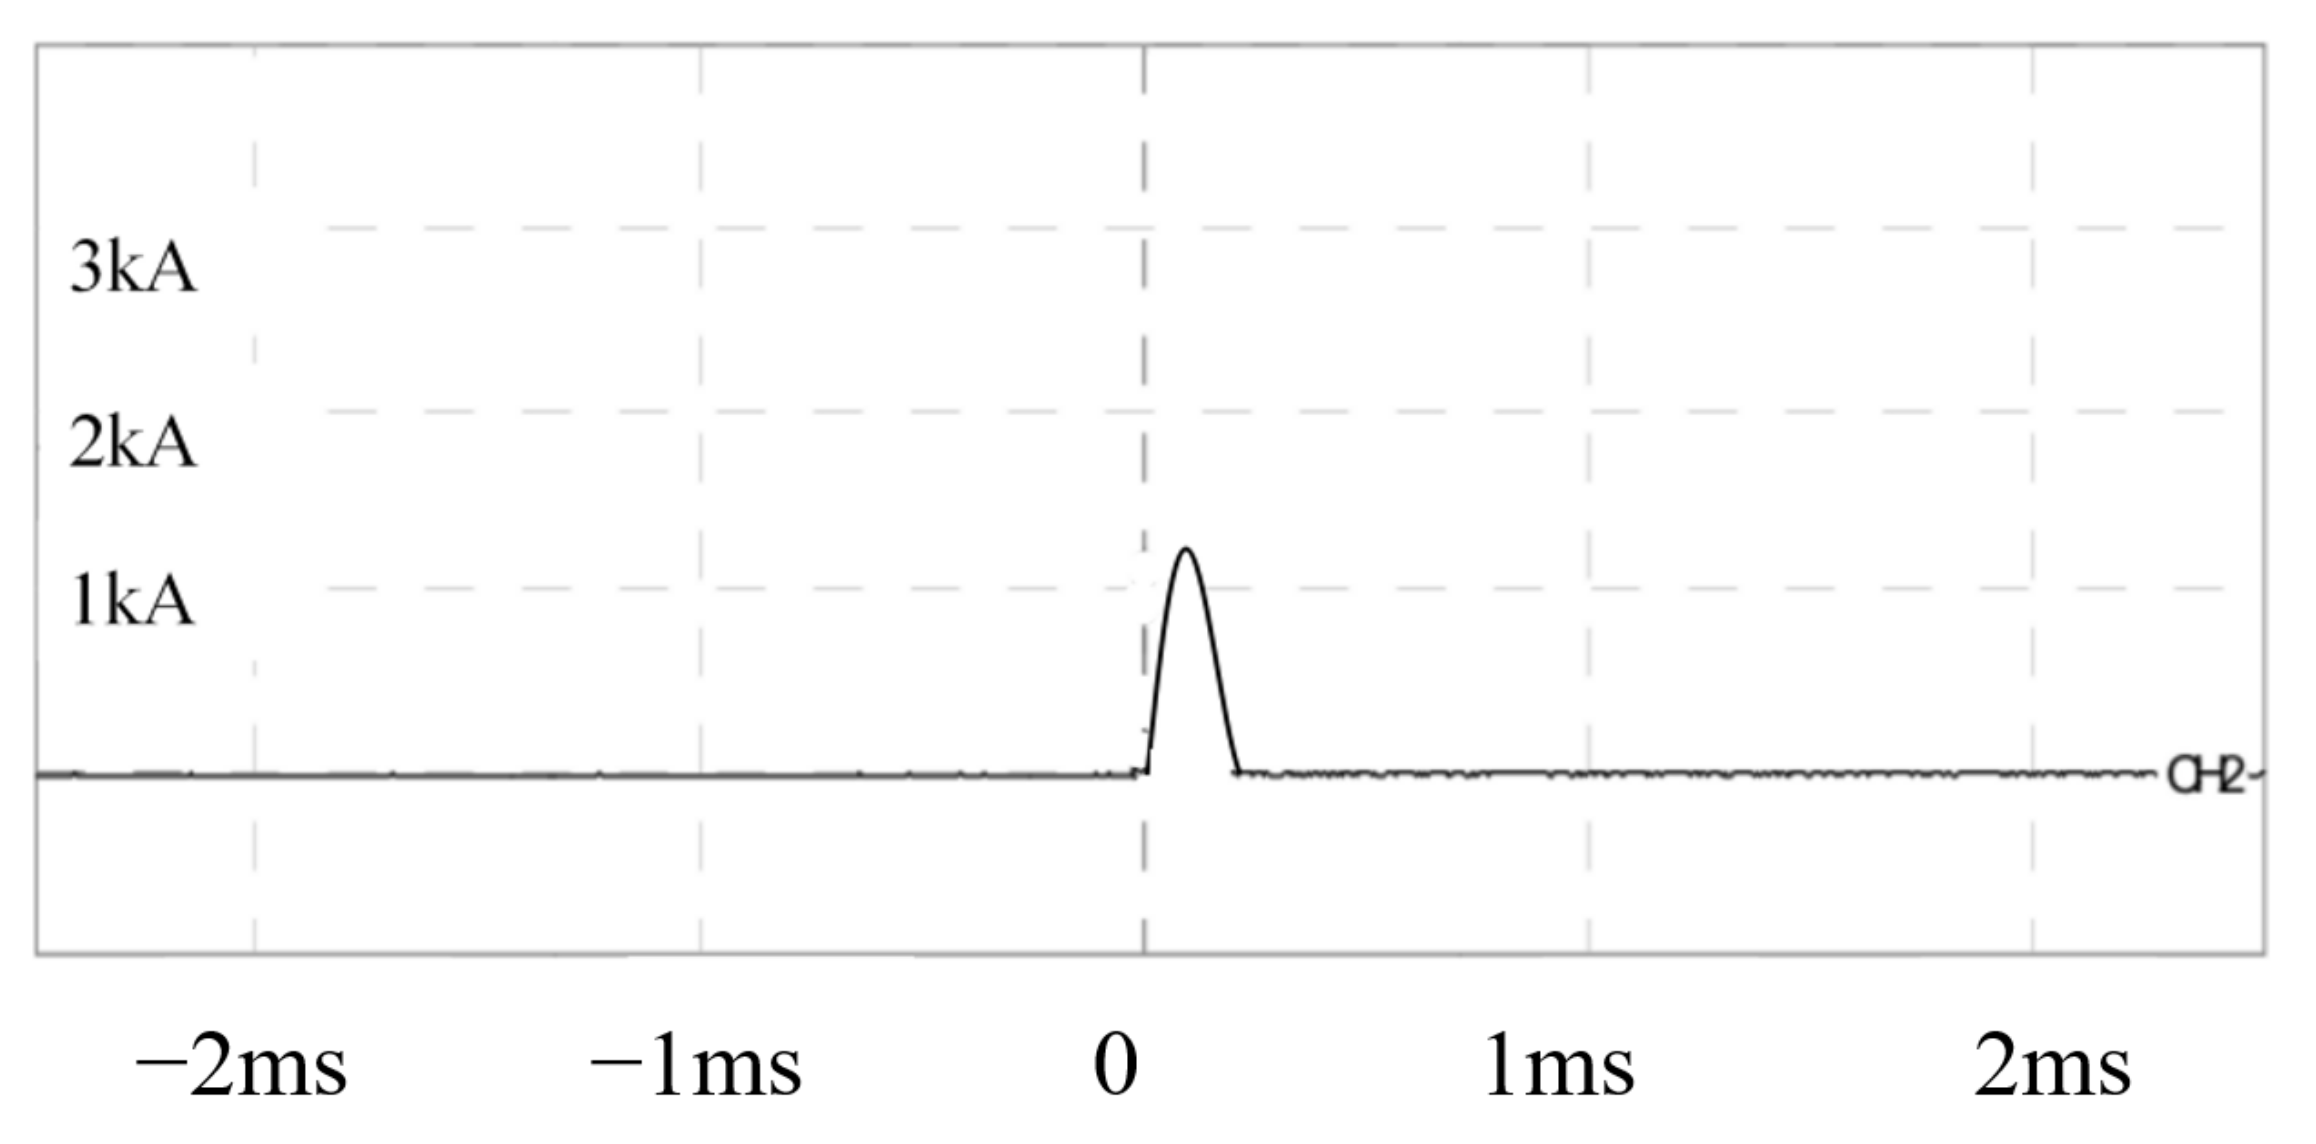
The MCAA can completely extinguish the arc within 0.35 ms, which is faster than the action time of relay protection. No re-ignition was found under the action of subsequent industrial frequency voltage.
(3)
The MCAA can prevent lightning trip-out effectively and guarantee the reliability of the power supply. The MCAA can significantly reduce the lightning trip rate.

Author Contributions

Conceptualization, D.W. and J.W.; methodology, D.W.; software, D.W. and Z.J.; validation, D.W. and J.W.; formal analysis, D.W.; investigation, D.W.; resources, D.W. and J.W.; data curation, D.W.; writing—original draft preparation, D.W.; writing—review and editing, D.W.; visualization, D.W.; supervision, D.W.; project administration, D.W.; funding acquisition, J.W. All authors have read and agreed to the published version of the manuscript.

Funding

This work was supported by National Natural Science Foundation of China (50867002), Doctoral Research Initiation Fund of Guilin University of Technology (GUTQDJJ2018068) and 2020 Guangxi University Middle-aged and Young Teachers’ Basic Research Ability Improvement Project (2020KY06024).

Institutional Review Board Statement

Not applicable.

Informed Consent Statement

Not applicable.

Data Availability Statement

Data sharing not applicable.

Acknowledgments

This research was supported by the National Natural Science Foundation of China (51467002), Doctoral Research Initiation Fund of Guilin University of Technology (GUTQDJJ2018068) and 2020 Guangxi University Middle-aged and Young Teachers’ Basic Research Ability Improvement Project (2020KY06024). The authors wish to thank the staff of high-voltage laboratory at Guangxi University.

Conflicts of Interest

The authors declare no conflict of interest.

References

  1. He, J.; Yu, G.; Yuan, J.; Zeng, R.; Zhang, B.; Zou, J.; Guan, Z. Decreasing grounding resistance of substation by deep-ground-well method. IEEE Trans. Power Deliv. 2005, 20, 738–744. [Google Scholar] [CrossRef]
  2. He, J.; Gao, Y.; Zeng, R.; Sun, W.; Zou, J.; Guan, Z. Optimal Design Analysis of Grounding Grids for Substations Built in Nonuniform Soil. In Proceedings of the International Conference on Power System Technology, Perth, WA, USA, 4–7 December 2000; Volume 3, pp. 1455–1460. [Google Scholar]
  3. Zeng, R.; Zhuang, C.; Niu, B.; Yu, Z.; He, J. Measurement of transient electric fields in air gap discharge with an integrated electro-optic sensor. IEEE Trans. Plasma Sci. 2013, 41, 955–960. [Google Scholar] [CrossRef]
  4. Podporkin, G.V.; Enkin, E.Y.; Kalakutsky, E.S.; Pilshikov, V.E.; Sivaev, A.D. Overhead Lines Lightning Protection by Multi-Chamber Arresters and Insulator-Arresters. IEEE Trans. Power Deliv. 2010, 26, 214–221. [Google Scholar] [CrossRef]
  5. Xia, Q. Research on Real-Time Risk Assessment of Transmission Line Lightning Strike and Trip Warning Model. South China University of Technology, Guangzhou, China. 2019. Available online: https://kns.cnki.net/KCMS/detail/detail.aspx?dbname=CMFD201701&filename=1016191760.nh (accessed on 7 June 2021).
  6. Li, X. Research on the Technical Principles and Application Schemes of Zinc Oxide Arresters for High-Voltage Transmission Lines. North China Electric Power University. 2001. Available online: https://kns.cnki.net/KCMS/detail/detail.aspx?dbname=CMFD201902&filename=1019177935.nh (accessed on 7 June 2021).
  7. Li, R.; Wu, G.; Cao, X.; Fan, C.; Wang, Y.; Liu, P. Three-dimensional calculation method of lightning shielding failure rate of transmission lines. Trans. Chin. Soc. Electr. Eng. 2009, 24, 134–138. [Google Scholar] [CrossRef]
  8. Banjanin, M. Line arresters and underbuilt wire application in lightning protection of 110 kV and 220 kV overhead transmission lines. In Proceedings of the 2019 18th International Symposium INFOTEH-JAHORINA (INFOTEH 2019), East Sarajevo, Bosnia and Herzegovina, 20–22 March 2019; pp. 1–5. [Google Scholar] [CrossRef]
  9. Wang, J.; Liu, J.; Guo, W.; Wu, G.; Liu, Q. Detonation airflow arc extinguishing method of insulator series-parallel protection gap. Power Syst. Technol. 2014, 38, 1358–1365. [Google Scholar] [CrossRef]
  10. Wu, D.; Wang, J. Lightning Protection of 10-kV Distribution Lines by Multiple Breakpoints Arc-Extinguishing Lightning Protection Gap. IEEE Trans. Plasma Sci. 2020, 48, 531–536. [Google Scholar] [CrossRef]
  11. Okabe, S.; Tsuboi, T.; Takami, J. Analysis of aspects of lightning strokes to large-sized transmission lines. IEEE Trans. Dielectr. Electr. Insul. 2011, 18, 182–191. [Google Scholar] [CrossRef]
  12. Chen, W.; Gu, S.; He, J.; Yin, B. Development of Arc-Guided Protection Devices Against Lightning Breakage of Covered Conductors on Distribution Lines. IEEE Trans. Power Deliv. 2009, 25, 196–205. [Google Scholar] [CrossRef]
  13. He, J.; Zhang, X.; Dong, L.; Zeng, R.; Liu, Z. Fractal model of lightning channel for simulating lightning strikes to transmission lines. Sci. China Ser. E Technol. Sci. 2009, 52, 3135–3141. [Google Scholar] [CrossRef]
  14. Taniguchi, S.; Tsuboi, T.; Okabe, S.; Nagaraki, Y.; Takami, J.; Ota, H. Improved method of calculating lightning stroke rate to large-sized transmission lines based on electric geometry model. IEEE Trans. Dielectr. Electr. Insul. 2010, 17, 53–62. [Google Scholar] [CrossRef]
  15. Yan, Y.; Wang, Y.; Ni, X.; Hu, X. Analysis and Research on the Operation of Lightning Arresters for Composite Insulated Lines. Electr. Porcelain Lightning Arrester 2019, 123–128. [Google Scholar] [CrossRef]
  16. Li, F.; Shi, W. Insulation coordination of line arresters. High Volt. Technol. 2005, 8, 18–20, 23. [Google Scholar] [CrossRef]
  17. Giraudet, F. Various Benefits for Line Surge Arrester Application and Advantages of Externally Gapped Line Arresters. In Proceedings of the 2019 International Conference on High Voltage Engineering and Technology (ICHVET), Begumpet, India, 7–8 February 2019; pp. 1–6. [Google Scholar] [CrossRef]
  18. Li, J.; Shao, Q.; Zhou, M.; Zhao, Z.; Guo, J. Analysis of lightning discharge current and absorbed energy characteristics of lightning arresters in distribution network. Electr. Porcelain Arresters 2019, 131–135. [Google Scholar] [CrossRef]
  19. Liao, M.; Cai, H.; Wu, X.; Jia, L. Research on the impact of multiple lightning strikes on line arresters. Electr. Porcelain Arresters 2019, 153–158. [Google Scholar] [CrossRef]
  20. Yang, H.; Wang, C.; Yang, J.; Shi, F. Analysis of a 110 kV line lightning arrester explosion accident. Electr. Porcelain Arrester 2019, 4, 151–154, 160. [Google Scholar] [CrossRef]
Figure 1. Structural schematic diagram of the multi-chamber arc-quenching arrester (MCAA). (a) The structural schematic diagram of the MCCA. (b) The structure of the arc-quenching chamber.
Energies 14 06185 g001
Figure 2. Simplified model of arc-quenching chamber.
Energies 14 06185 g002
Figure 3. Arc parameter change curve with temperature. (a) The constant pressure thermal capacity of the arc curves with the temperature. (b) The dynamic viscosity of the arc curves with the temperature. (c) The electrical conductivity of the arc curves with the temperature. (d) The thermal conductivity of the arc curves with the temperature.
Energies 14 06185 g003
Figure 4. Arc-quenching unit structure.
Energies 14 06185 g004
Figure 5. Lightning current waveform in simulation.
Energies 14 06185 g005
Figure 6. Electrical conductivity distribution cloud charts. (a) t = 1 µs; (b) t = 5 µs; (c) t = 9 µs; (d) t = 13 µs; (e) t = 17 µs; (f) t = 23 µs; (g) t = 27 µs; (h) t = 31 µs.
Energies 14 06185 g006aEnergies 14 06185 g006b
Figure 7. Velocity distribution cloud charts. (a) t = 1 µs; (b) t = 3 µs; (c) t = 6 µs; (d) t = 9 µs; (e) t = 12 µs; (f) t = 15 µs; (g) t = 18 µs; (h) t = 21 µs; (i) t = 24 µs; (j) t = 27 µs.
Energies 14 06185 g007aEnergies 14 06185 g007b
Figure 8. Equivalent circuit diagram of lightning impulse discharge test circuit.
Energies 14 06185 g008
Figure 9. Action snapshot of the MCAA.
Energies 14 06185 g009
Figure 10. V-t curves of the insulator and device.
Energies 14 06185 g010
Figure 11. Test circuit.
Energies 14 06185 g011
Figure 12. Recorded arc-quenching images by high-speed camera. (a) t = 0.01 ms; (b) t = 0.05 ms; (c) t = 0.1 ms; (d) t = 0.15 ms; (e) t = 0.2 ms; (f) t = 0.35 ms.
Energies 14 06185 g012
Figure 13. Arc voltage waveform.
Energies 14 06185 g013
Figure 14. Arc current waveform.
Energies 14 06185 g014
Figure 15. Pictures of application of the MCAAs.
Energies 14 06185 g015
Table 1. Line parameters table.
Span (km)InsulatorConductor Height (m)Ground Flash Density (Times/km2⋅a)
10PS-20120.12
U50% (kV)Inductance
(μH)
Thunderstorm Day (d)Grounding resistance (Ω)
2065.528020
Table 2. Actual operational record data of the devices.
YearLightning Stroke TimeOperation TimeTrip-Out TimeLightning Outage Rate
20191501520.8
202010913.38
Publisher’s Note: MDPI stays neutral with regard to jurisdictional claims in published maps and institutional affiliations.

