Article

Influence of Microstepping Signal Shape on Shaft Movement Precision and Torque Variation of the Stepper Motor

by
Bogdan Bednarski
*,
Krzysztof Jackiewicz
* and
Andrzej Gałecki
*
Faculty of Electrical Engineering, Institute of Control and Industrial Electronics, Warsaw University of Technology, Koszykowa 75, 00-662 Warsaw, Poland
*
Authors to whom correspondence should be addressed.
Energies 2021, 14(19), 6107; https://doi.org/10.3390/en14196107
Submission received: 31 August 2021 / Revised: 14 September 2021 / Accepted: 20 September 2021 / Published: 25 September 2021
(This article belongs to the Special Issue Modern Electrical Drives: Trends, Problems, and Challenges)

Abstract

:
Stepper motors are widely used in many applications where discrete, precise movement is required. There is a variety of dedicated stepper motor controllers (sometimes referred to as “step sticks”) available on the market. Those controllers provide a number of different motor control schemes that vary by aspects like current control method, reference current shape or maximum resolution increase (microstepping). The two most widely acknowledged signal shapes are sine-cosine microstepping and quadrature microstepping. The choice of the control scheme impacts torque output, torque variation, positioning error and maximum power supply requirements. This paper presents a family of generalised microstepping signal shapes, ranging from sine-cosine microstepping to quadrature microstepping. Derivation of signal shapes as well as their mathematical analyses are provided. Those signals are then implemented on the control board. A series of experiments is performed on a test bench to analyse the influence of different signal shapes on the performance of the motor in both load and no load conditions. The comparison of the new generalized shapes influence on the motor operation to the commonly used sine-cosine and quadrature control is provided.

Graphical Abstract

1. Introduction

Stepper motors have become a motion actuator of choice in many small-to-medium devices, such as CNC machines, robots, office printers, 3D printers and other devices, where a precise movement with a well-defined angular resolution is a crucial operating factor [1,2,3,4,5,6]. In the case of smaller devices, the maximum output of their power supply can become a bottleneck of the whole design, imposing constraints on the choice of motors and their nominal power. At some point, even low-resolution, sinusoidal microstepping may not provide enough incremental torque margin. As a consequence, shaft skipping can occur. In such cases, the square current phasor path pattern can be recommended [5], as it provides higher torque margin (at least in some positions). This, however, comes at the expense of introducing torque variation and therefore greater mechanical vibration of the whole motor body. The aim of this paper is to provide other meaningful pattern choices for microstepping signals which represent a middle ground between smooth operation of sine-cosine and high peak torque output of quadrature microstepping. This is achieved via a generalization of sine-cosine and quadrature signal to the whole family of p-norm unit circles [7].

Stepper Motor Principle of Operation
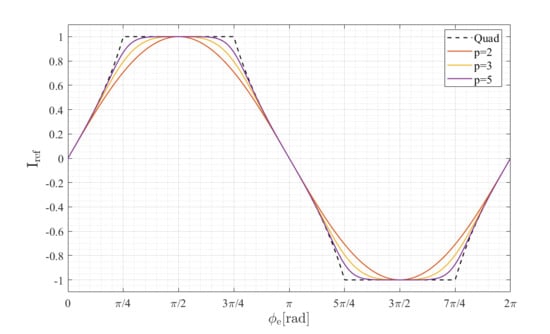
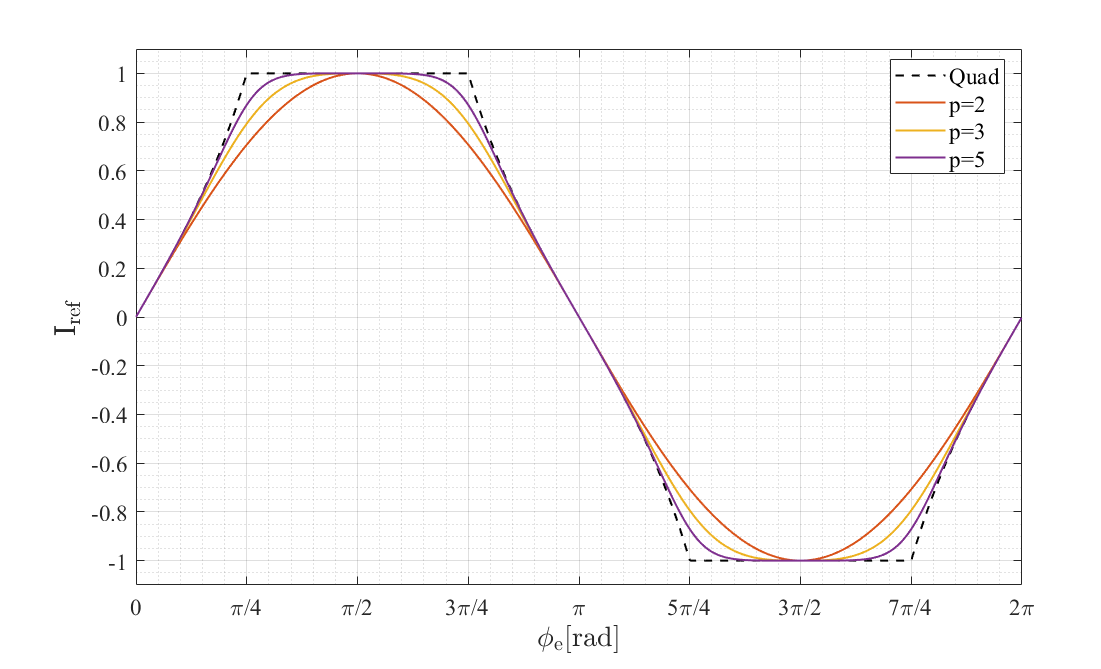
The stepper motor can be classified as a brushless DC motor akin to a switched reluctance machine in its general mechanical and electrical construction [8]. Only stator windings are actively powered, while the rotor consists of permanent magnets, soft magnetic materials, or a combination of both. The combined soft magnetic-permanent magnet construction, known as hybrid, has become dominant, since it can be designed to achieve comparatively high efficiency [9]. In permanent-magnet and hybrid constructions, when no voltage is applied to the stator coils, the number of magnetically stable shaft positions is defined by the ratio of the shaft’s magnetic pole pairs to the number of pole pairs of stator windings. Electrically, stator windings consist of two coils with each of the coils wounded in alternating direction onto an even number of electromagnetic poles, as shown in Figure 1.
An in-depth description of stepper motor construction and their principle of operation can be found in [8].
It is convenient to analyse stepper currents in both Cartesian coordinates of winding currents i A , i B and polar coordinates of phasor length | L | and phasor angle ϕ e related to winding currents as follows:
| L | = i A i n 2 + i B i n 2 ϕ e = atan 2 i A i n , i B i n ,
where i n denotes nominal current per coil. In this paper, we assume that i n is also the maximum acceptable setpoint for coil current.
In polar representation, ϕ e corresponds directly to the shaft position between two adjacent pole pairs [10] and | L | corresponds to the motor torque. The shaft can rotate with current phasor if the vector difference between consecutive states corresponds with force (so–called incremental torque) is greater than, or equal to, the cumulative torque load (the sum of load and friction) [11].
In the simplest control scenario, the current on both coils is switched between ± i n according to a 2-bit Gray code. This method is known as full-step operation [6] and can be described as a simple look up Table 1:
Full-step control can be equivalently described as rotation of phasor of length 2 i n by an angle of π 2 with initial angular offset of π 4 .
By rotating the phasor of length | i n | by a specific angle increment smaller than π 2 , one can achieve an increased positioning resolution and smoother mechanical operation resulting in sine-cosine microstepping [12,13,14]. Since phasor length does not change, the torque variation is effectively absent for motors with perfectly sinusoidal back-EMF [5]. The smaller the angle increment, the smaller the incremental torque. In many cases, this may result in lower positioning accuracy (despite higher positioning resolution) due to a static friction [11]. This effect can be partly mitigated by introducing microstepping, which allows not only phasor rotation, but also its length variation, as shown in Figure 2.
A special case of such signal is quadrature microstepping, which allows only one of i A , i B coordinates at any given point in time to be of the absolute value lower than i n . This is tantamount to achieving the highest possible peak torque and torque increment [5]. However, at the same time, it introduces significant torque variation due to the change in phasor length i II i I (as in Figure 2) [13]. Another drawback of this approach is the highest coils heating (Joule heating), due to relatively high current flowing through the coils.

2. Derivation of p -Circle Signals

Torque margin is a crucial aspect for maintaining low overall discrepancy between current angle and shaft angle. Maintaining adequate torque margin becomes an important problem in small devices when stepper motor cannot be replaced with a bigger one, or when maximum power consumption is a bottleneck. Conversely, in order to minimize mechanical vibrations, torque variation should also be minimized. To satisfy both needs, we use the fact that both sine-cosine’s circular path and quadrature’s square path belong to a wider group of p-norm unit circles. Those can be defined parametrically in a Cartesian coordinates as follows [7]:
x ( ϕ e ) = sin ( ϕ e ) | sin ( ϕ e ) | p + | cos ( ϕ e ) | p p y ( ϕ e ) = cos ( ϕ e ) | sin ( ϕ e ) | p + | cos ( ϕ e ) | p p
where p 1 denotes the specific vector space norm. For p = 2 , this leads to the Euclidean norm and, due to the Pythagorean trigonometric identity, creates a circular path corresponding to sine-cosine microstepping. As p , the curve remains bounded [15] and approaches perfect square of length 2 centered in ( 0 , 0 ) , i.e., quadrature microstepping. By choosing values of p [ 2 , ) (i.e., from euclidean circle to quadrature path) one can achieve different peak torque and torque variation values. Choice of p < 2 leads to a non-zero torque variation and minimum phasor length below 1 and as such does not pose any practical sense as a candidate for microstepping signal. Although there are no obstacles in using any real value of p (from the defined range), in this paper, for the sake of simplicity, only integer values of p will be presented.
It is worth noticing that any p-circle microstepping signal can be generated from the sine-cosine table and the table of Equation (2) denominator values generated for a given value of p. Figure 3 presents curves achieved for a few chosen values of p.
Phasor length L ( ϕ e ) is a transcendental function
L ( ϕ e ) = | sin ( ϕ e ) | p + | cos ( ϕ e ) | p 1 p
Figure 4 presents plots of L ( ϕ e ) in the range of one full electrical revolution for a few chosen values of p.
For sine-cosine microstepping δ L ( ϕ e ) δ ϕ e 0 and, as such, every microstepping resolution produces zero torque variation. In general, for any value of p ( 2 , ) , the Equation (4) holds
δ L ( ϕ e ) δ ϕ e = cos ϕ e p 1 sign cos ϕ e sin ϕ e sin ϕ e p 1 sign sin ϕ e cos ϕ e cos ϕ e p + sin ϕ e p p + 1 p .
Significantly, only for an infinite value of p is there a discontinuity in the plot Figure 5. For any finite p, with increasing microstepping resolution, the function smoothly approaches zero torque variation at points ϕ e = π + k π 4 , k Z . This means that the use of the p-circle shaped phasor path not only leads to a lower maximum torque variation compared to quadrature microstepping, but it also doubles the number of near-zero torque variation points if microstepping resolution is high enough to fit microsteps on both ridges between function extrema.
The points of the minimum phasor length lie at angles k π 2 , k Z and the maximum phasor length corresponds with the angles of π + 2 k π 4 , k Z and equals
L max ( p ) = 1 sin p ( π 4 ) + cos p ( π 4 ) p = 2 p 2 2 p ; lim p L max ( p ) = 2 .
So, for any arbitrarily chosen maximum phasor length L * < 1 , 2 > , a proper value p * of p can be derived using the formula
p * = 2 1 2 log 2 L * .
By discretizing signals in the ϕ e domain, microstepping signals of given resolution are obtained. The resolution is defined as the number of points between two consecutive full steps; that is, the number of points at every quarter-wave. Figure 6, Figure 7, Figure 8 and Figure 9 show module variation and incremental torque relative to a sine-cosine microstepping (of the same resolution) for two exemplary p-circle signals. Module variation is defined as the difference between unit phasor and phasor length at a particular point of the signal curve. Figure 10 presents the relationship between minimum and maximum incremental torque and microstepping resolution. It can be inferred from this that the relationship between maximum incremental torque of a given shape and sine-cosine microstepping does not depend on the microstepping resolution.

3. Materials and Methods

A test bench was prepared in order to compare the influence of different signal shapes on the movement of the stepper motors. The test bench consists of a stepper motor, motor load, microcontroller, power stage, angular position sensor and PC. The key parameters of the experimental table can be found in Table 2 and the parameters of the stepper motor can be found in Table 3.
Figure 11 and Figure 12 present the schematic of the laboratory stand and the actual laboratory stand used in this study, respectively.
An SM57HT76-2804B bipolar stepper motor was chosen with each coil driven by an independent ST L6203 DMOS H-Bridge driver. A Texas Instruments TMDSCNCD28335 control card serves as the control unit. Coil currents are measured by a pair of ACEINNA MCA1101-5-3 AMR sensors [16]. The sensors were individually calibrated in the whole range of measured currents to ensure precise current control on both coils.
Constant load torque is applied to the motor shaft in the form of gravitational force generated by mass m l o a d = 3.09 kg suspended on a nylon string of negligible mass wound on a lightweight aluminum pulley of mass m p u l l e y , whose moment of inertia J p u l l e y is also neglected. The string together with the pulley gave a lever of suspension equal to r = 2.19 cm, while the string was fully tensioned by the weight. This yields T l o a d = 6.67 kg·cm of load against the nominal torque of 18.9 kg·cm of the tested motor.
Shaft position is measured by a Renishaw VIONIC® incremental optical encoder [17], which provides a resolution of 180 e 3 pulses per revolution (physical line count 9000 with x20 interpolation provided by the readhead). For 1.9 deg/step mechanical resolution of motor with x32 microstepping, this yields exactly 28.125 pulses/microstep, which is sufficient to measure shaft oscillations at the sub-microstep scale for microstepping resolutions up to and including x32. Encoder data are processed by the TMS320F28335 eQEP module into the angular position. The PC is used to acquire, save and analyse data obtained by the microcontroller.
Motor currents are controlled by PI controllers with clamping type anti-windup. The controllers are synchronized with PWM outputs which switch the H-bridge transistors with frequency f P W M = 50 kHz. Current reference is changed according to stepping tables generated in the Matlab® environment, in which phase-space equations presented in Section 2 are implemented and cast to the time domain. This ensures that for every p-norm signal, the same set of phasor angles is achieved, and in case of an ideal motor geometry, no load applied to the motor and ideal currents control, no difference in shaft position should be observed between all analysed signals. Figure 13, Figure 14, Figure 15 and Figure 16 exemplify currents generated in motor coils on the test setup.
Code Composer Studio is used to start and control experiment sequences. The first sequence directs the motor to move in the counterclockwise direction with a constant rpm value. Rotational speed was adjusted for different microstepping resolutions, as shown in Table 4. Those values were chosen to minimize the duration of steady-states in shaft position, which do not contain important information about system dynamics. Maximum current per coil is stabilised at the motor nominal value in order to maintain nominal motor performance. Shaft position data and current reference index in the stepping table are both acquired online and stored in microcontroller RAM. Data are sampled at 1 kHz. When the buffer is full, it is sent to a PC using SPI communication. In the second sequence, a switch to clockwise movement occurs when half of the position dataset has been acquired. Experiments were performed in both load and no load conditions. During measurements, no more than one full shaft turn was used in order to maintain constant length of the suspension lever.
Figure 17 and Figure 18 present an example collection of the acquired data for a quadrature microstepping when load has been applied to the a motor shaft.
In Figure 17, a characteristic periodic curvature can be observed. Plotting position together with AB coil currents, as done in Figure 18, exposes the probable relation of this phenomenon, with a change in phasor length.

4. Results

In total, 144 experiments under mechanical load were recorded and analysed. Every dataset was cut to a series of step responses, where the medium value from the previous step in series (see Figure 18) is treated as a zero and the signal is debiased accordingly. Such signal undergoes normalization to a full shaft revolution (i.e., is divided by an encoder resolution). The reference signal is generated, which corresponds with the ideal increment of the position of 200 steps/revolution motor for a given microstepping resolution. This pair of signals (reference position and actual position) is then treated as input (reference position) and output (actual position) of the I I n d order damped oscillator [18,19,20] given by continuous transfer function (7). The choice of I I n d order system is inferred from [20].
G ( s ) = K T 2 s 2 + 2 T ζ s + 1 ,
where K—static gain, T—natural harmonic frequency, ζ —damping factor.
An example of an input–output signal pair is given in Figure 19.
Each input-output pair is fed to tfest() function of the Matlab® environment, in order to estimate the parameters of model (7). For every signal and microstepping resolution, both the mean and the median values were calculated from datasets of size specified in Table 5.
Figure 20, Figure 21 and Figure 22 present the results of identification as mean and median values of static gain and damping factor against signal shape (for increasing values of p).
Both static gain spread and minimal damping deprivation can be clearly seen on the scatter plot. Figure 23 exemplifies those for chosen p-circle signals.
Figure 20, Figure 21 and Figure 22 clearly suggest that, in our case, the experimental setup of the value of p = 3 leads to satisfying results in terms of step homogeneity (as the mean and median values of static gain are roughly equal).
The above analysis is obviously based on many silent assumptions regarding the nature of stepper motor movement, due to an arbitrary choice of reference model given by Equation (7). As such, it gives a limited and biased insight into the effect the microstepping shape has on shaft positioning. As a complementary approach, a more direct parameter of positioning error was also analysed. Here, normalization to one full step was chosen to provide a better perspective for analysis. For each experiment datum, an idealized reference position was generated, as shown in Figure 24 and error between the reference and measured position is calculated, as shown in Figure 25 and Figure 26. Figure 27 presents the mean of absolute error calculated from all gathered measurements with load applied.
As can be seen in Figure 24, introducing load to the system leads to a stronger step variation and stronger oscillation variation (especially for high values of p). By adjusting the p value, those effects can be partially mitigated. Error analysis provides a clear suggestion that the optimal signal shape (in the sense of positioning accuracy) is neither sin-cos nor quadrature. In particular, 3-norm ( p 3 ) microstepping with load applied roughly follows the one with no load (where signal shape is generally not important) and positioning error presents overall best results in our test scenario.

5. Discussion

A novel generalization of the sine-cosine and quadrature signal to a whole family of the p-norm unit circle for a stepper motor is presented in the paper. The mathematical derivation of the p-norm unit circle, as well as application analyses regarding stepper motor, are provided. Generalised p-norm signals are used to generate reference phase currents for a stepper motor coils. A number of tests were performed on the experimental test bench to analyse the influence of the control method on the performance of the motor both in load and no load conditions. A broad statistical analysis of the acquired results is presented. It has been found that the generalised p-norm unit circle allows a payoff selection in the whole range between maximum torque output, torque variation, microstep homogeneity and average angle positioning error. A selection of the p value may depend on a particular case due to: selected motor, control strategy, load, etc. It has been demonstrated that, in our particular case, selecting the sinp3 shape reduces the average positioning error in comparison to the square based control, while maintaining sufficient maximum torque. The proposed methodology can be applied to any particular case, in order to select a value of p that best matches certain conditions. However, based on our research, no generalization regarding p selection can be derived.

Author Contributions

Conceptualization, B.B.; methodology, B.B. and K.J.; software, B.B.; validation, K.J. and A.G.; formal analysis, B.B.; investigation, B.B.; resources, K.J.; data curation, B.B.; writing—original draft preparation, B.B.; writing—review and editing, K.J.; visualization, B.B. and K.J.; supervision, A.G.; project administration, A.G.; funding acquisition, A.G. All authors have read and agreed to the published version of the manuscript.

Funding

The APC was founded by the Warsaw University of Technology within the IDUB-Open Science Program.

Institutional Review Board Statement

Not applicable.

Informed Consent Statement

Not applicable.

Data Availability Statement

Measurement data can be found at https://github.com/Fiamat/stepper_p-circles (accessed on 29 August 2021).

Acknowledgments

We would like to show our gratitude to the Malesza Wiktor for sharing valuable insights and expertise and for his editorial support. Sincere thanks to Renishaw Poland for contributing high resolution optical encoder which was a crucial part of our test setup.

Conflicts of Interest

The authors declare no conflict of interest. The funders had no role in the design of the study; in the collection, analyses, or interpretation of data; in the writing of the manuscript, or in the decision to publish the results.

References

  1. Zribi, M.; Chiasson, J. Position control of a PM stepper motor by exact linearization. IEEE Trans. Autom. Control 1991, 36, 620–625. [Google Scholar] [CrossRef]
  2. Bodson, M.; Chiasson, J.N.; Novotnak, R.T.; Rekowski, R.B. High-performance nonlinear feedback control of a permanent magnet stepper motor. IEEE Trans. Control. Syst. Technol. 1993, 1, 5–14. [Google Scholar] [CrossRef]
  3. Marino, R.; Peresada, S.; Tomei, P. Nonlinear adaptive control of permanent magnet step motors. Automatica 1995, 31, 1595–1604. [Google Scholar] [CrossRef]
  4. Shin, D.; Kim, W.; Lee, Y.; Chung, C.C. Phase-Compensated Microstepping for Permanent-Magnet Stepper Motors. IEEE Trans. Ind. Electron. 2013, 60, 5773–5780. [Google Scholar] [CrossRef]
  5. Anish, N.K.; Krishnan, D.; Moorthi, S.; Selvan, M.P. FPGA based microstepping scheme for stepper motor in Space-Based Solar Power Systems. In Proceedings of the 2012 IEEE 7th International Conference on Industrial and Information Systems (ICIIS), Chennai, India, 6–9 August 2012; pp. 1–5. [Google Scholar] [CrossRef]
  6. Angadi, S.; Saikumar, V.; Satyanarayana Kumari, B. A novel digital controller for microstepping stepper motor drive using FPGA for Solar Array Drive Assembly in satellites-A comparison With alternative schemes. In Proceedings of the 2013 International Conference on Advances in Computing, Communications and Informatics (ICACCI), Mysore, India, 22–25 August 2013; pp. 1724–1729. [Google Scholar] [CrossRef]
  7. Richter, W.D. Generalized spherical and simplicial coordinates. J. Math. Anal. Appl. 2007, 336, 1187–1202. [Google Scholar] [CrossRef] [Green Version]
  8. Khorrami, F.; Krishnamurthy, P.; Melkote, H. Modeling and Adaptive Nonlinear Control of Electric Motors; Springer: Berlin/Heidelberg, Germany, 2003. [Google Scholar]
  9. Ionică, I.; Modreanu, M.; Morega, A.; Boboc, C. Design and modeling of a hybrid stepper motor. In Proceedings of the 2017 10th International Symposium on Advanced Topics in Electrical Engineering (ATEE), Bucharest, Romania, 23–25 March 2017; pp. 192–195. [Google Scholar] [CrossRef]
  10. Kim, W.; Shin, D.; Chung, C.C. Microstepping Using a Disturbance Observer and a Variable Structure Controller for Permanent-Magnet Stepper Motors. IEEE Trans. Ind. Electron. 2013, 60, 2689–2699. [Google Scholar] [CrossRef]
  11. Microstepping of Stepping Motors, The University of Iowa, Department of Computer Science. Available online: http://homepage.divms.uiowa.edu/~jones/step/index.html (accessed on 2 May 2021).
  12. Wang, C.; Cao, D. New Sensorless Speed Control of a Hybrid Stepper Motor Based on Fuzzy Sliding Mode Observer. Energies 2020, 13, 4939. [Google Scholar] [CrossRef]
  13. Ganeshanathan, V.; Munasinghe, S.R. High resolution stepper motor controller for tunable laser. In Proceedings of the 2013 IEEE 8th International Conference on Industrial and Information Systems, Peradeniya, Sri Lanka, 17–20 December 2013; pp. 36–41. [Google Scholar] [CrossRef]
  14. Mukherjee, A.; Karmakar, P.; Kumar Shome, S.; Sen, S.; Datta, U. Precision positioning system for long travel range and submicron resolution. In Proceedings of the 2016 2nd International Conference on Control, Instrumentation, Energy & Communication (CIEC), Kolkata, India, 28–30 January 2016; pp. 83–87. [Google Scholar]
  15. Szabó, Z.; Bokor, J. L/sup p/norm convergence of rational orthonormal basis function expansions. In Proceedings of the 38th IEEE Conference on Decision and Control (Cat. No.99CH36304), Phoenix, AZ, USA, 7–10 December 1999; Volume 4, pp. 3218–3223. [Google Scholar]
  16. Data Sheet 6020-1104-01 Rev B MCA1101-xx-3, ACEINNA. Available online: https://www.mouser.com/datasheet/2/940/6020-1104-01_B_Datasheet_2c_Current_Sensor_Fix_Gai-1622847.pdf (accessed on 23 September 2021).
  17. Data Sheet L-9517-9678-05-A. In VIONIC® Series Encoder System; Renishaw PLC.: Wotton-under-Edge, UK, 2020.
  18. Jackiewicz, K.; Stras, A.; Ufnalski, B.; Grzesiak, L. Comparative study of two repetitive process control techniques for a grid-tie converter under distorted grid voltage conditions. Int. J. Electr. Power Energy Syst. 2019, 113, 164–175. [Google Scholar] [CrossRef]
  19. Galecki, A.; Grzesiak, L.; Ufnalski, B.; Kaszewski, A.; Michalczuk, M. Multi-oscillatory current control with anti-windup for grid-connected VSCs operated under distorted grid voltage conditions. In Proceedings of the 2017 19th European Conference on Power Electronics and Applications (EPE’17 ECCE Europe), Warsaw, Poland, 11–14 September 2017; pp. 1–10. [Google Scholar] [CrossRef]
  20. Kaszewski, A.; Grzesiak, L.; Ufnalski, B. Sterowanie Napędów Elektrycznych, 1st ed.; Wydawnictwo Naukowe PWN: Warsaw, Poland, 2016. [Google Scholar]
Figure 1. Schematic of a bipolar stepper motor. Letters A and B denote separate electrical coils. The coil letter color denotes the winding direction of the stator pole (either clockwise or counterclockwise).
Energies 14 06107 g001
Figure 2. Analysis of the vector difference i TR between two consecutive current phasors i I and i II . Incremental torque corresponds with rejection of i TR onto i I denoted by i ROT . Signal curvature is then defined by projection i MOD .
Energies 14 06107 g002
Figure 3. p-circles for different values of p. The quad denotes quadrature microstepping.
Energies 14 06107 g003
Figure 4. Phasor length for different values of p.
Energies 14 06107 g004
Figure 5. Derivative of phasor length for different values of p.
Energies 14 06107 g005
Figure 6. Torque variation and increment relative to a sine-cosine microstepping of equal resolution; p = 3 , microstepping resolution x8.
Energies 14 06107 g006
Figure 7. Torque variation and increment relative to a sine-cosine microstepping of equal resolution; p = 3 , microstepping resolution x16.
Energies 14 06107 g007
Figure 8. Torque variation and increment relative to a sine-cosine microstepping of equal resolution. For p = 10 resolution, x8 becomes too low to guarantee the drop in torque variation at ϕ e = π + k π 4 .
Energies 14 06107 g008
Figure 9. Torque variation and increment relative to a sine-cosine microstepping of equal resolution; p = 10 microstepping resolution x16.
Energies 14 06107 g009
Figure 10. Maximum and minimum incremental torque for different signal shapes and microstepping resolutions. Quadrature microstepping with resolution x2 is equivalent to half step movement.
Energies 14 06107 g010
Figure 11. Schematic of the test setup.
Energies 14 06107 g011
Figure 12. Photo of the test setup. The acquired shaft position dataset can be seen on the PC screen.
Energies 14 06107 g012
Figure 13. A–B coil currents in the half-step control scheme.
Energies 14 06107 g013
Figure 14. A–B coil currents in the quadrature control scheme with resolution x16.
Energies 14 06107 g014
Figure 15. A–B coil currents in the p-circle control scheme for p = 8 with resolution x16.
Energies 14 06107 g015
Figure 16. Zoom on A–B coil currents microsteps of sine-cosine microstepping with resolution x32.
Energies 14 06107 g016
Figure 17. Presentation of a full collection of 12,000 data points sampled at 1 kHz. Odometry count is the raw position data obtained from the incremental encoder. The motor was working under the load in the quadrature x16 mode.
Energies 14 06107 g017
Figure 18. Zoom on the region of rapid change in amplitude of shaft oscillation with related A (red) B (blue) coil currents reference shown.
Energies 14 06107 g018
Figure 19. An example of input-output signals used for system identification. Output signal obtained from raw position data by defining steady initial condition and debiasing.
Energies 14 06107 g019
Figure 20. Medium and median values of estimated parameters for selected microstepping signals at x8 resolution. Horizontal axis is not of uniform scale, since quadrature signal corresponds with p = ∞. Axis label s denotes sine-cosine microstepping.
Energies 14 06107 g020
Figure 21. Medium and median values of estimated parameters for selected microsptepping signals at x16 resolution.
Energies 14 06107 g021aEnergies 14 06107 g021b
Figure 22. Medium and median values of estimated parameters for selected microsptepping signals at x32 resolution.
Energies 14 06107 g022
Figure 23. Scatter plot of damping factor against static gain for chosen microstepping signals.
Energies 14 06107 g023
Figure 24. Influence of load and signal shape on shaft position over one full step.
Energies 14 06107 g024
Figure 25. Influence of load and signal shape on shaft position error over one full step.
Energies 14 06107 g025
Figure 26. Influence of microstepping resolution for the selected p-circle signal on shaft position error. Time range is chosen so as to include one full step of recorded data with lowest angular velocity.
Energies 14 06107 g026
Figure 27. Positioning error against signal shape for different microstepping resolutions. Error calculated only from experiments in which load was applied to the motor shaft.
Energies 14 06107 g027
Table 1. Full-step control table.
AB
+ i n i n
+ i n + i n
i n + i n
i n i n
Table 2. Key parameters of the experimantal table.
J pulley [ kg · cm 2 ] m pulley [ kg ] T load [ kg · cm ] m load [ kg ] r [ cm ] f PWM [ kHz ]
0.1140.05816.673.092.1650
Table 3. Nominal parameters of the SM57HT76-2804B bipolar stepper motor. “spr” means “steps per revolution”.
I phase [ A ] R phase [ Ω ] L phase [ mH ] T n [ kg · cm ] J rotor [ kg · cm 2 ] spr
2.81.133.618.90.48200
Table 4. Shaft rotational speed set in experiments as a function of microstepping resolution.
x8x16x32
0.5 rpm 0.25 rpm 0.176 rpm
Table 5. Number of estimated models per microstepping signal, dependent only on signal resolution.
x8x16x32
552552783
Publisher’s Note: MDPI stays neutral with regard to jurisdictional claims in published maps and institutional affiliations.

