Article

Parametric Study for Thermal and Catalytic Methane Pyrolysis for Hydrogen Production: Techno-Economic and Scenario Analysis

1
School of Energy and Chemical Engineering, Ulsan National Institute of Science and Technology (UNIST), 50 UNIST-gil, Eonyang-eup, Ulju-gun, Ulsan 44919, Korea
2
Department of Energy Engineering, Ulsan National Institute of Science and Technology (UNIST), 50 UNIST-gil, Eonyang-eup, Ulju-gun, Ulsan 44919, Korea
*
Author to whom correspondence should be addressed.
These authors contributed equally to this paper.
Energies 2021, 14(19), 6102; https://doi.org/10.3390/en14196102
Submission received: 13 August 2021 / Revised: 13 September 2021 / Accepted: 16 September 2021 / Published: 24 September 2021
(This article belongs to the Topic Hydrogen Energy Technologies)

Abstract

:
As many countries have tried to construct a hydrogen (H2) society to escape the conventional energy paradigm by using fossil fuels, methane pyrolysis (MP) has received a lot of attention owing to its ability to produce H2 with no CO2 emission. In this study, a techno-economic analysis including a process simulation, itemized cost estimation, and sensitivity and scenario analysis was conducted for the system of thermal-based and catalyst-based MP (TMP-S1 and CMP-S2), and the system with the additional H2 production processes of carbon (C) gasification and water–gas shift (WGS) reaction (TMPG-S3 and CMPG-S4). Based on the technical performance expressed by H2 and C production rate, the ratio of H2 combusted to supply the heat required and the ratio of reactants for the gasifier (C, Air, and water (H2O)), unit H2 production costs of USD 2.14, 3.66, 3.53, and 3.82 kgH2−1 from TMP-S1, CMP-S2, TMPG-S3, and CMPG-S4, respectively, were obtained at 40% H2 combusted and a reactants ratio for C-Air-H2O of 1:1:2. Moreover, trends of unit H2 production cost were obtained and key economic parameters of the MP reactor, reactant, and C selling price were represented by sensitivity analysis. In particular, economic competitiveness compared with commercialized H2 production methods was reported in the scenario analysis for the H2 production scale and C selling price.

1. Introduction

Many countries have tried to accomplish a successful transition of an energy system to hydrogen (H2) based on various political strategies such as ‘The National Hydrogen Strategy’ (2020) in Germany [1], ‘EU Hydrogen Strategy’ (2020) in the EU [2], ‘Basic Hydrogen Strategy’ (2017)’, ‘Strategic Energy Plan’ (2018), and ‘The Strategic Road Map for Hydrogen and Fuel Cells’ (2019) in Japan [3,4,5], ‘Hydrogen in a Low-carbon Economy’ (2018) in the UK [6], ‘H2@Scale’ (2021) in USA [7], and ‘National Hydrogen Roadmap’ (2018) in Australia [8]. These active approaches to an H2-based energy system come from the diverse advantages of H2 as a clean energy carrier: it can be utilized in various energy sectors and easily combined in already constructed infrastructure, and, even though its volumetric energy density is relatively low, it shows a very high energy density of 120–142 MJ kg−1 in the compressed state [9,10,11,12,13,14,15]. For the conventional production of H2, energy-intensive processes such as reforming, partial oxidation, and auto-thermal reforming of carbon-based fuels such as methane (CH4) and hydrocarbon have been mainly used. However, these conventional methods, including steam methane reforming (SMR), have led to negative environmental effects due to large emissions of carbon dioxide (CO2) [16,17,18,19]. Due to the environmental issues of conventional methods, a lot of recent research has suggested water electrolysis (WE) powered by renewable energy as an alternative eco-friendly solution to produce H2 because there is no CO2 emission in the procedure [20,21,22]. However, there are still technical and economic challenges to be immediately utilized [23,24,25]; most H2 production still depends on conventional methods with additional processes to reduce CO2 such as SMR with CO2 capture and storage (SMR with CCS) [26,27,28].
To overcome the limitations of current H2 production methods, the concept of thermal methane pyrolysis (TMP), where H2 and carbon (C) are directly produced in the gas phase (Equation (1)), has been paid attention as an alternative, novel H2 production method owing to several technical, economic, and environmental benefits as follows: (a) there is no oxygen (O2) in the reaction leading to no CO2 emissions or additional separation process, theoretically; (b) the process can be relatively simplified and lower energy is required than other methods such as reforming or partial oxidation; (c) reactant of the process, methane, is abundant and cheap leading to a cost effective operation of the process; (d) C products can be marketed because they are usually used as raw materials in various valuable materials such as rubber, tires, and pigments, etc.; (e) the separation of C is much easier than the separation of CO2; (f) it requires a lower amount of heat compared to SMR (Equation (2a–c)) and WE (Equation (3)), which are the most common and novel H2 production methods (Equations (1)–(3)) [29,30,31,32,33,34,35,36,37,38].
(1) CH 4     2 H 2 + C   ( s ) Δ H ° = 75   kJ   mol 1 (2a) CH 4 +   H 2 O     3 H 2 + CO Δ H ° = 206   kJ   mol 1 (2b) CO + H 2 O     H 2 +   CO 2 Δ H ° = 41   kJ   mol 1 (2c) CH 4 + 2 H 2 O     4 H 2 +   CO 2 Δ H ° = 165   kJ   mol 1 (3) H 2 O     H 2 + 1 2 O 2 Δ H ° = 285   kJ   mol 1
Because of its endothermicity and strong C–H bonding, TMP is usually operated at over 1373 K to obtain reasonable yields of H2 and C leading to cost ineffectiveness and a large amount of energy being required [39,40]. These problems of having to use high temperature can be reduced by catalytic methane pyrolysis (CMP) where various types of catalysts (non-supported, metal supported, metal oxide supported, and carbonaceous, etc.) are adopted. Among the various catalysts used in CMP, the metal-based catalyst has very critical systematic limitations such as high toxicity of metal and rapid deactivation of the catalyst due to encapsulation of the active metal sites with C product [41]. Thus, carbon-based CMP has a lot of attention owing to the properties of carbon catalysts such as lower cost, higher stability, temperature resistance, and their ability to be safely stored due to their non-toxicity.
Based on the benefits of the concept of MP, many kinds of research have been conducted: Nishii et al. [42] carried out MP with different carbon-based catalysts (activated carbon, carbon black, mesoporous carbon, and carbon nanofiber) and found that all of these catalysts continued to maintain a CH4 conversion of about 17% for longer than 600 min by catalyzing the produced C. It was reported that the produced C covered the catalyst surface, resulting in a specific surface area of 10 m2 g−1 and an intensity of D-Raman peak and G-Raman peak (Id/Ig) from 1.5 to 1.57 irrespective of the original structures of C. Tezel et al. [43] designed an experiment using CMP with a calcium silicate-based Ni–Fe catalyst with different Fe loading by using the co-impregnation method. It was revealed that the addition of Fe can delay the deactivation of the Ni catalyst and an increase in the CH4 flow rate can decrease the initial reactant conversion and lifetime of the catalyst. It was reported that the highest methane conversion of 69% is obtained at 973 K with the catalyst that has the highest Fe addition. Quan et al. [44] investigated the optimization of a fluidized bed reactor (FLBR) for CMP using 40 wt% Fe/Al2O3 catalyst, and catalyst activity and stability were investigated after optimization in terms of the catalyst bulk density, bed height, and particle size, etc. It was reported that the reaction conditions of 12 L (gcat h)−1 feed dilution of 20% H2-CH4, and CO2-regeneration of deactivated catalysts are the best conditions for MP. Patzschke et al. [45] investigated promising catalysts for particle suspension in molten NaBr-KBr and reported that mixed Co–Mn catalysts can be optimal candidates for methane pyrolysis in molten salts owing to their fast kinetics and stability. The authors reported that increasing the ratio of molar Co–Mn from 0 to 2 improved the conversion of CH4 from 4.8% to 10.4% at 1273 K for the smallest catalyst particle size range, which shows that closeness between the catalytic surface and the gas phase can improve conversions. Karaismailoglu et al. [46] investigated the effect of the doping of yttria on a nickel catalyst synthesized by the sol–gel citrate method and reported CH4 conversion of 50% with this type of catalyst. It was reported that the addition of Yttria can improve the stability and activity of catalysts at elevated temperatures and that a lower nickel ratio in the catalyst reduces the formation of carbon. Not only experimental studies but also systematic approaches using process simulations and works for economic feasibility have been reported. Chen et al. [47] designed the vacuum promoted methane decomposition with carbon separation (VPMDCS), which include a reactor of MP continuously generating H2 and a C separation reactor converting carbon into CO. It was reported that VPMDCS showed CH4 conversion of 99.2% and produced high-purity H2 and CO with concentrations of both 99.6%. By economic analysis, the unit hydrogen cost of EUR 5.4 kg−1 was reported. Riley et al. [48] simulated two concepts of CMP that used H2 combustion and CH4 combustion by Aspen Plus® comparing CO2 emissions and H2 production cost. It was revealed that the quality of produced C and its selling price are major factors in H2 selling price, and H2 production cost in the capacity of 216 ton d−1 is less than USD 3.25 kgH2−1 without considering the sale of C. Perez et al. [49] designed an MP process using a quartz bubble column including molten gallium, which is used for catalyst and heat transfer agents, with a porous plate distributor. The authors found that a maximum CH4 conversion of 91% was achieved at a reactor temperature of 1392 K where gallium occupied 43% of the total reactor volume with a residence time for a bubble of 0.5 s. Additionally, by techno-economic analysis, it was concluded that a molten metal system can be competitive with SMR if a CO2 tax of EUR 50 ton−1 is imposed and produced C is marketed. Kerscher et al. [50] designed two concepts of MP using electron beam plasma, which was generated from renewable electricity. The techno-economic assessment reported that levelized costs of H2 for the electron beam plasma method ranged from 2.55 to 5.00 € kgH2−1, and CO2 emission ranged from 1.9 to 6.4 kgCO2 eq. kgH2−1 from a carbon footprint assessment, which shows a high potential for reducing life cycle emissions. Zhang et al. [51] investigated the CO2 mitigation costs of CMP and the integrated power generation process in a fuel cell comparing a combined-cycle gas turbine power plant system with and without CCS. It was revealed that CMP shows low life cycle emissions per unit of electricity output of 0.13 tCO2 eq MWh−1 but shows a high levelized cost of electricity of EUR 177 MWh−1, concluding that it has high potential when assumed that produced C can be sold at current prices. Timmerberg et al. [52] assessed the levelized hydrogen production costs and life cycle greenhouse gas (GHG) emissions from MP in three systems where molten metal, plasma, and thermal gas reactors were used. It was reported that the plasma-based system using electricity from renewable sources shows the lowest emissions of 43 gCO2 MJ−1, and the molten metal and thermal gas system shows relatively higher GHG emissions due to the additional combustion and natural gas supply chain.
Even though many types of research have been conducted on the concepts of TMP and CMP, very few studies revealing both technical and economic viability of those technologies are reported, to the best of our knowledge. Therefore, in this study, a preliminary techno-economic parametric study is conducted to comprehensively investigate the feasibility of the concept of methane pyrolysis (MP). Firstly, a process simulation using Aspen Plus® for various MP processes, namely TMP and CMP, and with additional carbon gasification (TMPG and CMPG) are performed with detailed reaction kinetics under various technical parameters of reaction temperature, ratio of fuel combusted, and ratio of reactants for gasifier (C-Air-H2O) (Figure 1). Based on the technical performance from the process simulation, yields of H2 and C, and the amount of fuel required to supply heat to the MP reactor and gasification unit are obtained, and then, economic feasibility in terms of unit H2 production cost is reported. In addition, to suggest future economic guidelines of this novel concept when this is commercialized, sensitivity and scenario analysis regarding various H2 production scales and different C selling price scenarios are conducted revealing the cost competitiveness compared to the conventional H2 production methods of SMR and SMR with CCS.

2. Methods

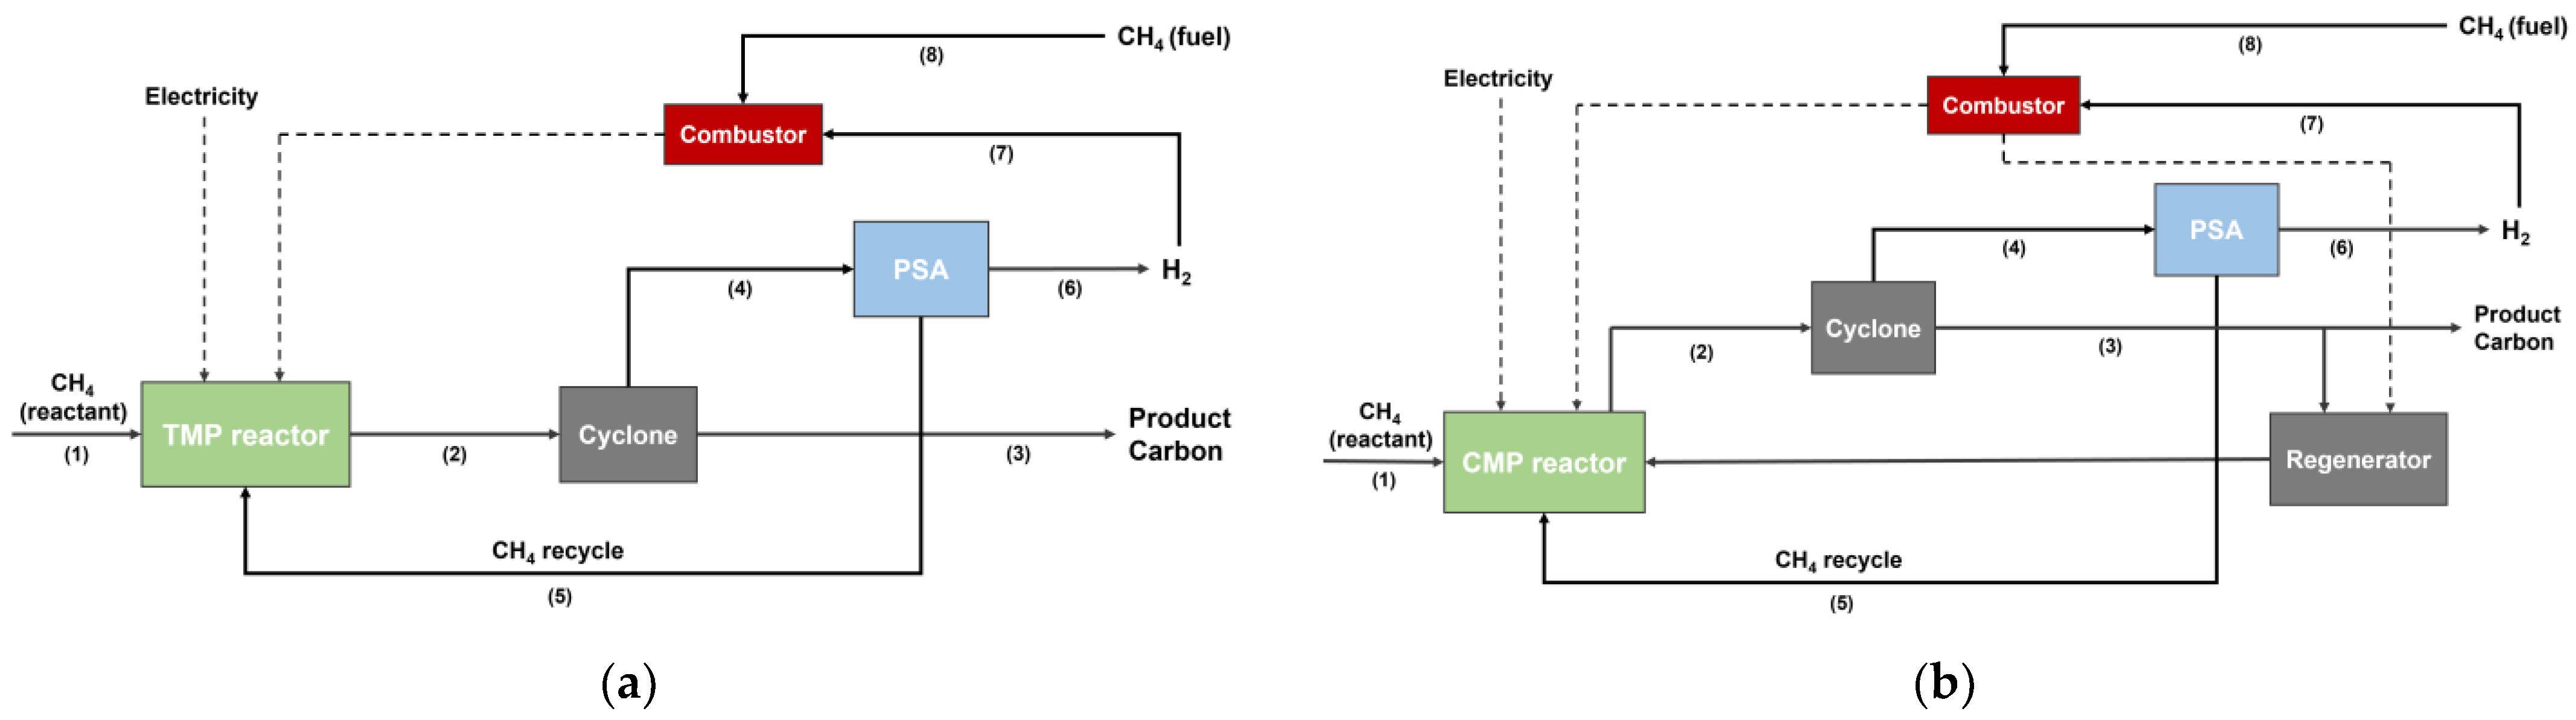
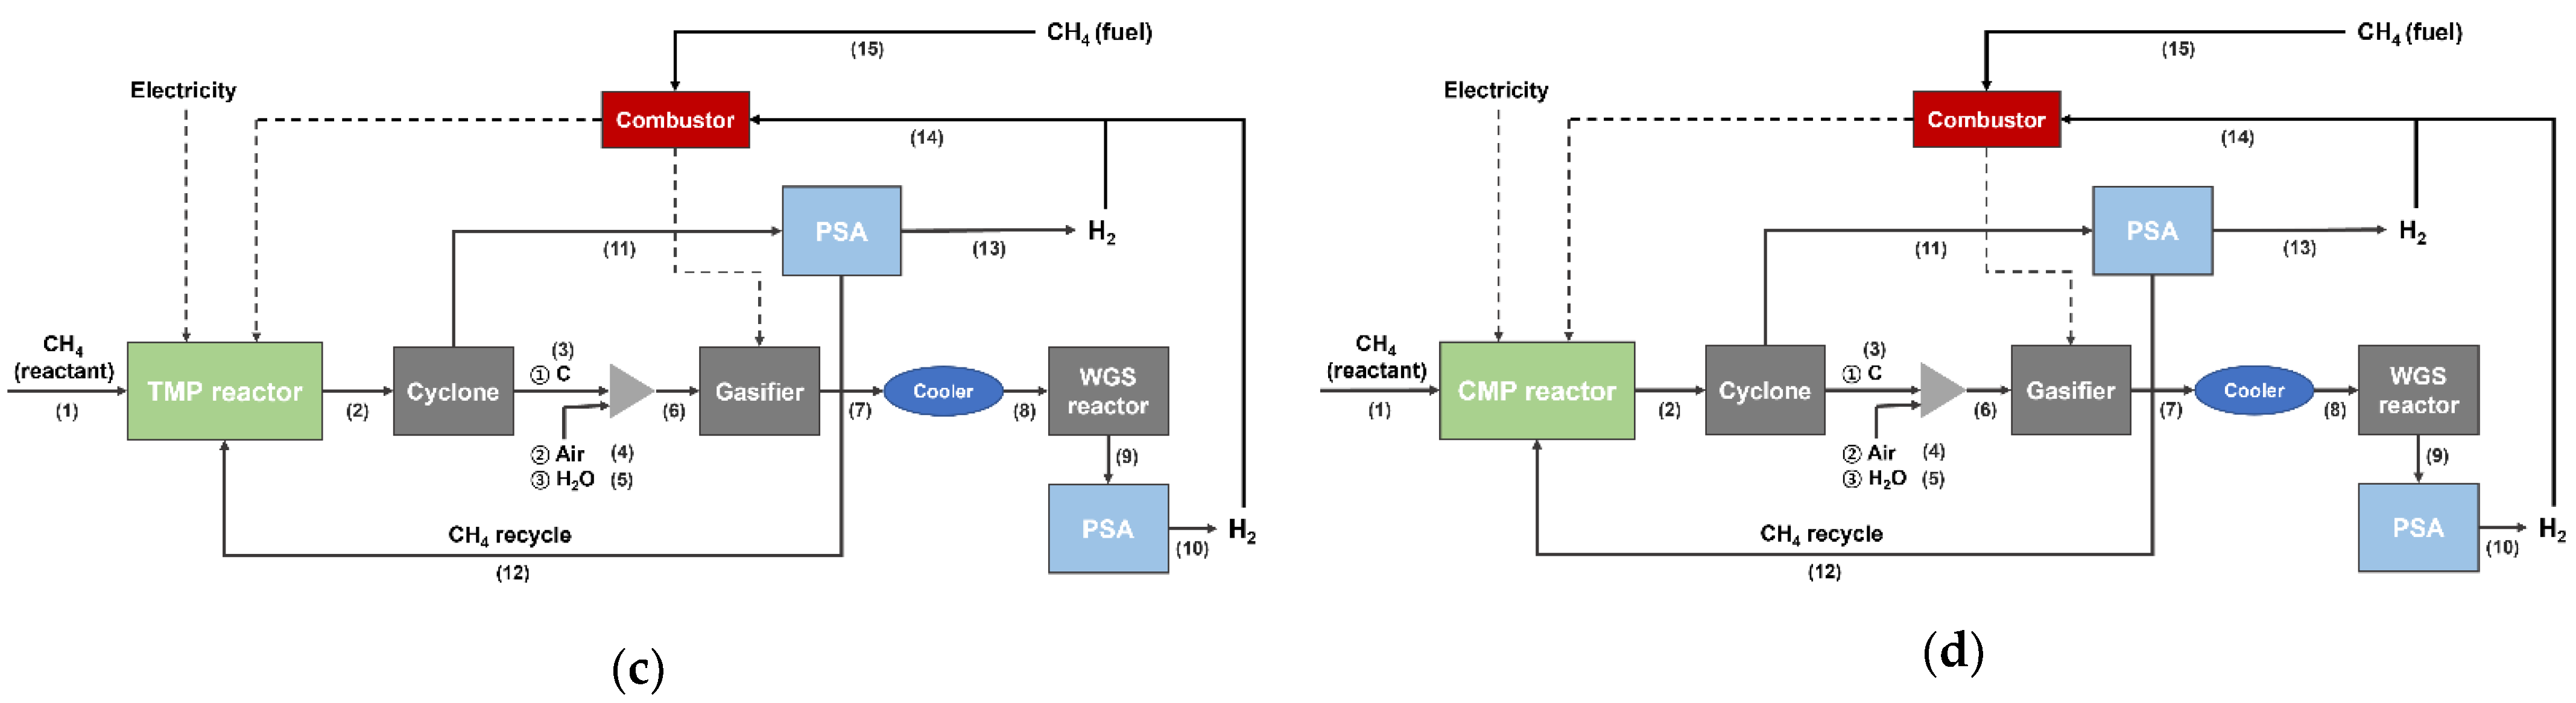
2.1. Process Simulation

In this study, four systems for MP, classified as TMP-S1, CMP-S2, TMPG-S3, and CMPG-S4, were simulated in Aspen Plus® (Aspen Technology, Inc., Bedford, MA, USA) with detailed reactor validation based on kinetics reported by Keipi et al. [53] for TMP and Kim et al. [54] for CMP. As a result, Figure 2 shows the closeness of methane conversion between experimental and simulated methods at each investigated operating conditions validating proper insertion of reported kinetics to Aspen Plus®.
For all systems, CH4 entered the validated reactor in different temperature ranges of 1073–1373 K for TMP-S1 and TMPG-S3, and 1023–1173 K for CMP-S2 and CMPG-S4, then, product stream containing remained CH4 and produced H2 and C passed through the units of cyclone and pressure swing adsorption (PSA) for separating solid C and H2, respectively (Figure 3). We assumed the pressure drop of cyclone as 0.01 bar and number of cyclones as only one and assumed separation efficiency of PSA as 100%. Especially for CMP-S2 and CMPG-S4, purified C entered the gasification unit to produce additional H2 and carbon monoxide (CO) with different ratios of C, air, and water (H2O) (1:1:1, 1:1:2, 1:1:3, 1:2:1, and 1:3:1), and water-gas shift (WGS) (Equation (2b)) reactor was followed to convert the produced CO to H2. Additionally, for the heat supply system, various heat supply scenarios were assumed and classified as 100% electricity-based and different ratios of H2 combusted (0%–100% matched with 100%–0% CH4 combusted). Based on the result of the process simulation, material balance was obtained at the temperature of 1273 K for TMP-S1 and TMPG-S3 and 1173 K for CMP-S2 and CMPG-S4, with the ratio of H2 combusted of 40%, and the ratio of reactants for the gasifier of 1:1:2 (C-Air-H2O) (Table 1).

2.2. Itemized Cost Estimation

To investigate the economic feasibility of each MP system, itemized cost estimation proposed by Turton et al. [55] was conducted considering various parameters of reaction temperature, types of fuel combusted and its ratio, and the ratio of reactant for gasifier. In this method, the unit H2 production cost (USD kgH2−1) is obtained from the sum of the total cost (USD y−1) divided by the total amount of H2 produced (kg y−1). In this study, the total cost is defined as annualized capital cost (USD y−1), which is estimated from original capital cost (USD) by applying capital recovery factor (CRF) as shown in Equation (4), and operating cost (USD y−1). Table 2 shows the list of these.
CRF = i ( 1 + i ) N ( 1 + i ) N 1
where i is a discount rate and N is an economic analysis period.
In addition, to properly estimate each capital cost, the six-tenth rule (Equation (5)) and concept of chemical engineering plant cost index (CEPCI) (Equation (6)) are applied to consider economics of scale and effects of inflation.
C 2 = C 1 ( S 2 S 1 ) 0.6
where C is an equipment cost (USD) and S is a scale of the certain chemical process.
C 2 = C 1 ( I 2 I 1 )
where C is an equipment cost (USD) and I is a CEPCI.
Table 2. List of economic parameters and assumptions used in itemized cost estimation.
Economic Parameters
Capital Cost
MP reactor [56]EUR 2740 k
WGS reactor [56]EUR 59 k
Regenerator [57]USD 12,112,138
Catalyst [58]USD 1.138 kg−1
Gasifier [56]EUR 211 k
PSA [59] CEPCI 392.6 × 1,510,000 × ( inlet   flow   rate 500 ) 0.6 (USD)
Cyclone [58]USD 31,400
Supplement20% of (Capital cost-Supplement) (USD)
Operating Cost
CH4 [60]USD 0.005 MJLHV−1
Catalyst operating costAssumed as 10% loss per month
Water [61]USD 12 ton−1
Electricity [32]USD 56 MWh−1
Labor [62]USD 11 hr−1
PSA operating cost [59] 6.11 × 100 × ( inlet   flow   rate   except   H 2 ) (USD)
C selling price [63]EUR 500 ton−1
Maintenance [64]1% of (Capital cost-Supplement) (USD y−1)
Other cost [64]2% of (Capital cost-Supplement) (USD y−1)
Economic Assumptions
CEPCI (2021)655.9
i0.045
Exchange rateUSD 1 = EUR 0.85
N20 years for MP reactor
10 years for WGS reactor, regenerator, PSA, PSA operating cost, cyclone, and supplement
1 year for catalyst
Stream factor0.95

2.3. Sensitivity and Scenario Analysis

Key economic parameters of each system of MP and future unit H2 production cost with varied C selling price, which can be advantages for economic feasibility, were quantitatively investigated by sensitivity and scenario analysis, respectively. For sensitivity analysis, with varied capital and operating cost in a range of ±20% with other parameters fixed, the degree of variation in unit H2 production cost for each MP system was investigated. In addition, trends of unit H2 production cost for each scenario according to different H2 production scales and C selling prices were obtained and compared to conventional H2 production methods of SMR and SMR with CCS.

3. Results and Discussion

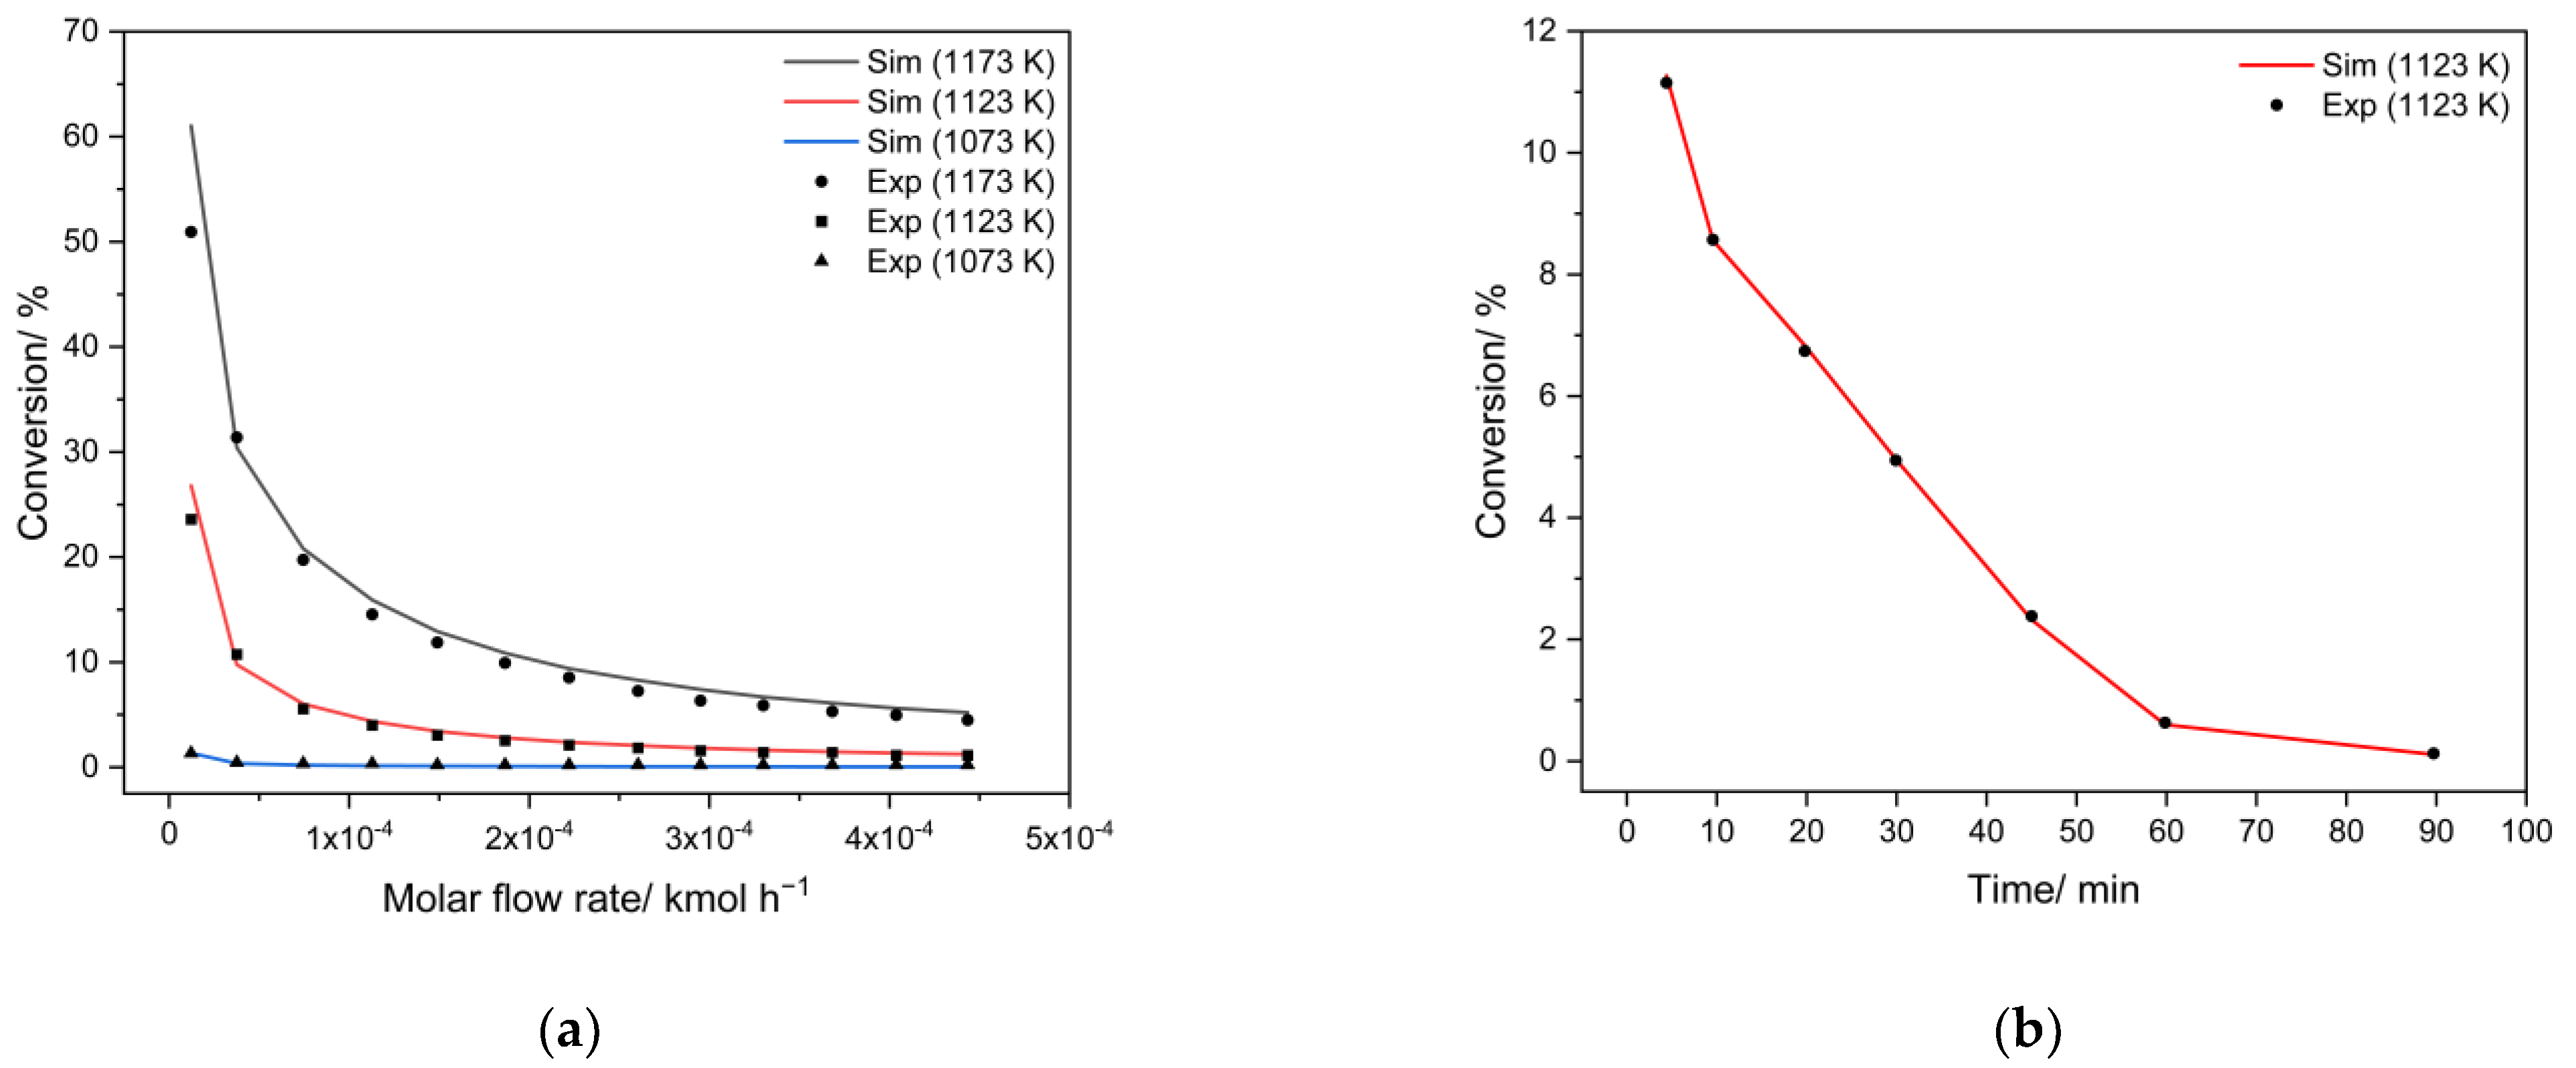
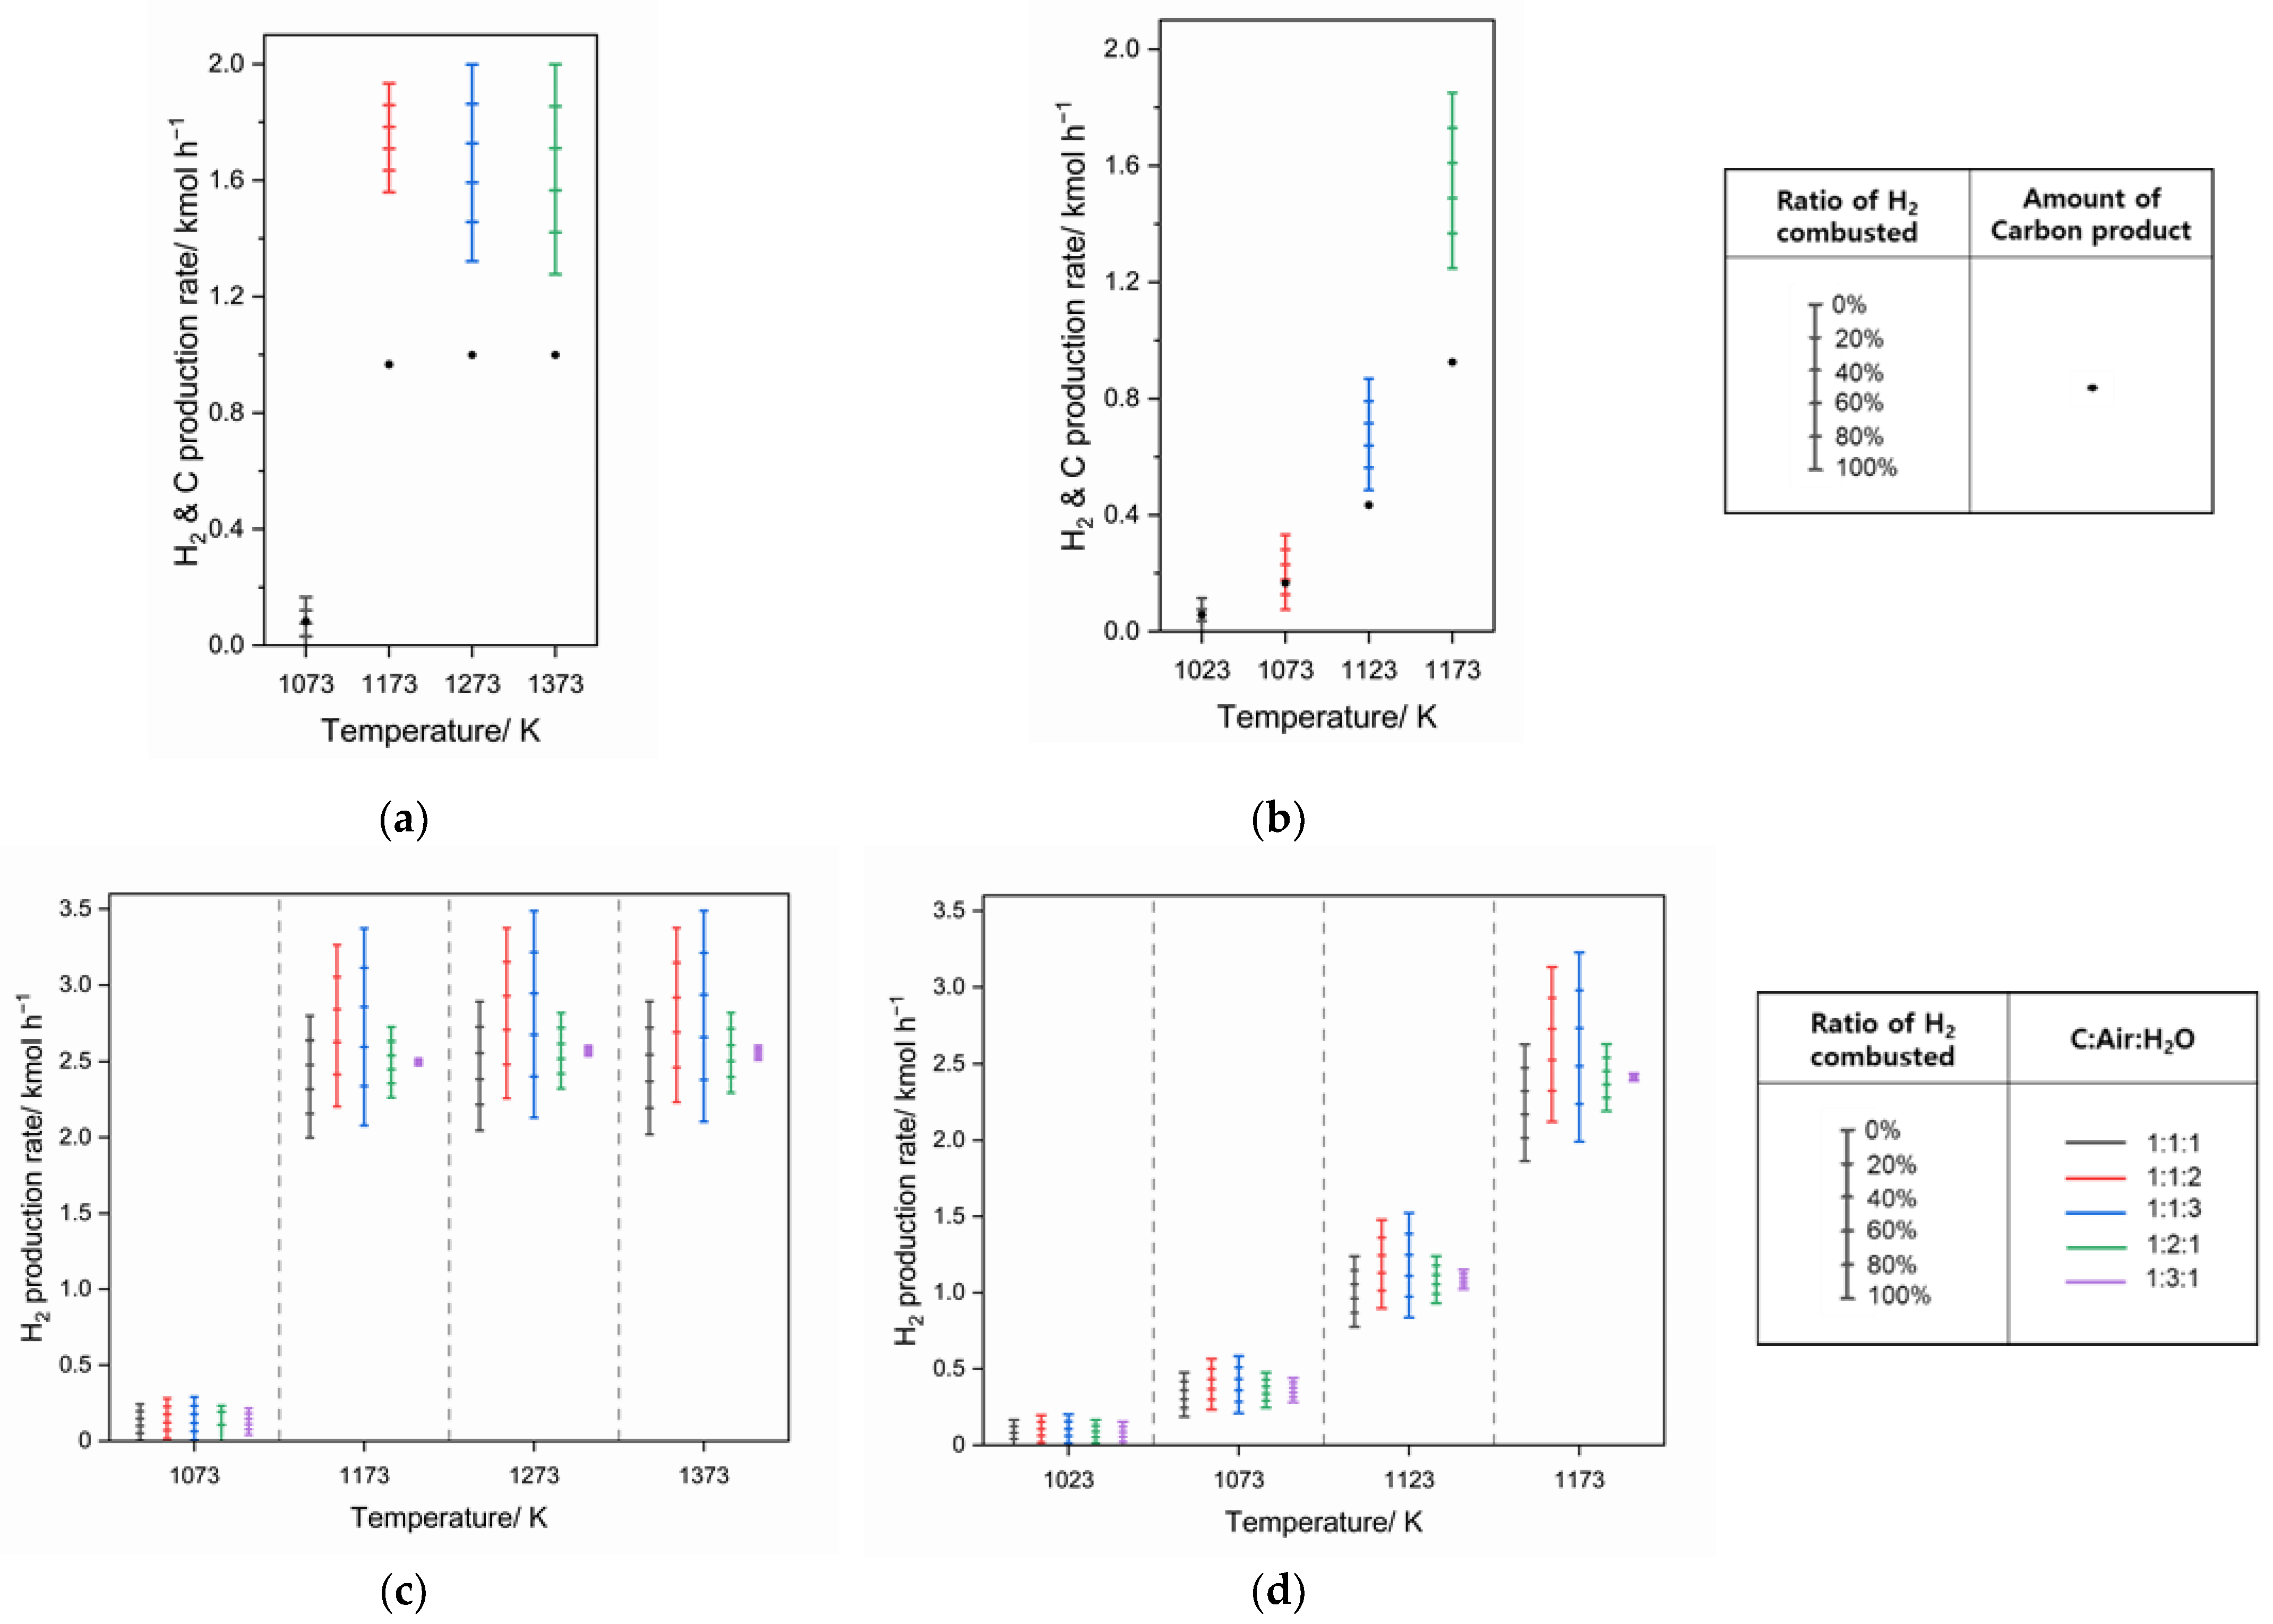
3.1. H2 and C Production Rates

Based on the result of the process simulation, H2 and C production rates for each MP system with a feed CH4 rate of 1 kmol h−1 were obtained at the different operating temperatures of 1073–1373 K for TMP-S1 and TMPG-S3 and 1023–1173 K for CMP-S2 and CMPG-S4, with the ratio of H2 combusted of 0%–100%, and the ratio of reactants composed of C, Air, and H2O (Figure 4).
For TMP-S1 (Figure 4a), net H2 production rates of 0–0.17, 1.56–1.93, 1.32–2.00, and 1.28–2.00 kmol h−1 and C production rates of 0.08, 0.97, 1.00, and 1.00 kmol h−1 were obtained at a temperature of 1073 K, 1173 K, 1273 K, and 1373 K, respectively. As reaction temperature increased, the range of net H2 production rate was highly dependent on the ratio of H2 combusted due to the large amount of heat required and the different thermodynamic properties of each fuel, and produced C was maximized from 1173 K, not even the maximum investigated temperature.
For CMP-S2 (Figure 4b), 0.00–0.12, 0.08–0.33, 0.49–0.87, and 1.25–1.85 kmol h−1 for net H2 production rates and 0.06, 0.17, 0.43, and 0.93 kmol h−1 for C production rates were obtained at temperatures of 1023 K, 1073 K, 1123 K and 1173 K, respectively. Even though an increasing trend of H2 and C production rate and a high dependence of the ratio of H2 combusted was shown, which are similar to the results from TMP-S1, no theoretical maximum amounts of H2 and C (2 and 1 kmol h−1, respectively) were produced.
For TMPG-S3 (Figure 4c), even with the various ratios of C, Air, and H2O for the gasification unit, very low H2 production rates of 0.00–0.29 kmol h−1 were obtained at 1073 K. That poor technical performance, lower than the theoretical H2 production rate of 2 kmol h−1 for the previous system of TMP-S1, was raised by higher reaction temperatures of MP, leading to the improved technical performance of 2.00–3.49 kmol h−1 H2 production rates at 1173–1373 K. For the ratio of reactants in the gasifier, H2 production rates at 1373 K dramatically increased 2.02–2.89 kmol h−1 for a 1:1:1 ratio to rates of 2.10–3.49 kmol h−1 for a ratio of 1:1:3, proving the importance of H2O in the additional H2 production processes of C gasification and the WGS reactor. Compared to the effect of H2O on net H2 production rates, an opposite effect of air was shown with decreased maximum H2 production rates of 2.81 and 2.61 kmol h−1 for the ratios of 1:2:1 and 1:3:1, respectively, down from 2.89 kmol h−1 for a 1:1:1 ratio, thereby identifying its disadvantage in technical performance.
For CMPG-S4 (Figure 4d), lower H2 production rates of 0.00–0.20, 0.19–0.58, and 0.78–1.52 kmol h−1 were obtained than those from TMPG-S3 in a range of similar investigated temperatures (1073–1273 K). Even though the technical performance was improved at a higher reaction temperature of 1173 K showing H2 production rates of 1.86–3.23 kmol h−1, this is still lower than those from TMPG-S3. For the effect of air and H2O on H2 production rates, similar trends to those for TMPG-S3 of increased rates from 1.86–2.63 kmol h−1 (1:1:1) to 1.99–3.23 kmol h−1 (1:3:1) and decreased rates from 2.19–2.63 kmol h−1 (1:2:1) to 2.39–2.44 kmol h−1 (1:3:1).
As a result, through the trends of H2 and C production rates obtained from the process simulation, the detailed effects of temperature, the ratio of H2 combusted, and the ratio of reactants entering the gasifier were confirmed.

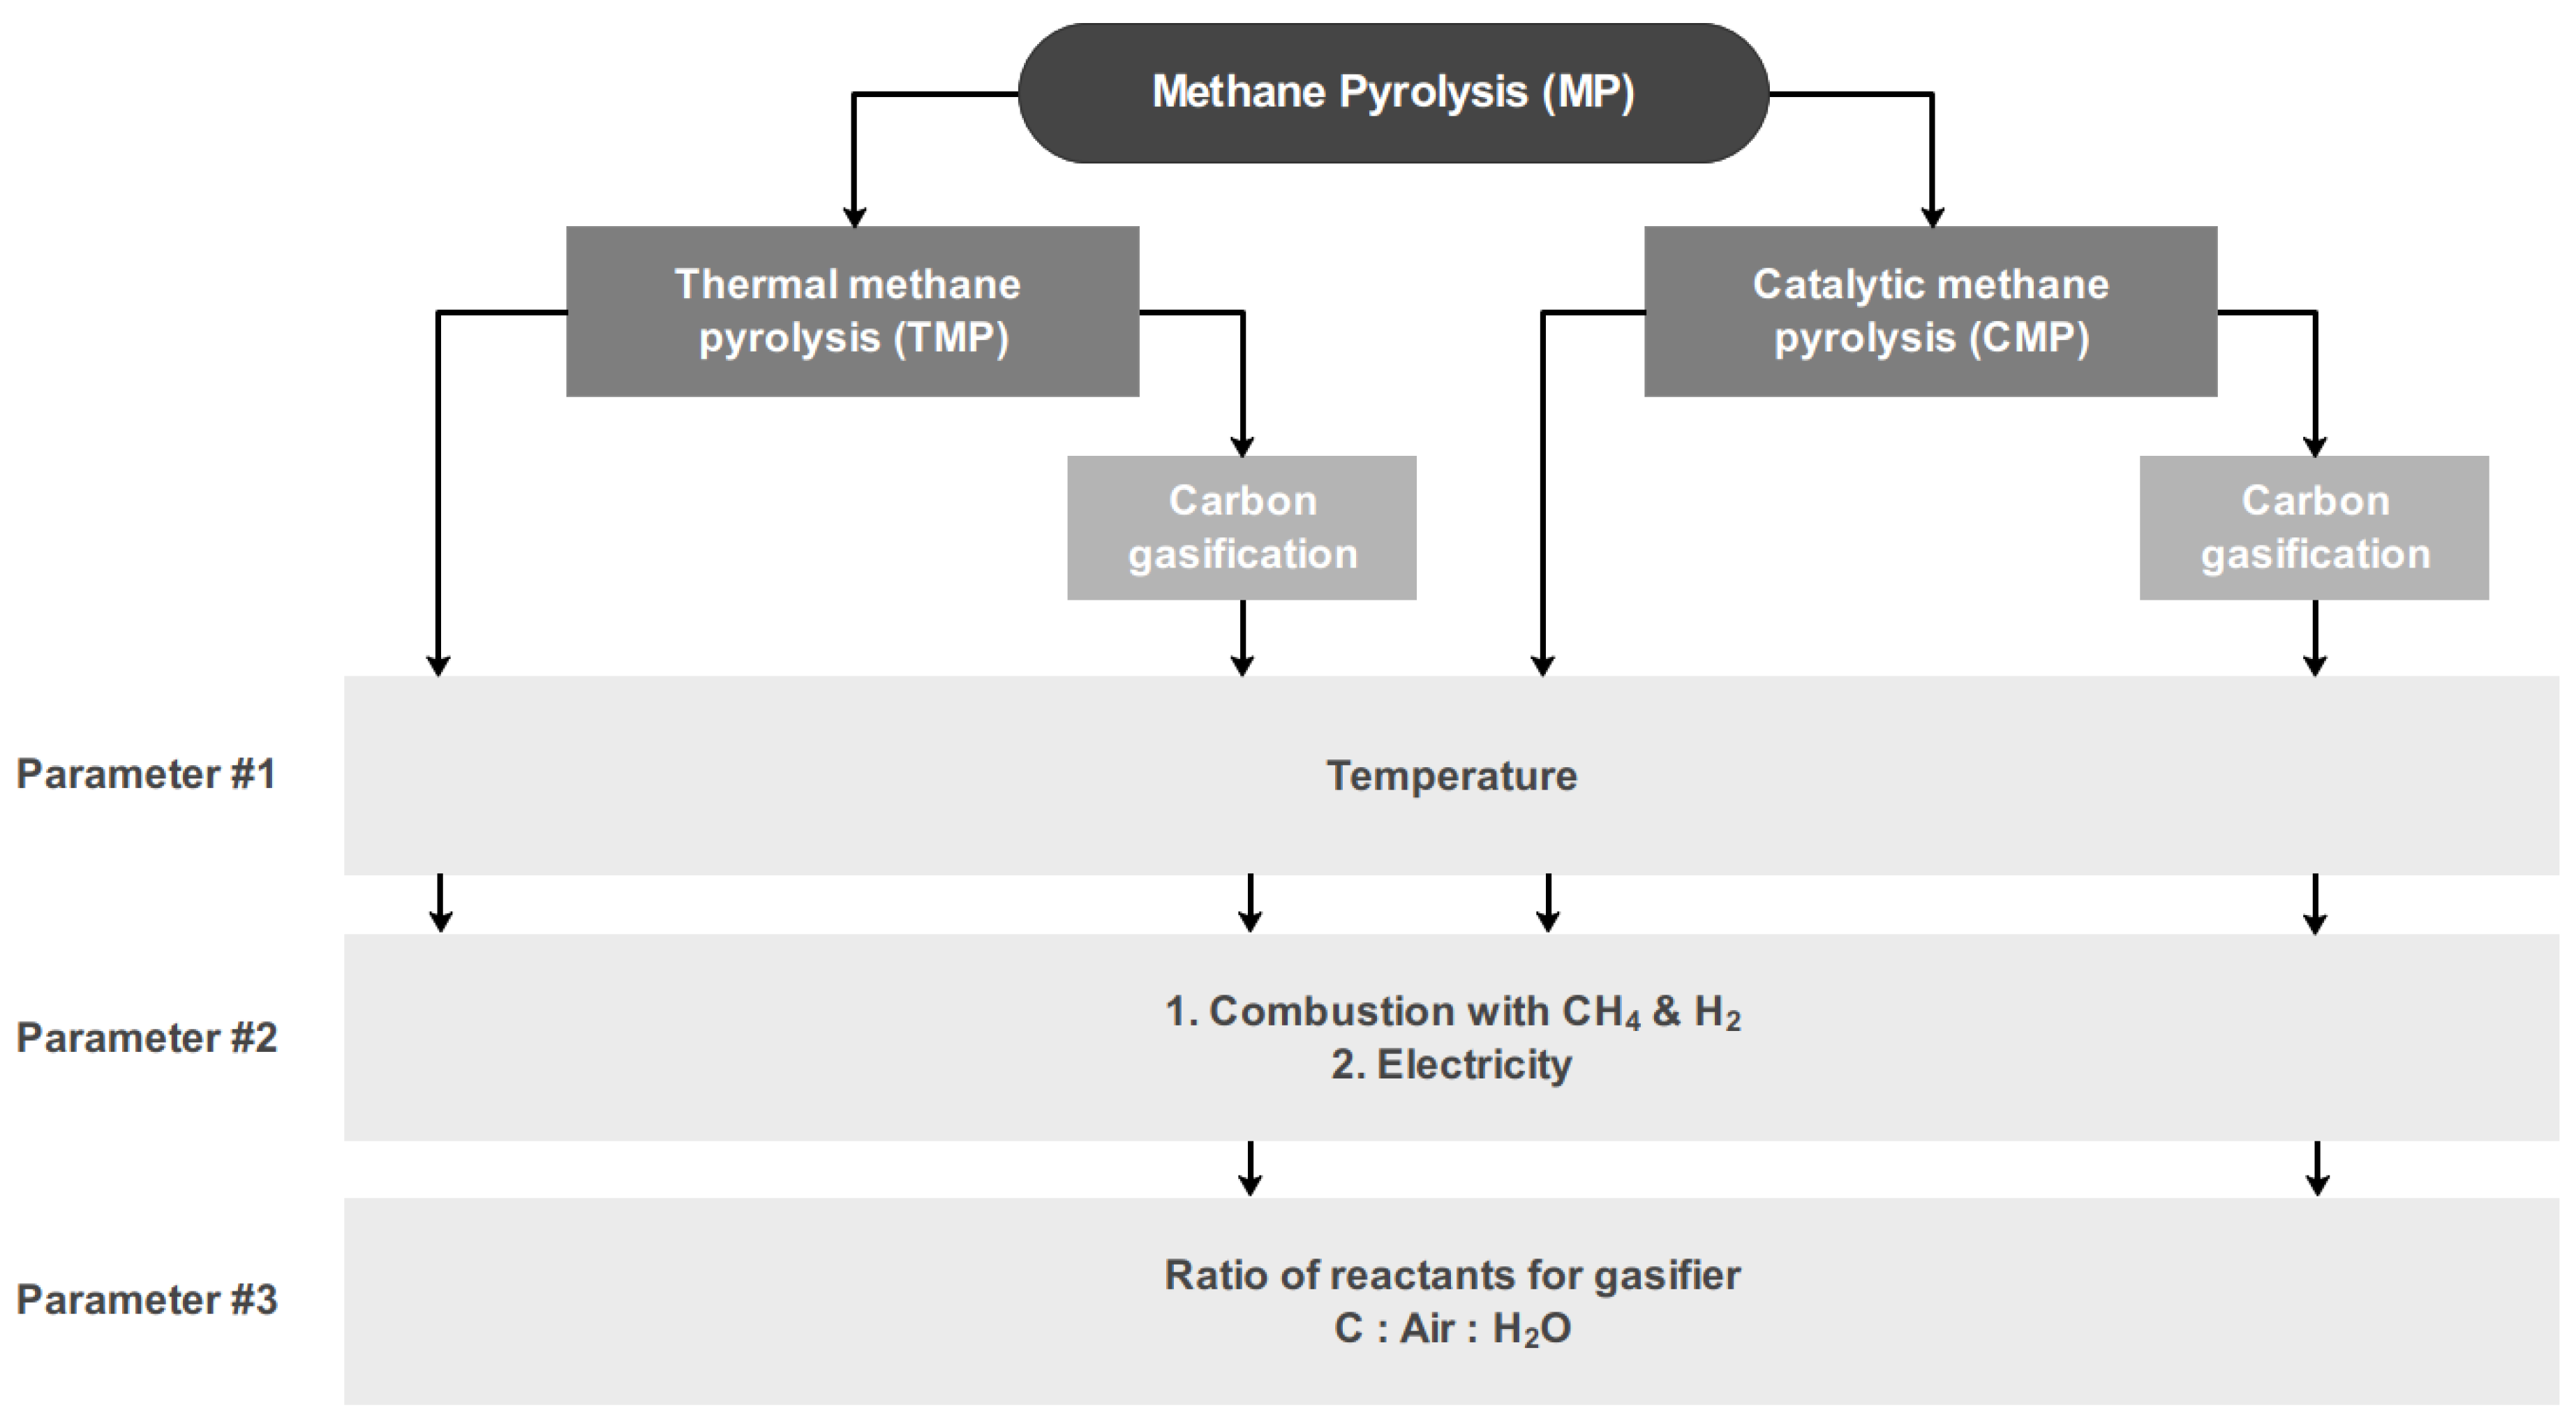
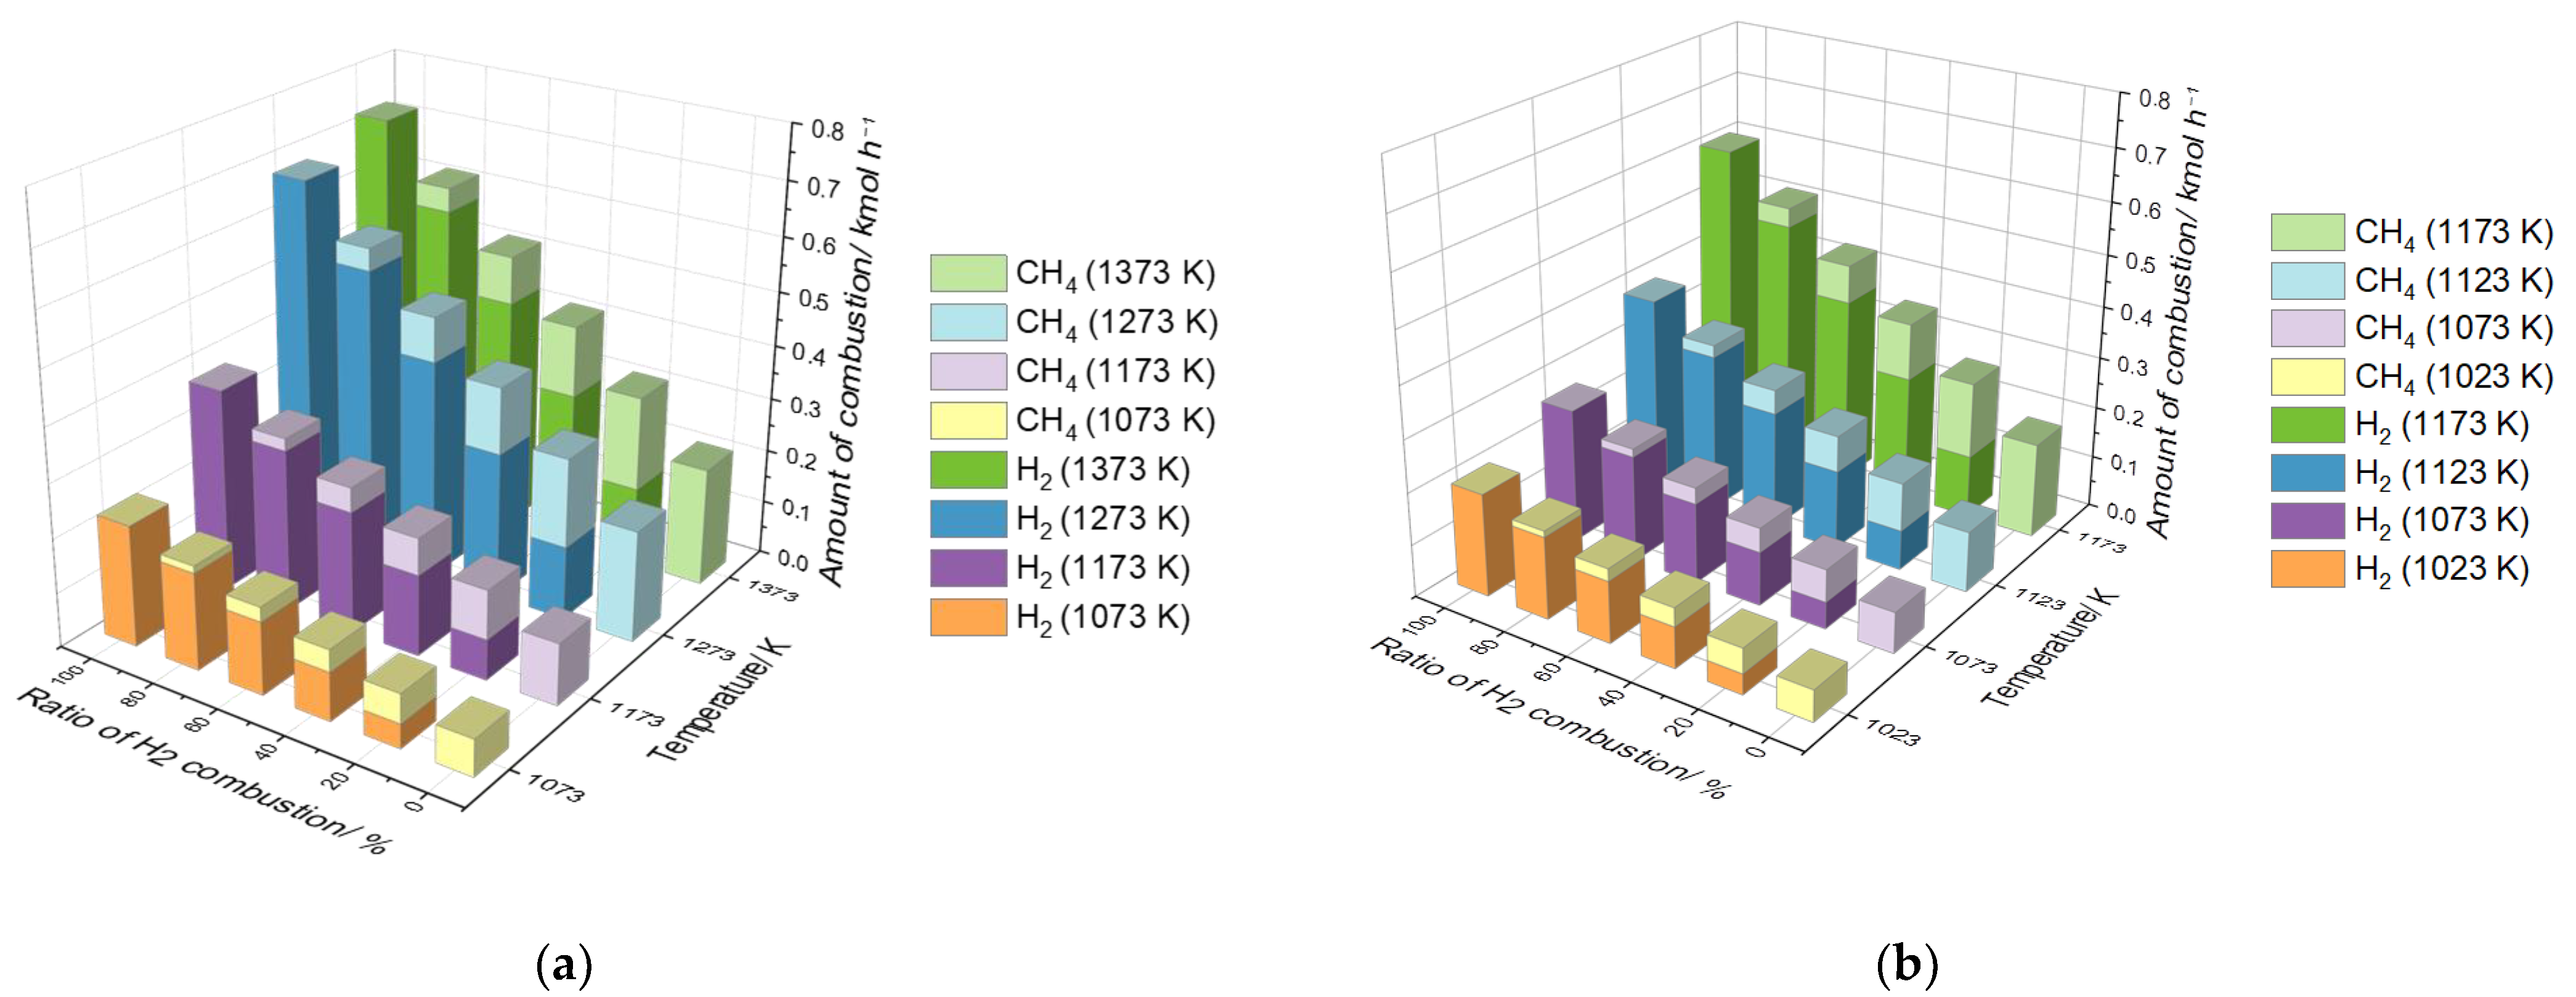
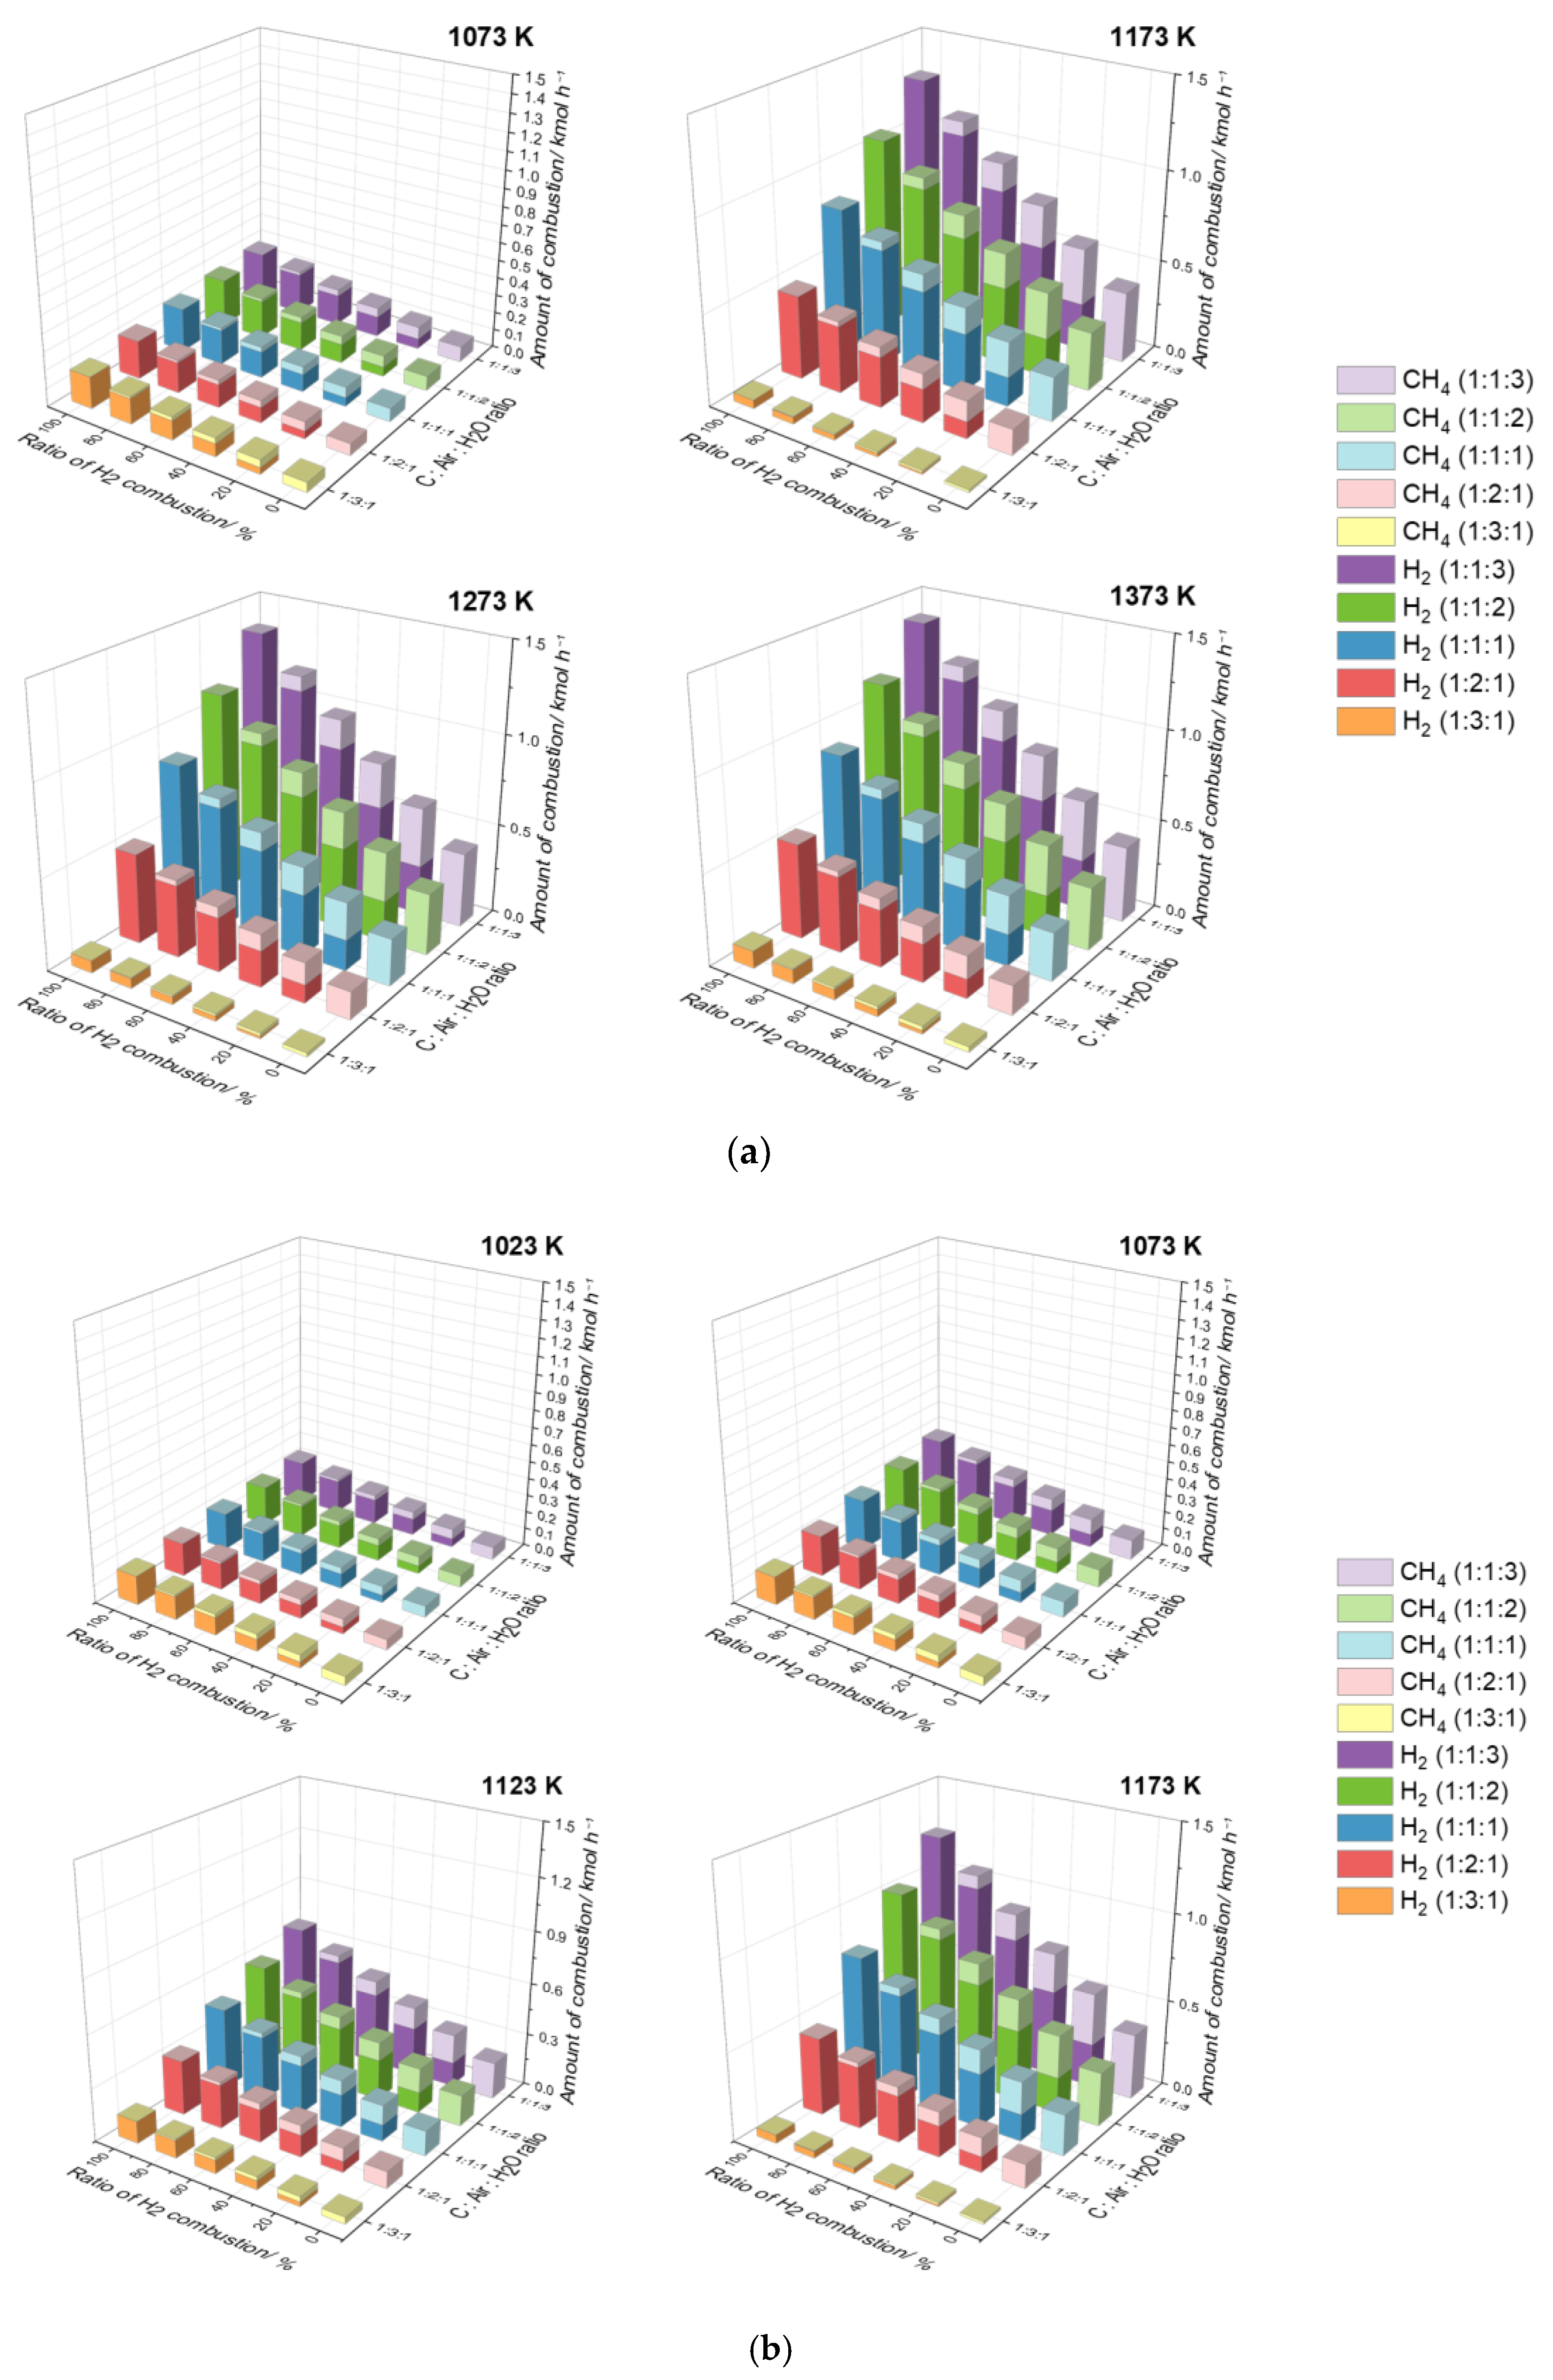
3.2. Parametric Study—Fuel Consumption

To investigate the amount of fuel combusted to cover the total heat required in each system, the required amount of fuel (H2 and CH4) was obtained (Figure 5 and Figure 6).
Figure 5 shows the required amount of fuel in TMP-S1 and CMP-S2 according to temperature and the ratio of H2 combustion (0%, 20%, 40%, 60%, 80%, and 100%). From the process simulation, the total amount of heat required of 3425, 5739, 10,380, and 11,079 cal s−1 for TMP-S1 were needed at 1073 K, 1173 K, 1273 K, and 1373 K, respectively, and that of 3016, 3941, 5868, and 9246 cal s−1 for CMP-S2 were needed at 1023 K, 1073 K, 1123 K, and 1173 K, respectively, showing the higher amount of heat is needed for TMP-S1 than CMP-S2 due to its higher reaction temperature and the technical benefit of the catalyst-based MP.
For TMP-S1, the amounts of CH4 consumption were estimated as 0.07, 0.11, 0.21, and 0.22 kmol h−1 and the amounts of H2 consumption of 0.22, 0.37, 0.67, and 0.72 kmol h−1 were obtained when CH4 and H2 covered the total amount of heat required, respectively, showing an increasing trend as temperature increased. Similarly, for CMP-S2, 0.06–0.18 kmol h−1 of CH4 consumption and 0.20–0.60 kmol h−1 of H2 consumption were estimated when each type of fuel totally covered the required heat.
In Figure 6, the amount of required fuel to supply heat for TMPG-S3 and CMPG-S4 is shown. In TMPG-S3 and CMPG-S4, much larger amounts of heat of 2691–4330, 725–19852, 1047–20,821, and 1464–21,245 cal s−1 for TMPG-S3 and 2503–3643, 2442–5737, 1925–10,514, and 745–18,954 cal s−1 for CMPG-S4 were obtained as the temperature increased, showing much greater increase than previous systems due to the additional endothermic process of C gasification. For both systems in particular, the ratio of reactants of 1:1:3 showed the highest amount of heat required compared with other ratios due to its high reaction extent, represented by high H2 and C production rates in Figure 4. In addition, the very high impact of H2O in the amount of heat required was confirmed again with trends of the required fuel at different ratios of reactants for the gasifier.
For TMPG-S3, the amount of CH4 fuel required of 0.01–0.42 kmol h−1 when it covers total heat required can be replaced by the amount of H2 combusted of 0.05–1.39 kmol h−1; for CMPG-S4, the H2 consumption range of 0.05–1.24 kmol h−1 was estimated to replace the amount of CH4 required of 0.01–0.37 kmol h−1.

3.3. Itemized Cost Estimation

Based on the results from the process simulation, the itemized cost estimation for each MP system using only CH4 and H2 as fuel was conducted to investigate unit H2 production cost at the temperature of 1273 K for TMP-S1 and TMPG-S3 and 1173 K for CMP-S2 and CMPG-S4, with the ratio of H2 combusted of 40%, and the ratio of reactants for the gasifier of 1:1:2 (C-Air-H2O) (Table 3).
For TMP-S1, unit H2 production cost of USD 2.14 kgH2−1 was estimated considering the capital cost of the MP reactor, PSA, cyclone, and supplement, and the operating cost of reactant, fuel, labor, PSA operating cost, maintenance, and other costs. In this estimation, the costs of the MP reactor and reactant account for 31% and 28% of the production cost with no consideration of the C selling price (USD 4.17 kgH2−1), respectively, showing its high importance in the economic feasibility. For CMP-S2, unit H2 production cost of USD 3.66 kgH2−1 was estimated with additional items related to a catalyst such as the cost of the regenerator and catalyst, and its operating cost. Among economic parameters, it is clear that the costs of the MP reactor and reactant are the most influential economic factors, showing high ratios of 23% and 22% of the production cost without considering the C selling price (USD 5.69 kgH2−1). In both TMP-S1 and CMP-S2, where units of the gasifier and WGS reactor were not constructed in the process simulation, the cost of the MP reactor and reactant and the C selling price have a very high economic impact on H2 production.
For TMPG-S3 and CMPG-S4, additional economic parameters related to the gasification of C and the WGS reaction means that the costs of the WGS reactor, gasifier, and water were considered and compared to both TMP-S1 and CMP-S2. For both systems, the relatively increased unit H2 production costs of USD 3.53 and 3.82 kgH2−1 for TMPG-S3 and CMPG-S4, respectively, were estimated compared to those of USD 2.14 and 3.66 kgH2−1 for TMP-S1 and CMP-S2, respectively. In addition, similar to TMP-S1 and CMP-S2, costs of the MP reactor and reactant were found to be the most influential economic parameters showing portions of 30% and 19%, and 28% and 19% for TMPG-S3 and CMPG-S4, respectively.
Our results indicated that the selling of C can be a very effective way to obtain economic competitiveness through the concept of MP, and showed the importance of the cost of the MP reactor and reactant for economic feasibility.

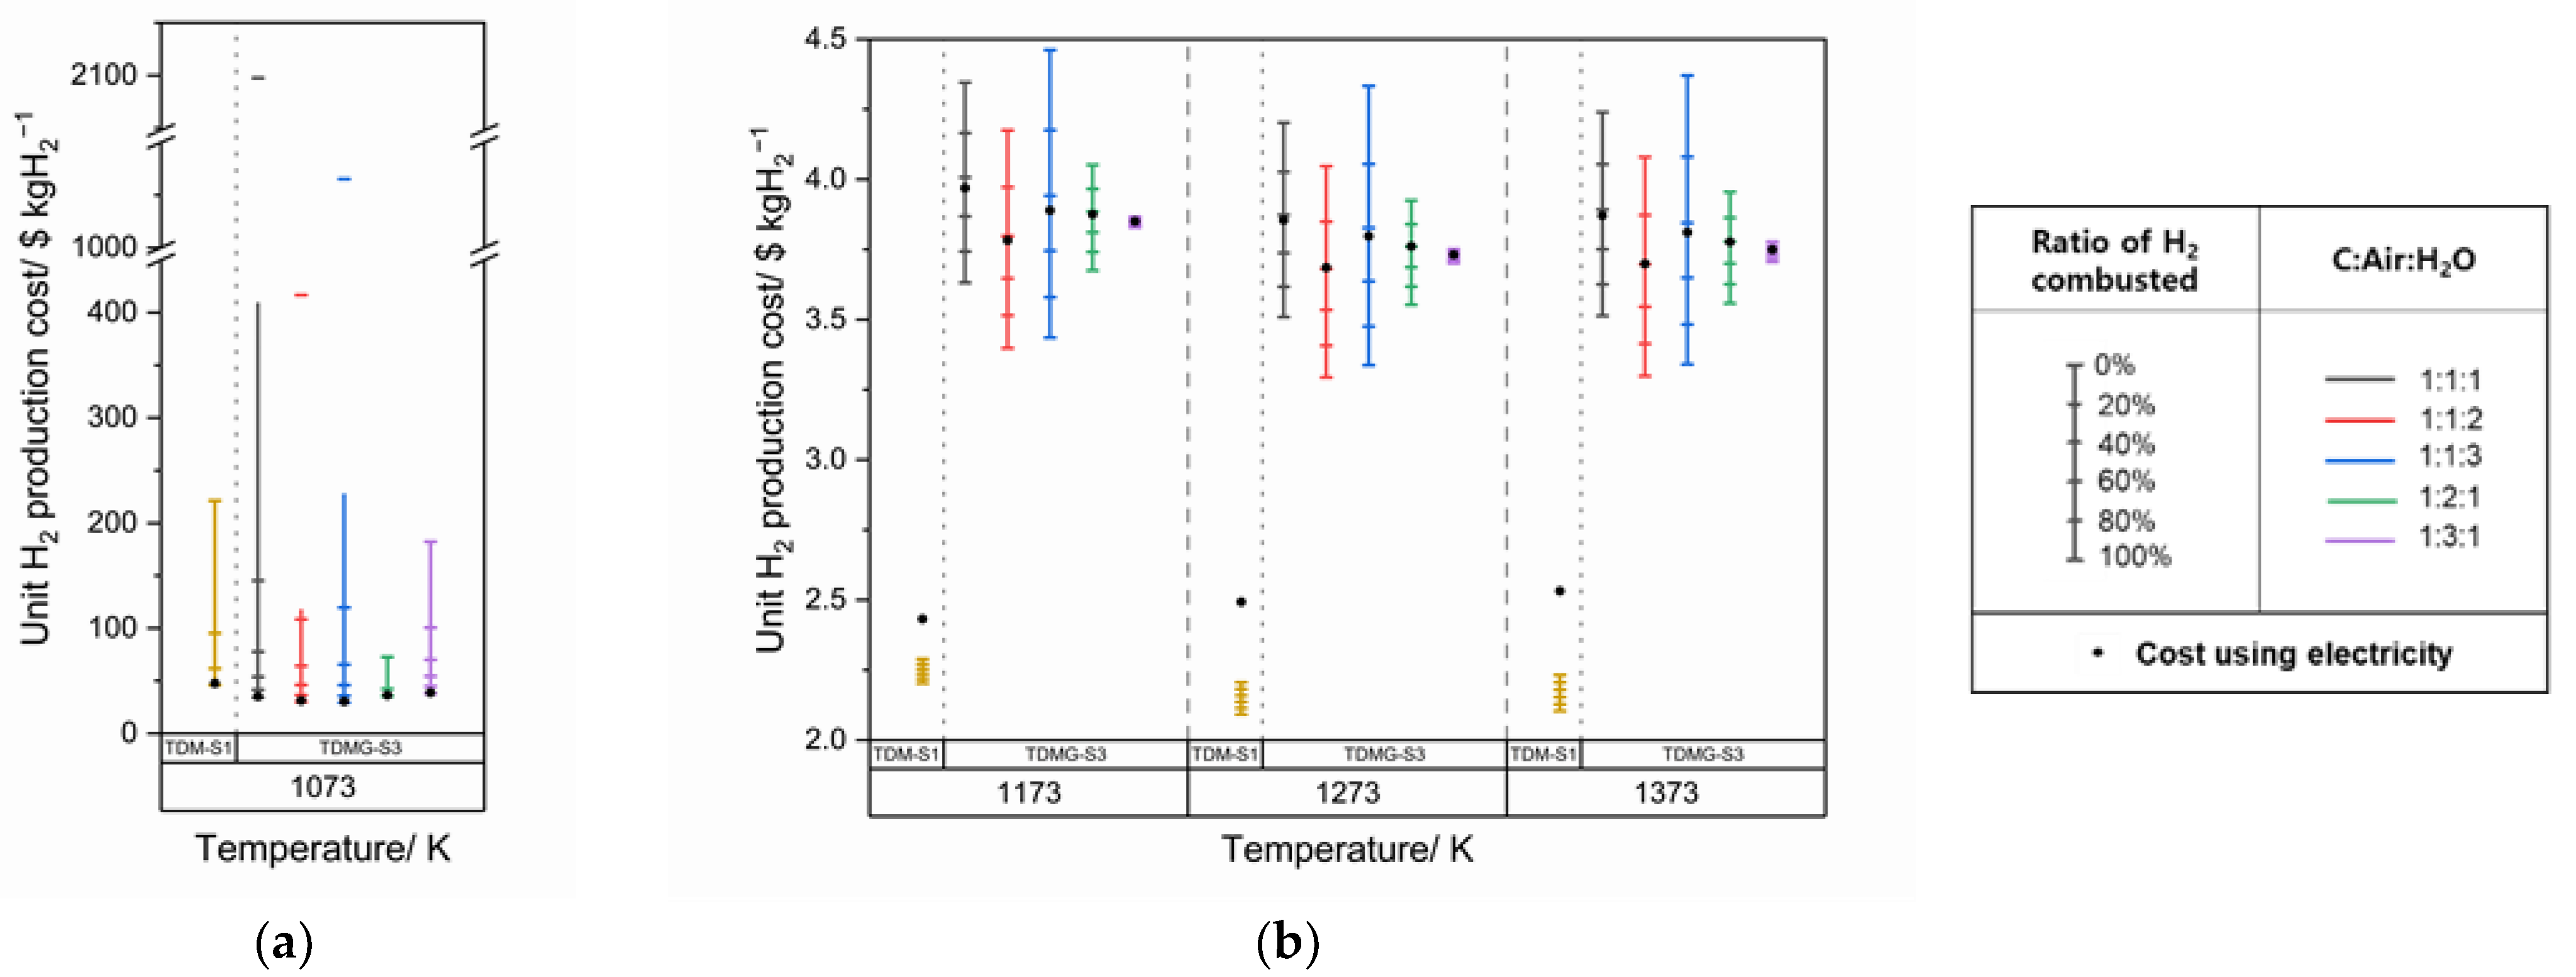
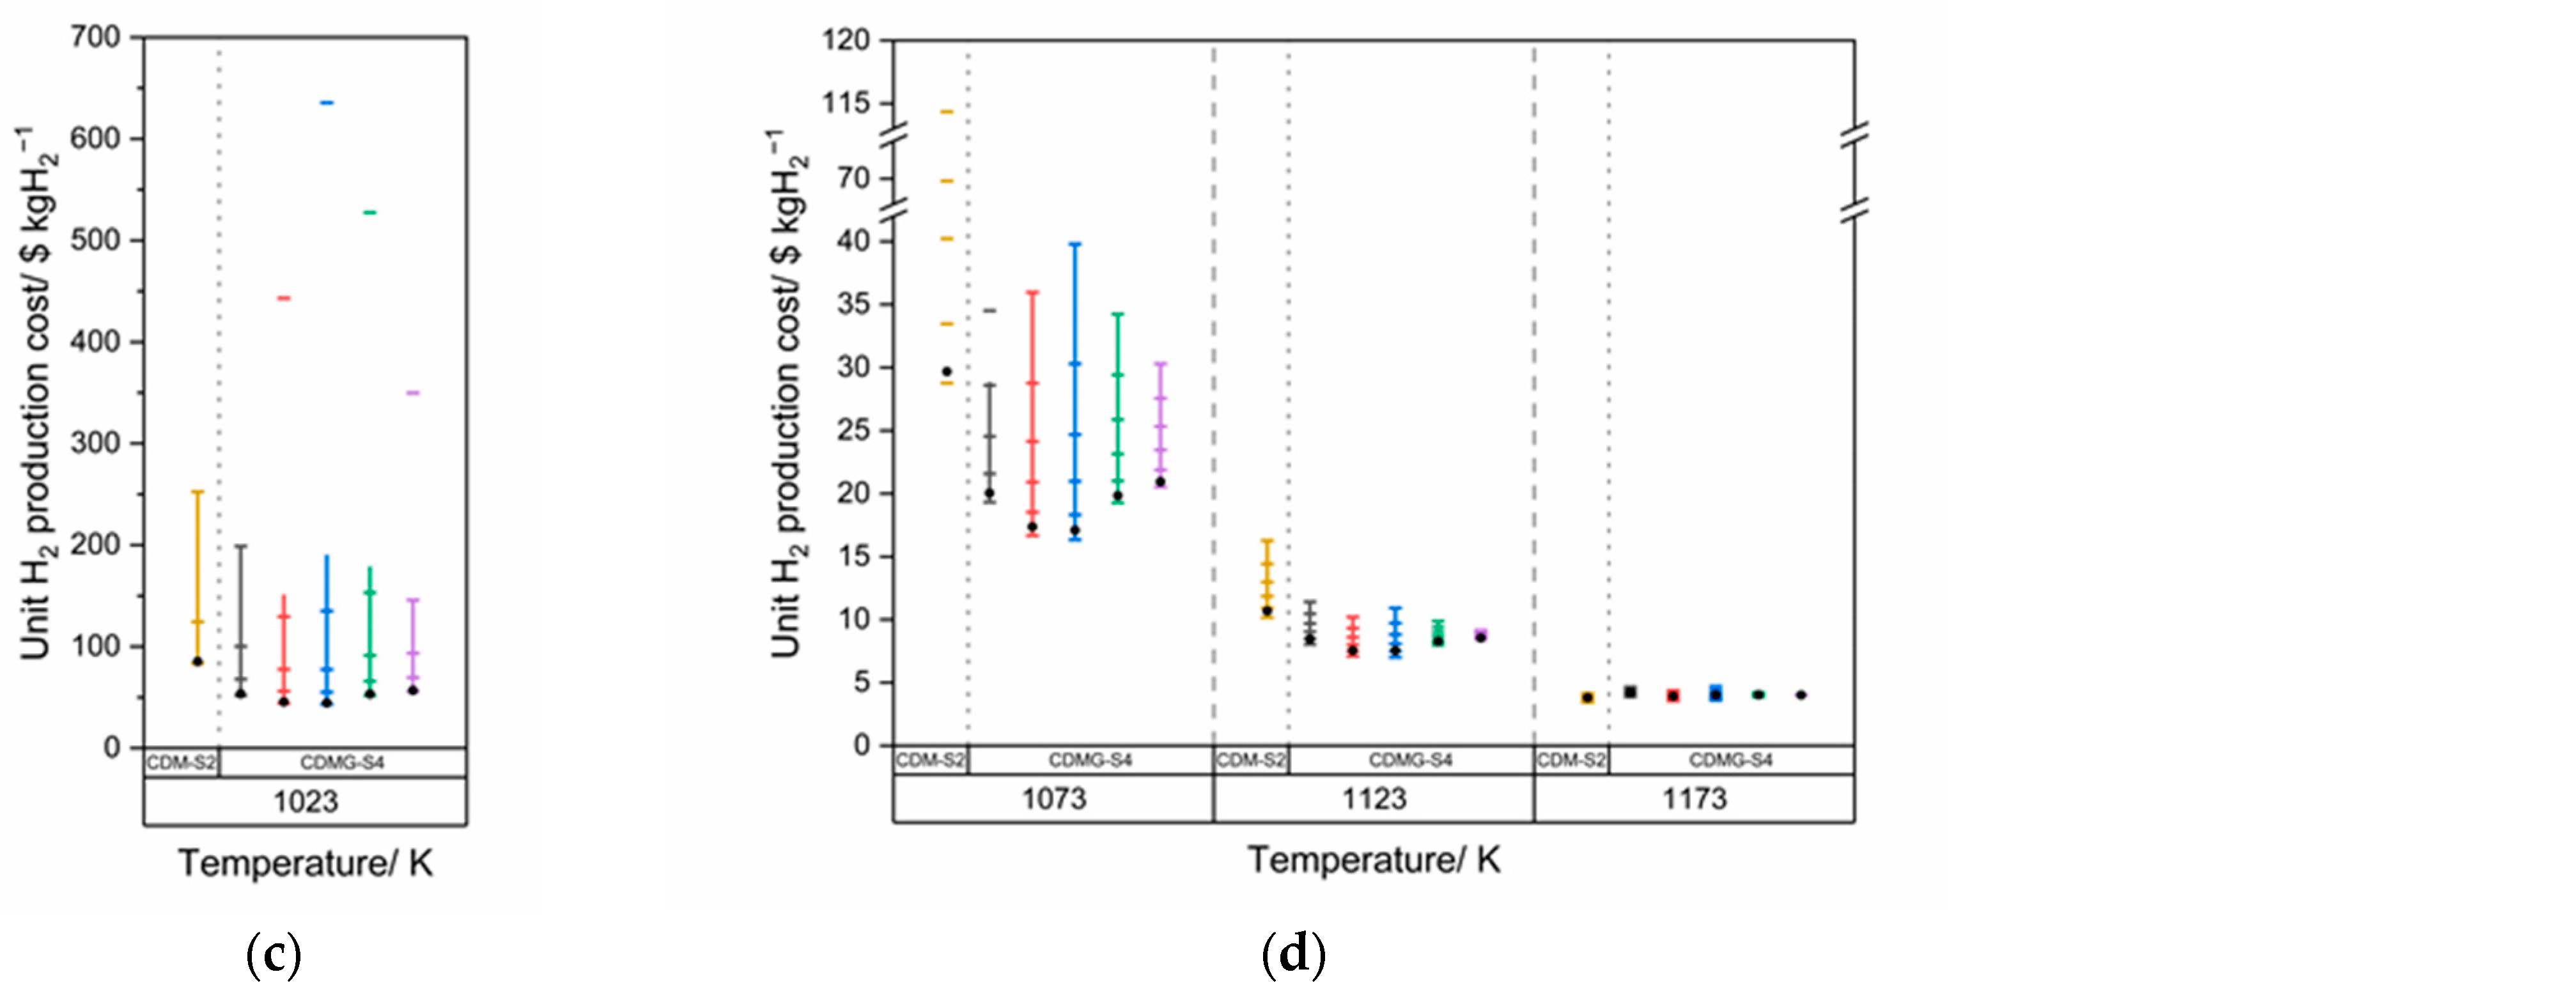
3.4. Parametric Study—Economic Aspects

To investigate the effects of the important parameters of reaction temperature, the ratio of H2 combusted to supply the heat required in the process, and the ratio of reactants composed of C, Air, and H2O for the gasifier on economic feasibility, a comprehensive parametric study revealing trends of unit H2 production cost was conducted (Figure 7).
In the case of low temperature use where 1073 K for thermal-based systems (TMP-S1 and TMPG-S3) and 1023 K for catalyst-based systems (CMP-S2 and CMPG-S4) were considered, there were no economic benefits in either system. The minimum unit H2 production costs of USD 46.09 kgH2−1 (TMP-S1) and USD 29.48–38.06 kgH2−1 (TMPG-S3) for thermal-based systems and USD 83.40 kgH2−1 (CMP-S2) and USD 43.11–55.56 kgH2−1 (CMPG-S4) for catalyst-based systems were reported. In addition, for the case of using electricity as the heat source, the cost was slightly higher but almost the same as the lowest cost using fuel combustion for both the thermal-based and catalyst-based system. Therefore, it is advantageous to use electricity as a heat source at low temperatures, but it still seems it would be difficult to gain economic benefits because of the high production costs.
In cases of high temperature, where 1173–1373 K for thermal-based systems and 1073–1173 K for catalyst-based systems were studied, cost reductions as temperature increased were shown. For TMP-S1, as temperature increased unit H2 production costs of USD 2.20–2.29, 2.09–2.21, and 2.10–2.23 kgH2−1 and a cost reduction of 5.03% for each minimum cost were reported, which are much cheaper than the minimum costs for TMPG-S3 of USD 3.40, 3.29, and 3.30 kgH2−1, proving the economic weakness of adopting the additional H2 production processes of C gasification and WGS reaction. Interestingly, the lowest hydrogen production cost was found at temperatures of 1273K, even though it was not the highest temperature. In addition, for the case of using electricity, the cost for TMP-S1 is much higher at USD 2.43, 2.49, and 2.53 kgH2−1 than in the combustion case as temperature increased. However, in TMPG-S3, it shows values of USD 3.78–3.97, 3.69–3.86, and 3.70–3.87 kgH2−1 that are close to the average for combustion; thus, electricity can be beneficial as a heat source depending on the ratio of H2 combusted.
Compared to the trend of unit H2 production cost for the thermal-based system, dramatic cost reductions in CMP-S2 were obtained for the catalyst-based system showing decreased unit H2 production costs of USD 28.77–114.35, 10.17–16.28, 3.43–4.16 kgH2−1 due to its technical improvement as temperature increased. In addition, except at the temperature of 1173 K, the economic benefit of the processes for C gasification and WGS reaction was reported showing lower minimum unit H2 production cost ranges of USD 16.34–20.52 and 7.02–8.42 kgH2−1 for CMPG-S4 than those of USD 28.77 and 10.17 kgH2−1 for CMP-S2 at 1073 K and 1123 K, respectively. In the case of electricity as the heat source, CMP-S2 shows costs of USD 29.68, 10.69, and 3.81 kgH2−1 and CMPG-S4 shows costs of USD 17.10–20.95, 7.55–8.55, and 3.93–4.20 kgH2−1 as temperature increased, showing slightly higher costs than the lowest cost using fuel combustion.
From these results, very critical effects, especially for the catalyst-based MP process, of temperature on economic feasibility and the need for the proper adoption of additional H2 production processes can be revealed.

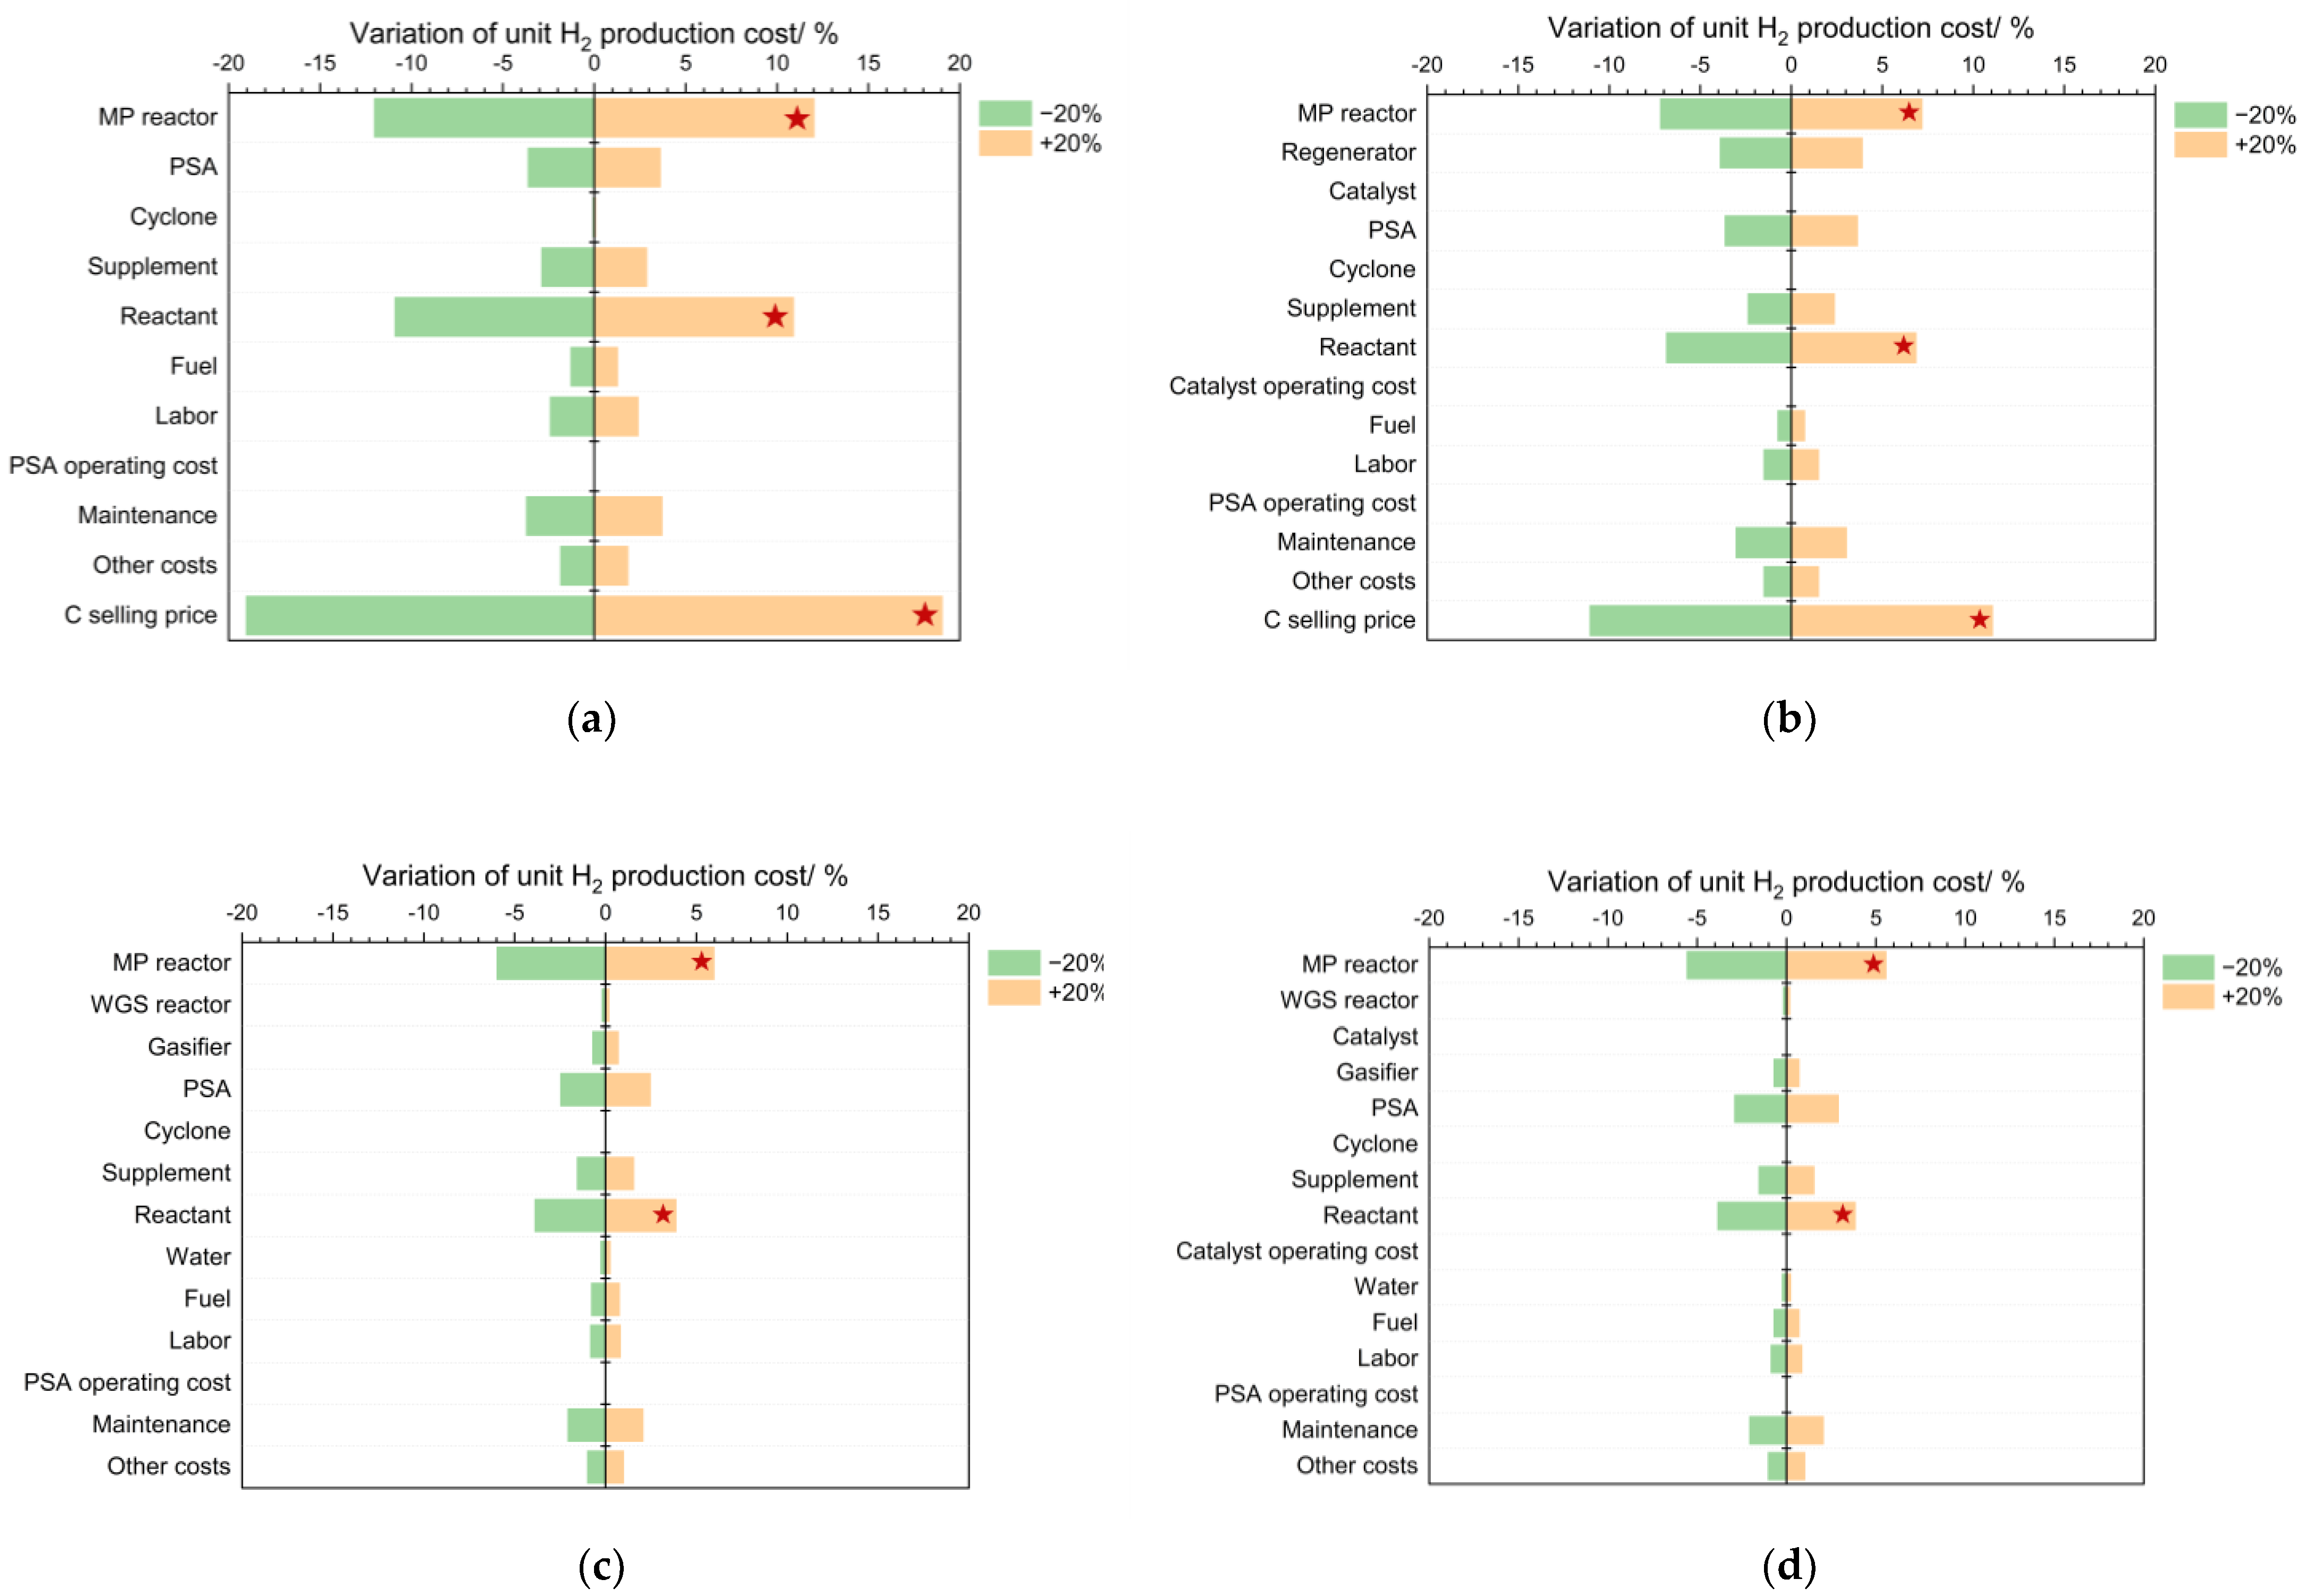
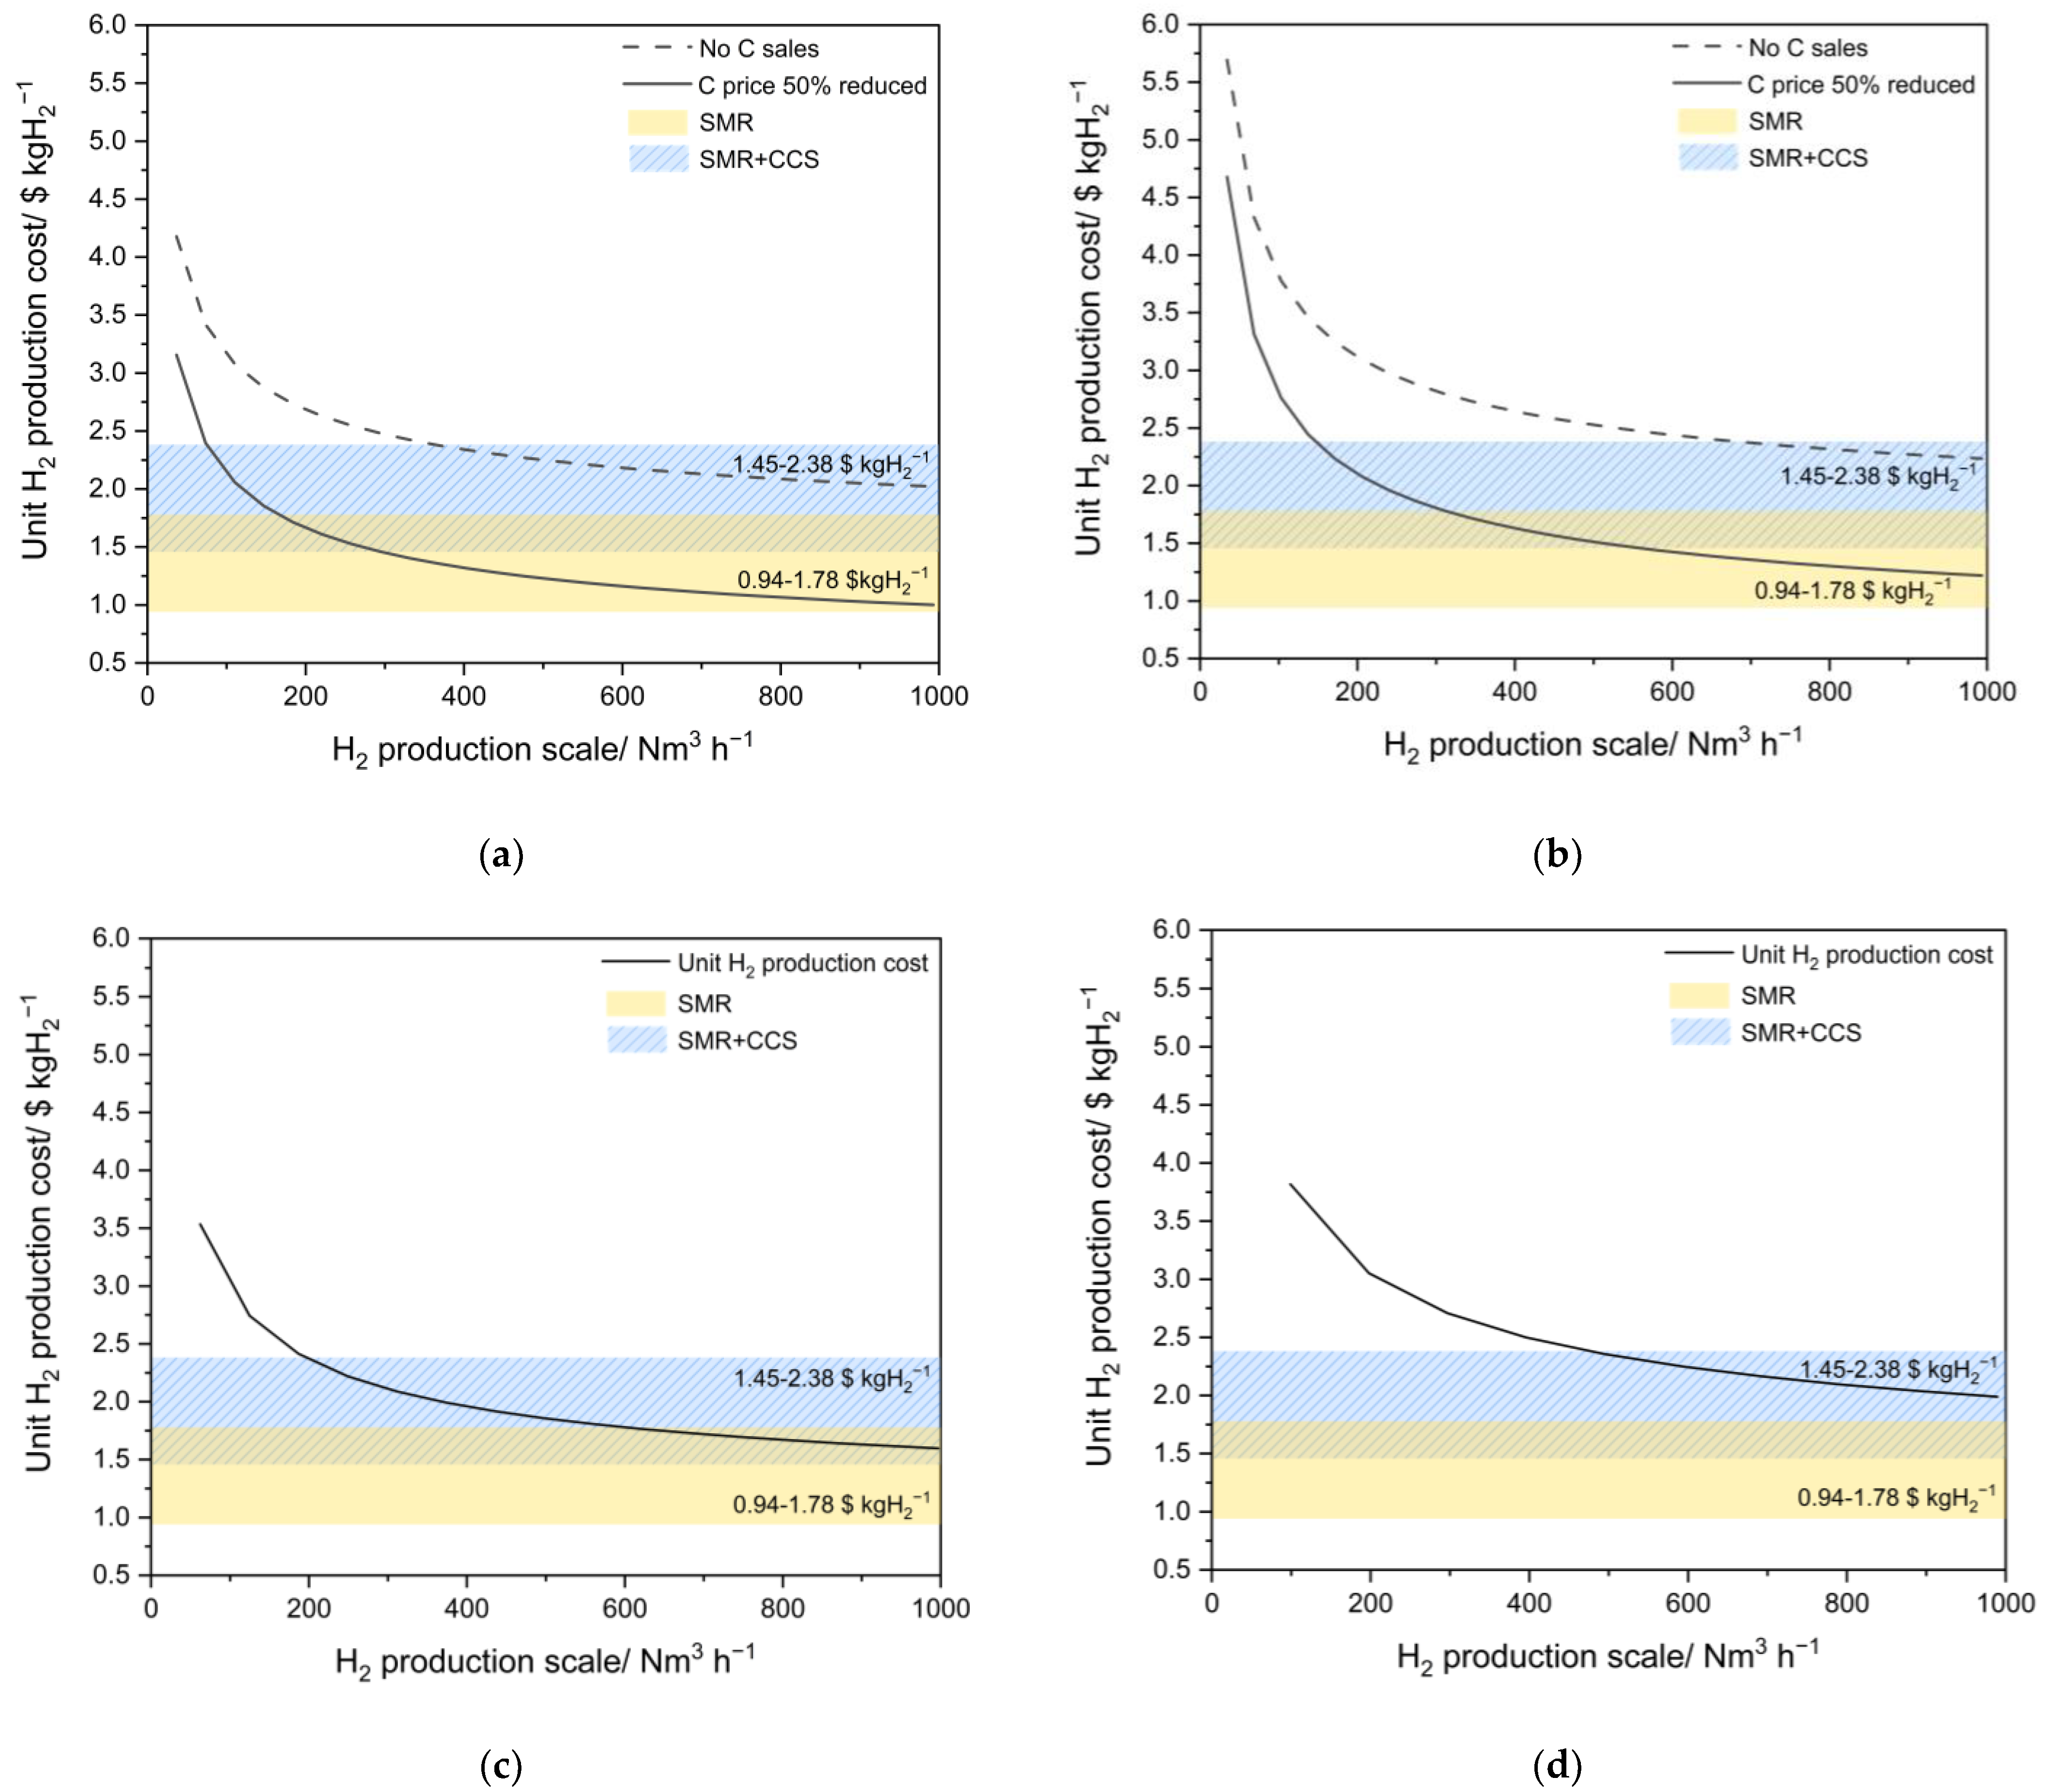
3.5. Sensitivity and Scenario Analysis

To investigate key economic parameters in each system and the possibility of the commercialization of each system, sensitivity and scenario analyses were conducted. In this study, one economic parameter was varied in the range of ±20% with the remaining parameters fixed, and variations of unit H2 production cost for each system were obtained with key factors showing high variation remarked. Figure 8a,b reveal the economic importance of C selling price in both TMP-S1 and CMP-S2 showing very high variations of 19.1% and 11.1%, respectively. Costs of the MP reactor and reactant were also figured out as the next influential parameters showing variations of 12.1% and 10.9%, and 7.2% and 6.9% for TMPG-S3 and CMPG-S4, respectively. For TMPG-S3 and CMPG-S4, where all C is combusted leading to no profits from the selling of C, the same economic parameters of costs of the MP reactor and reactant were reported as the most influential factors with variations of 6.0% and 3.9%, and 5.6% and 3.9%, respectively (Figure 8c,d).
On the other hand, the scale of certain chemical engineering processes is also known to be a very influential factor to determine their economic feasibility [65]. Therefore, a scenario analysis for H2 production scale, which can lead to a cost reduction in capital cost as reported [66], and the different C selling price in the system of TMP-S1 and CMP-S2, which is a very crucial economic factor as reported by the sensitivity analysis, to reflect a pessimistic price fluctuation and low product quality of C, was conducted and compared to conventional H2 production methods of SMR (USD 0.94–1.78 kgH2−1) and SMR with CCS (USD 1.45–2.38 kgH2−1) [67] (Figure 9). As shown in Figure 9, there was a clear cost reduction as the H2 production scale increased due to the economics of scale. For CMPG-S4, unit H2 production cost decreased from USD 3.82 to 1.99 kgH2−1 (−47.9%) proving it can compete in price with SMR+CCS but not with SMR. Similarly, larger cost reductions of 51.6% and 60.7% were obtained for TMP-S1 and CMP-S2, respectively, with no C selling price assumed (represented by USD 0 ton−1), which are still not enough to compete with conventional H2 production methods of SMR.
However, for TMP-S1 and CMP-S2, with a C selling price of EUR 250 ton−1 (−50% of the assumed C selling price) and for TMPG-S3, with unit H2 production costs decreased from USD 3.16 to 1.00 kgH2−1, USD 4.68 to 1.22 kgH2−1, and USD 3.53 to 1.60 kgH2−1 showing reductions of 68.3%, 73.9% and 54.8%, respectively, proving their economic competitiveness with conventional commercialized H2 production methods of SMR and SMR with CCS.
In short, the key economic parameters of C selling price and costs of MP reactor and reactant were calculated and the future economic competitiveness for all systems with high H2 production scales and C selling prices, even pessimistic prices, was confirmed.

4. Conclusions

The promising alternative clean concept of H2 production of methane pyrolysis (MP) was technically and economically investigated by preliminary techno-economic analysis consisting of a process simulation using Aspen Plus®, itemized cost estimation, and sensitivity and scenario analysis for various parameters such as temperature, the ratio of fuel (CH4 and H2 produced from MP) combusted, and the ratio of reactants for C gasification (C, Air, and H2O). To investigate various H2 production scenarios, thermal and catalytic methane pyrolysis (TMP-S1 and CMP-S2) and systems with additional H2 production processes composed of C gasification and WGS reaction (TMPG-S3 and CMPG-S4) were considered in this study. The results of the process simulation indicated that reaction temperature is the most influential process variable for determining the technical performance of all investigated systems, and catalyst-based MP (CMP-S2 and CMPG-S4) showed much lower net H2 and C production rates than thermal-based systems (TMP-S1 and TMPG-S3), where theoretical maximum yields were obtained, due to different kinetics used in the simulation. In addition, the amount of H2O added in TMPG-S3 and CMPG-S4 was reported as the most important factor to increase the amount of H2 produced. For an aspect of fuel consumption estimated from the amount of heat required for each system, trends similar to the net H2 and C production were obtained showing the amounts of heat of 3425–11,079 cal s−1 for TMP-S1, 3016–9246 cal s−1 for CMP-S2, 725–21,245 cal s−1 for TMPG-S3, and 744–18,945 cal s−1 for CMPG-S4 matched with the required fuel amounts of 0.068–0.219, 0.060–0.183, 0.014–0.420, and 0.015–0.375 kmol h−1 and 0.223–0.723, 0.197–0.603, 0.047–1.386, 0.049–1.236 kmol h−1 for CH4 and H2, respectively. From the itemized cost estimation for each system at 1273 K for TMP-S1 and TMPG-S3 and 1173 K for CMP-S2 and CMPG-S4, with 40% H2 combusted, and the ratio of 1:1:2 for C-Air-H2O, unit H2 production costs of USD 2.14, 3.66, 3.53, and 3.82 gH2−1 for each system, respectively, were obtained showing a very high portion of the costs of the MP reactor and reactant, and the economic benefits of the carbon (C) selling price. To investigate the effects of each parameter of temperature, the ratio of fuel combusted, and ratios of C, Air, and H2O on economic feasibility, a parametric study was conducted proving the economic benefits of high temperature and the additional H2 production process of C gasification and WGS reaction for CMPG-S4 but not for thermal-based MP process. The importance of the costs of the MP reactor and reactant and the C selling price for economic feasibility was calculated again by sensitivity analysis, where the variation of ±20% was assumed, with variations of unit H2 production cost of 19.1% and 11.1% for C selling price in TMP-S1 and CMP-S2, respectively, and 12.1%–5.6% and 10.9%–3.9% for costs of the MP reactor and reactant, respectively, in all investigated systems. In addition, the effects of H2 production scale for all systems and the C selling price for TMP-S1 and CMP-S2 on the unit H2 production costs were investigated suggesting that all systems can compete with SMR with CCS, and especially TMP-S1 and CMP-S2, even with the pessimistic 50% reduced C selling price; for TMPG-S3, economic competitiveness with the commercialized H2 production method of SMR can be achieved when an H2 production scale larger than 1000 Nm3 h−1 is assumed.
Conclusively, the techno-economic feasibility of MP processes, classified as the four systems of TMP-S1, CMP-S2, TMPG-S3, and CMPG-S4, was investigated with detailed H2 and C production rates, the amount of fuel required to supply heat in each system, the trends of unit H2 production cost according to temperature, the ratio of H2 combusted, and the ratio of reactants used in the C gasifier, and revealed key economic parameters of the costs of the MP reactor and reactant and the C selling price. Although several techno-economic enhancements such as scale-up should be researched further to accomplish the economic competitiveness of MP compared to SMR, the environmental benefits of MP are clearly shown in this study based on its theoretical reaction stoichiometry and trends of its consumption of fuels. Based on the results, the potential of both thermal and catalytic MP for promising H2 production is clearly presented.

Author Contributions

Conceptualization, H.L. (Hankwon Lim) and S.C.; methodology, S.C. and M.B.; validation, M.B.; investigation, D.L. and H.L. (Hyunjun Lee); writing-original draft preparation, S.C. and M.B.; writing-review and editing, S.C. and M.B.; supervision, H.L. (Hankwon Lim); funding acquisition, H.L. (Hankwon Lim). All authors have read and agreed to the published version of the manuscript.

Funding

This work was supported by the Korea Institute of Energy Technology Evaluation and Planning (KETEP) and the Ministry of Trade, Industry and Energy (MOTIE) of the Republic of Korea (No. 20203020040010) and supported by the 2021 Research Fund (1.210103.01) of UNIST (Ulsan National Institute of Science and Technology).

Institutional Review Board Statement

Not applicable.

Informed Consent Statement

Not applicable.

Data Availability Statement

Not applicable.

Conflicts of Interest

The authors declare no conflict of interest.

Nomenclature

CO2  Carbon dioxide
CO  Carbon monoxide
CCS  Carbon capture and storage
CMP  Catalytic methane pyrolysis
CMPG  Catalytic methane pyrolysis with carbon gasification
CRF  Capital recovery factor
CEPCI  Chemical engineering plant cost index
MP  Methane pyrolysis
FLBR  Fluidized bed reactor
GHG  Greenhouse gas
H2  Hydrogen
CH4  Methane
PSA  Pressure swing adsorption
SMR  Steam methane reforming
SMR with CCS  Steam methane reforming with carbon capture and storage
TMP  Thermal methane pyrolysis
TMPG  Thermal methane pyrolysis with carbon gasification
VPMDCS  Vacuum promote methane decomposition with carbon separation
H2O  Water
WE  Water electrolysis
WGS  Water-gas shift

References

  1. Federal Ministry for Economic Affairs and Energy. Available online: https://www.bmwi.de/Redaktion/EN/Publikationen/Energie/the-national-hydrogen-strategy.html (accessed on 20 July 2021).
  2. European Commission. Available online: https://ec.europa.eu/energy/topics/energy-system-integration/hydrogen_en#eu-hydrogen-strategy (accessed on 20 July 2021).
  3. Ministry of Economy, Trade and Industry. 2017. Available online: https://www.meti.go.jp/english/press/2017/1226_003.html (accessed on 20 July 2021).
  4. Ministry of Economy, Trade and Industry. 2018. Available online: https://www.meti.go.jp/english/press/2018/0703_002.html (accessed on 20 July 2021).
  5. Ministry of Economy, Trade and Industry. 2019. Available online: https://www.meti.go.jp/english/press/2019/0312_002.html (accessed on 20 July 2021).
  6. Climate Change Committee. Available online: https://www.theccc.org.uk/publication/hydrogen-in-a-low-carbon-economy/ (accessed on 20 July 2021).
  7. U.S. Department of Energy. Available online: https://www.energy.gov/eere/fuelcells/h2scale (accessed on 20 July 2021).
  8. The Commonwealth Scientific and Industrial Research Organisation (CSIRO). Available online: https://www.csiro.au/en/work-with-us/services/consultancy-strategic-advice-services/csiro-futures/futures-reports/hydrogen-roadmap (accessed on 20 July 2021).
  9. Nikolaidis, P.; Poullikkas, A. A comparative overview of hydrogen production processes. Renew. Sustain. Energy Rev. 2017, 67, 597–611. [Google Scholar] [CrossRef]
  10. Mazloomi, K.; Gomes, C. Hydrogen as an energy carrier: Prospects and challenges. Renew. Sustain. Energy Rev. 2012, 16, 3024–3033. [Google Scholar] [CrossRef]
  11. Dawood, F.; Anda, M.; Shafiullah, G. Hydrogen production for energy: An overview. Int. J. Hydrog. Energy 2020, 45, 3847–3869. [Google Scholar] [CrossRef]
  12. Staffell, I.; Scamman, D.; Abad, A.V.; Balcombe, P.; Dodds, P.E.; Ekins, P.; Shah, N.; Ward, K.R. The role of hydrogen and fuel cells in the global energy system. Energy Environ. Sci. 2019, 12, 463–491. [Google Scholar] [CrossRef] [Green Version]
  13. Acar, C.; Dincer, I. Review and evaluation of hydrogen production options for better environment. J. Clean. Prod. 2019, 218, 835–849. [Google Scholar] [CrossRef]
  14. Reuß, M.; Grube, T.; Robinius, M.; Preuster, P.; Wasserscheid, P.; Stolten, D. Seasonal storage and alternative carriers: A flexible hydrogen supply chain model. Appl. Energy 2017, 200, 290–302. [Google Scholar] [CrossRef]
  15. Tuomi, S.; Santasalo-Aarnio, A.; Kanninen, P.; Kallio, T. Hydrogen production by methanol–Water solution electrolysis with an alkaline membrane cell. J. Power Sources 2013, 229, 32–35. [Google Scholar] [CrossRef]
  16. Lee, B.; Heo, J.; Kim, S.; Sung, C.; Moon, C.; Moon, S.; Lim, H. Economic feasibility studies of high pressure PEM water electrolysis for distributed H2 refueling stations. Energy Convers. Manag. 2018, 162, 139–144. [Google Scholar] [CrossRef]
  17. Ishaq, H.; Dincer, I. Comparative assessment of renewable energy-based hydrogen production methods. Renew. Sustain. Energy Rev. 2020, 135, 110192. [Google Scholar] [CrossRef]
  18. Parkinson, B.; Balcombe, P.; Speirs, J.F.; Hawkes, A.D.; Hellgardt, K. Levelized cost of CO2 mitigation from hydrogen production routes. Energy Environ. Sci. 2018, 12, 19–40. [Google Scholar] [CrossRef]
  19. Navarro, R.M.; Sánchez-Sánchez, M.C.; Alvarez-Galvan, M.C.; Del Valle, F.; Fierro, J.L.G. Hydrogen production from renewable sources: Biomass and photocatalytic opportunities. Energy Environ. Sci. 2008, 2, 35–54. [Google Scholar] [CrossRef]
  20. Nguyen, T.; Abdin, Z.; Holm, T.; Mérida, W. Grid-connected hydrogen production via large-scale water electrolysis. Energy Convers. Manag. 2019, 200, 112108. [Google Scholar] [CrossRef]
  21. Zhang, C.; Greenblatt, J.B.; Wei, M.; Eichman, J.; Saxena, S.; Muratori, M.; Guerra, O.J. Flexible grid-based electrolysis hydrogen production for fuel cell vehicles reduces costs and greenhouse gas emissions. Appl. Energy 2020, 278, 115651. [Google Scholar] [CrossRef]
  22. Christopher, K.; Dimitrios, R. A review on exergy comparison of hydrogen production methods from renewable energy sources. Energy Environ. Sci. 2012, 5, 6640–6651. [Google Scholar] [CrossRef]
  23. Vincent, I.; Bessarabov, D. Low cost hydrogen production by anion exchange membrane electrolysis: A review. Renew. Sustain. Energy Rev. 2018, 81, 1690–1704. [Google Scholar] [CrossRef]
  24. Hosseini, S.E.; Wahid, M.A. Hydrogen production from renewable and sustainable energy resources: Promising green energy carrier for clean development. Renew. Sustain. Energy Rev. 2016, 57, 850–866. [Google Scholar] [CrossRef]
  25. Stojić, D.L.; Marčeta, M.P.; Sovilj, S.P.; Miljanić, S. Hydrogen generation from water electrolysis—Possibilities of energy saving. J. Power Sources 2003, 118, 315–319. [Google Scholar] [CrossRef]
  26. Boot-Handford, M.E.; Abanades, J.C.; Anthony, E.J.; Blunt, M.; Brandani, S.; Mac Dowell, N.; Fernández, J.R.; Ferrari, M.-C.; Gross, R.; Hallett, J.; et al. Carbon capture and storage update. Energy Environ. Sci. 2013, 7, 130–189. [Google Scholar] [CrossRef]
  27. Wilberforce, T.; Baroutaji, A.; Soudan, B.; Al-Alami, A.H.; Olabi, A.G. Outlook of carbon capture technology and challenges. Sci. Total. Environ. 2018, 657, 56–72. [Google Scholar] [CrossRef] [Green Version]
  28. Bui, M.; Adjiman, C.S.; Bardow, A.; Anthony, E.J.; Boston, A.; Brown, S.; Fennell, P.S.; Fuss, S.; Galindo, A.; Hackett, L.A.; et al. Carbon capture and storage (CCS): The way forward. Energy Environ. Sci. 2018, 11, 1062–1176. [Google Scholar] [CrossRef] [Green Version]
  29. Younessi-Sinaki, M.; Matida, E.A.; Hamdullahpur, F. Kinetic model of homogeneous thermal decomposition of methane and ethane. Int. J. Hydrog. Energy 2009, 34, 3710–3716. [Google Scholar] [CrossRef]
  30. Kang, D.; Rahimi, N.; Gordon, M.J.; Metiu, H.; McFarland, E.W. Catalytic methane pyrolysis in molten MnCl2-KCl. Appl. Catal. B Environ. 2019, 254, 659–666. [Google Scholar] [CrossRef]
  31. Parfenov, V.E.; Nikitchenko, N.V.; Pimenov, A.A.; Kuz’Min, A.E.; Kulikova, M.V.; Chupichev, O.B.; Maksimov, A.L. Methane Pyrolysis for Hydrogen Production: Specific Features of Using Molten Metals. Russ. J. Appl. Chem. 2020, 93, 625–632. [Google Scholar] [CrossRef]
  32. Bhaskar, A.; Assadi, M.; Somehsaraei, H.N. Can methane pyrolysis based hydrogen production lead to the decarbonisation of iron and steel industry? Energy Convers. Manag. X 2021, 10, 100079. [Google Scholar] [CrossRef]
  33. Fincke, J.R.; Anderson, R.P.; Hyde, T.A.; Detering, B.A. Plasma Pyrolysis of Methane to Hydrogen and Carbon Black. Ind. Eng. Chem. Res. 2002, 41, 1425–1435. [Google Scholar] [CrossRef]
  34. Wang, I.-W.; Kutteri, D.A.; Gao, B.; Tian, H.; Hu, J. Methane Pyrolysis for Carbon Nanotubes and COx-Free H2 over Transition-Metal Catalysts. Energy Fuels 2018, 33, 197–205. [Google Scholar] [CrossRef]
  35. Rahimi, N.; Kang, D.; Gelinas, J.; Menon, A.; Gordon, M.J.; Metiu, H.; McFarland, E.W. Solid carbon production and recovery from high temperature methane pyrolysis in bubble columns containing molten metals and molten salts. Carbon 2019, 151, 181–191. [Google Scholar] [CrossRef]
  36. Farmer, T.C.; McFarland, E.W.; Doherty, M.F. Membrane bubble column reactor model for the production of hydrogen by methane pyrolysis. Int. J. Hydrog. Energy 2019, 44, 14721–14731. [Google Scholar] [CrossRef]
  37. Abbas, H.F.; Daud, W.W. Hydrogen production by methane decomposition: A review. Int. J. Hydrog. Energy 2010, 35, 1160–1190. [Google Scholar] [CrossRef]
  38. Muradov, N. Low to near-zero CO2 production of hydrogen from fossil fuels: Status and perspectives. Int. J. Hydrog. Energy 2017, 42, 14058–14088. [Google Scholar] [CrossRef]
  39. Hu, C.; Shen, H.; Zhang, S.; Li, H. Methane pyrolysis in preparation of pyrolytic carbon: Thermodynamic and kinetic analysis by density functional theory. Chin. J. Aeronaut. 2019, 33, 1064–1073. [Google Scholar] [CrossRef]
  40. Guéret, C.; Daroux, M.; Billaud, F. Methane pyrolysis: Thermodynamics. Chem. Eng. Sci. 1997, 52, 815–827. [Google Scholar] [CrossRef]
  41. Sánchez-Bastardo, N.; Schlögl, R.; Ruland, H. Methane Pyrolysis for CO2-Free H2 Production: A Green Process to Overcome Renewable Energies Unsteadiness. Chem. Ing. Tech. 2020, 92, 1596–1609. [Google Scholar] [CrossRef]
  42. Nishii, H.; Miyamoto, D.; Umeda, Y.; Hamaguchi, H.; Suzuki, M.; Tanimoto, T.; Harigai, T.; Takikawa, H.; Suda, Y. Catalytic activity of several carbons with different structures for methane decomposition and by-produced carbons. Appl. Surf. Sci. 2018, 473, 291–297. [Google Scholar] [CrossRef]
  43. Tezel, E.; Figen, H.E.; Baykara, S.Z. Hydrogen production by methane decomposition using bimetallic Ni–Fe catalysts. Int. J. Hydrog. Energy 2019, 44, 9930–9940. [Google Scholar] [CrossRef]
  44. Qian, J.X.; Enakonda, L.R.; Wang, W.J.; Gary, D.; Del-Gallo, P.; Basset, J.-M.; Bin Liu, D.; Zhou, L. Optimization of a fluidized bed reactor for methane decomposition over Fe/Al2O3 catalysts: Activity and regeneration studies. Int. J. Hydrog. Energy 2019, 44, 31700–31711. [Google Scholar] [CrossRef]
  45. Patzschke, C.F.; Parkinson, B.; Willis, J.J.; Nandi, P.; Love, A.M.; Raman, S.; Hellgardt, K. Co-Mn catalysts for H2 production via methane pyrolysis in molten salts. Chem. Eng. J. 2021, 414, 128730. [Google Scholar] [CrossRef]
  46. Karaismailoglu, M.; Figen, H.E.; Baykara, S.Z. Hydrogen production by catalytic methane decomposition over yttria doped nickel based catalysts. Int. J. Hydrog. Energy 2019, 44, 9922–9929. [Google Scholar] [CrossRef]
  47. Chen, Z.; Zhang, R.; Xia, G.; Wu, Y.; Li, H.; Sun, Z.; Sun, Z. Vacuum promoted methane decomposition for hydrogen production with carbon separation: Parameter optimization and economic assessment. Energy 2021, 222, 119953. [Google Scholar] [CrossRef]
  48. Riley, J.; Atallah, C.; Siriwardane, R.; Stevens, R. Technoeconomic analysis for hydrogen and carbon Co-Production via catalytic pyrolysis of methane. Int. J. Hydrog. Energy 2021, 46, 20338–20358. [Google Scholar] [CrossRef]
  49. Pérez, B.J.L.; Jiménez, J.A.M.; Bhardwaj, R.; Goetheer, E.; Annaland, M.V.S.; Gallucci, F. Methane pyrolysis in a molten gallium bubble column reactor for sustainable hydrogen production: Proof of concept & techno-economic assessment. Int. J. Hydrog. Energy 2020, 46, 4917–4935. [Google Scholar] [CrossRef]
  50. Kerscher, F.; Stary, A.; Gleis, S.; Ulrich, A.; Klein, H.; Spliethoff, H. Low-carbon hydrogen production via electron beam plasma methane pyrolysis: Techno-economic analysis and carbon footprint assessment. Int. J. Hydrog. Energy 2021, 46, 19897–19912. [Google Scholar] [CrossRef]
  51. Zhang, X.; Kätelhön, A.; Sorda, G.; Helmin, M.; Rose, M.; Bardow, A.; Madlener, R.; Palkovits, R.; Mitsos, A. CO2 mitigation costs of catalytic methane decomposition. Energy 2018, 151, 826–838. [Google Scholar] [CrossRef]
  52. Timmerberg, S.; Kaltschmitt, M.; Finkbeiner, M. Hydrogen and hydrogen-derived fuels through methane decomposition of natural gas—GHG emissions and costs. Energy Convers. Manag. X 2020, 7, 100043. [Google Scholar] [CrossRef]
  53. Keipi, T.; Li, T.; Løvås, T.; Tolvanen, H.; Konttinen, J. Methane thermal decomposition in regenerative heat exchanger reactor: Experimental and modeling study. Energy 2017, 135, 823–832. [Google Scholar] [CrossRef]
  54. Kim, M.H.; Lee, E.K.; Jun, J.H.; Kong, S.J.; Han, G.Y.; Lee, B.K.; Lee, T.-J.; Yoon, K.J. Hydrogen production by catalytic decomposition of methane over activated carbons: Kinetic study. Int. J. Hydrog. Energy 2003, 29, 187–193. [Google Scholar] [CrossRef]
  55. Turton, R.; Bailie, R.C.; Whiting, W.B.; Shaeiwitz, J.A.; Bhattacharyya, D. Analysis, Synthesis, and Design of Chemical Processes, 4th ed.; Pearson Education: Upper Saddle River, NJ, UAS, 2013; pp. 157–226. [Google Scholar]
  56. Keipi, T.; Tolvanen, H.; Konttinen, J. Economic analysis of hydrogen production by methane thermal decomposition: Comparison to competing technologies. Energy Convers. Manag. 2018, 159, 264–273. [Google Scholar] [CrossRef]
  57. Vasalos, I.A.; Lappas, A.A.; Kopalidou, E.P.; Kalogiannis, K.G. Biomass catalytic pyrolysis: Process design and economic analysis. Wiley Interdiscip. Rev. Energy Environ. 2016, 5, 370–383. [Google Scholar] [CrossRef]
  58. Liu, L.; Qian, H.; Mu, L.; Wu, J.; Feng, X.; Lu, X.; Zhu, J. Techno-economic analysis of biomass processing with dual outputs of energy and activated carbon. Bioresour. Technol. 2020, 319, 124108. [Google Scholar] [CrossRef]
  59. Hoffman, Z. Simulation and Economic Evaluation of Coal Gasification with SETS Reforming Process for Power Production. Master’s Thesis, Louisiana State University (LSU), Baton Rouge, LA, USA, 2005. Available online: https://digitalcommons.lsu.edu/gradschool_theses/2269 (accessed on 21 July 2021).
  60. Cruellas, A.; Bakker, J.; Annaland, M.V.S.; Medrano, J.; Gallucci, F. Techno-economic analysis of oxidative coupling of methane: Current state of the art and future perspectives. Energy Convers. Manag. 2019, 198, 111789. [Google Scholar] [CrossRef]
  61. Parkinson, B.; Tabatabaei, M.; Upham, D.C.; Ballinger, B.; Greig, C.; Smart, S.; McFarland, E. Hydrogen production using methane: Techno-economics of decarbonizing fuels and chemicals. Int. J. Hydrog. Energy 2018, 43, 2540–2555. [Google Scholar] [CrossRef]
  62. Chen, J.; Tyagi, R.D.; Li, J.; Zhang, X.; Drogui, P.; Sun, F. Economic assessment of biodiesel production from wastewater sludge. Bioresour. Technol. 2018, 253, 41–48. [Google Scholar] [CrossRef] [Green Version]
  63. Keipi, T.I.-M.; Hankalin, V.; Nummelin, J.; Raiko, R. Techno-economic analysis of four concepts for thermal decomposition of methane: Reduction of CO2 emissions in natural gas combustion. Energy Convers. Manag. 2016, 110, 1–12. [Google Scholar] [CrossRef]
  64. Gim, B.-J.; Kim, J.-W.; Ko, H.-M. Economic evaluation of domestic low-temperature water electrolysis hydrogen production. Trans. Korean Hydrog. New Energy Soc. 2011, 22, 559–567. [Google Scholar] [CrossRef]
  65. Dolan, M.; Beath, A.; Hla, S.; Way, J.; Abu El Hawa, H. An experimental and techno-economic assessment of solar reforming for H2 production. Int. J. Hydrog. Energy 2016, 41, 14583–14595. [Google Scholar] [CrossRef]
  66. Gim, B.; Yoon, W.L. Analysis of the economy of scale and estimation of the future hydrogen production costs at on-site hydrogen refueling stations in Korea. Int. J. Hydrog. Energy 2012, 37, 19138–19145. [Google Scholar] [CrossRef]
  67. International Energy Agency (IEA). Available online: https://www.iea.org/data-and-statistics/charts/hydrogen-production-costs-using-natural-gas-in-selected-regions-2018-2 (accessed on 25 July 2021).
Figure 1. Schematic diagram of techno-economic parametric study for investigated systems for methane pyrolysis (MP).
Energies 14 06102 g001
Figure 2. Results of kinetic validation for (a) thermal methane pyrolysis (TMP) and (b) catalytic methane pyrolysis (CMP) reactions.
Energies 14 06102 g002
Figure 3. Block flow diagrams for methane pyrolysis (MP) systems of (a) thermal methane pyrolysis (TMP-S1), (b) catalytic methane pyrolysis (CMP-S2), and systems with additional gasification and WGS reaction of (c) TMPG-S3 and (d) CMPG-S4.
Energies 14 06102 g003aEnergies 14 06102 g003b
Figure 4. Technical performance for methane pyrolysis (MP) systems of (a) thermal methane pyrolysis (TMP-S1), (b) catalytic methane pyrolysis (CMP-S2), and systems with additional gasification and WGS reaction of (c) TMPG-S3 and (d) CMPG-S4.
Energies 14 06102 g004
Figure 5. Amount of fuel (CH4 and H2) consumption for methane pyrolysis (MP) systems of (a) thermal methane pyrolysis (TMP-S1) and (b) catalytic methane pyrolysis (CMP-S2) in temperature of 1073–1373 K and 1023–1173 K.
Energies 14 06102 g005
Figure 6. Amount of fuel (CH4 and H2) consumption for methane pyrolysis (MP) systems of thermal and catalytic methane pyrolysis with gasification and WGS reaction ((a) TMPG-S3 and (b) CMPG-S4) in temperature of 1073–1373 K and 1023–1173 K.
Energies 14 06102 g006
Figure 7. Unit H2 production cost for methane pyrolysis (MP) systems of (a) thermal methane pyrolysis (TMP-S1), (b) catalytic methane pyrolysis (CMP-S2), and the systems with additional gasification and WGS reaction of (c) TMPG-S3 and (d) CMPG-S4.
Energies 14 06102 g007aEnergies 14 06102 g007b
Figure 8. Results of sensitivity analysis for methane pyrolysis (MP) systems of (a) thermal methane pyrolysis (TMP-S1), (b) catalytic methane pyrolysis (CMP-S2), and the systems with additional gasification and WGS reaction of (c) TMPG-S3 and (d) CMPG-S4.
Energies 14 06102 g008
Figure 9. Results of scenario analysis up to 1000 Nm3 h−1 for methane pyrolysis (MP) systems of (a) thermal methane pyrolysis (TMP-S1), (b) catalytic methane pyrolysis (CMP-S2), and the systems with additional gasification and WGS reaction of (c) TMPG-S3 and (d) CMPG-S4 with comparison to systems of steam methane reforming (SMR) of USD 0.94–1.78 kgH2−1 and SMR with carbon capture and storage (CCS) of USD 1.45–2.38 kgH2−1.
Energies 14 06102 g009
Table 1. Material balance for methane pyrolysis (MP) systems of (a) thermal methane pyrolysis (TMP-S1), (b) catalytic methane pyrolysis (CMP-S2), and systems with additional gasification and WGS reaction of (c) TMPG-S3 and (d) CMPG-S4.
(a) TMP-S1(1)(2)(3)(4)(5)(6)(7)(8)
Temperature/K298127312731273127312731273298
Pressure/bar1.001.001.000.990.990.990.991.00
Molar flow/kmol h−11.003.021.002.020.022.000.270.12
Mole fraction
CH41.000.0100.011.00001.00
C00.331.0000000
H200.6600.9901.001.000
(b) CMP-S2(1)(2)(3)(4)(5)(6)(7)(8)
Temperature/K298117311731173117311731173298
Pressure/bar1.001.001.000.990.990.990.991.00
Molar flow/kmol h−11.005.270.934.342.421.850.240.11
Mole fraction
CH41.000.4800.571.00001.00
C00.181.0000000
H200.3500.4301.001.000
(c) TMPG-S3(1)(2)(3)(4)(5)(6)(7)(8)
Temperature/K29812731273298298341973623
Pressure/bar1.001.001.001.001.001.001.001.00
Molar flow/kmol h−11.003.021.001.002.004.003.783.78
Mole fraction
CH41.000.01000000
C00.331.00000.2500
H200.6600000.300.30
O20000.2100.0500
H2O00001.000.500.230.23
N20000.7900.200.210.21
CO20000000.150.15
CO0000000.120.12
(c) TMPG-S3(9)(10)(11)(12)(13)(14)(15)
Temperature/K6236231273127312731273298
Pressure/bar1.001.000.990.990.990.991.00
Molar flow/kmol h−13.781.382.020.022.000.450.20
Mole fraction
CH4000.011.00001.00
C0000000
H20.361.000.9901.001.000
O20000000
H2O0.16000000
N20.21000000
CO20.21000000
CO0.05000000
(d) CMPG-S4(1)(2)(3)(4)(5)(6)(7)(8)
Temperature/K29811731173298298337923623
Pressure/bar1.001.001.001.001.001.001.001.00
Molar flow/kmol h−11.005.080.920.921.843.683.453.45
Mole fraction
CH41.000.46000000
C00.181.00000.2500
H200.3600000.300.30
O20000.2100.0500
H2O00001.000.500.220.22
N20000.7900.200.210.21
CO20000000.160.16
CO0000000.100.10
(d) CMPG-S4(9)(10)(11)(12)(13)(14)(15)
Temperature/K6236231173117311731173298
Pressure/bar1.001.000.990.990.990.991.00
Molar flow/kmol h−13.451.294.162.241.840.400.18
Mole fraction
CH4000.561.00001.00
C0000000
H20.371.000.4401.001.000
O20000000
H2O0.15000000
N20.21000000
CO20.23000000
CO0.03000000
Table 3. Results of itemized cost estimation for methane pyrolysis (MP) systems of (a) thermal methane pyrolysis (TMP-S1), (b) catalytic methane pyrolysis (CMP-S2), and systems with additional gasification and WGS reaction of (c) TMPG-S3 and (d) CMPG-S4.
(a) TMP-S1(b) CMP-S2(c) TMPG-S3(d) CMPG-S4
ItemsAnnualized Cost/USD y−1Unit H2 Production Cost/USD kgH2−1Annualized Cost/USD y−1Unit H2 Production Cost/USD kgH2−1Annualized Cost/USD y−1Unit H2 Production Cost/USD kgH2−1Annualized Cost/USD y−1Unit H2 Production Cost/
USD kgH2−1
1. Capital cost
MP reactor37,1391.2935,5901.3350,9671.0548,8401.08
WGS reactor----18040.0417290.04
Regenerator--19,2330.72----
Catalyst--60.00--60.00
Gasifier----64520.1361830.14
PSA11,3230.3917,9240.6721,3200.4425,4600.56
Cyclone2240.012140.012240.002130.00
Supplement88330.3111,6650.4413,8190.2813,8540.31
2. Operating cost
Reactant33,7041.1733,7041.2633,7040.6933,7040.74
Catalyst operating cost--60.00--60.00
Water----24480.0522510.05
Fuel41500.1436960.1468480.1461890.14
Labor75240.2675240.2875240.1575240.17
PSA operating cost20.001830.011780.003410.01
Maintenance11,4890.4015,1730.5717,9750.3718,0210.40
Other costs57450.2075870.2889880.1890110.20
3. C selling price−58,700−2.04−54,352−2.03----
4. Total cost61,4312.1498,1523.66172,2503.53173,3323.82
Publisher’s Note: MDPI stays neutral with regard to jurisdictional claims in published maps and institutional affiliations.

