1. Introduction
The smart grids—equipped with sensors, automation, control, and new communication resources—present themselves as the next step towards the modernization of the electricity distribution system, which is currently aged [
1,
2]. Today, with the constant increase in the demand for electricity in large urban centers, modernization in the electricity sector is necessary and adequate infrastructure is also essential for both the operation and management of assets in the distribution grid [
1]. Utilities always seek to offer reliable and uninterrupted energy with quality, and consequently to gain the satisfaction of their customers. According to [
2,
3], one of the areas of attention in terms of the utilities concerns the aged equipment installed within their concession area, which has an ever-greater chance of failing and causing an interruption in the energy supply. As a benefit of modernization, utilities will be able to reduce their operating costs, locate defects faster in the distribution grid, and decrease corrective maintenance while increasing predictive maintenance. Thus, the end consumer begins to enjoy a power grid with fewer and fewer periods of energy interruption and thus high reliability [
1,
2].
The overhead distribution grid, when compared to the electricity transmission grid, is more complex due to the greater number of branches along the grid and consequently has a higher cost for real-time monitoring. Currently, there is no widely used method for the online monitoring of electrical quantities on the low-voltage side of the distribution transformer for the purpose of asset monitoring [
2,
4].
One of the most important pieces of equipment with a large number installed along the electricity distribution grid is the distribution transformer. The data of the operation status, such as current, voltage, temperature, and other measurements derived from these quantities, related to this equipment helps the utility to provide a distribution grid with a safer and more reliable operation [
1,
5,
6,
7].
Distribution transformers are exposed to possible visible degradation and damage (oil leakage, tree fall, vehicle collision on pole, etc.) as well as invisible damage (voltage levels, overcurrent, harmonics, and temperature) [
1,
8]. The monitoring of distribution transformers helps mainly in the detection of those invisible degradations, which are more difficult to detect, helping both to avoid possible failures that could occur in the transformer when exposed for long periods in such adverse situations and even to identify a problem that may cause damage to the customer, which must be compensated by the utility.
One of those adverse situations is overload. The distribution grid has a level considered acceptable by the utility and the transformer, which allows the equipment to remain operating above its nominal power for a certain period of time [
5,
9]. If the overload reaches a level above what is allowed or if it lasts longer than expected, this will cause irreversible damage to the internal and essential components of the distribution transformer [
1,
5,
6,
7,
10,
11].
The overload in the distribution grid occurs because the end-user controls the load demand, making it uncontrollable solely by the utility [
1,
9]. The overload also causes accelerated degradation of the insulation between the oil and winding, causing bubbles to form in the windings due to high temperatures [
12]. According to [
13], the monitoring of this isolation is carried out by means of oil sampling, which is a costly and time-consuming process that requires specialized labor. Monitoring the insulation of these components of the distribution transformer is essential as it indicates the integrity of the equipment and whether it can continue operating [
5,
10,
11].
Another area of concern in the near future will be the massive insertion of distributed generation (DG) in the form of solar and photovoltaic generation at the distribution level and at the installation of future electric vehicle (EV) charging stations [
1]. According to [
14,
15,
16,
17], among the main impacts of DG in the distribution grid are power flow inversion, voltage increase, overcurrent, and the risk of overheating the cables. In terms of the power flow, when the consumer unit starts to generate more energy than it consumes, it starts to inject energy into the distribution grid, inverting the power flow. If more consumer units inject energy into the distribution grid at the same time and the feeder is not prepared to receive that energy, it may cause overcurrent and increase the technical losses within the feeder. The inversion of the power flow also hinders the correct parameterization of the grid protection system as the system is now more complex. Finally, the inversion of the power flow makes the voltage in the load higher than the voltage in the substation, raising the voltage level in the loads. From the point of view of EVs, the widespread use and the vehicle charging in residential, commercial, and work environments impact the electricity grid mainly with an increase in the voltage imbalance, a decrease in the magnitude of the voltage, and overload [
18]. The higher the level of EV penetration, the greater the demand, which can cause greater wear and tear on the distribution grid, impairing the service life of the equipment [
19]. The insertion of those new technologies in the distribution grid will provide new flows of power and behavior of the distribution system, making the monitoring of the electric grid essential.
The real-time monitoring of distribution transformers aims to reduce interruptions in the power supply and avoid possible accidents, in addition to being able to store historical data important for studies of improvements in the distribution grid or even for an eventual replacement of transformer [
1].
Thus, the real-time monitoring of those distribution transformers becomes a very important tool for the utilities’ operation and maintenance areas [
1,
20]. This is especially true once the performance of the predictive maintenance is much less costly for the company than is the correction of a failure in the distribution grid [
21]. In addition, there are several advantages that monitoring provides through data collected in the field, such as: extending the life of a transformer; better planning for grid expansions or the insertion of new technologies (photovoltaics, recharging of electric vehicles, etc.); better quality of the supplied energy; reduction of accidents and its severity; and reduction in the time of identification and location of the fault [
1,
9,
20,
21,
22].
For online monitoring of distribution transformers, the essential quantities to be measured are voltage, current, and ambient temperature [
1]. These quantities are easily obtained at the transformer stations where the distribution transformer is located and with them in hand, it is possible to find other interesting parameters of a transformer to be monitored, such as powers (active, reactive, and apparent), energies (active, reactive, and apparent), hot-spot temperature, and loss of service life, among others. With the knowledge of all those parameters of a transformer station, it is possible to the mitigate potential risks as mentioned throughout the text, which could occur in distribution transformers in operation [
23].
ENEL Distribution São Paulo is carrying out the R&D (research and development) project called Urban Futurability. The technologies developed within the scope of this project aims to digitize and develop innovative equipment and methods for the automation, protection, and improvement of the distribution grid. Its focus is on the electrical part as much as the civil work for grid underground conversion. The project is located in the Vila Olímpia region, in the city of São Paulo, Brazil. This region was chosen because it has both commercial and residential load, as well as underground and overhead distribution grids with all models of distribution transformers that are found in the company’s concession area (three-phase, open delta, and closed delta), making it possible to test the equipment in different scenarios.
In the Urban Futurability project, a prototype was developed with some partners in order to study the applicability and improvements of the overhead distribution transformer monitoring solution. After applying this prototype in the field, a series of PoCs (Proof of Concept) was carried out with three different suppliers for monitoring the overhead distribution transformer. The solutions differ mainly in the technology used for the measurement of the current, which then are applied three different technologies in the project area, namely the Rogowski coil, the current transformer (CT) with a bipartite core, and CT with a bipartite core with a voltage meter. The solutions will be presented in the following chapters.
Another difference in the solutions developed in the PoCs is that in the city of São Paulo, open and closed delta transformers are often used, which consist of banks of single-phase transformers. Thus, to carry out the monitoring individually for each transformer, it was necessary to conduct a study on the use of a reduced number of current sensors and regarding how both the temperature and power calculation would be done individually. The presentation of the transformer configurations and the studies carried out will be presented in the following chapters.
The article is organized as follows.
Section 2 presents the methodologies used in the solutions.
Section 3 presents the temperature and power algorithms used in the solutions.
Section 4 presents an analysis of the results collected. Finally,
Section 5 concludes the article and presents the next steps.
2. Methodology
2.1. Overview
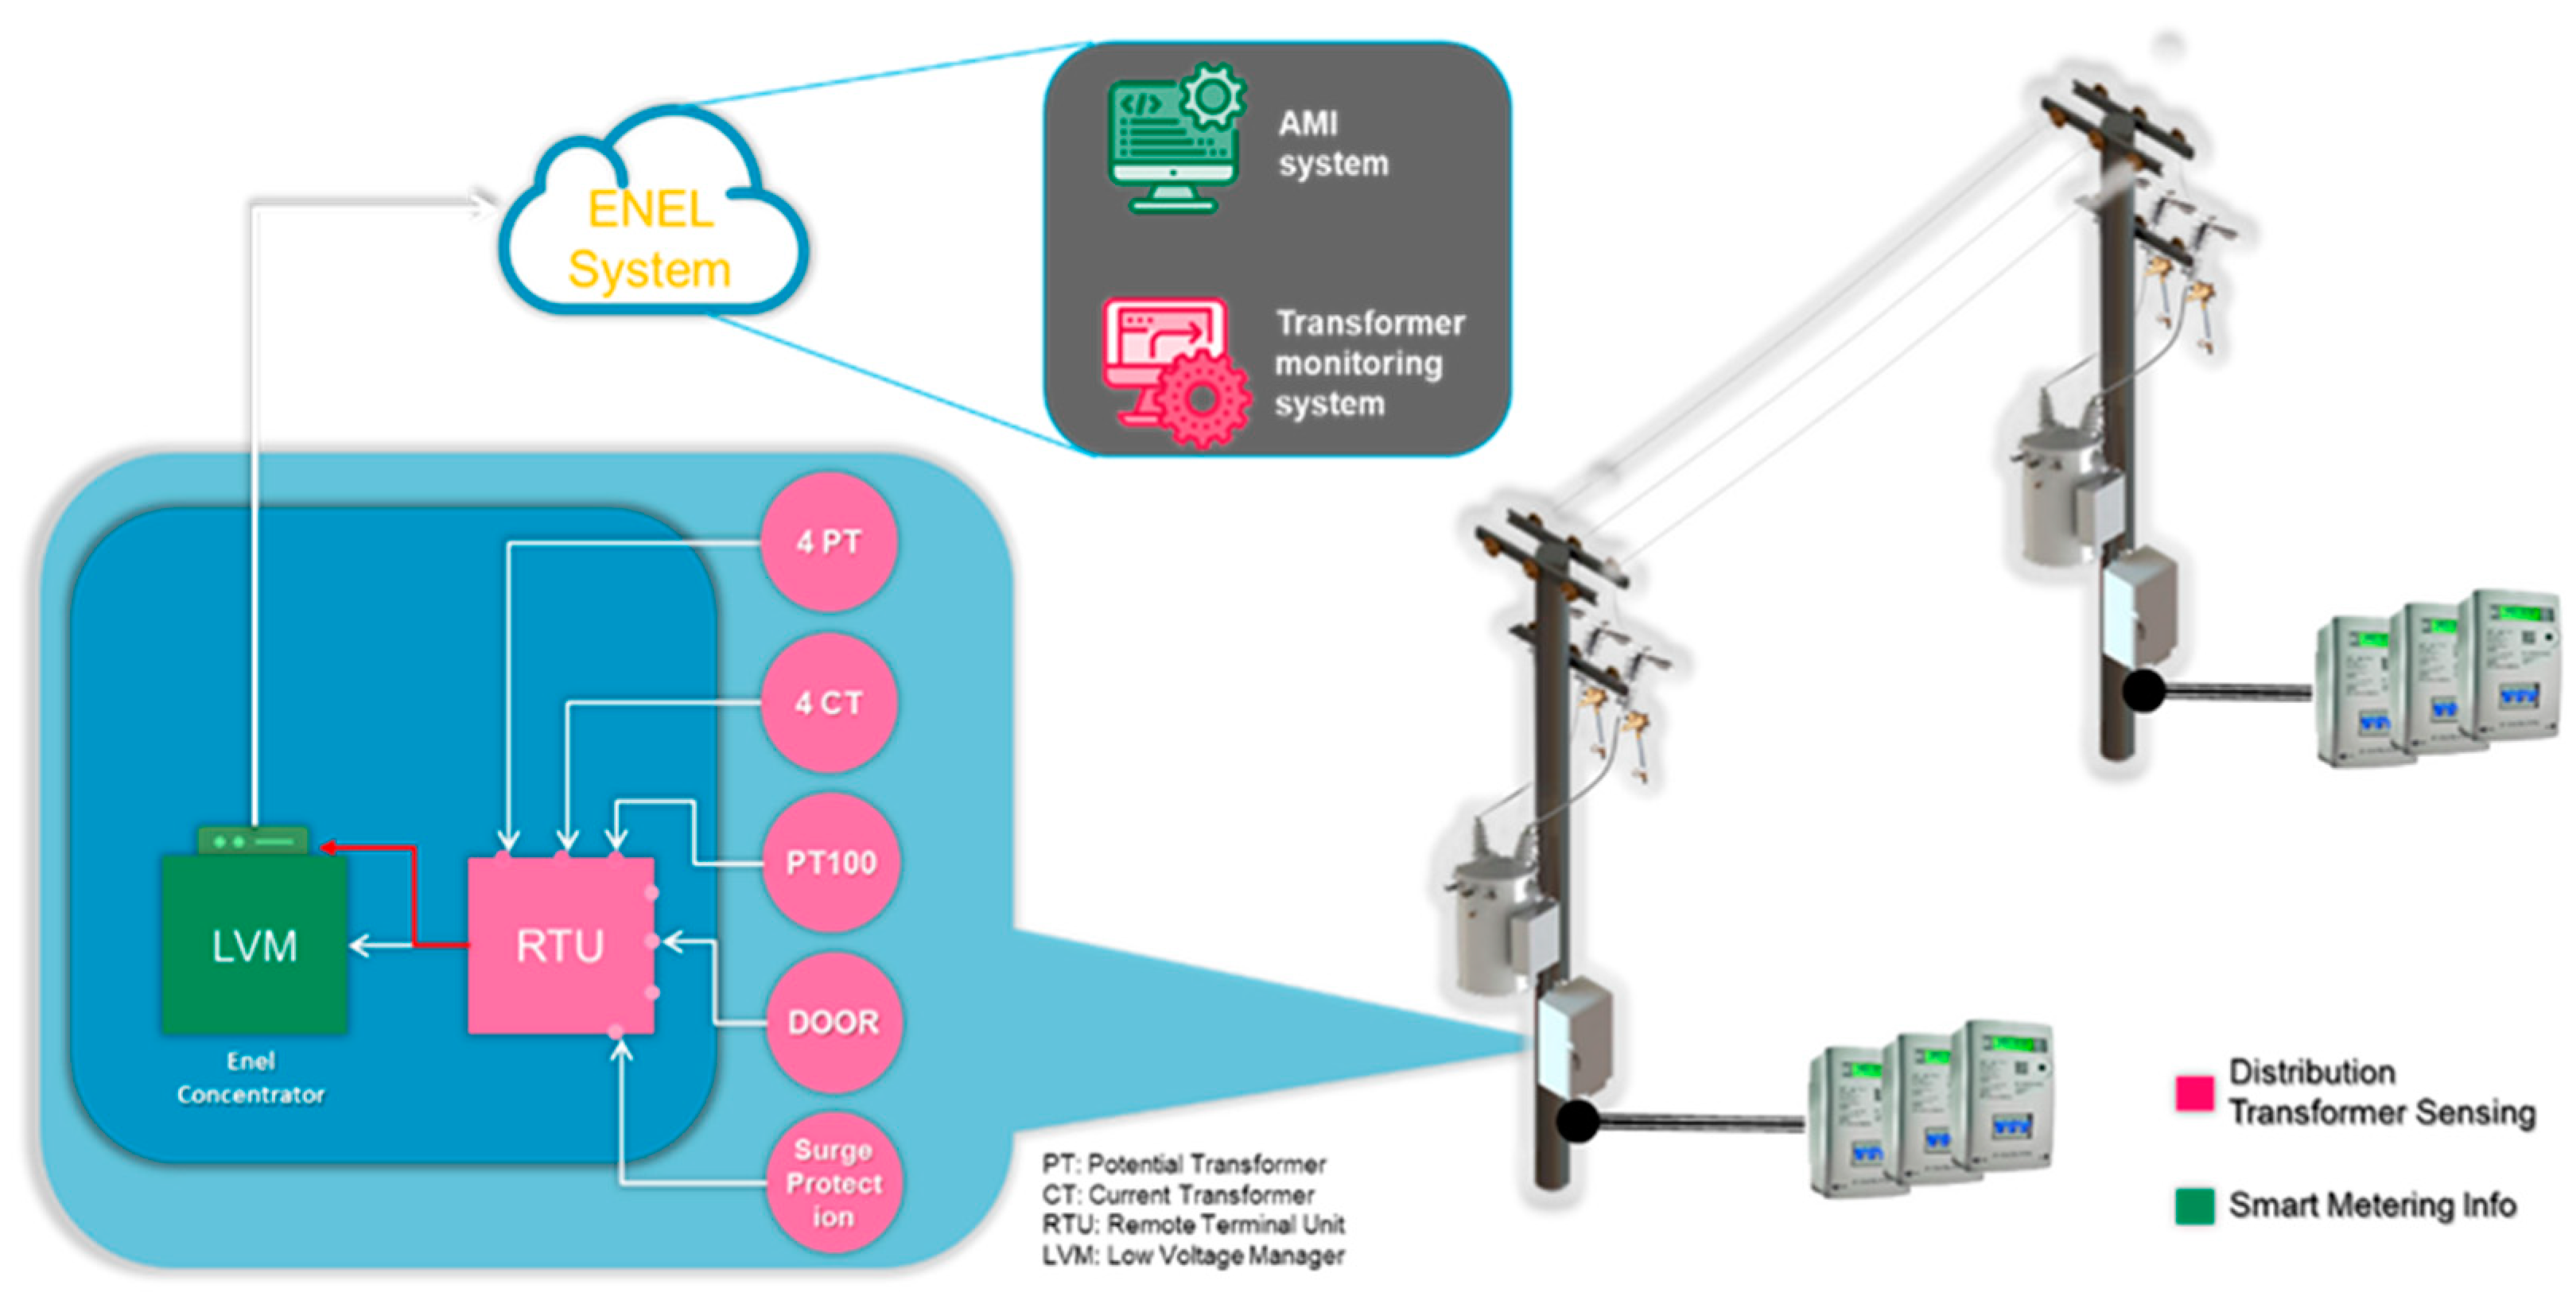
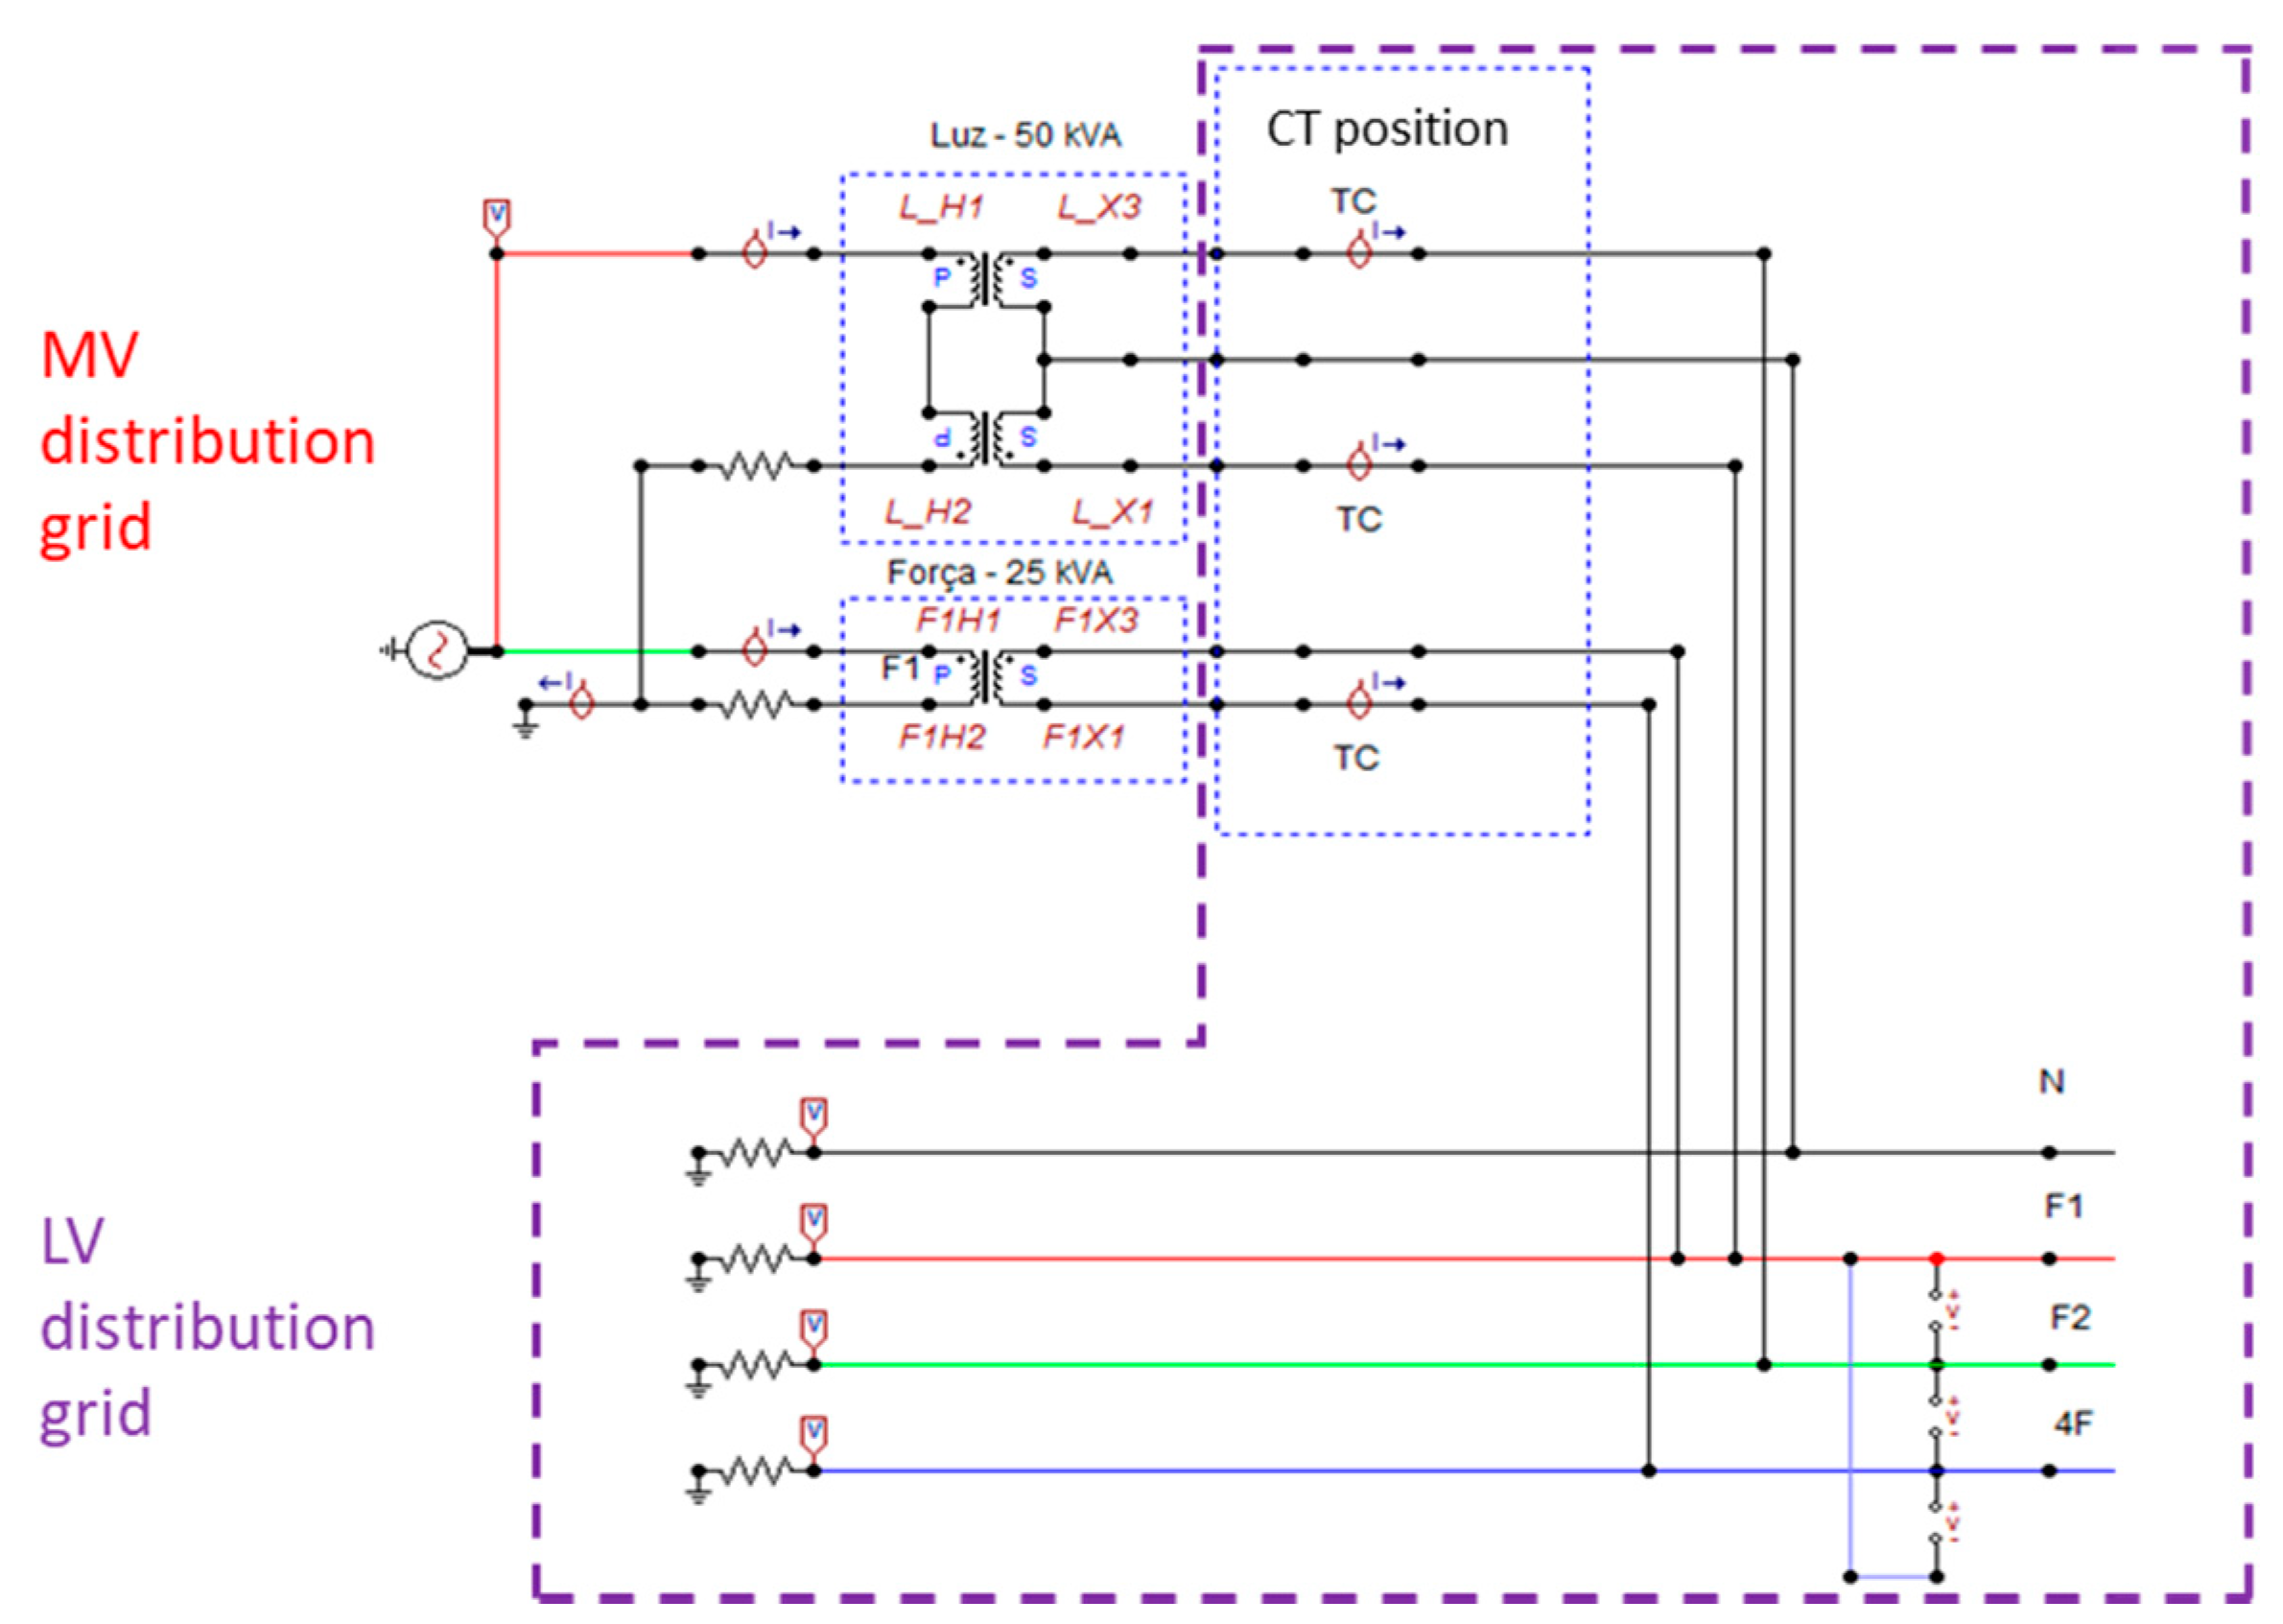
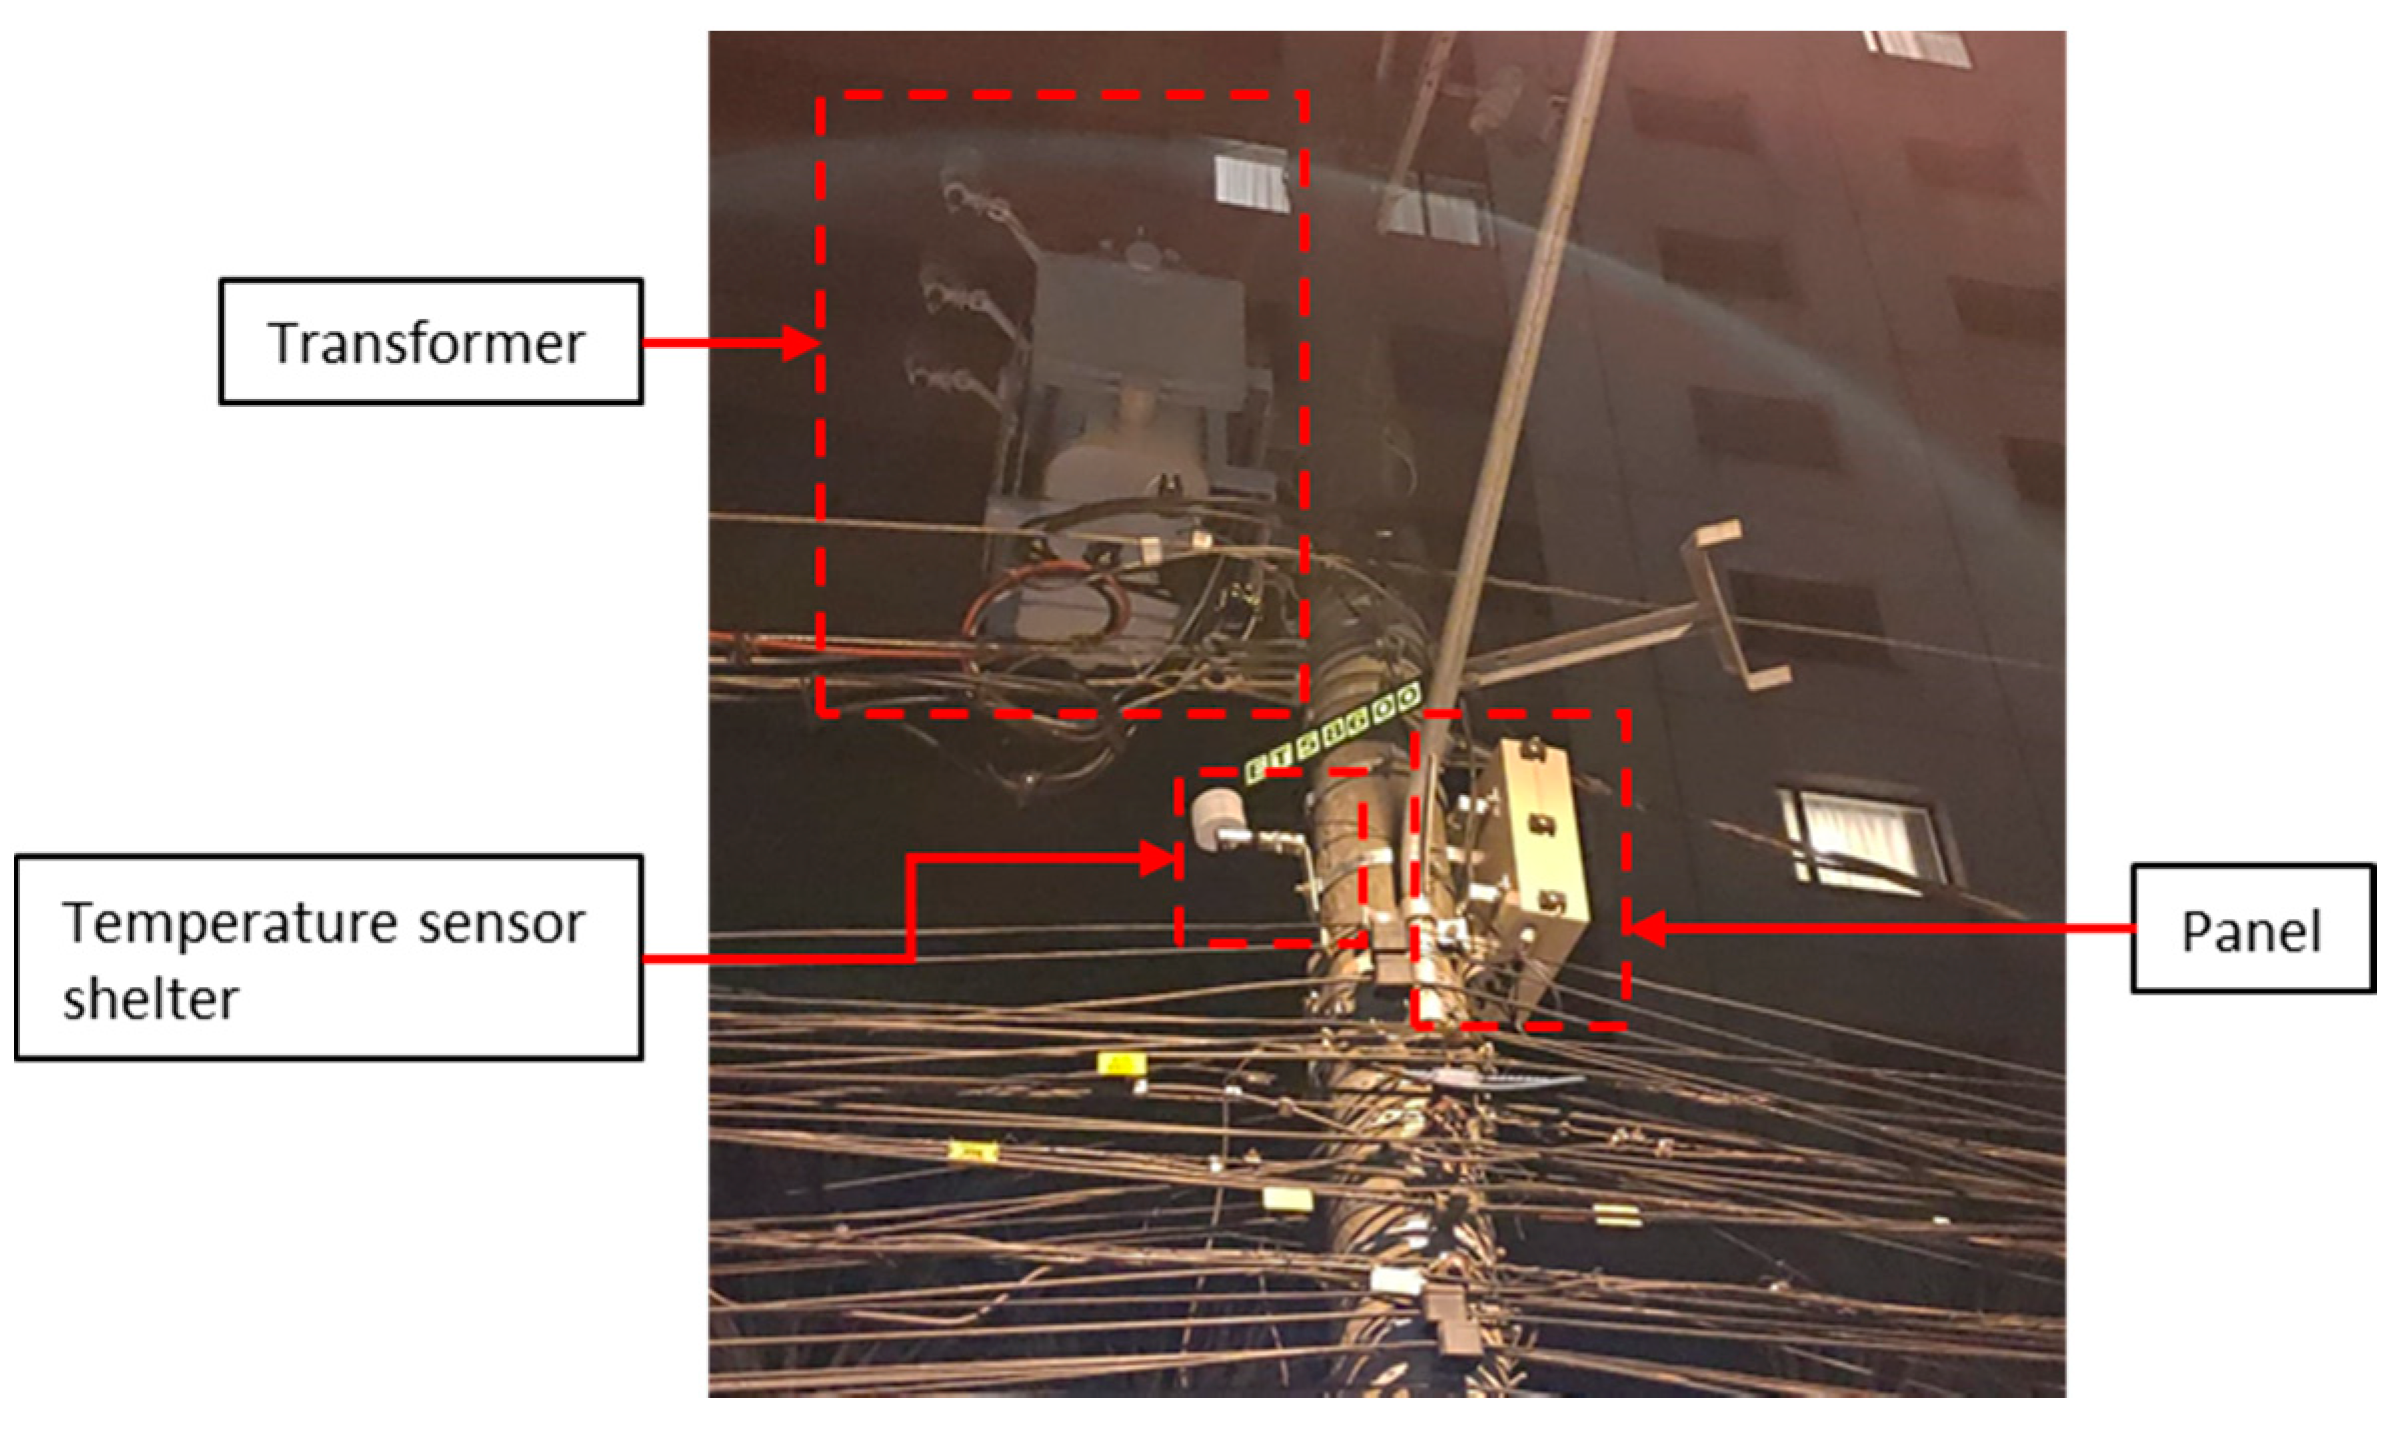
The monitoring system for overhead transformers developed in the
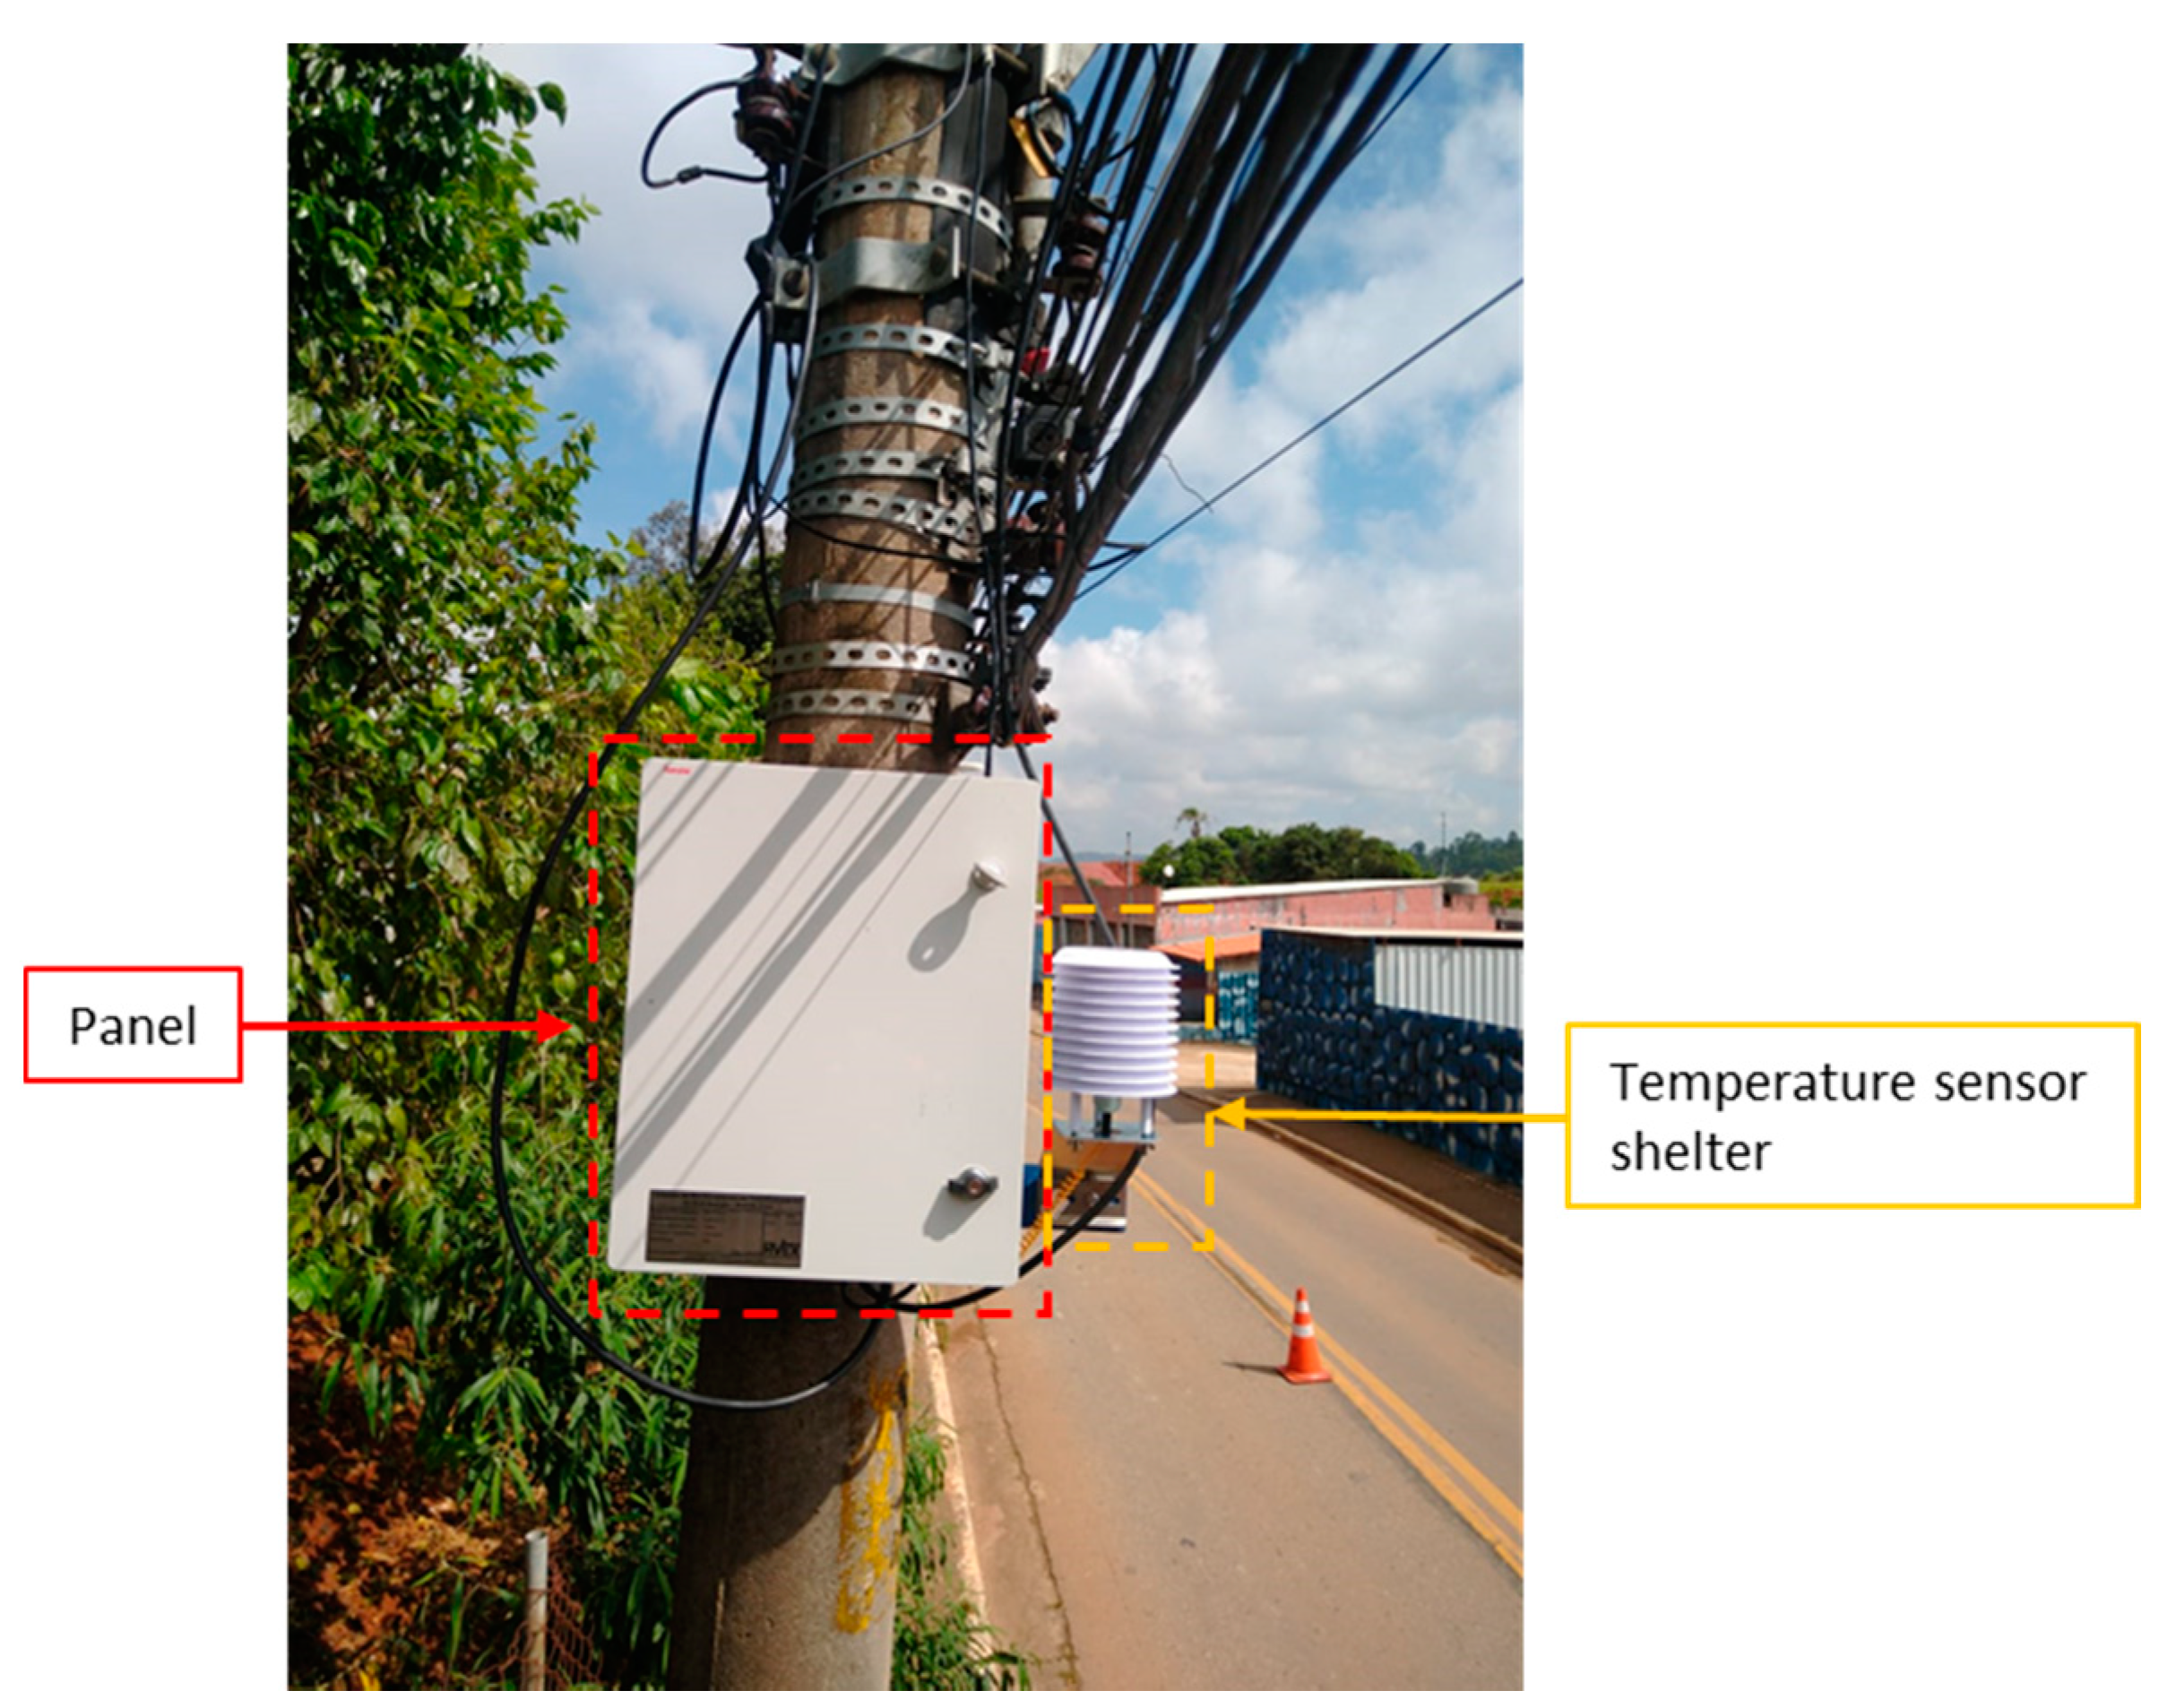
Urban Futurability project consists of a panel installed on the same pole as the transformer, with current, voltage, and ambient temperature sensors performing the measurements of the quantities. Regardless of the vendor, the solution must meet these requirements as a minimum.
Figure 1 presents a simplified view of the solution.
The solutions consisted of three or four current and voltage sensors, depending on the configuration of the transformer station in which the equipment was installed (detailed in the item Constructive Aspects). For the measurement of ambient temperature, a PT-100 sensor was used. In terms of protection, the panel has an open-door sensor and a surge protection device (SPD). The RTU (remote terminal unit) receives all this field data and performs the necessary calculations, such as for power, energy, hot-spot temperature, and loss of life of the transformer (
Section 3.2 will address the loss of life of the transformer in more detail). In addition, it monitors the values of the measured and calculated quantities, and, if any exceeds certain established limits, the equipment sends an alert due to the values of the quantities, that is, due to equipment failure (SPD actuation or open-panel door).
In the PoCs performed, the data generated by the RTU are sent to the modem (red arrow in
Figure 1), which in turn sends to the Cloud service of the ENEL Distribution São Paulo (ENEL SP). The solution that ENEL Global seeks and which will be used in the next versions of the equipment will be with the insertion of the LVM (low voltage manager) (white arrow in
Figure 1). The LVM is a device developed by ENEL and is responsible for concentrating the data generated by the monitoring of the transformer and by the Smart Meters in the consumer units. The LVM has a modem integrated into the equipment to upload the information collected to the system in the cloud by ENEL SP and then to distribute the information according to the platform used for each occasion; the data from Smart Meters for the AMI System; and the data from the transformer for the Transformer Monitoring System. The LVM was not used in the PoCs performed because it is in the process of being ratified by the Brazilian regulatory bodies.
2.2. Constructive Aspects
In the concession area of ENEL SP, there are three types of configurations of transformers for three-phase distribution: Delta-Wye, Wye-Open Delta, and Wye-Closed Delta.
According to [
24], until 1967, the city of São Paulo had American or Canadian companies responsible for the supply of electricity. Post-World War II, the city transformed its economy from predominantly agricultural to urban and industrial. Thus, with the constant increase in demand, the utility implemented the use of the open delta distribution system that was used in other countries such as Canada and the United States. The idea of using two single-phase transformers connected in an open delta enabled a cost reduction in the expansion of distribution grids and the supply of three-phase loads. This system allows for an increase in the power supplied by placing a third single-phase transformer in order to close the delta, the so-called closed delta.
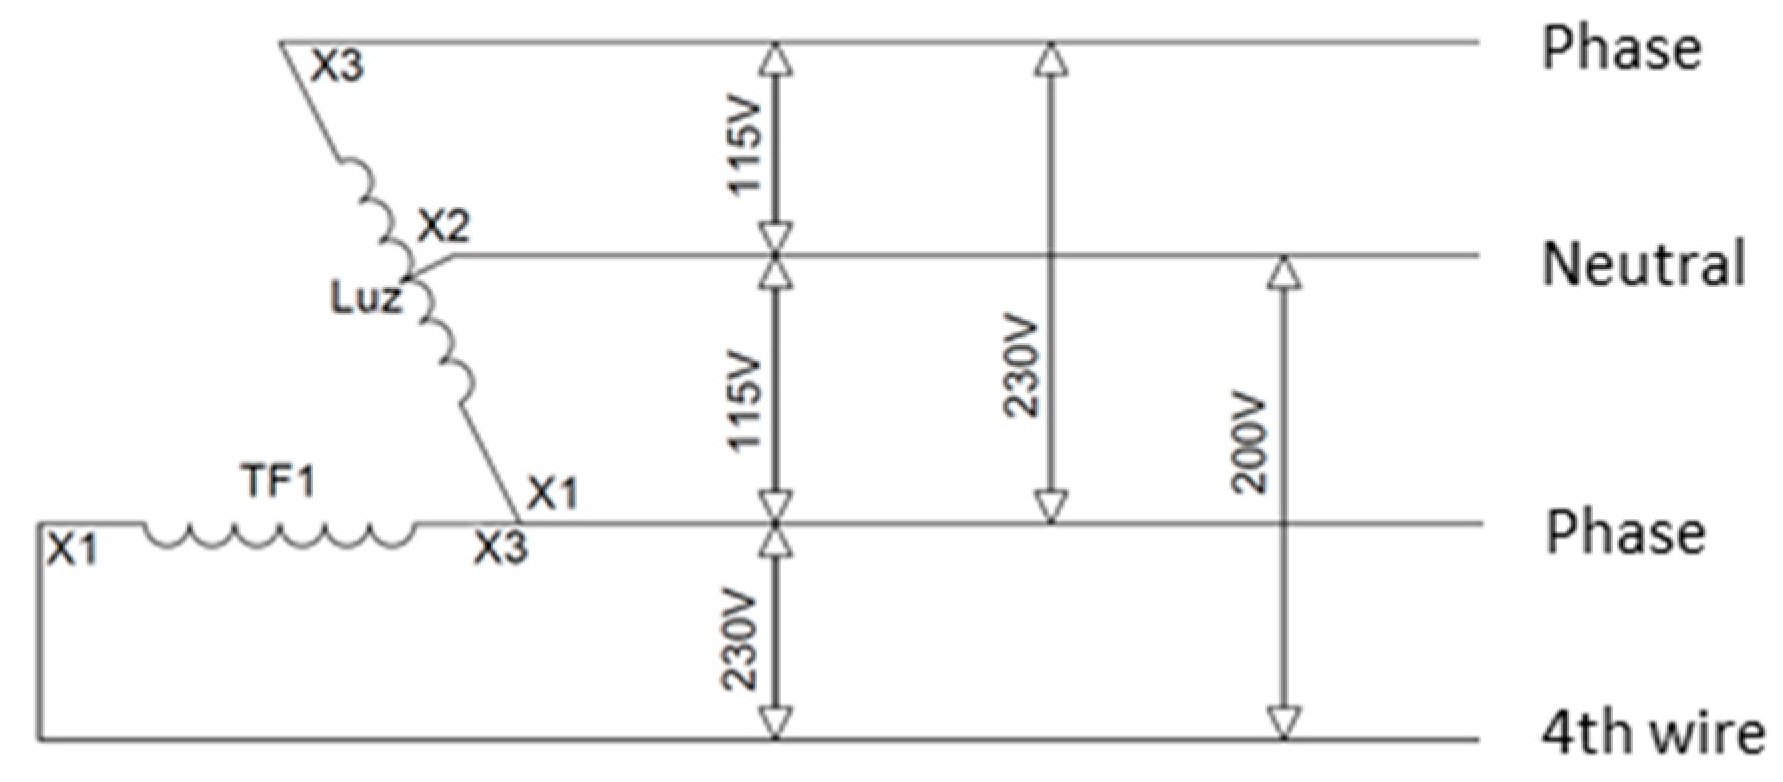
The open delta connected system consists of two single-phase transformers connected in delta on the low-voltage side and in the wye on the medium-voltage side. However, there is a slight difference when compared to the traditional connection, in which one of the transformers has one of the windings in its central tap which is used as a solidly grounded neutral; this is called the “Luz” transformer.
This connection provides an angular offset between the 120° phases. However, the phase voltages revealed to be different. In
Figure 2, we can observe the voltage obtained in this connection, in which the two phases had a potential difference of 115 V when compared to the neutral. The fourth wire, though, has a potential difference of 200 V when compared to the neutral. Therefore, the phases can be used to meet single-phase, two-phase, or three-phase loads. However, the fourth wire is used only to supply three-phase loads connected in delta, in which the line voltage will be 230 V between the three conductors.
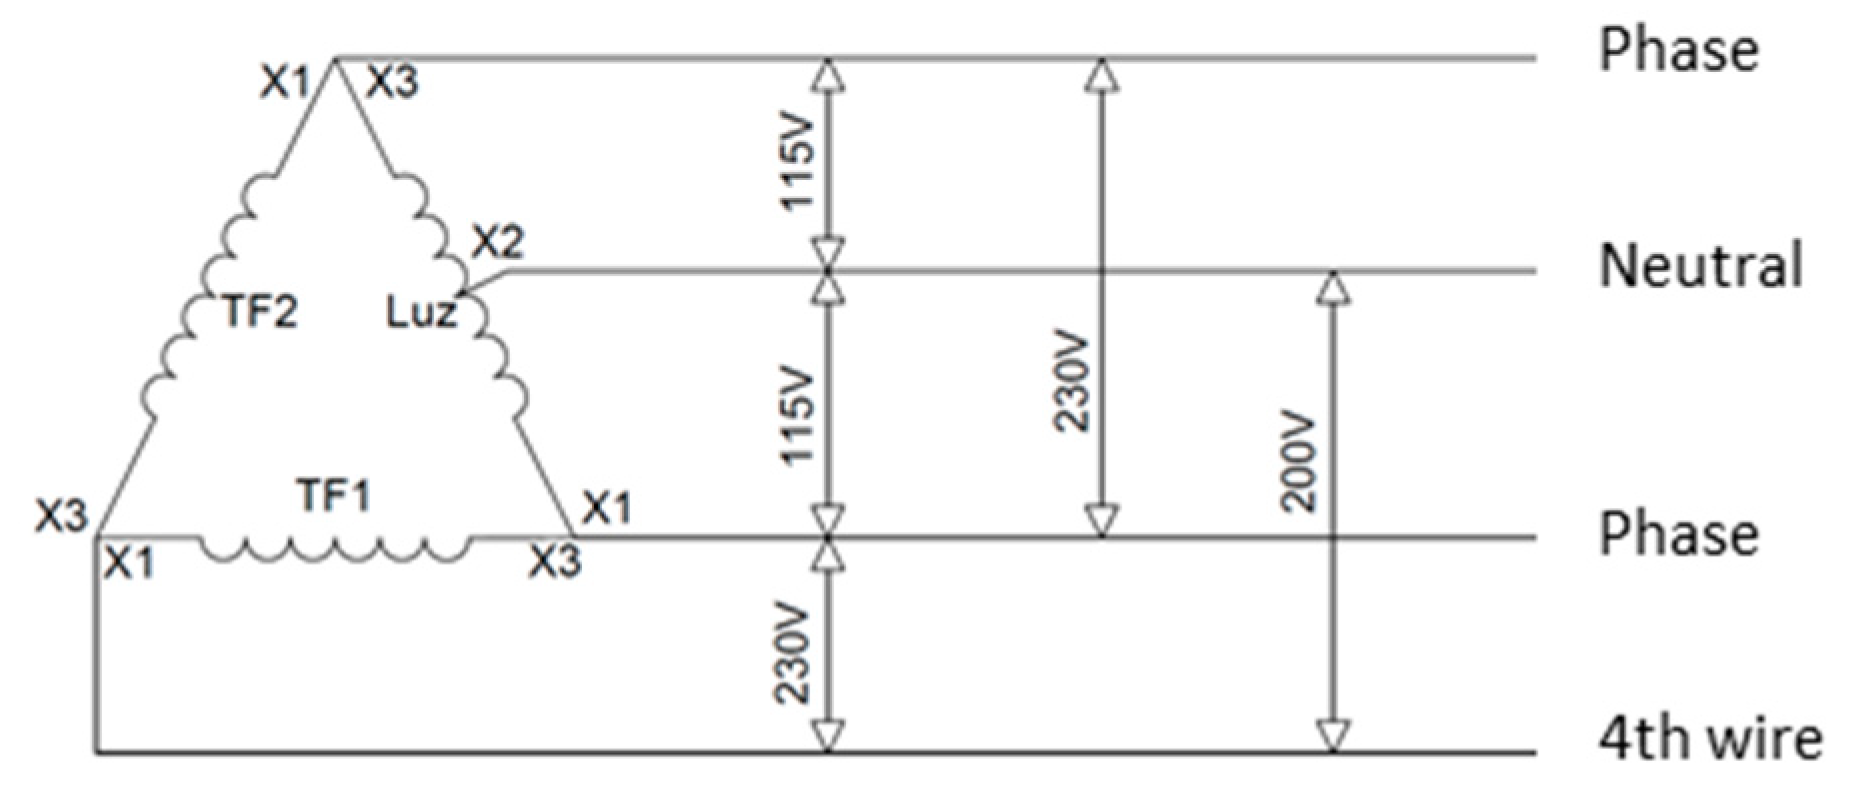
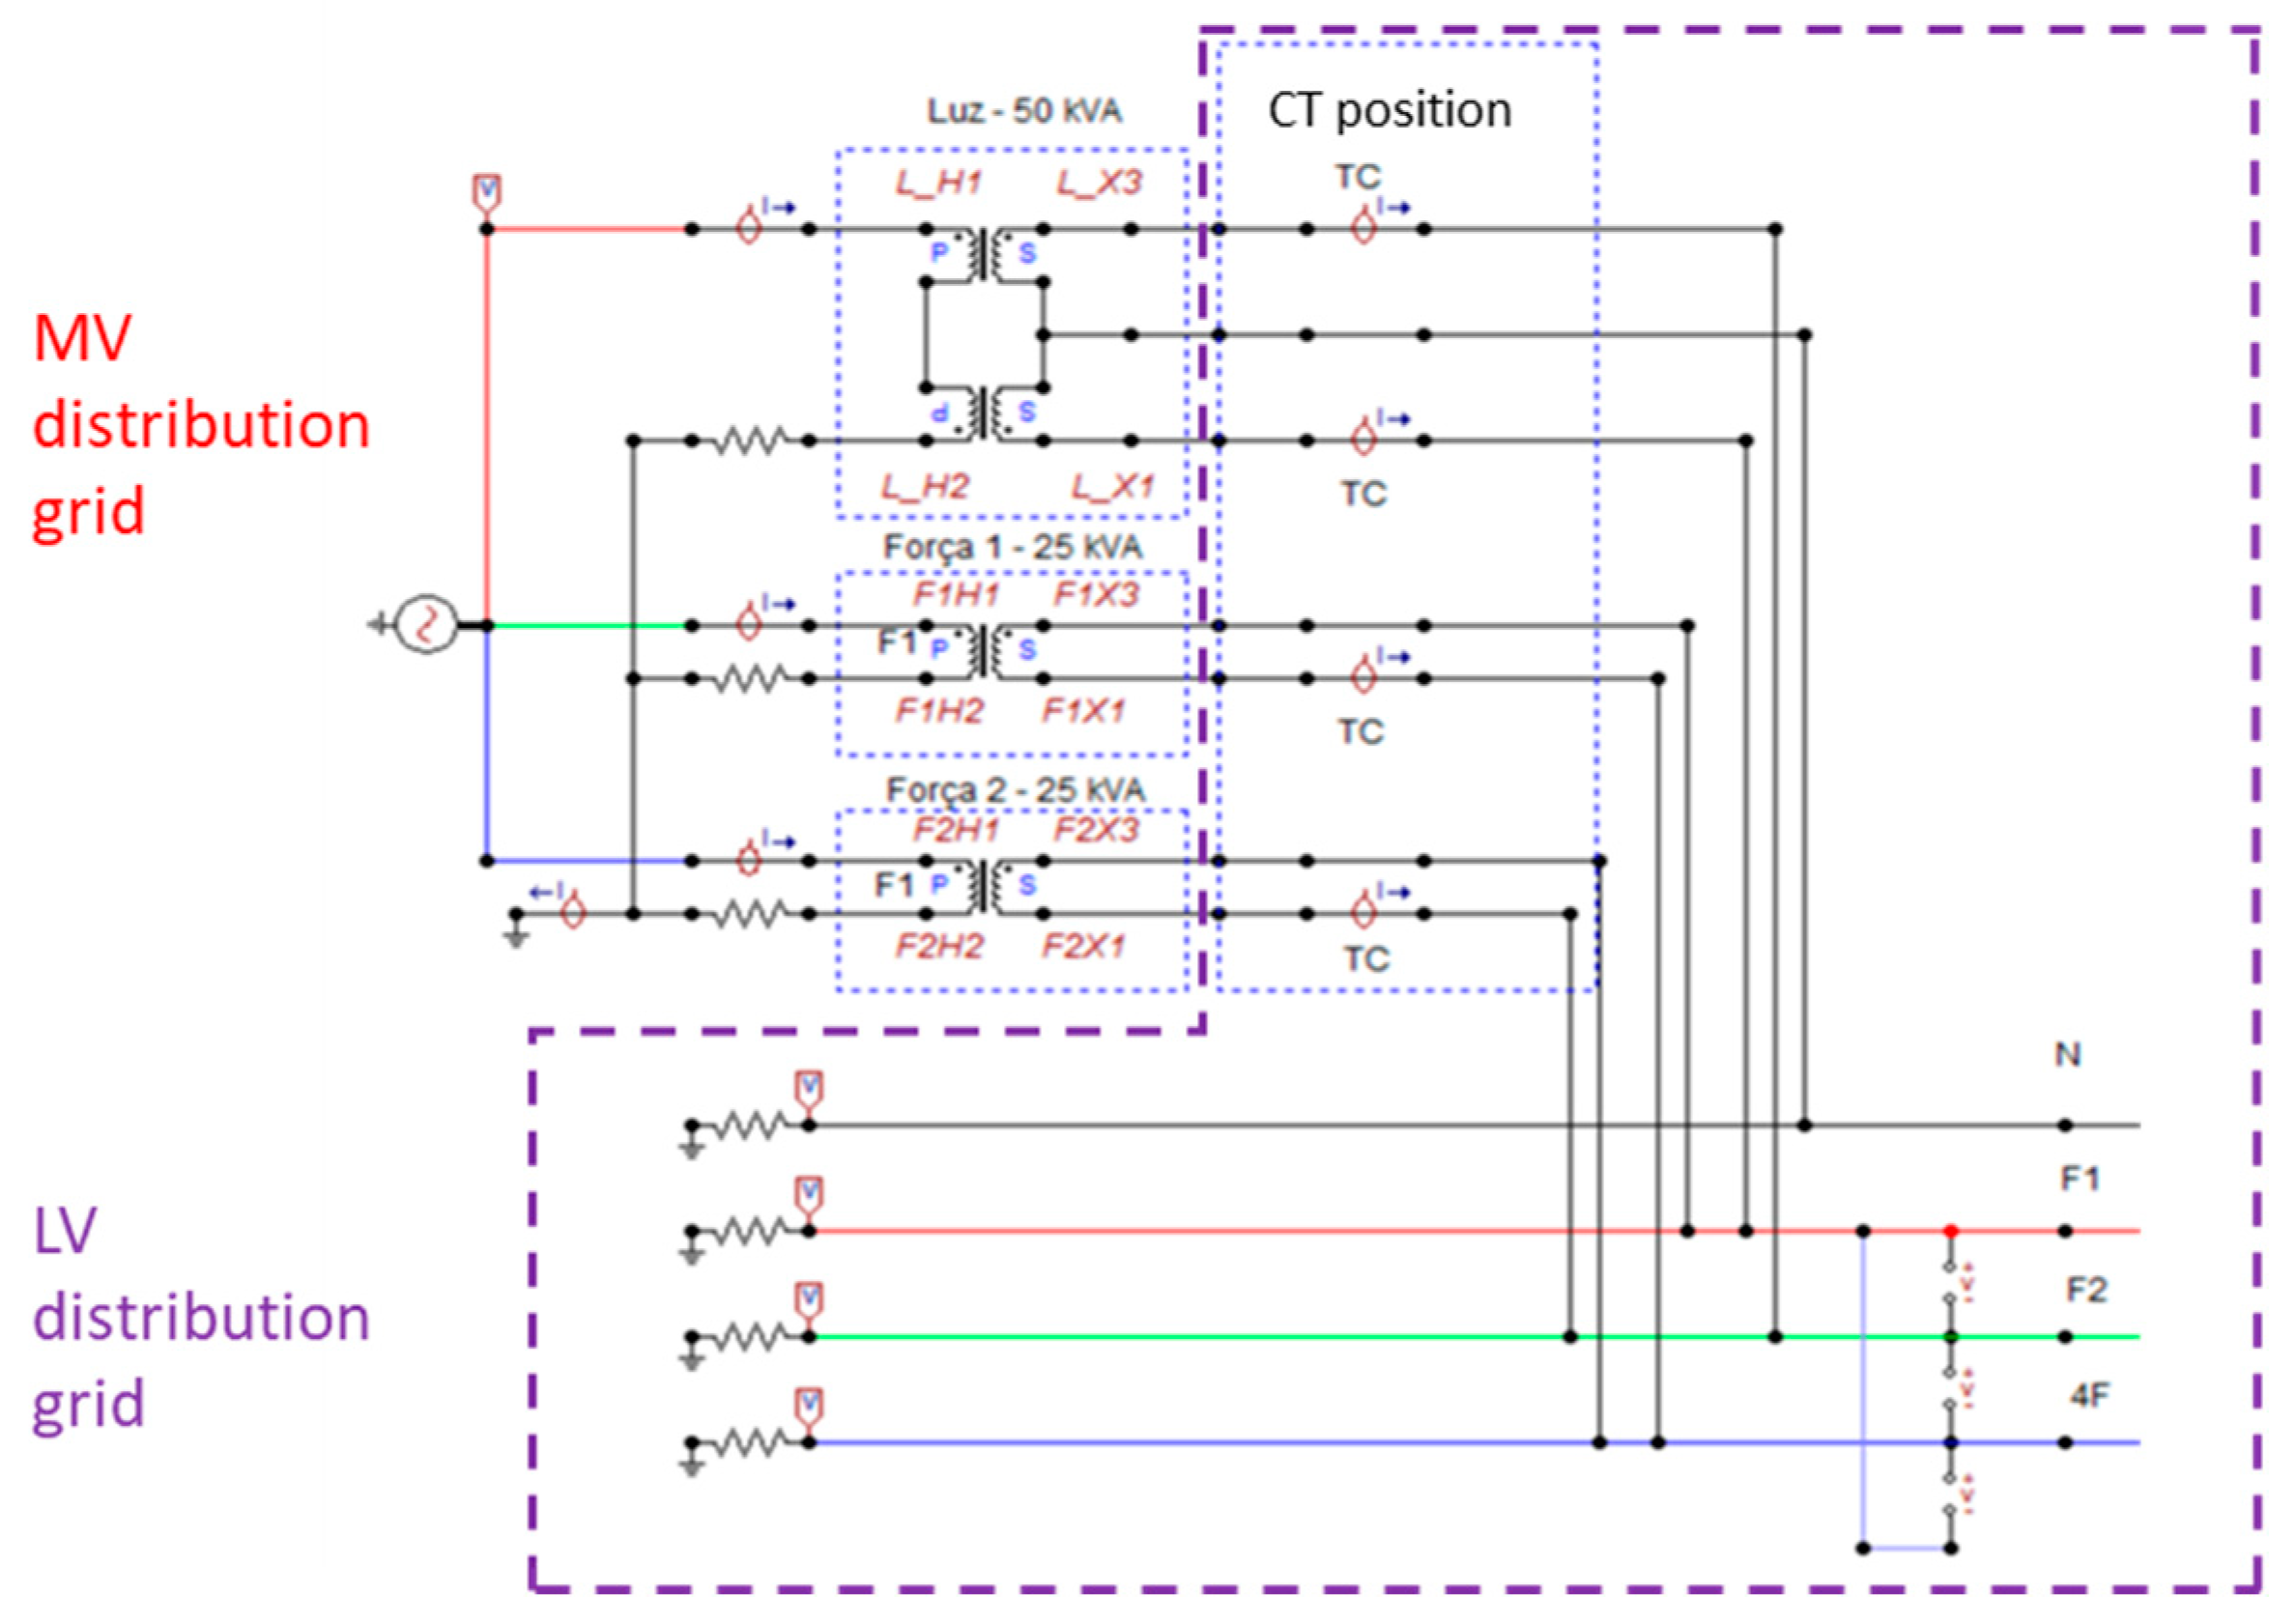
The closed delta connection can be seen in
Figure 3. The values of voltage and angular lag will remain the same, and the only change will be both the increase in the power delivered and consequently the current.
2.3. Applied Technologies
For indirect measurements of electric currents, two solutions are available: current transformers (CTs) with a split core and Rogowski coils.
Split-core CT is an equipment with a ferromagnetic core and copper windings designed to reproduce, in its secondary, a current proportional to the circuit to be measured. As the main advantage of this transducer, there is the simplicity of the circuit which is designed to read its output signal. As a disadvantage, there is the heavy weight and the constructive difficulty of the equipment intended for outdoor operation.
The Rogowski coil current transducer works based on the Ampère’s Law in conjunction with the Faraday–Lenz Law. When a Rogowski coil surrounds a conductor in which electric currents pass through, the magnetic field produced by the current flow induces a potential difference in the coil proportional to the rate of change of the current that passes through the conductor. According to [
25], this transducer has as some main advantages, including the linearity over the entire measurement range, the large frequency bandwidth in which the measurement can be performed, and the low weight/volume ratio due to the lack of a ferromagnetic core. As the main disadvantage, it has its output at low voltage levels, demanding the need for signal conditioners and making the measurement equipment necessary for reading the signal more expensive.
When technically comparing the split-core CT and the Rogowski coil, the presence of the ferromagnetic core in the split-core CT provides a series of disadvantages for the sensor, such as measurement errors, phase errors, and the phenomenon of saturation [
26]. Regarding maintenance, the split-core CT presents a greater risk of accidents since its secondary terminals can generate high voltages if they are open [
26]. Concerning the Rogowski coil, the absence of the ferromagnetic core provides a series of advantages, such as greater precision as it does not suffer from the phenomenon of saturation, lower cost, and a frequency response much better than that of the split-core CT, responding quickly to high changes in the current value [
26,
27,
28,
29]. The Rogowski coil is also immune to electromagnetic interference [
27]. As a disadvantage, the relative position of the conductor inside the coil can influence the measurement [
26,
29]; however, since the purpose of this project is to monitor the transformer load, this measurement variation is small. In the article [
30], a brief comparison between the Rogowski coil and the split CT is presented.
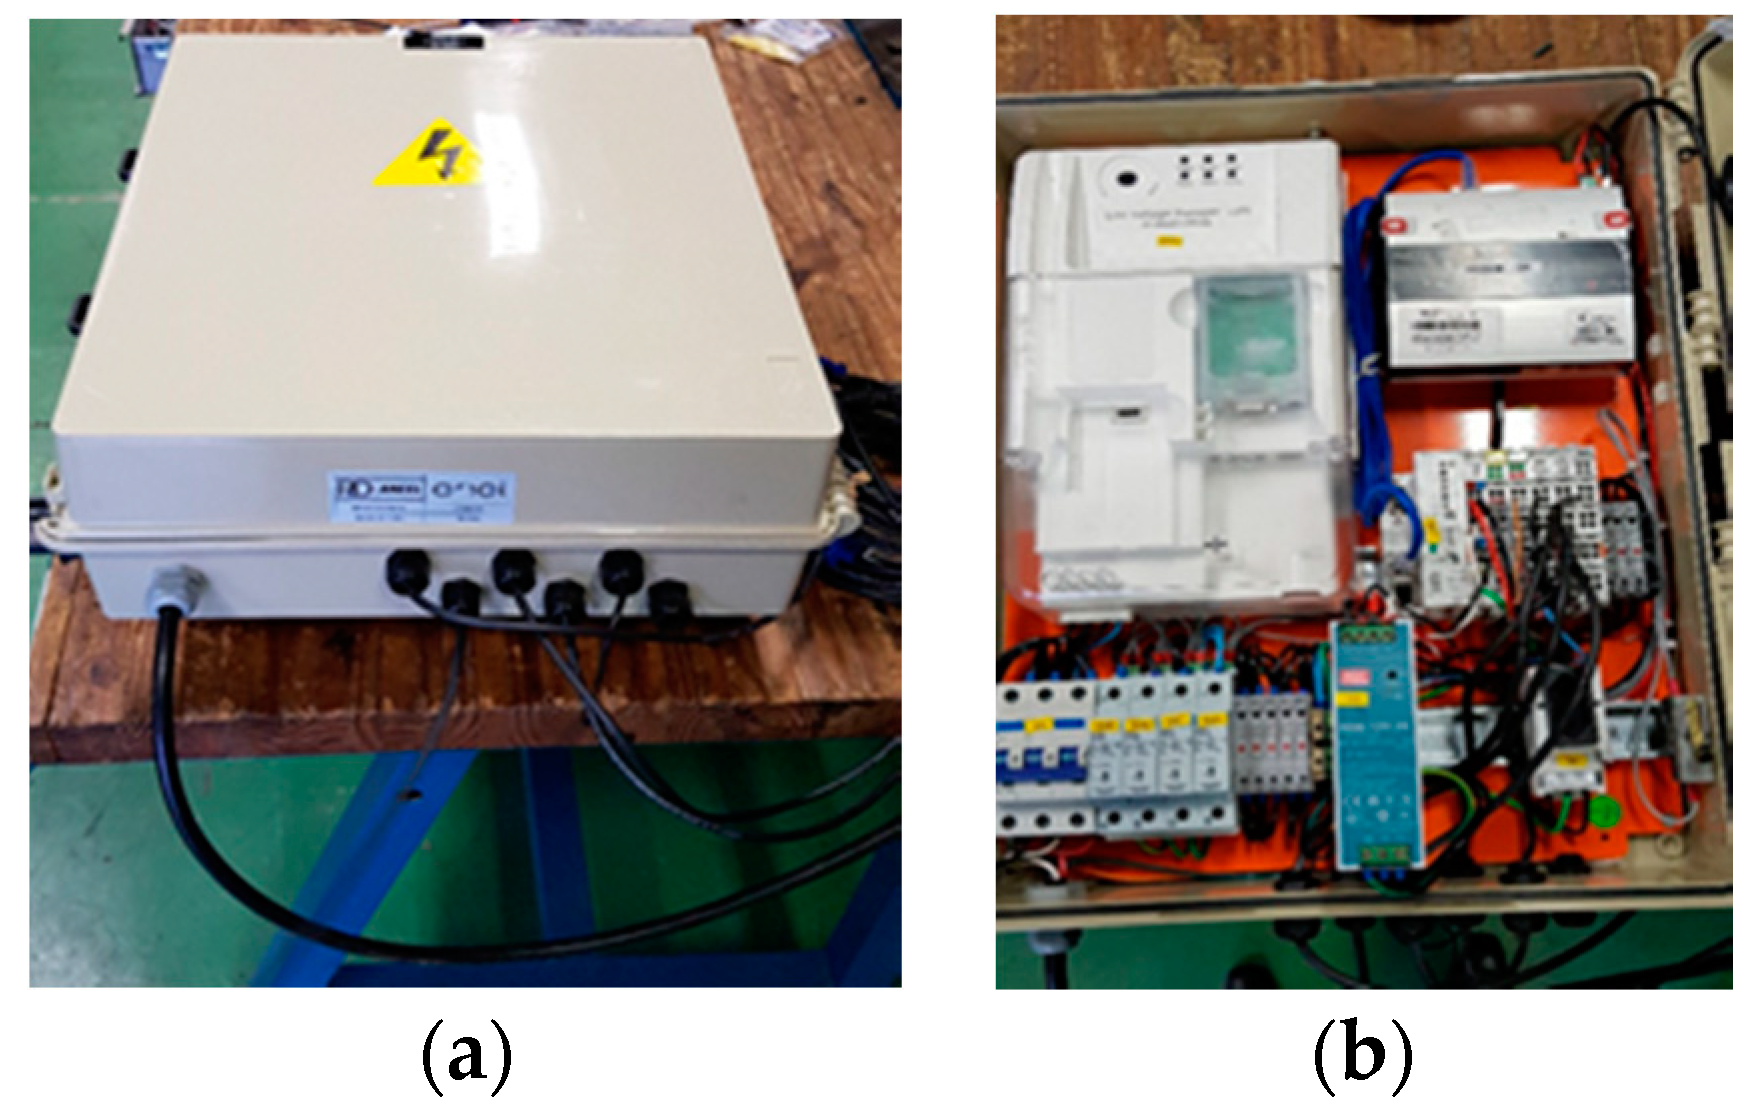
For the
Urban Futurability project, 40 equipment devices were installed to monitor the overhead distribution transformers. First, a solution prototype was developed (
Figure 4) with the production of 10 units to analyze the applicability of the transformer monitoring solution and the possible improvements to be applied in the following solutions. This development generated the study in [
9], which presented the solution and results of the application. For the current measurement, Rogowski coils were used.
Concerning the tests carried out with the developed prototype, PoCs started with suppliers. All suppliers delivered their ready-made solutions, with the equipment parameterized according to the pre-specified requirements and necessary modifications for installation in the field. ENEL SP only received the equipment and performed communication tests to verify that all were working correctly.
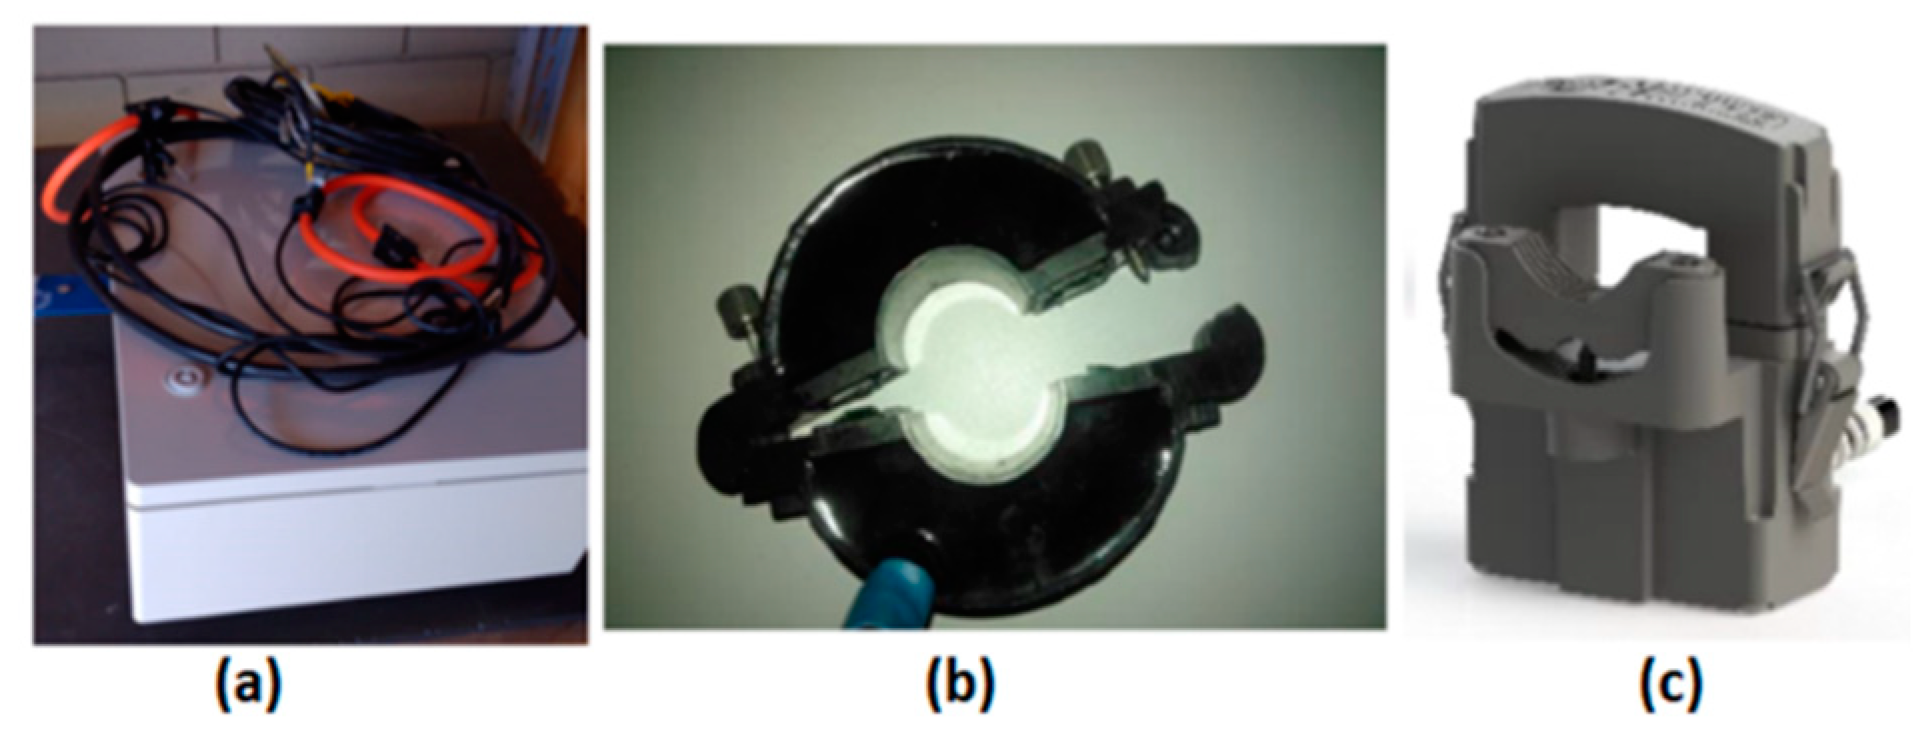
Each supplier produced 10 units to be installed within the project. One of the suppliers followed the line of the developed prototype and produced a solution that uses the Rogowski coil for the measurement of the current (
Figure 5a). Another supplier used CTs with a split core (
Figure 5b) and finally another supplier presented a solution with CTs with a split core that, in addition to measuring the current, had a piercing connector (
Figure 5c), thus it measured the voltage phase-neutral at the point using only one sensor to collect the two quantities.
Regarding the monitoring of the transformer, the voltage measurement was carried out through the derivation of the power cables that supplied the panel to ensure that the RTU directly collected the voltage information from the derivation. The only supplier that did not use this method for voltage measurement was the vendor in
Figure 5c, as their CT already performed the phase-neutral voltage measurement at the point where it is measuring current. The voltage measurement methods did not show differences in measurements as they monitored the same branch and hence the same voltage level.
2.4. Data Platform
For the PoC’s, suppliers were allowed to use their own platforms to view the data and alarms generated by the equipment in the field. The equipment calculates the hot-spot temperature, loss of life, and energy, as well as the active, reactive, and apparent power of the transformer. Moving averages of this data, as well as measurements collected directly from the sensors, were updated on the platform every 10 min. The alarms were generated immediately after the occurrence.
For the visualization of the data generated by the developed prototype, the ENEL SP technical team developed a dashboard to facilitate the visualization of the data and graphs of the quantities and alarms of the transformer monitoring solution. The platform was also used to receive data from the supplier’s solution that used CT with a split core and performed a voltage measurement, as it did not have its own platform. This dashboard developed was temporary, used only for that first PoC moment, and in the future it will be integrated into the legacy systems of ENEL SP. The direct communication channel between each transforming station and the Universal Virtual Data Lake (UVDL) is through LTE communication using the MQTT protocol. The modem used in the communication used two SIM cards, providing redundancy in the communication.
Finally, the vendor platform, as the one developed by ENEL SP, in addition to the data and alarms, also featured a map with the location of the equipment to facilitate the location of the possible source of the defect in the distribution grid in case of failures.
4. Results
With the end of the installations of the 40 units of the distribution transformer monitoring equipment, the assisted monitoring process began collecting the data obtained in the field and analyzing them. In comparison with conventional AMI (advanced metering infrastructure) equipment, the equipment described in this article seeks to monitor and report data from the distribution transformer, checking if it is operating within its temperature, voltage, and current limits, and focusing on solving specific problems of monitoring distribution transformers, which have many occurrences. AMI equipment is customer-focused, seeking to manage and inform consumption data. The region that received the solution does not have AMI, thus the solution developed is cheaper than installing AMI equipment and solves the monitoring problem in the region.
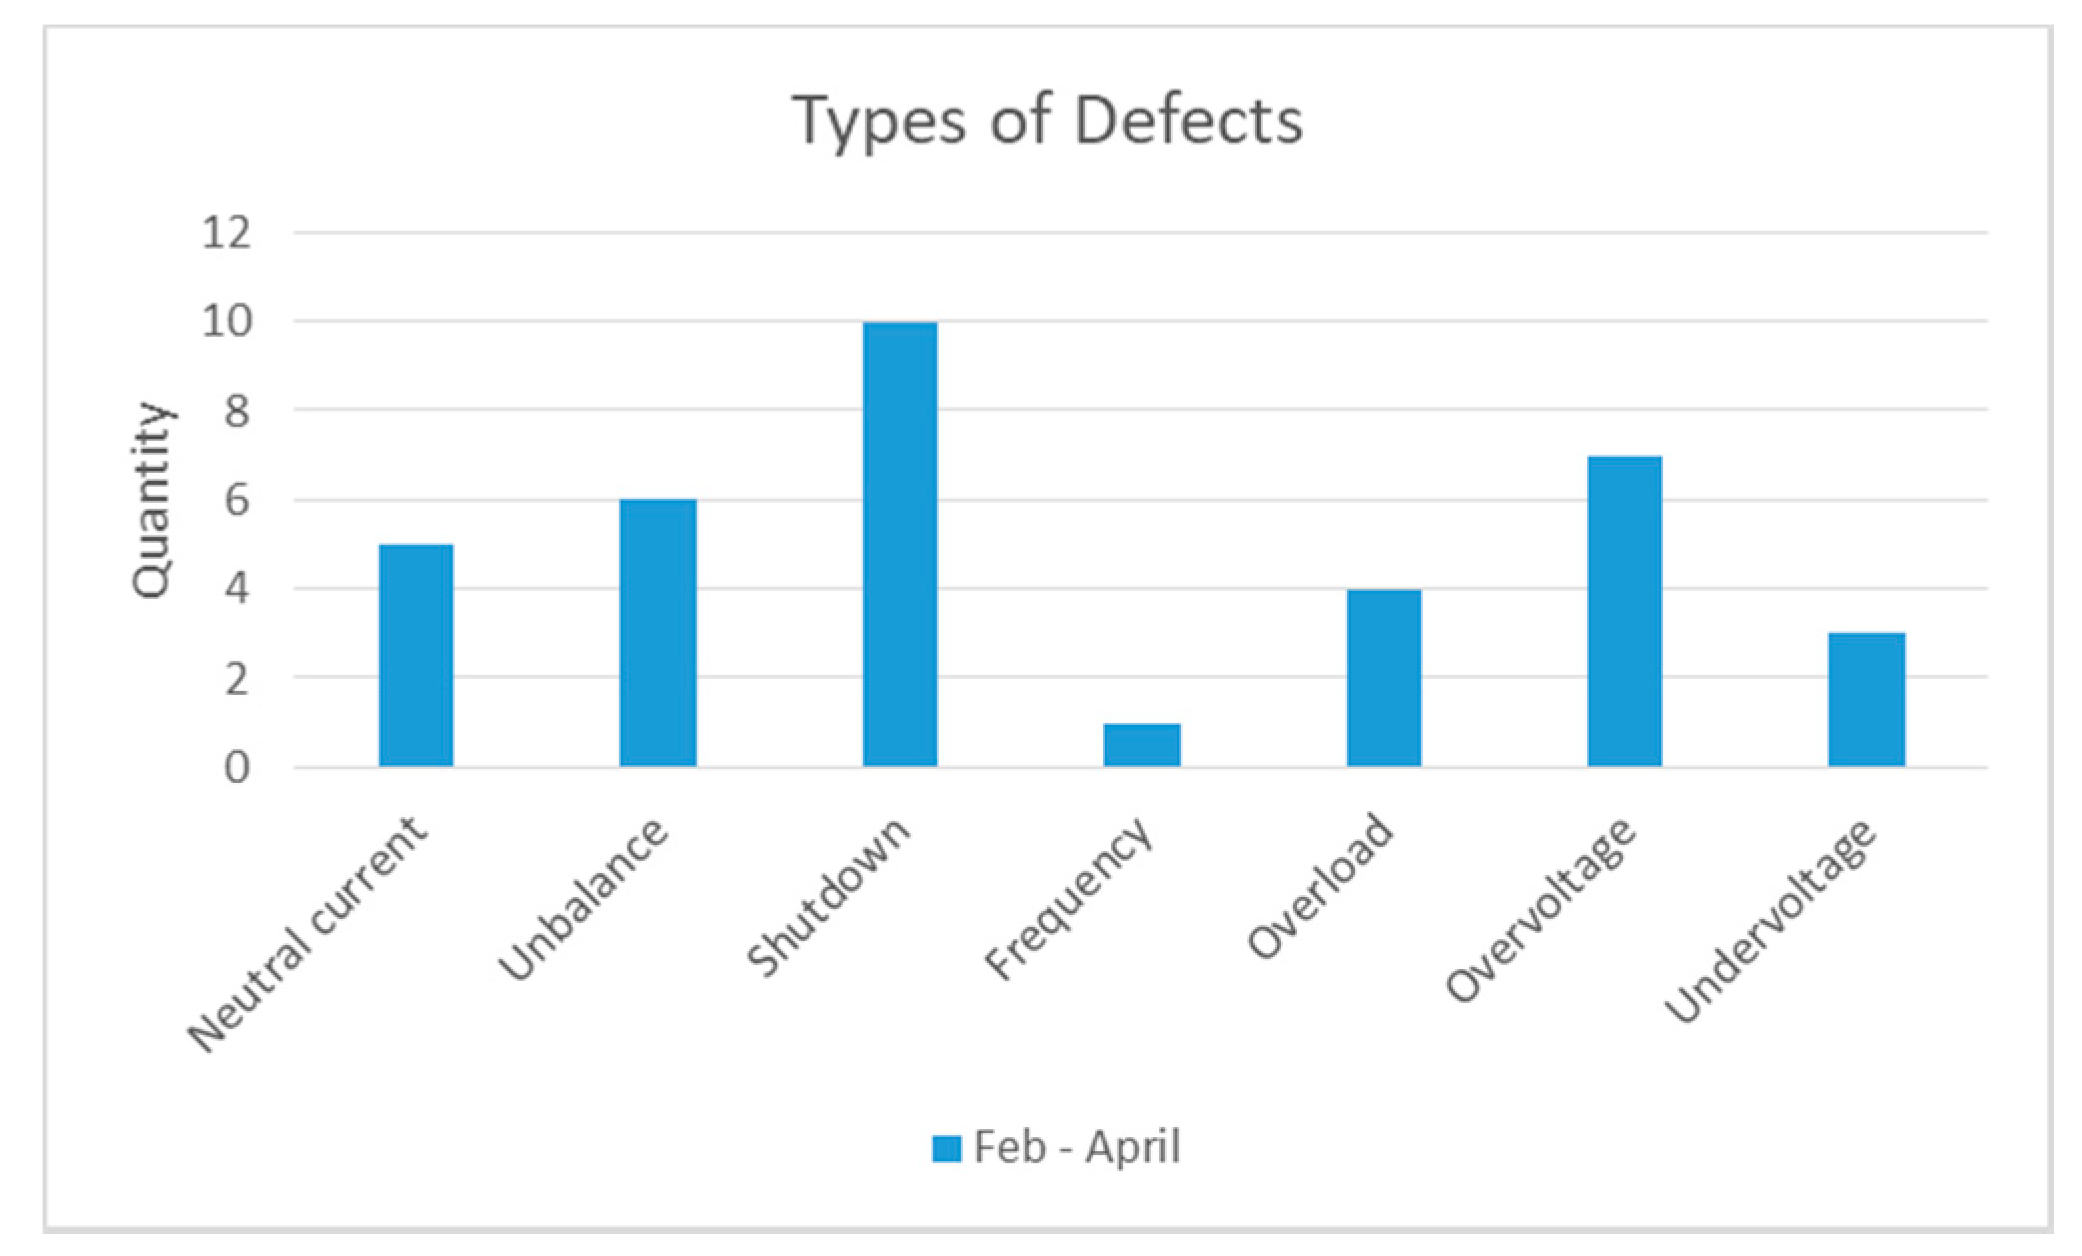
This activity was conducted from February to April 2021, during which the types of defects found, the number of each defect, and the number of defects recorded in the month were collected.
The graph shown in
Figure 10 shows the types of defects reported by the distribution transformer monitoring equipment and the occurrences of each defect over the months of monitoring.
The defects were sent to the Network Analysis area of ENEL SP, along with the data obtained in the field. Suggestions for the solution of the defects were also presented. In the case of under and over-voltage, adjust the transformer tap; in cases of overload, change the transformer for a higher power. In terms of load imbalances between the phases, it was recommended to distribute more load to the phases with less load. In relation to shutdowns, frequency, and high neutral-current, the data were passed on to a more accurate study by the Network Analysis area.
For the detection of these defects, the equipment was configured with the limits determined by the power of the distribution transformer and by the norms that the utility has to follow in the country. In the case of voltage, current, imbalance, and frequency, if it exceeds the determined limit, it will indicate the defect. In the case of a shutdown, the period and duration of the shutdown are informed to the platform and such defects are registered.
With the identification of the above-mentioned defects, the correction process had started.
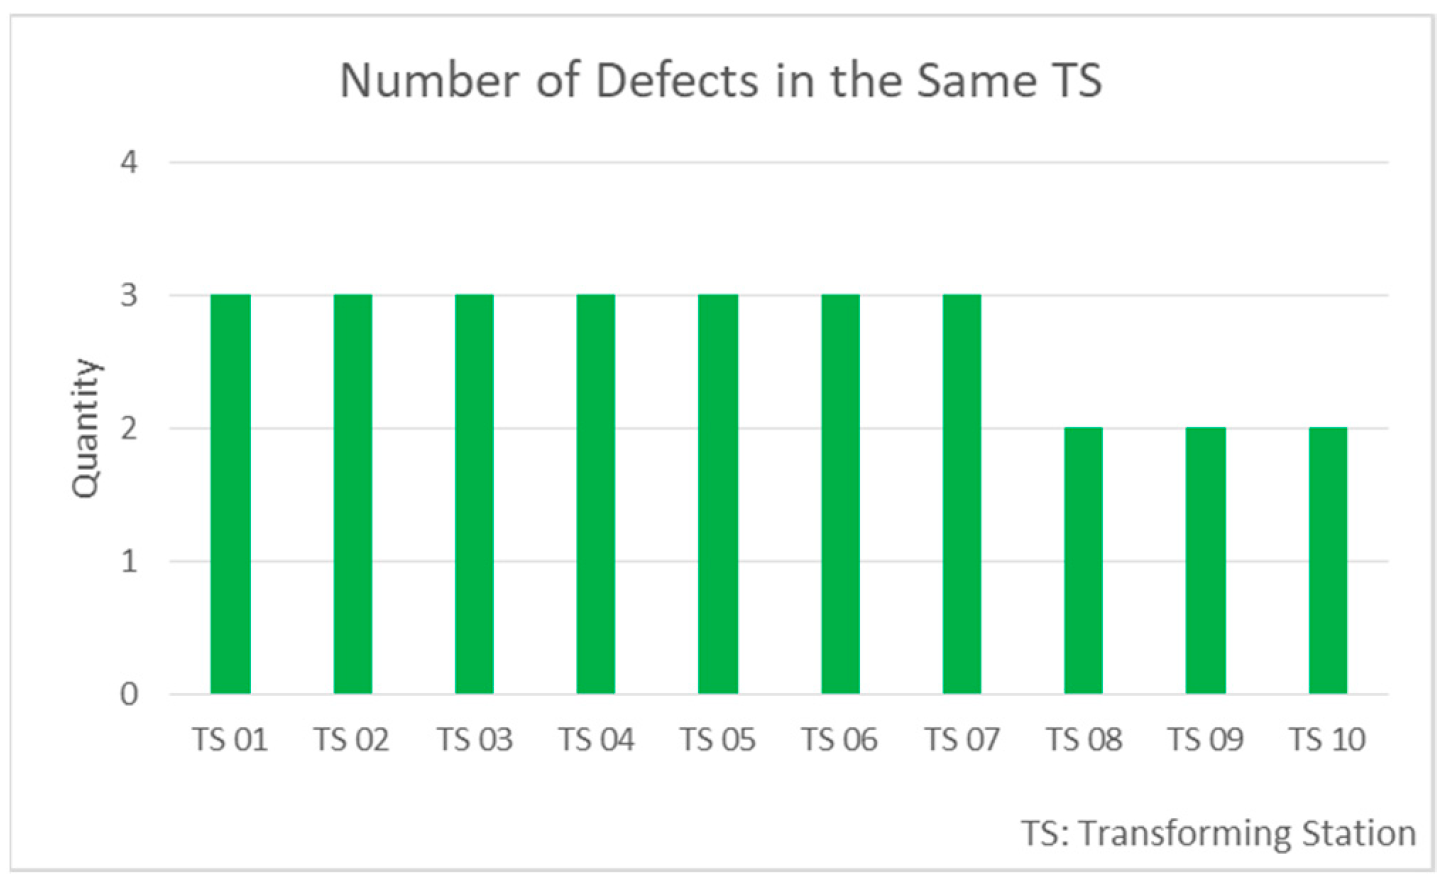
Figure 11 shows some of the transformer stations (TS), namely the place where the distribution transformer was installed, that were requested priority in the maintenance process considering they presented at least more than one defect in the distribution transformer.
Regarding the performance of the different technologies in the field, technically, the three solutions presented the expected performance, indicating the values of the measurements in the field and indicating alarms when a defect was found in the transformer, as shown above. Regarding the technologies, only a few constructive warnings of the equipment were made.
In the case of the solution supplier with the split-core CT, the company will have to adapt the equipment to support up to four CTs to meet the needs of the closed delta transformer. Regarding the size of the panel, both the solution with the split-core CT and the Rogowski coil presented solutions that in some points of the distribution grid presented difficulties in the installation due to a large number of telecommunication cables present in the support post. Additionally, concerning the CT model, in the installation of these first 10 units, transformers were used that had only one cable per phase in the secondary; however, in transformers of greater power, two to three cables were used per phase. In such cases, the CT would be required to have a larger diameter to measure all the cables at once, requiring a sensor both with a larger dimension and greater weight.
This same point concerning the CT will have to be evaluated by the solution provider with the technology of the CT that performs the voltage measurement through the piercing connector. An advantage for this solution was the practicality in the installation, as it demanded less time to install and proved to be very compact.
Finally, the solution provider that used the Rogowski coil initially had difficulties in fixing the equipment cabinet (the place where the RTU, modem, and other equipment is installed for the solution to function) on the transformer support post. As an advantage, the Rogowski coil is light and serves the cases of transformers that in the secondary output require more than one cable per phase.
5. Conclusions
The expansion of the installation of the monitoring of distribution transformers provides customers with a safer electricity distribution grid with fewer interruptions in their supply. As shown in
Section 4, we can see that the utility now has a more transparent view of the operation of one of the most important equipment devices in the distribution grid, with defects being reported concerning that the utility was not able to be detected online.
From the perspective of the utility, the use of the monitoring equipment seeks to assist in the reduction of the SAIFI (System Average Interruption Frequency Index) and SAIDI (System Average Interruption Duration Index). In the case of SAIFI with the replacement of transformers in a planned manner, it prevents them from stopping due to some defect. In the case of SAIDI, as all monitoring equipment devices have their location on the map, the resolution of the problem is a much quicker process, which reduces the unproductive dispatch of the field team in those situations. Unproductive displacements include the locomotion of the field team to locate the defect in the electricity distribution grid; when the customer reports a lack of electricity being sent to the utility, the field team travels in their vehicle along the path of the faulty electrical circuit to locate the fault. Other compensations paid for exceeding the CAIDI (Customer Average Interruption Duration Index), CAIFI (Customer Average Interruption Frequency Index) and MDCI (Maximum Duration of Continuous Interruption per consumer unit) limits tend to decrease as well. Another relevant point concerns the non-technical losses. With the monitoring system, it is possible to visualize the energy that was actually supplied by the transformer and compare it with the values of the meters, detecting possible thefts of energy in the place.
The overhead distribution transformer monitoring solutions applied in the Urban Futurability project have the capacity to be installed in utilities around the world, in the most diverse overhead distribution grids, as they are highly customizable for each peculiarity of each region. These solutions provide the monitoring of overhead distribution transformers, informing the operating conditions and generating data on the quantities of the low-voltage side of the distribution grid to ensure that the utility can provide a better electricity distribution service for the population. The information provided by the solution tends to be scarce or non-existent in countries in which the idea of a smart grid is not yet widespread and applied.
In the near future, the information provided by the distribution transformer monitoring equipment will be used as input data for the predictive maintenance system under development by ENEL SP [
32].
With the positive results presented by the equipment, ENEL SP plans to install more units throughout the year of 2021 to monitor more transformers in its concession area and to expand the solution for monitoring transformers in the underground distribution grid. For the case of underground transformers, the necessary adaptations in the equipment are currently being studied considering that they are transformers of greater power and are stored in more hazardous places, which are subject to floods and higher operating temperatures.


 ,
, 


