
Home-Microgrid Energy Management Strategy Considering EV’s Participation in DR


Abstract
:1. Introduction
- Simulation implementation of optimum energy management based on dynamic pricing in an H-MG by considering uncertainty.
- Providing a comprehensive algorithm based on the participation of a mobility EV in order to improve the capability of DR.
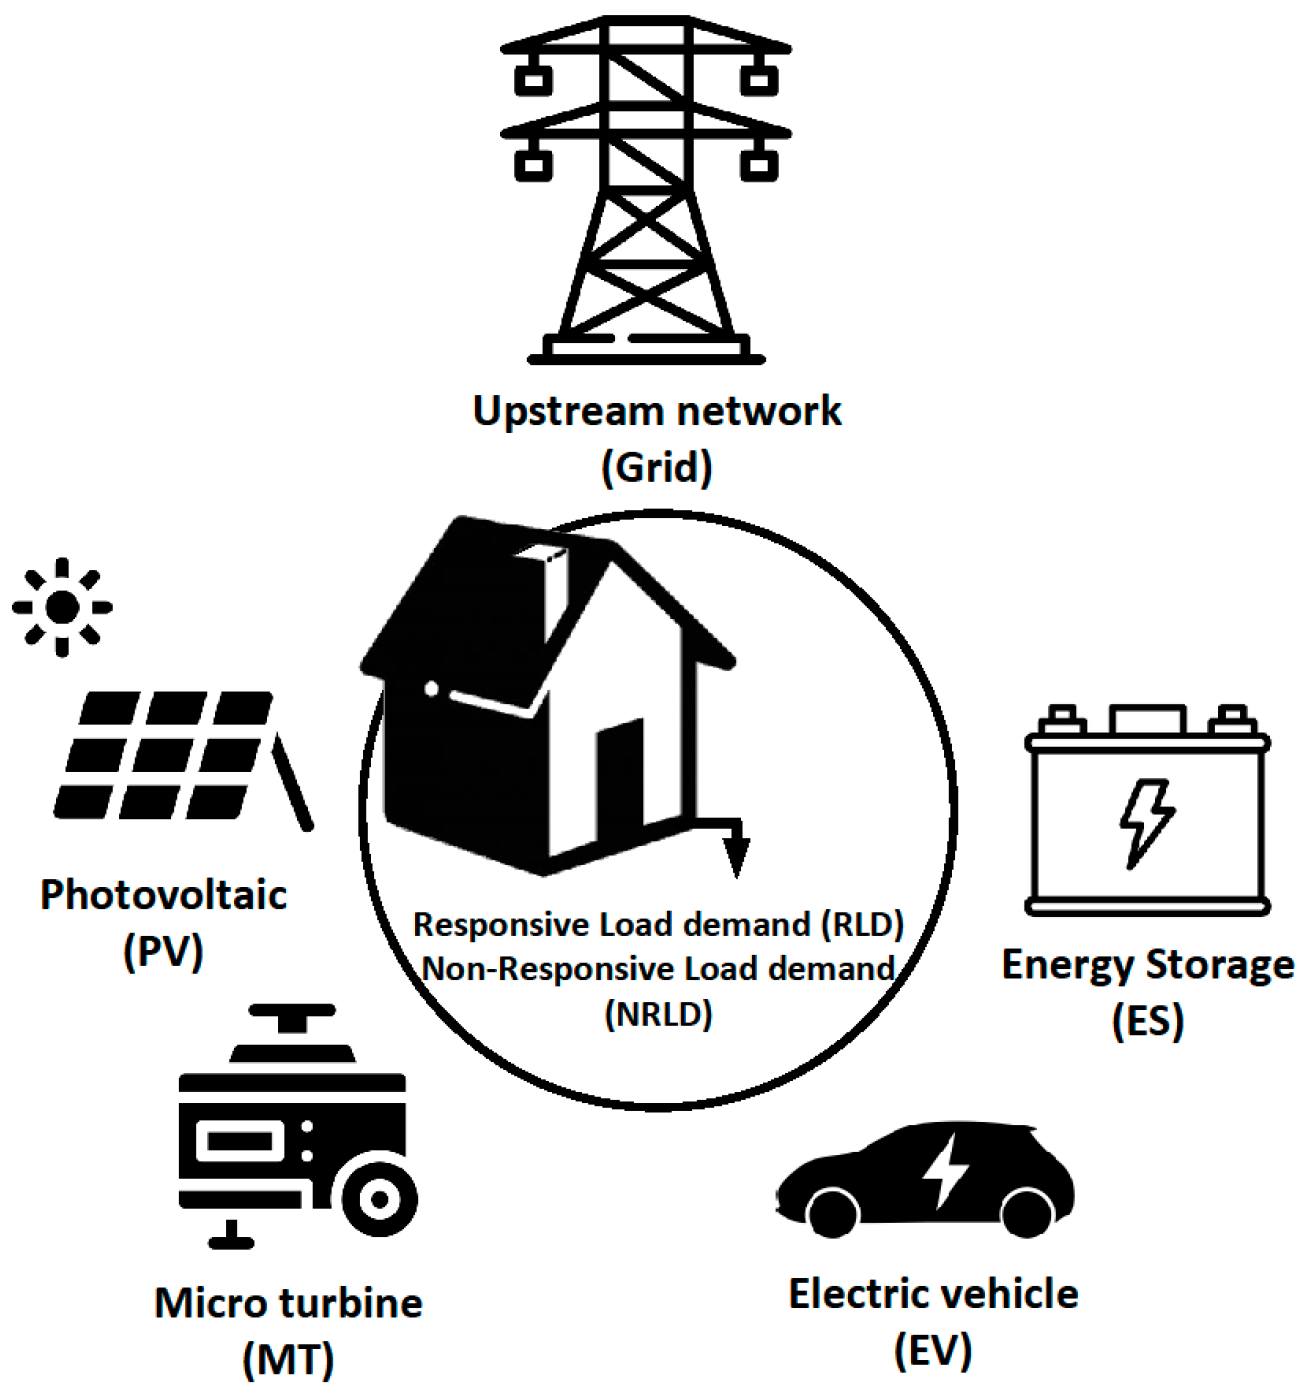
2. Electric Vehicle (EV) in Home-Microgrids (H-MGs)
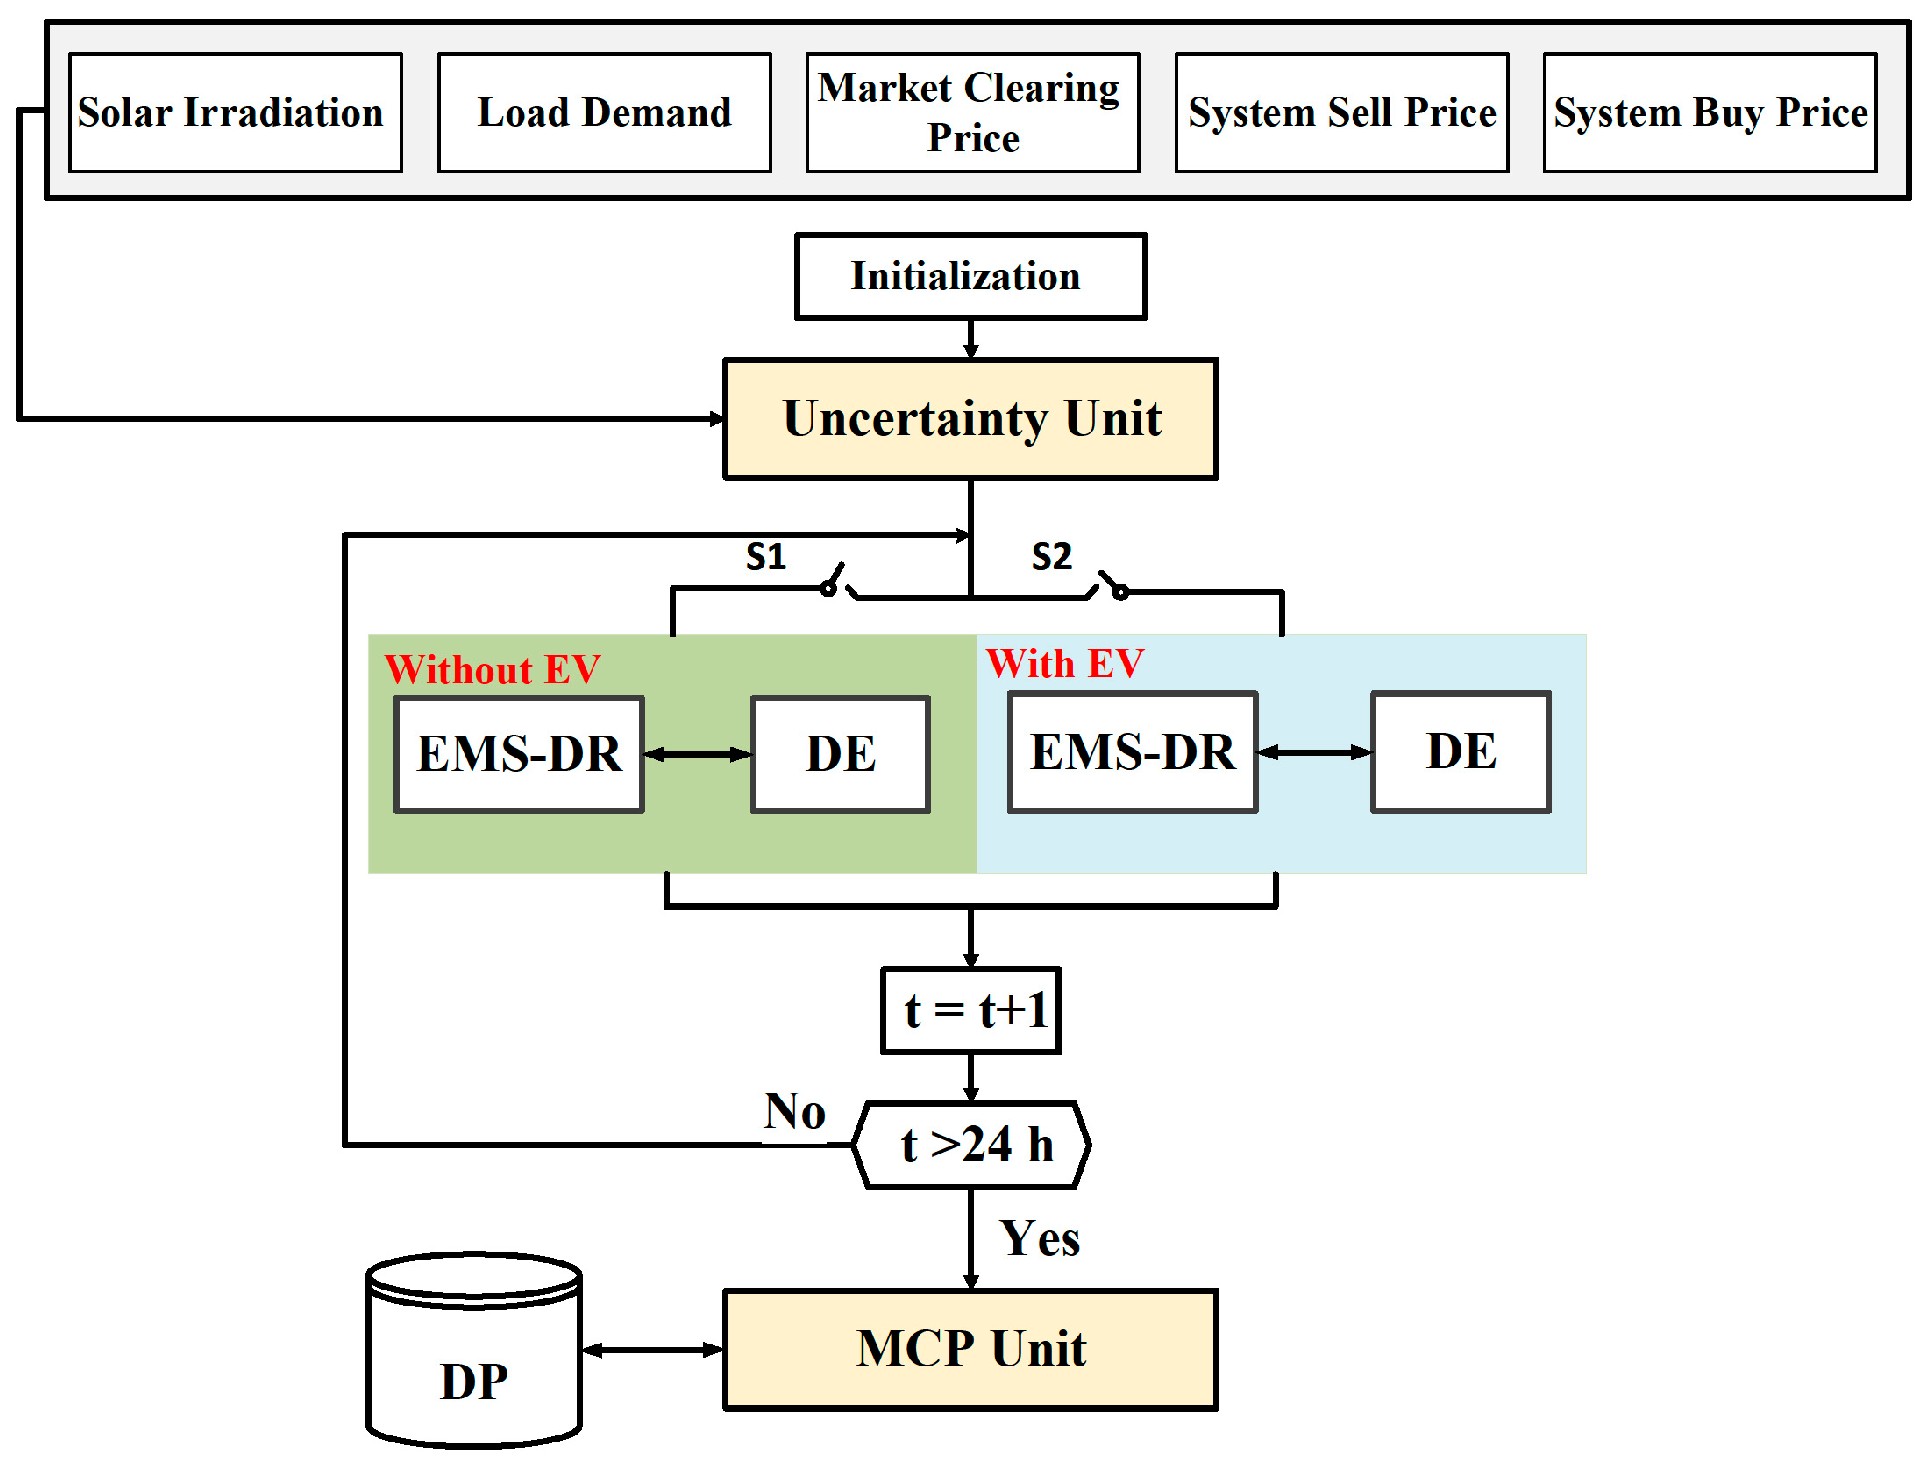
3. An Overview of the Proposed Energy Management System (EMS)
4. Methodology
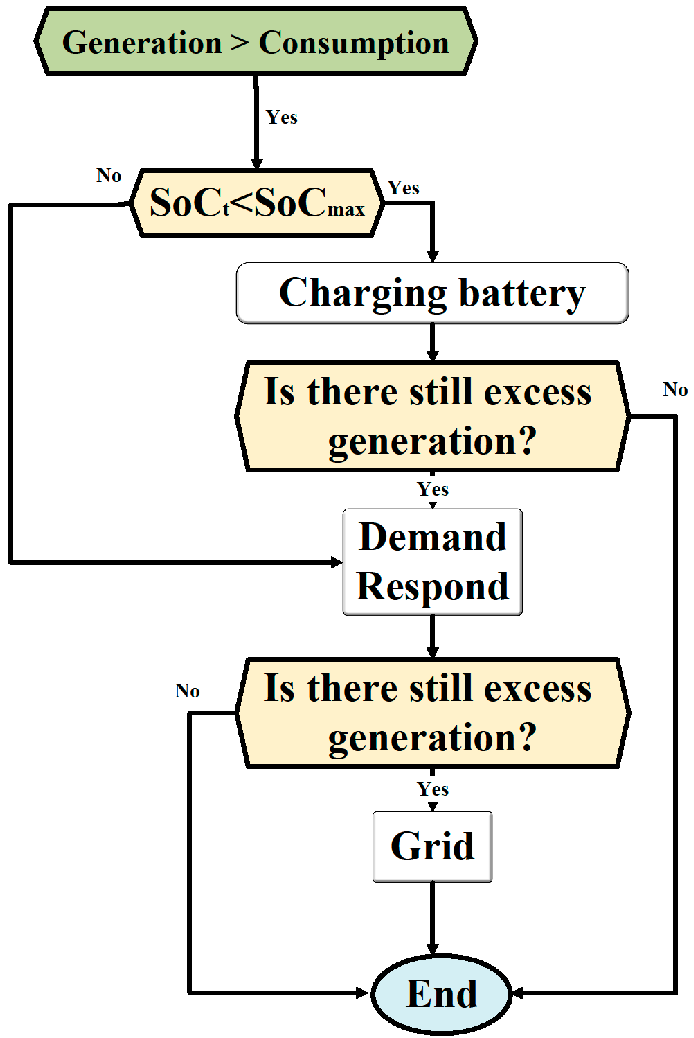
- (a)
- Excess generation:
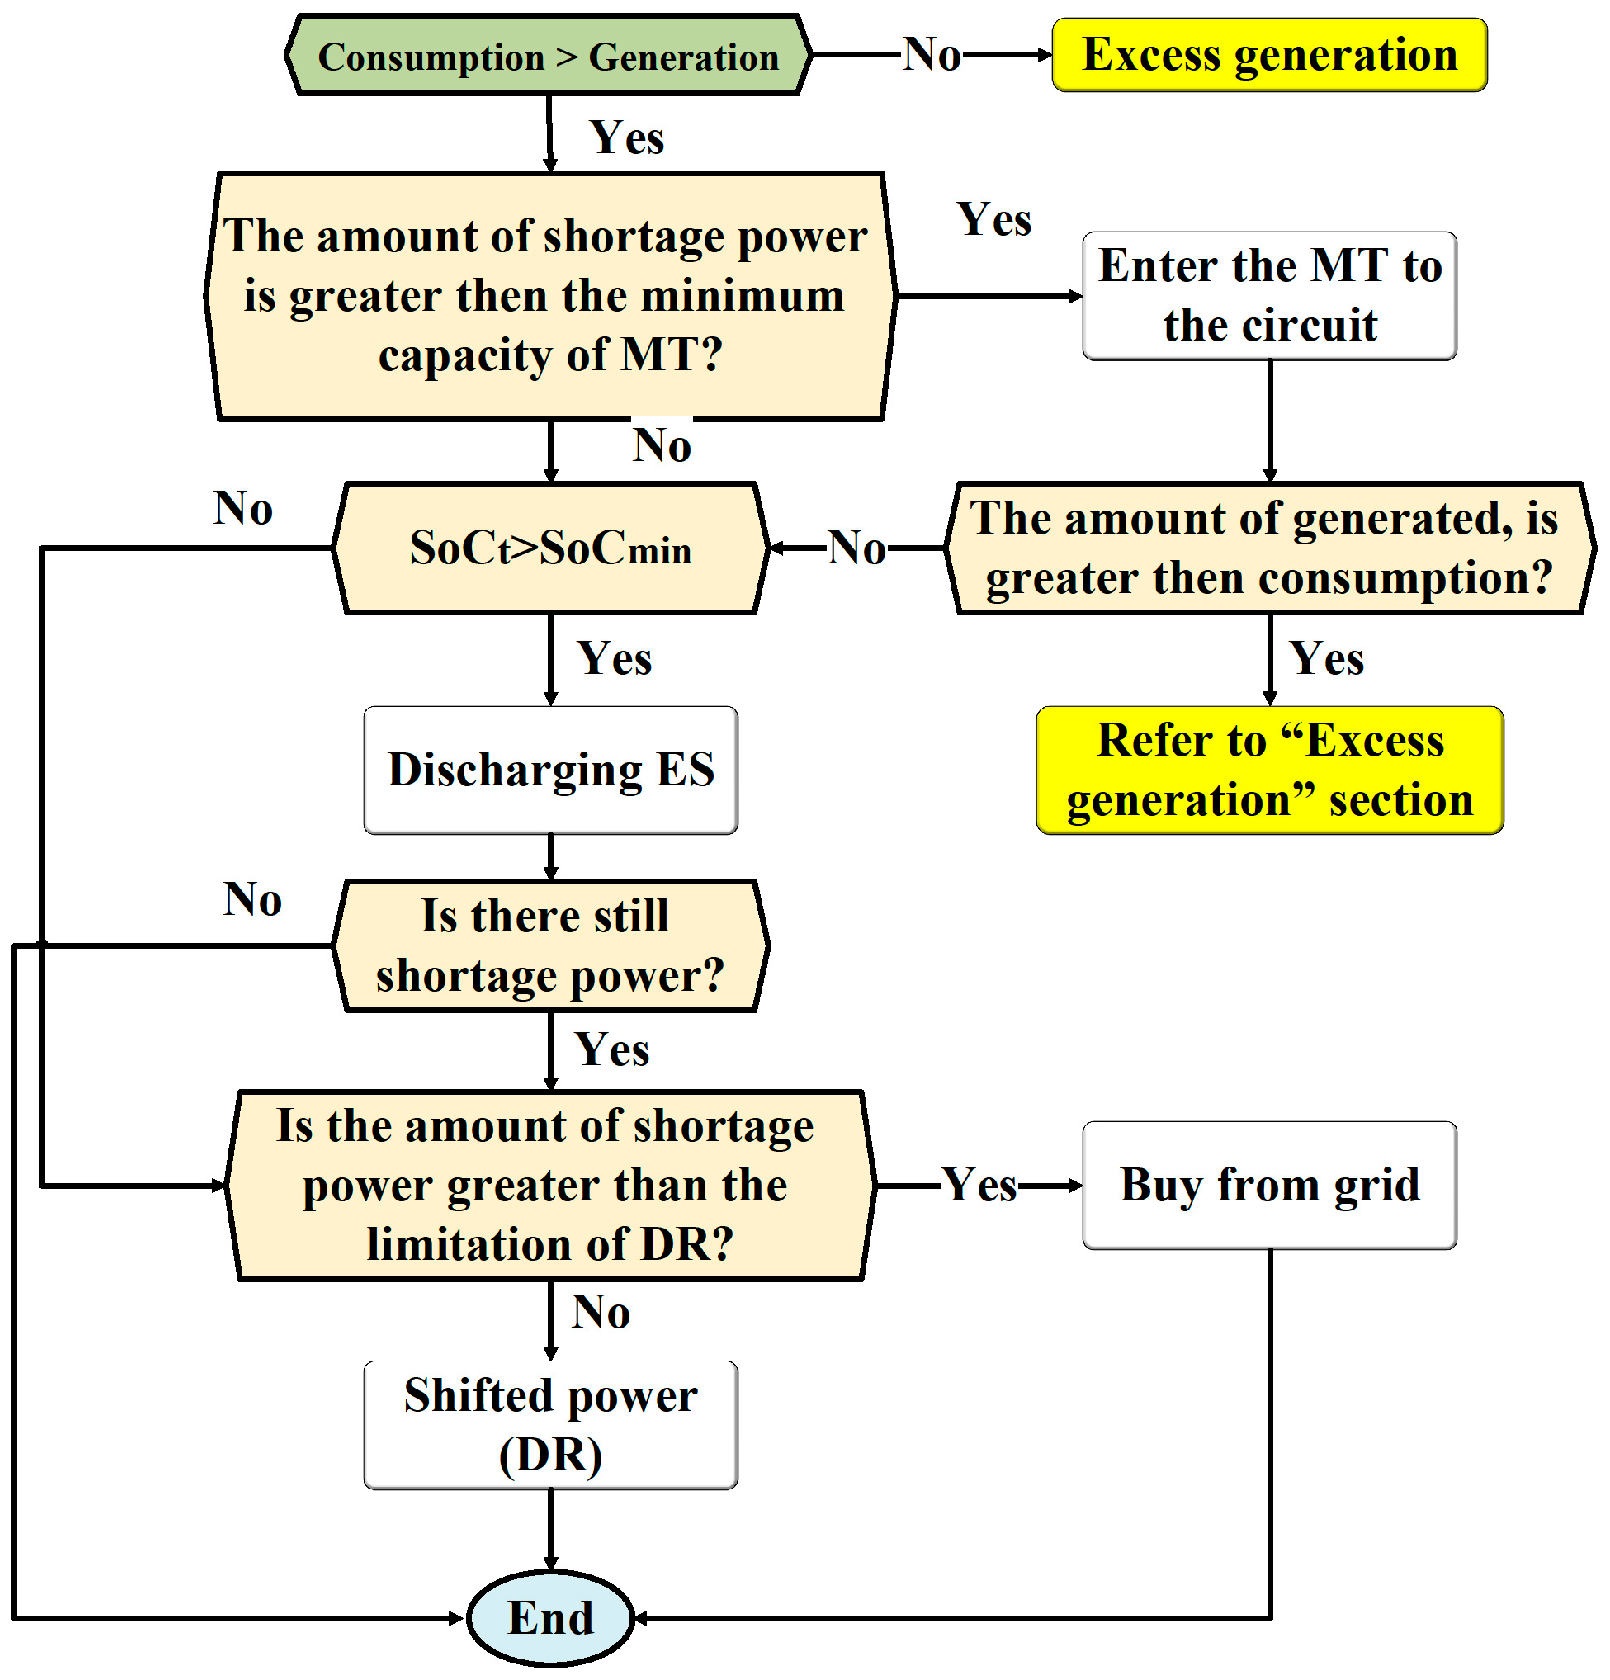
- (b)
- Power shortage less than the minimum capacity of micro turbine (MT):
- (c)
- Power shortage within the micro turbine (MT) capacity:
5. Problem Formulation
6. Simulation Results
7. Conclusions
Author Contributions
Funding
Institutional Review Board Statement
Informed Consent Statement
Data Availability Statement
Conflicts of Interest
Nomenclature/Acronyms
| DE | Differential evolution |
| DP | Dynamic pricing |
| DR+/− | Amount of responsive load demand that goes/comes to/from other time period |
| EMS | Energy management system |
| EMS-DR | Energy management system based on demand response |
| ES | Energy storage |
| EV | Electric vehicle |
| EWH | Electric water heater |
| H-MG | Home microgrid |
| MILP | Mixed-integer linear programming |
| MPC | Market clearing price |
| MT | Micro turbine |
| PV | Photovoltaic |
| RLD | Responsive load demand |
| NRLD | Non-responsive load demand |
| SG | Smart grid |
| SoC | State of charge |
| SSP | System sell price |
| SBP | System buy price |
| TOAT | Taguchi orthogonal array test |
| ZEV | Zero-emission vehicl |
References
- Swain, A.; Salkuti, S.; Swain, K. An Optimized and Decentralized Energy Provision System for Smart Cities. Energies 2021, 14, 1451. [Google Scholar] [CrossRef]
- Fouladfar, M.H.; Al Sumaiti, A.; Fenik, M.S.; Marzband, M.; Busawon, K.; Pouresmaeil, E. Energy Management of a Single Grid-Connected Home Microgrid for Determining Optimal Supply/Demand Bids. In Proceedings of the 2018 5th International Symposium on Environment-Friendly Energies and Applications (EFEA), Rome, Italy, 24–26 September 2018; pp. 1–8. Available online: https://core.ac.uk/download/pdf/196578498.pdf (accessed on 27 July 2021).
- Marzband, M.; Sumper, A.; Domínguez-García, J.L.; Gumara-Ferret, R. Experimental validation of a real time energy management system for microgrids in islanded mode using a local day-ahead electricity market and MINLP. Energy Convers. Manag. 2013, 76, 314–322. [Google Scholar] [CrossRef]
- Jiang, B.; Fei, Y. Smart Home in Smart Microgrid: A Cost-Effective Energy Ecosystem With Intelligent Hierarchical Agents. IEEE Trans. Smart Grid 2014, 6, 3–13. [Google Scholar] [CrossRef]
- Gitizadeh, M.; Farhadi, S.; Safarloo, S. Multi-objective energy management of CHP-based microgrid considering demand response programs. Smart Grid Conf. 2014, 1–7. [Google Scholar] [CrossRef]
- Beder, C.; Blanke, J.; Klepal, M. Behaviour Demand Response in District Heating—A Simulation-Based Assessment of Potential Energy Savings. Proceedings 2019, 20, 2. [Google Scholar] [CrossRef] [Green Version]
- Marzband, M.; Fouladfar, M.H.; Akorede, M.; Lightbody, G.; Pouresmaeil, E. Framework for smart transactive energy in home-microgrids considering coalition formation and demand side management. Sustain. Cities Soc. 2018, 40, 136–154. [Google Scholar] [CrossRef]
- Deckmyn, C.; Van de Vyver, J.; Vandoorn, T.L.; Meersman, B.; Desmet, J.; Vandevelde, L. Day-ahead unit commitment model for microgrids. IET Gener. Transm. Distrib. 2017, 11, 1–9. [Google Scholar] [CrossRef]
- Ala-Kotila, P.; Vainio, T.; Heinonen, J. Demand Response in District Heating Market—Results of the Field Tests in Student Apartment Buildings. Smart Cities 2020, 3, 157–171. [Google Scholar] [CrossRef] [Green Version]
- Sweetnam, T.; Spataru, C.; Barrett, M.; Carter, E. Domestic demand-side response on district heating networks. Build. Res. Inf. 2018, 47, 330–343. [Google Scholar] [CrossRef] [Green Version]
- Chen, J.; Qi, B.; Rong, Z.; Peng, K.; Zhao, Y.; Zhang, X. Multi-energy coordinated microgrid scheduling with integrated demand response for flexibility improvement. Energy 2020, 217, 119387. [Google Scholar] [CrossRef]
- Tsao, Y.-C.; Thanh, V.-V.; Wu, Q. Sustainable microgrid design considering blockchain technology for real-time price-based demand response programs. Int. J. Electr. Power Energy Syst. 2020, 125, 106418. [Google Scholar] [CrossRef]
- Hussain, S.; Lee, K.-B.; Ahmed, M.A.; Hayes, B.; Kim, Y.-C. Two-stage fuzzy logic inference algorithm for maximizing the quality of performance under the operational constraints of power grid in electric vehicle parking lots. Energies 2020, 13, 4634. [Google Scholar] [CrossRef]
- Hussain, S.; Ahmed, M.A.; Lee, K.-B.; Kim, Y.-C. Fuzzy Logic Weight Based Charging Scheme for Optimal Distribution of Charging Power among Electric Vehicles in a Parking Lot. Energies 2020, 13, 3119. [Google Scholar] [CrossRef]
- Hussain, S.; Ahmed, M.A.; Kim, Y.-C. Efficient Power Management Algorithm Based on Fuzzy Logic Inference for Electric Vehicles Parking Lot. IEEE Access 2019, 7, 65467–65485. [Google Scholar] [CrossRef]
- Hafez, O.; Bhattacharya, K. Integrating EV Charging Stations as Smart Loads for Demand Response Provisions in Distribution Systems. IEEE Trans. Smart Grid 2016, 9, 1096–1106. [Google Scholar] [CrossRef]
- Ren, H.; Zhang, A.; Wang, F.; Yan, X.; Li, Y.; Duić, N.; Shafie-Khah, M.; Catalão, J.P. Optimal scheduling of an EV aggregator for demand response considering triple level benefits of three-parties. Int. J. Electr. Power Energy Syst. 2020, 125, 106447. [Google Scholar] [CrossRef]
- Ji, C.; Yang, Q.; Ning, N.; Liu, Y.; Lyu, L. Mitigating Downward Reserve Deficiency of Power System via Coordinating EV Demand Response at Valley Period. IEEE Access 2020, 8, 112368–112378. [Google Scholar] [CrossRef]
- Yuan, Y.; Jiao, L.; Zhu, K.; Zhang, L. Scheduling Online EV Charging Demand Response via V2V Auctions and Local Generation. IEEE Trans. Intell. Transp. Syst. 2021, 1–17. Available online: http://ix.cs.uoregon.edu/~jiao/publications/tits21.pdf (accessed on 27 July 2021).
- Georgioudakis, M.; Plevris, V. A Comparative Study of Differential Evolution Variants in Constrained Structural Optimization. Front. Built Environ. 2020, 6, 1–14. [Google Scholar] [CrossRef]
- Tong, Z.; Cheng, Z.; Tong, S. A review on the development of compressed air energy storage in China: Technical and economic challenges to commercialization. Renew. Sustain. Energy Rev. 2020, 135, 110178. [Google Scholar] [CrossRef]
- Olabi, A.G.; Wilberforce, T.; Abdelkareem, M.A.; Ramadan, M. Critical Review of Flywheel Energy Storage System. Energies 2021, 14, 2159. [Google Scholar] [CrossRef]
- Jouhara, H.; Żabnieńska-Góra, A.; Khordehgah, N.; Ahmad, D.; Lipinski, T. Latent thermal energy storage technologies and applications: A review. Int. J. Thermofluids 2020, 5, 100039. [Google Scholar] [CrossRef]
- Gainulenko, A. Load Management Solutions for Electric Vehicle Chargers in a Software as a Service Platform. Available online: https://www.theseus.fi/handle/10024/498516 (accessed on 27 July 2021).
- Birkett, E. How a California-Style ZEV Mandate Can Deliver the Phase-Out of Petrol and Diesel Cars. Available online: https://policyexchange.org.uk/wp-content/uploads/Route-%E2%80%9835.pdf (accessed on 27 July 2021).
- Grandi, A. Impact Assessment of Electric Vehicles Incentives on EV Adoption and Road Traffic: The Cases of Norway and The Netherlands. Master’s Thesis, Norwegian School of Economics, Bergen, Norway, 2020. Available online: https://hdl.handle.net/11250/2736568 (accessed on 27 July 2021).
- Wood, E.W.; Rames, C.L.; Bedir, A.; Crisostomo, N.; Allen, J. California Plug-In Electric Vehicle Infrastructure Projections: 2017-2025-Future Infrastructure Needs for Reaching the State’s Zero Emission-Vehicle Deployment Goals; National Renewable Energy Lab. (NREL): Golden, CO, USA, 2018. [Google Scholar]
- Linhao, Y.; Ke, W.; Xu, C.; Tingcheng, H.; Mengying, L. Reliability evaluation of microgrid considering electric vehicles and demand response. In Proceedings of the 2018 International Conference on Power System Technology (POWERCON), Guangzhou, China, 24–26 October 2018; pp. 1668–1672. [Google Scholar]
- Chae, S.; Kim, G.; Choi, Y.-J.; Kim, E.-H. Design of Isolated Microgrid System Considering Controllable EV Charging Demand. Sustainability 2020, 12, 9746. [Google Scholar] [CrossRef]
- Salah, O.; Shamayleh, A.; Mukhopadhyay, S. Energy Management of a Multi-Source Power System. Algorithms 2021, 14, 206. [Google Scholar] [CrossRef]
- Chen, X.; Shi, M.; Zhou, J.; Chen, Y.; Zuo, W.; Wen, J.; He, H. Distributed Cooperative Control of Multiple Hybrid Energy Storage Systems in a DC Microgrid Using Consensus Protocol. IEEE Trans. Ind. Electron. 2019, 67, 1968–1979. [Google Scholar] [CrossRef]
- Li, Y.; Li, K. Incorporating demand response of electric vehicles in scheduling of isolated microgrids with renewables using a bi-level programming approach. IEEE Access 2019, 7, 116256–116266. [Google Scholar] [CrossRef]
- Aliasghari, P.; Mohammadi-Ivatloo, B.; Alipour, M.; Abapour, M.; Zare, K. Optimal scheduling of plug-in electric vehicles and renewable micro-grid in energy and reserve markets considering demand response program. J. Clean. Prod. 2018, 186, 293–303. [Google Scholar] [CrossRef]
- Raoofat, M.; Saad, M.; Lefebvre, S.; Asber, D.; Mehrjedri, H.; Lenoir, L. Wind power smoothing using demand response of electric vehicles. Int. J. Electr. Power Energy Syst. 2018, 99, 164–174. [Google Scholar] [CrossRef]
- Sheidaei, F.; Ahmarinejad, A. Multi-stage stochastic framework for energy management of virtual power plants considering electric vehicles and demand response programs. Int. J. Electr. Power Energy Syst. 2020, 120, 106047. [Google Scholar] [CrossRef]
- Sarrafan, K.; Sutanto, D.; Muttaqi, K.M.; Town, G. Accurate range estimation for an electric vehicle including changing environmental conditions and traction system efficiency. IET Electr. Syst. Transp. 2017, 7, 117–124. [Google Scholar] [CrossRef] [Green Version]
- Fouladfar, M.H.; Loni, A.; Tookanlou, M.B.; Marzband, M.; Godina, R.; Al-Sumaiti, A.; Pouresmaeil, E. The Impact of Demand Response Programs on Reducing the Emissions and Cost of A Neighborhood Home Microgrid. Appl. Sci. 2019, 9, 2097. [Google Scholar] [CrossRef] [Green Version]
- Storn, R.; Price, K. Differential Evolution—A Simple and Efficient Heuristic for global Optimization over Continuous Spaces. J. Glob. Optim. 1997, 11, 341–359. [Google Scholar] [CrossRef]


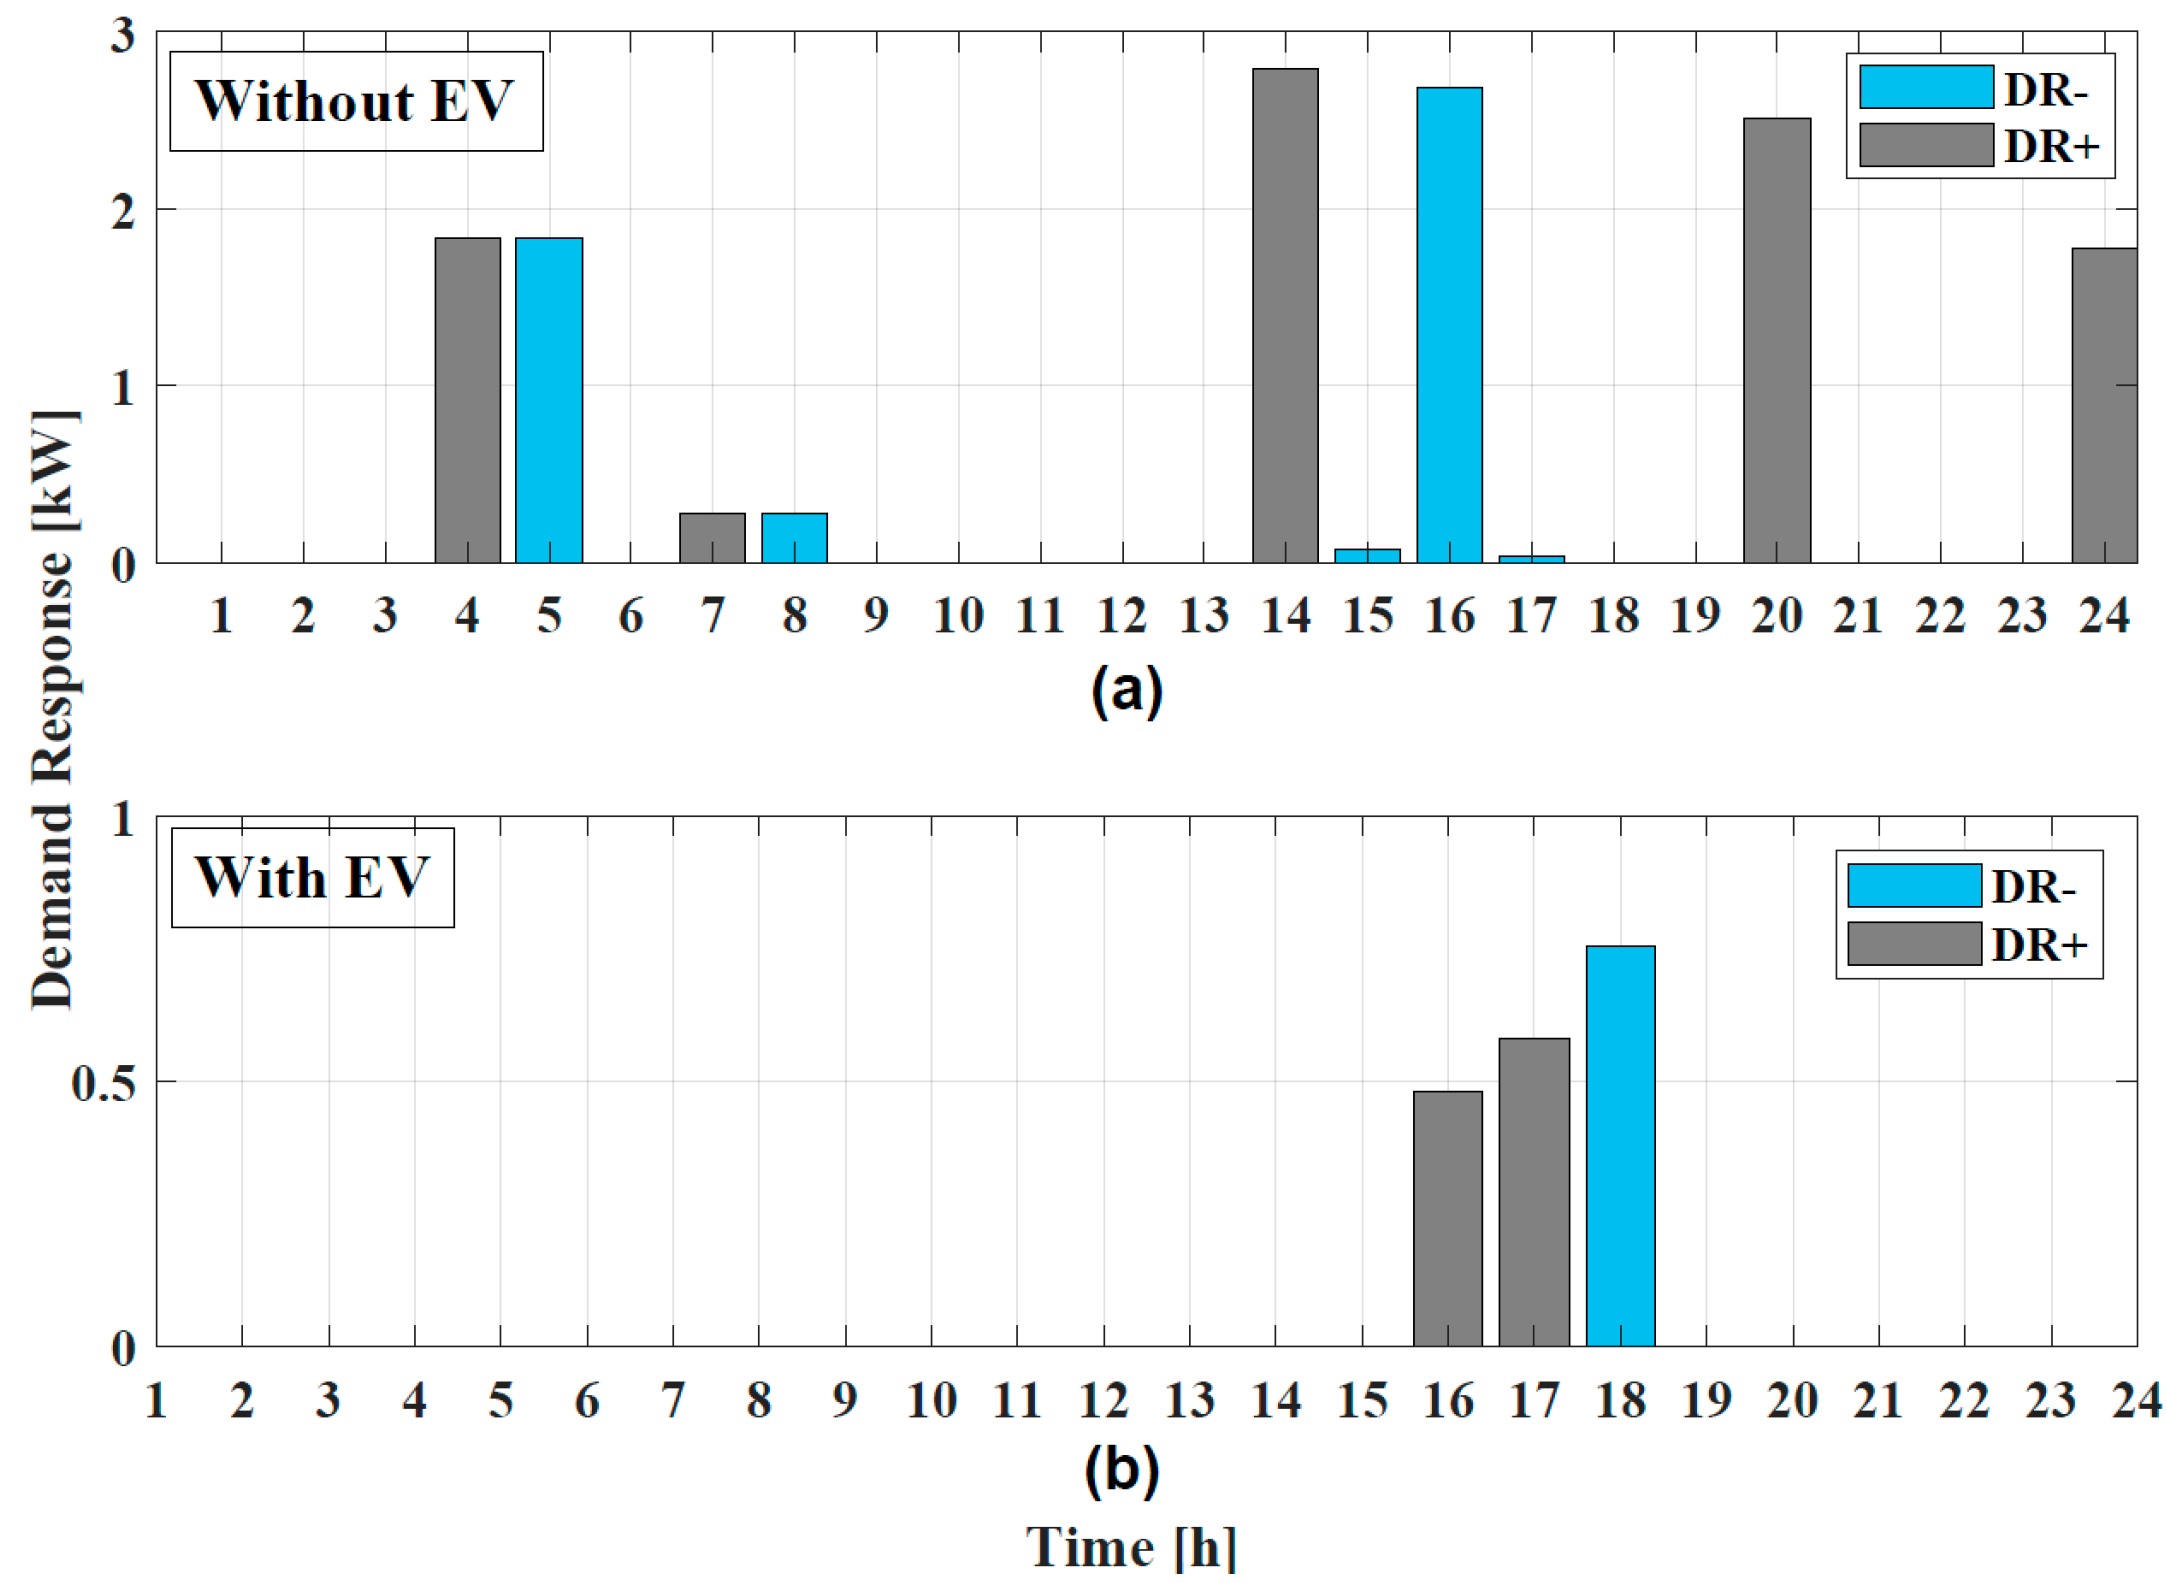
| DR+ (kW) | DR− (kW) | Responsiveness Percentage | |
|---|---|---|---|
| Without EV | 4.9 | 9.2 | −87% |
| With EV | 0.8 | 1.1 | −41% |
Publisher’s Note: MDPI stays neutral with regard to jurisdictional claims in published maps and institutional affiliations. |
© 2021 by the authors. Licensee MDPI, Basel, Switzerland. This article is an open access article distributed under the terms and conditions of the Creative Commons Attribution (CC BY) license (https://creativecommons.org/licenses/by/4.0/).
Share and Cite
Fouladfar, M.H.; Saeed, N.; Marzband, M.; Franchini, G. Home-Microgrid Energy Management Strategy Considering EV’s Participation in DR. Energies 2021, 14, 5971. https://doi.org/10.3390/en14185971
Fouladfar MH, Saeed N, Marzband M, Franchini G. Home-Microgrid Energy Management Strategy Considering EV’s Participation in DR. Energies. 2021; 14(18):5971. https://doi.org/10.3390/en14185971
Chicago/Turabian StyleFouladfar, Mohammad Hossein, Nagham Saeed, Mousa Marzband, and Giuseppe Franchini. 2021. "Home-Microgrid Energy Management Strategy Considering EV’s Participation in DR" Energies 14, no. 18: 5971. https://doi.org/10.3390/en14185971