Article

The Reporting of Sustainable Energy Action Plans of Municipalities: Methodology and Results of Case Studies from the Abruzzo Region

1
Department of Industrial and Information Engineering and Economics, University of L’Aquila, 67100 L’Aquila, Italy
2
Regione Abruzzo—Servizio Politica Energetica e Risorse del Territorio (DPC025), 65100 Pescara, Italy
*
Author to whom correspondence should be addressed.
Energies 2021, 14(18), 5932; https://doi.org/10.3390/en14185932
Submission received: 4 August 2021 / Revised: 8 September 2021 / Accepted: 15 September 2021 / Published: 18 September 2021
(This article belongs to the Special Issue Advances in CO2 Mitigation in Energy and the Environment)

Abstract

:
Territorial energetic and environmental planning provides operational solidity to the concept of sustainable development, in particular in energy-related issues, where recent attention to and social awareness of climate change are driving actions and policies at local and international levels. The goals of the United Nations Agenda 2030 can be reached through the strategy of glocalization, giving more responsibility to local administrations like municipalities. In this work, a scientific methodology is developed and validated to revise Sustainable Energy Action Plans (SEAP) and the monitoring phase of municipalities. The methodology starts from measured data in the territory considered and makes use of specific statistical models in order to estimate the needed data. The methodology considers the energy consumption of the main sectors: residential, transportation, tertiary, and commercial, with a particular focus on municipal competences (public lighting, urban transport, municipal fleet, etc.). Renewable energy is also considered due to its importance in local energy production. In order to go deeper into SEAPs, in this paper, the authors describe the quantitative analysis of the Baseline Emission Inventory, the quantification of the SEAP planning actions, and the definition of the Monitoring Emission Inventory, which is the final step of the planning process. This step was done for nine municipalities of the Abruzzo region with different characteristics (size, population, climate, geographical position, economy, etc.) in order to widen the results of the analysis and test the robustness of the methodology. Indeed, it gave a quantitative dimension to the primary energy consumption and CO2 emissions for 2018, compared with the 2005 baseline values, and the final results are related to the reduction commitments planned for 2020. All the municipalities were considered to have achieved this goal, surpassing the 20% emissions reduction. This validated methodology is also the basis for the development of the Sustainable Energy and Climate Action Plans (SECAPs), which integrate adaptation actions and mitigation ones.

1. Introduction

The most important worldwide challenge is the mitigation of climate change related to global warming (GW) and greenhouse gas emissions. This is an issue whose effects are even wider than the single climate change effect. Moreover, each action or policy actuation requires several years before its benefits are manifest [1]. Therefore, international studies have demonstrated that zero emissions, or even a negative emissions level, should be achieved in the next few decades in order to try to face this problem [2,3].
The European Commission (EU) has taken a lead in this area and recently promoted a package of proposals to make Europe the world’s first climate-neutral continent by 2050, setting a target of reducing net greenhouse gas emissions by at least 55% by 2030 compared to 1990 levels [4]. The EU firmly adheres to the policy of “glocalization” (local acting and global thinking) from a political point of view, intervening in particular in energy, land use, and transport as direct measures and in taxation as an indirect measure with the conviction that the evaluation of externalities could orient the market toward a decarbonized economy. This works towards sustainable development (SD), which, in the 2030 Agenda [5], has been divided into 17 goals (sustainable development goals (SDGs)) to give practical consistency to the concept. In particular, Goals 7 (Affordable and Clean Energy), 11 (Sustainable Cities and Communities), and 13 (Climate Action) are directly related to energy production and use, and can be widely merged with local energy planning, matching energy supply, dispatching, and utilization.
In 2008, the EU issued the “20–20–20 Climate–Energy Package” [6], active from 2009 until 2020. It aimed to achieve the goals of (a) a 20% reduction in energy consumption compared to the business as usual (BaU) 2020 scenario; (b) an increase of up to 20% in the share of renewable sources in energy consumption by 2020; and (c) a 20% reduction in CO2 emissions by 2020, compared with the 2005 value. This example was followed by other countries or larger geographical areas and today these quantitative goals are more or less universally recognized and close to achievement. The strength of this proposal is that it puts responsibility for a single action on local entities, following the “glocalization” concept. Therefore, municipalities (the lowest political entity having a responsibility toward citizens) all over the world decided to sign up to the “Covenant of Mayors” program (CoM). The covenant invites municipalities to connect to share experiences and opportunities to reduce greenhouse gas (GHG) emissions. Through this program, public administrations (PAs) are invited to adopt a sustainable energy action plan (SEAP) in order to produce an analysis of the state of the art of the energy consumption of the territory and to introduce energy-saving actions and renewable sources to achieve a CO2 reduction target of at least 20% by 2020 [7].
Hence, SEAPs are operational tools whereby municipalities plan several actions to meet the commitments set by the EU by 2020 and 2030. These actions should be seen as part of an integrated approach, which should include local energy production from renewable sources, energy saving in buildings (residential, commercial, and public administration), and fuel saving and fuel switching in the transportation sector (private, commercial, passenger, and freights). Actions related to social awareness are also key, in order to promote individual behaviors that reduce the energy demand. The municipalities have a crucial role in this regard, considering that urban areas worldwide are responsible for almost 80% of total GHG [8] and represent a critical living environment in terms of sustainability.
Only a few studies have been carried out on how to develop a method for SEAP redaction; the first was in the city of Girona in 2013 and showed how a SEAP was developed and served as an important instrument for the following investigation [9]. The methodology has been improved, in both small and large cities, but only by introducing procedural aspect to evaluate the energetic sustainability of a city [10], or by the classification and choosing of significant sectors [11]. Geographical and sociological aspects are involved in and constrain the energy planning proposal: population [12], the size of the city [13], contextual factors, political will, national programs, the economy of the territory, administrative routines, and also individual choices [14]. In this regard, a Life Cycle Assessment (LCA) approach to emissions evaluation is welcomed, but it is strongly dependent on the local supply chain and the difference between it and a direct approach is non-negligible [
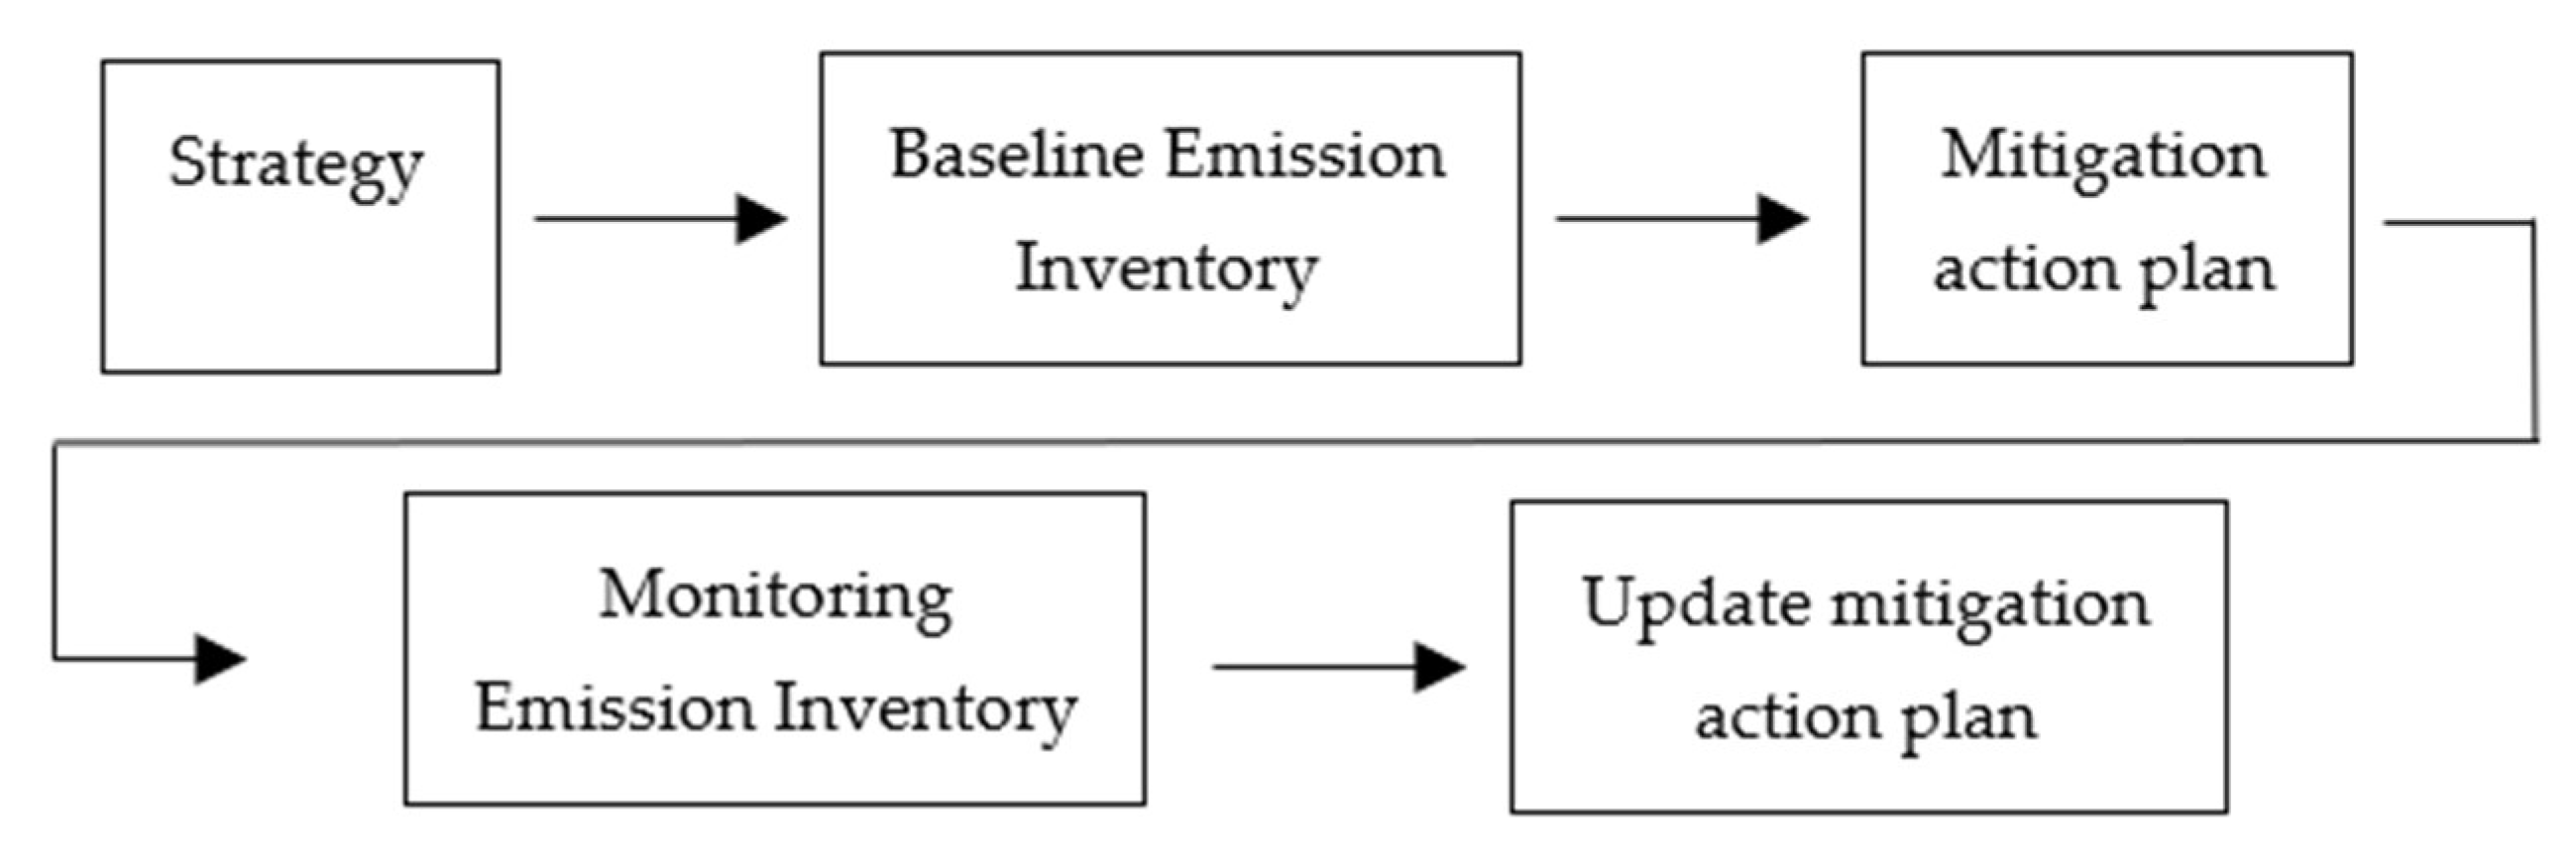
15]. Every methodology is based on the data collection process for the creation of a Baseline Emissions Inventory (BEI) and subsequently a Monitoring Emissions Inventory (MEI). Citizens and stakeholders are always involved, creating a sort of “participatory system mapping” [16], whereby people, the economy, society, energy, and GHG emissions are integrated. There are a number of papers in the literature with numerical evaluations, but they lack descriptions of the calculation methodology. A comparison between the political actions taken to reduce the emissions can be introduced [17], or a study of only the energy action and how renewable energy reduced emissions [18]. Additionally, some indexes to evaluate the quality of SEAPs have been presented, analyzing the accessibility of information, the governance of the initiative, the level of detail [19], and the economic costs [20]. All the accessible data on the JRC portal permit continuous processing of results and a fair comparison of different mitigation policies and methodologies [21].
Therefore, monitoring of energy use and optimization and GHG is the most significant element, but it must be accompanied by a study of the interactions between all dimensions of sustainability (e.g., social, economic, and environmental). In this way, quantitative targets and an increase in social awareness can support future energy and environmental scenarios, where action plans express a municipality’s vision of energy independence and resilience [13] and commitment to reduce CO2 emissions. In 2015, a new Covenant of Mayors for Climate and Energy was introduced, whose purpose was to create synergic actions to limit GHG emissions and, at the same time, reduce vulnerability to the effects of climate change, as officially stated in a novel tool called SECAPs—sustainable energy and climate action plans.
SEAP remains the methodological and operational basis of the energy plans. Studying the mitigation and adaptation strategies (SECAP) is necessary to quantify emissions and consumption [19]; after the quantification of the direct CO2 emissions in a specific area, it is possible to introduce mitigation and adaptation actions [20].
In any case, SEAP is only one tool for more comprehensive energy and environmental planning in a territory, which is surely continuously evolving. Indeed, a detailed and careful monitoring of the actions proposed is needed at proper time intervals (every two or three years), which could produce revisions of the original plan, introducing stronger actions if necessary. This should happen until the reaching of the first target of 2020. In fact, interactions between different actions can produce negative effects, detracting from the simple sum of individual actions and requiring additional efforts from SEAPs to reach the given targets [21].
Size, population, climate conditions, energy and material consumption, and the different economic situation of each municipality, make the SEAP a unique and focused tool. This means that municipalities have different needs but could devote quite different resources to the SEAP implementation and monitoring. Small villages do not have the same options and knowledge as medium and larger cities, which, on the other hand, have more equipment to be introduced in the SEAP (schools, public transport, citizen mobility, higher population density, etc.). Hence, the availability of tools and easily implementable procedures is of particular interest [13].
This paper deals with the methodology used to design and verify the SEAP of nine municipalities in the Abruzzo region of central Italy. The novelty of this study is the development of an engineering methodology for data collection and elaboration for the design and monitoring of the energy planning [22,23]. This model has been refined and validated with nine municipalities that are very different from each other in terms of size, political orientation, geographical location, and economic situation. In fact, the nine municipalities express a wide range of population, city size, and climate conditions, giving the possibility to test the methodology proposed and consolidate the results obtained for the whole Abruzzo region. The study presents the final Baseline Emission Inventory (BEI), its CO2 dimension, and the emissions reduction obtained by 2020, verifying the effectiveness of the actions realized.

2. Materials and Methods

The methods used in this work are strictly related to the process to define the SEAP of the municipality considered. The SEAP definition is the operational tool of the Covenant of Mayors, which defines guidelines for local energy planning in order to meet EU global targets on emissions and energy savings.

2.1. The Covenant of Mayors

The Covenant of Mayors empowers the municipalities to legislate on energy and environmental planning. It was launched in Europe in 2008, with the goal of ensuring that the EU climate and energy targets for 2020 are met at a local scale. In 2014 a second step of the program was defined, valid for the years 2021–2030: it proposed an integrated approach to mitigation and adaptation to global warming that, in addition to agreeing to the more stringent EU emission targets for 2030, aimed to preserve the urban structure against the effects of climate change.
The Covenant initiative had 10,695 signatories in 53 countries, representing 324.5 million inhabitants. Italy had 4900 signatories and over 55 million inhabitants involved [24,25].
The energy consumption calculation and emission reduction in local entities (municipalities) started by defining the baseline year, in order to evaluate the initial values and define the final reduction target. The baseline year in the SEAP design was 2005, data from which were used to determine how the municipalities planned to reach the CO2 emissions target by 2020. The reference situation in terms of energy flow was described in the Baseline Emission Inventory (BEI). Furthermore, a monitoring phase made with the Monitoring Emission Inventory (MEI) was provided in order to verify the effect of the planned mitigation actions and ensure the achievement of the CO2 emissions target by 2020.
Monitoring represents a crucial part of the effective implementation of the energy and environmental measures [26]. BEIs and MEIs follow the same methodological structure and define the amount of equivalent CO2 emitted in the geographical area of the municipalities, starting from the energy flows allocated by the energy carrier and sector. The monitoring phase makes the SEAP document a flexible tool, open to changes, in which any variations must be reported in order to update the fixed goals of the plan and define the actions needed to reach the objectives. Figure 1 describes the SEAP process.
SEAPs focus their interventions on both the public and private sectors, not only with quantitative energy actions, but also with targeted awareness campaigns in order to transmit to citizens good energy practices for living their daily lives in a more sustainable way [27]. An eco-oriented lifestyle, in fact, appears to be among the most important actions that ensure effective glocalization.
For the data processing, the reference approach is represented by the European Commission guidelines, from which the methodology presented in this paragraph as developed. In particular, the analysis involves the transport, residential, and tertiary sectors [28]. Industrial sectors, as also indicated by the EC, were not considered because they are not directly influenced or guided by municipalities.

2.2. The Transportation Sector (Private and Commercial)

The transport sector included only the contributions of road transport [29,30], considering gasoline, diesel, and LPG as fuels for private and commercial vehicles.
For private transport, energy flows were calculated by starting from the regional fuel sales data for generic i-th fuel only for road transportation (Fi,tot), which was a separate market from the liquid fuels used in residences and agriculture [31]. Subsequently, this value was converted at the municipal scale by considering a linear correlation with population (Pop, Equation (1)). For each kind of fuel, the consumption (F) in the municipal territory was calculated.
For freight transportation, the model was first used to calculate the number of circulating heavy duty vehicles (truck) in the local area (Equation (2)): input data were related to the regional quantity of goods transported (Gtot, tons) and a truck’s average load (Gtruck) [31]; this latter value was calculated as the weighted average of the regional truck fleet, indicated in Table 1 [32]. Finally, knowing the average distance covered by a commercial vehicle (dtruck) [33] and estimating the average fuel consumption per truck (FCtruck), Equation (3) allowed us to calculate the local fuel consumption (mainly diesel) for the municipality.
F i =   P o p m u n i c i p a l   P o p t o t F i , tot
# t r u c k = G t o t G t r u c k = G t o t i G i · # t r u c k i # t r u c k t o t
F t r u c k = d ¯ t r u c k · i F C t r u c k · # t r u c k i
Finally, for both private and commercial transportation, the energy flows (MWh) were calculated by using the conversion coefficients (MWh/Lfuel) shown in Table 2.

2.3. The Residential Sector

The energy consumption in the residential sector is strictly dependent on the population and number of residential buildings. Therefore, to quantify the electricity consumption, the statistics of TERNA (Italian energy TSO, [34]) provided the average consumption per inhabitant in a specific geographical region (Espec, MWh per capita). Following Equation (4), which multiplies this value by the population of the municipality, the corresponding electrical energy E was found.
The heating consumption of the residential sector was determined by defining 28 categories of buildings, characterized by the number of floors above ground and the construction year. A specific building evaluation tool was used to calculate the thermal consumption for each category (Table 3), starting with the geographical position, climatic zone, construction materials, and age of the buildings, and assuming an average surface Sfloor exposed for each floor (100 m2). The result is the specific thermal energy needs per surface area (Qsurf). This is a commonly used parameter since it is the basis of the energetic performance of a building. Therefore, the number of residential buildings in each municipality was collected, using raw data provided by the ISTAT (Italian Central Statistics Institute) database [32].
Finally, the energy flow for the heating system was calculated following Equation (5). To consider hot water for domestic use, an increase in 10% of the consumption for space heating was considered [31].
E = E s p e c · P o p
Q = y e a r # f l o o r s Q s u r f S f l o o r  

2.4. The Tertiary Sector

Raw data provided by TERNA and referring to the provincial average accounting of electrical consumption (MWh) allowed us to estimate the electricity energy consumption in the municipal territory divided by the number of inhabitants.
The thermal energy flow is calculated by following Equation (6), starting from the municipal numbers of the tertiary sector’s operators (number of employees), [32], the energy demand for each place unit area (MWh/m2) (calculated in the same way described in the previous paragraph), and the estimated surface for each employee (Sspec, m2/empl).
Q = Q s u r f · S s p e c · # e m p l o y e e s

2.5. Municipal Fleet, Public Transport, Municipal Public Lighting, and Municipal Buildings

The calculation of the energy flow started with the data held by the municipality’s office. In collaboration with the municipal employees, every city drew up a full inventory: vehicles owned for transportation and municipal service, the annual consumption (F, Lfuel), municipal lighting, and consumption from municipal buildings. Data have been requested by a questionnaire reported in Appendix A. All data received were processed and converted into MWh using the above methodology. In the case of public lighting the number and type of lamps was provided by municipal employees and, knowing the number of hours of operation in a year (4145 h [35]), it was possible to calculate the total energy consumption as follows:
E l i g h t i n g = n . b u l b E ˙ b u l b h e q

2.6. CO2 Emissions Calculation

We calculated the energy flow for each sector, and the corresponding CO2 emissions were obtained by using the specific emission factors (tCO2/MWh), specified by the SEAP guidelines [36], and considering the contributions of national renewable energy production (Table 4. In particular, for the emission coefficient considered in the transport sector and for electricity production, reference was made to the national target on the use of Renewable Energy Sources (RES) [37,38]. Finally, the municipal heating energy flow was divided by the typical energy vector used at a regional scale, [39,40]. Table 4 summarizes the specific factors used to calculate the CO2 emissions. The data do not consider a LCA approach; for this, solar thermal energy and biomass were characterized as neutral in terms of the CO2 emitted.

2.7. Power Production from Renewable Energy Sources

Renewable energy sources play in important role in sustainable energy planning. In the last few decades, they have been widely exploited in order to reduce the carbon footprint of electrical and thermal energy production. In particular, bioenergy, wind, hydro, and solar are the main ones for electricity production, while heat is closely related to solid biomasses (wood) and solar heating. In this regard, the installation of heat pumps and condensation boilers is strongly encouraged by governments and, usually, they are considered as energy-saving devices. The number of renewable energy source-based plants in Italy is collected in [41], and can be used to evaluate, year by year, the green energy produced. In particular, the installed power of each plant is provided ( Q ˙ inst, [kW]).
When the purpose is heating a building (for instance, biomass-fired boilers and heat pumps), the Italian regulations apply a specific value of yearly hours when the device is turned on, depending on the climatic zone. This information permitted us to calculate (using Equation (8)) the total local heat production by conventional and high-efficiency boilers, also fed by renewable energy.
Q b u i l d i n g = Q ˙ i n s t h e q  
In the case of solar heating, the overall surface Spanels of the plant was provided for each municipality: the energy produced by each plant was calculated (Equation (9)) by knowing the equivalent working hours (1120 h [42]) and average solar radiation of the panels (1.4 kW/m2) [43]:
Q s o l a r = h e q I s o l S p a n e l s
The energy production by photovoltaic panels was calculated as in Equation (10). The working equivalent hours considered consider the seasonal efficiency of the plants.
E s o l a r = h e q E ˙ i n s t

2.8. Selection of Municipalities

The nine cities (Figure 2) are in the Abruzzo region; seven municipalities are in the province of Teramo and two in the province of Pescara. They were selected in order to have diverse and comprehensive case studies and, so, a significant validation of the model. Indeed, the nine cities are very different (Table 5), as a wide area and small villages in different climate zones have been investigated; the population ranged from 1422 to 25,689, the number of residential buildings varied from 481 (Castilenti) to 5229 (Roseto), and the climate zone was either C or D (temperate versus medium-cold climate). In Figure 2, it is also possible to highlight the different geographical context: a group of them belonged to coastal areas, while a second group was inland. The number of employees in the tertiary sector is also shown for each municipality, being necessary to evaluate the energy consumption of this sector (Equation (6)). These differences show that the model could be applied in various contexts.

3. Results and Discussion

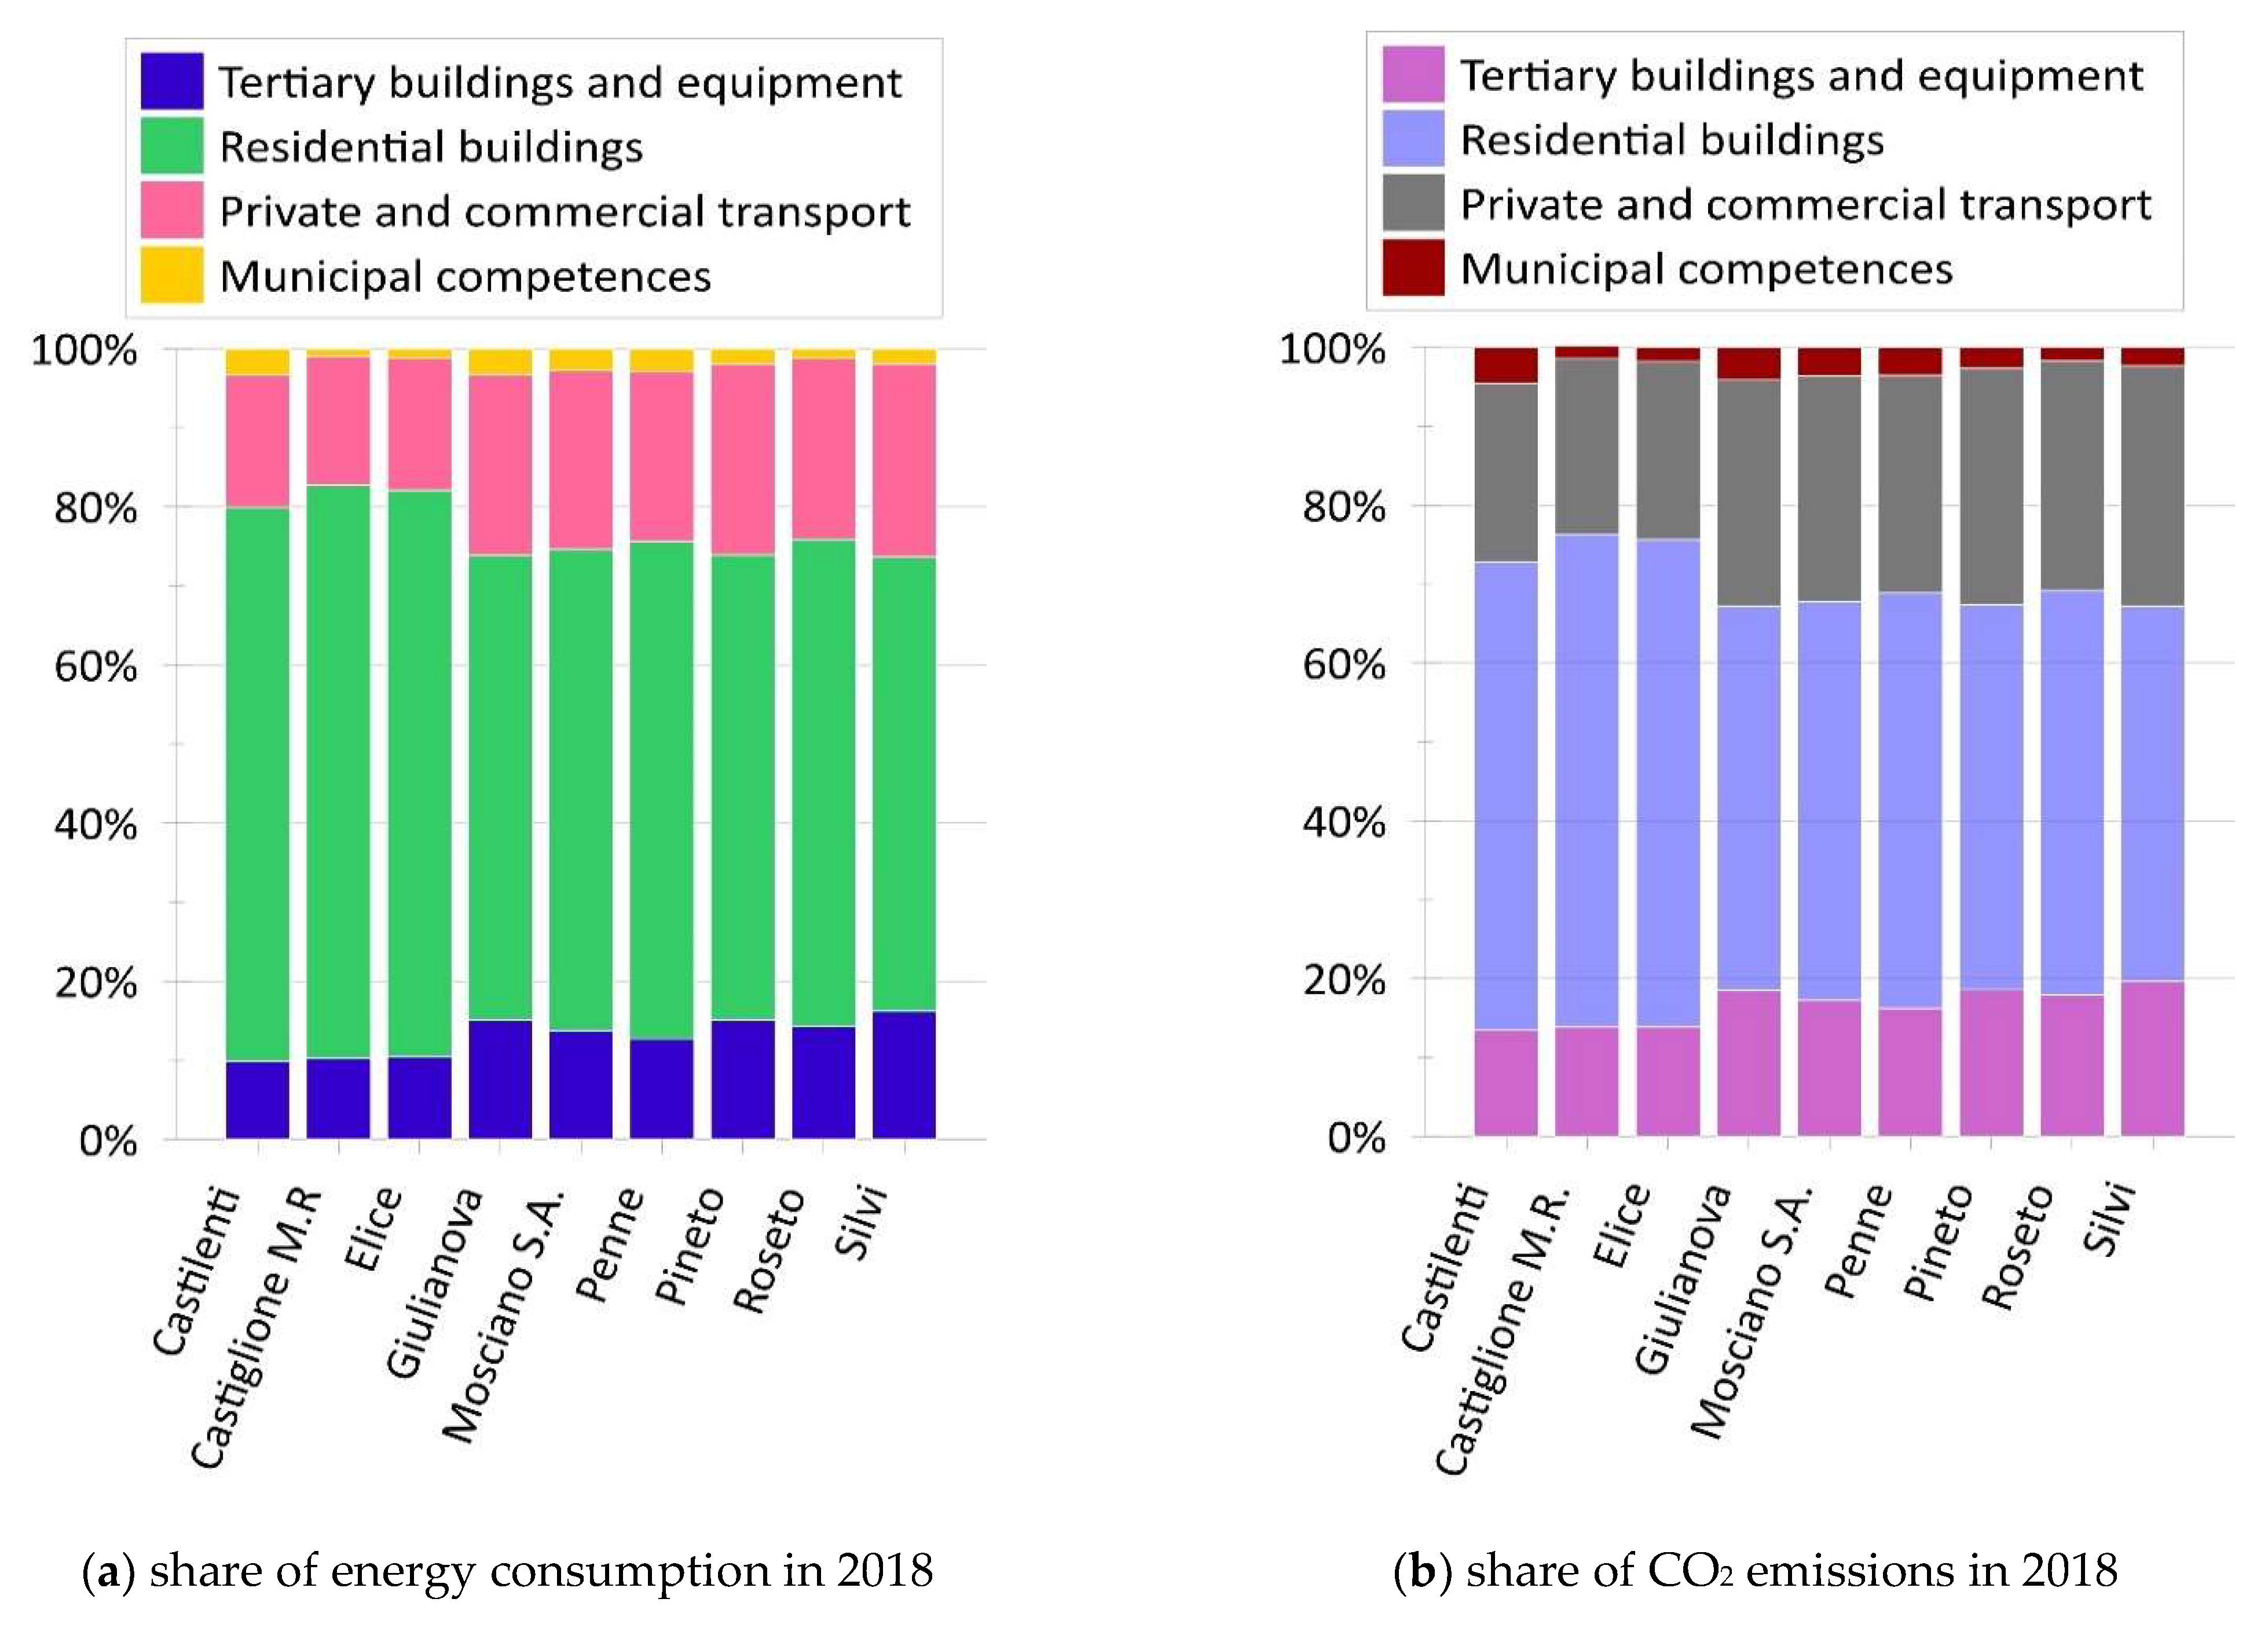
The model results are shown in Figure 3, analyzing the consumption and emissions in every municipality in the reference year, 2018. It can be seen that the most energy-intensive sector is residential buildings (Figure 3a), which was also the most impactful sector in terms of CO2-related emissions (Figure 3b). The influence of transport, in terms of consumption and emissions, was higher in bigger cities like Silvi, Pineto, and Roseto.
The influence of municipal competence has been analyzed (Figure 3c,d), comprising public lighting, public transport, buildings owned and used by the public administration (schools, government buildings, etc.), and the vehicle fleet owned by the administration. Although the values of the energy consumption and emissions are limited, this focus is important because the municipality plays a crucial role in political decision making and this is fundamental to orient the key actions in other sectors. One of the most important sectors is public lighting, which showed a reduction of about 55–60% after substituting original lightbulbs (halogen) with more efficient ones (for instance, LED).
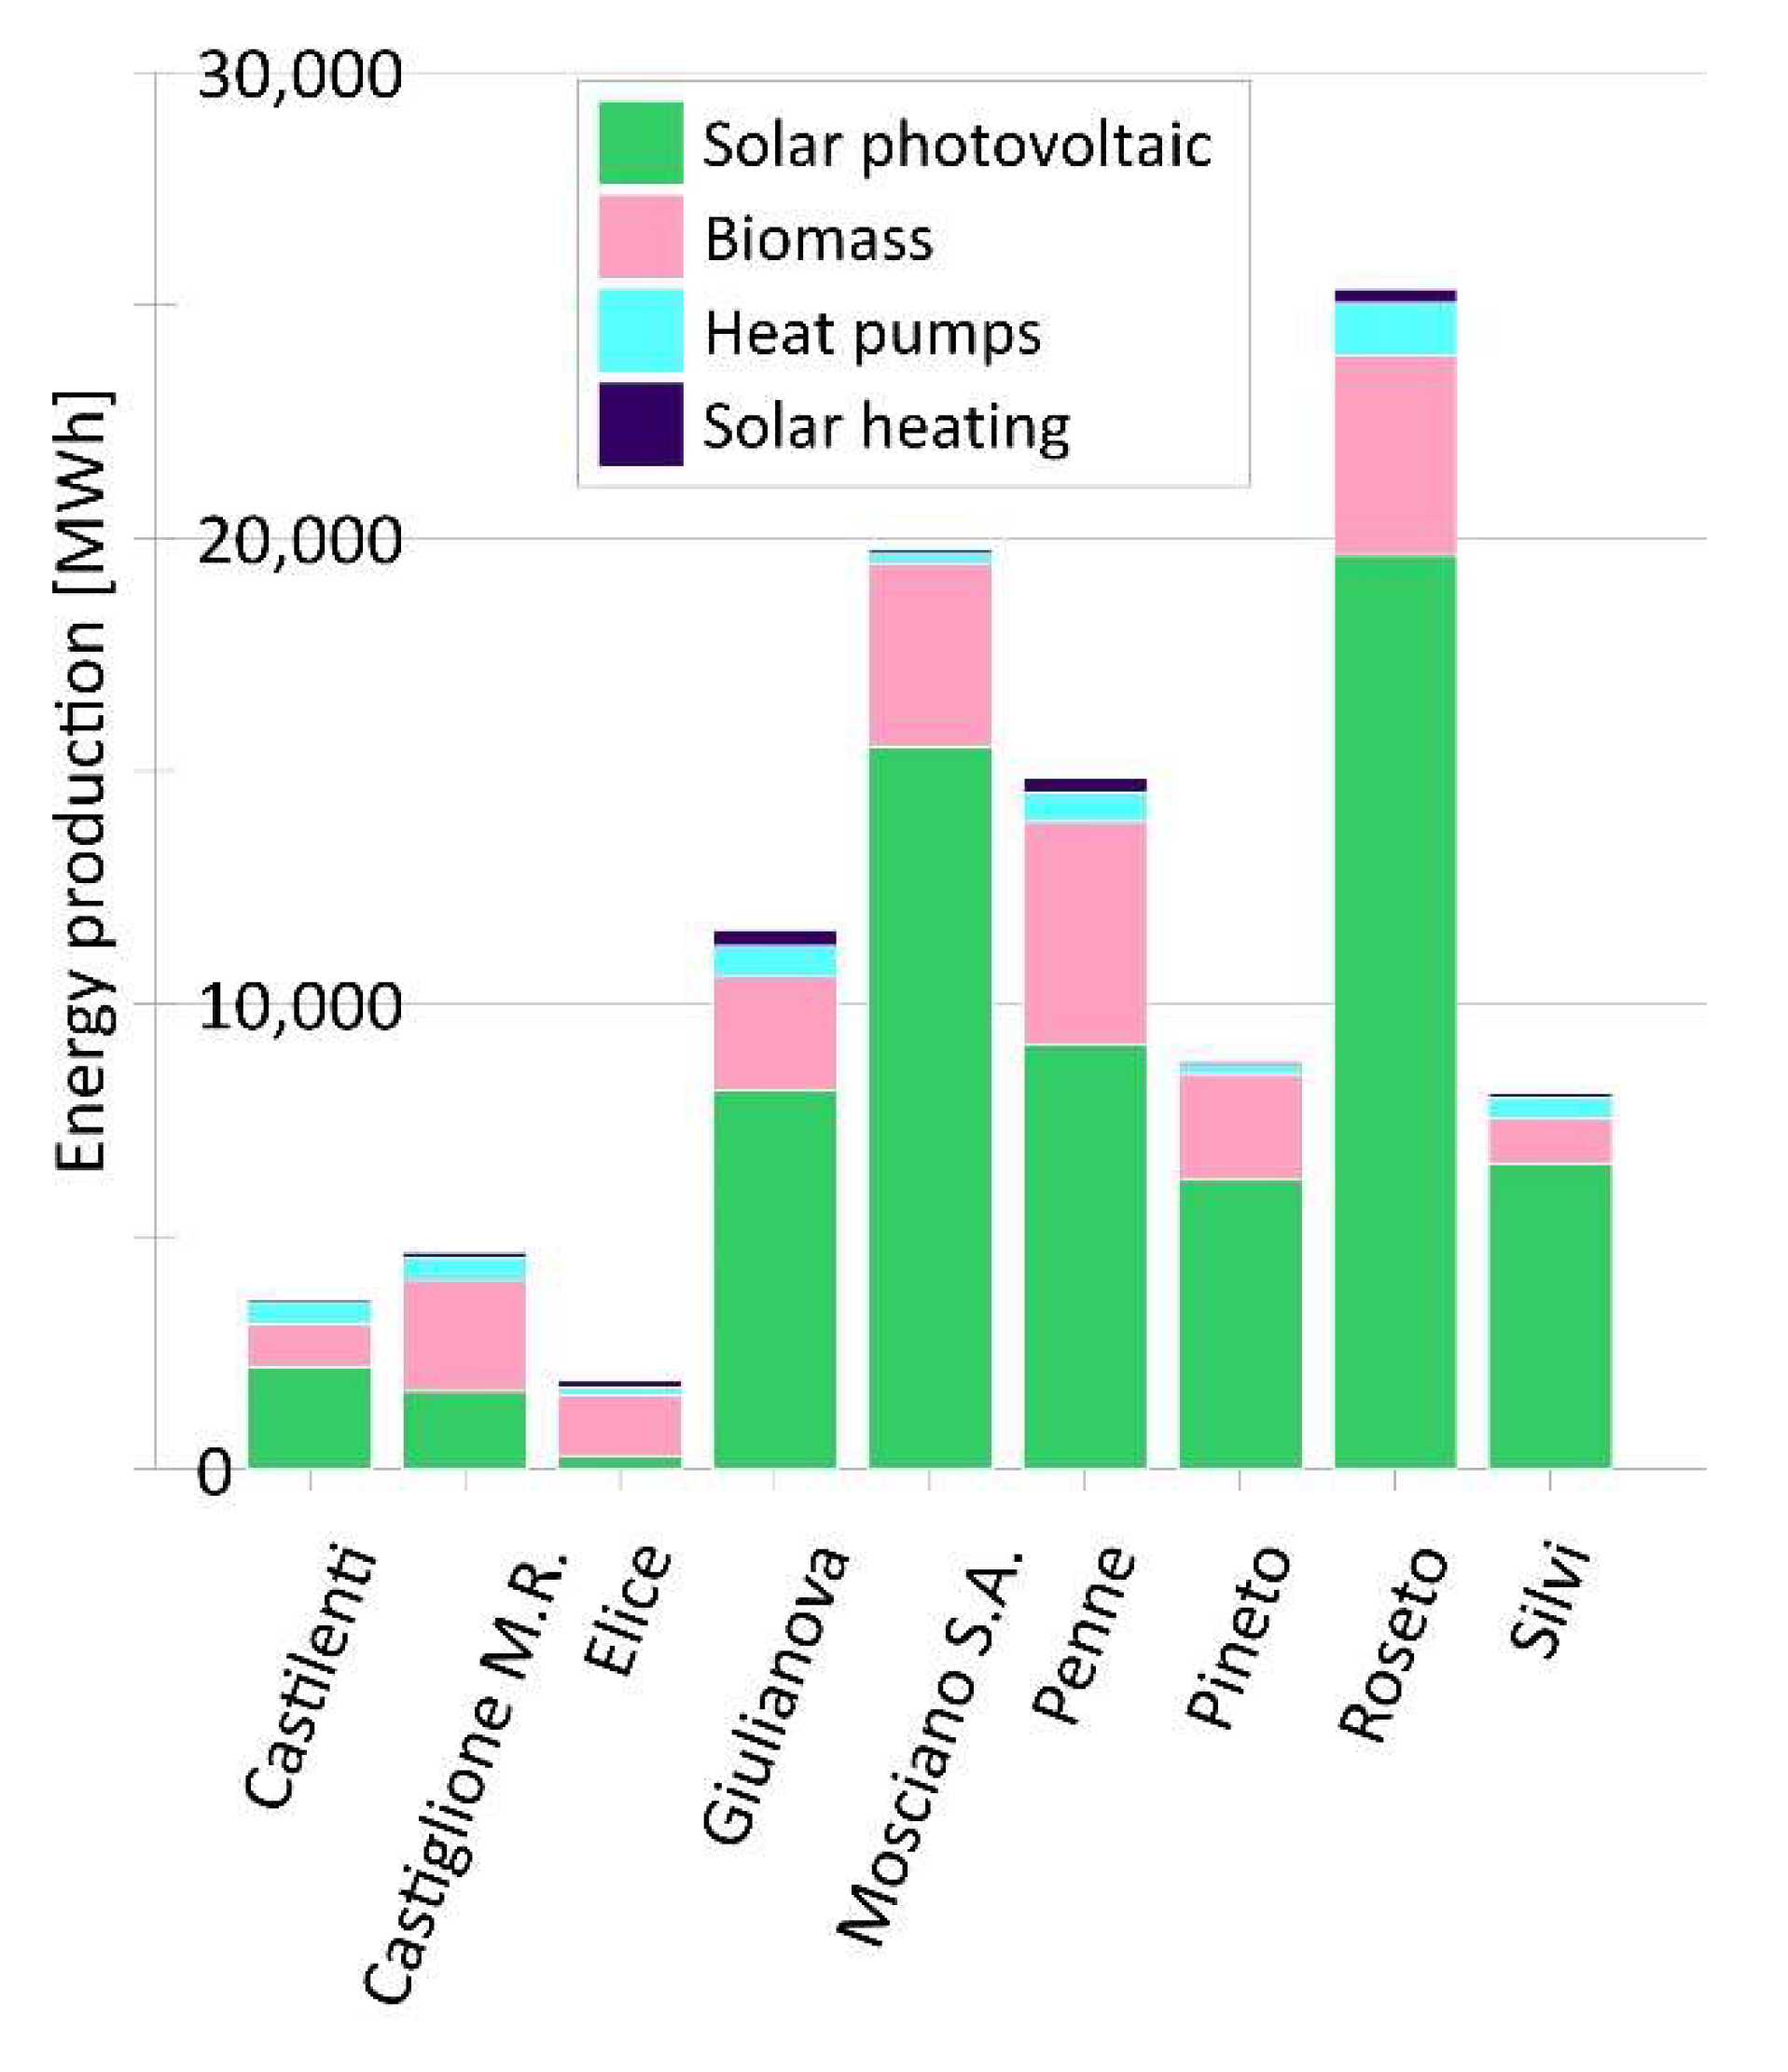
The production of renewable energy (Figure 4) was higher in larger municipalities (Roseto, Mosciano S. A., Penne, and Giulianova); the most important source was solar, which is more important in coastal towns: for Silvi it represented 81% of renewable production, while it was 14% in Elice (inland). Unlike solar, biomass is used most in inland villages: it represented 70% of renewable energy in Elice but only 16% in Silvi. This, most probably, is because the coastal areas are sunnier, while in inland areas the use of firewood is more common.
The difference in consumption from 2005 to 2018 was calculated with the methodology developed. For every town considered, a reduction of −5.6% to −15.6% was experienced. A higher reduction was calculated in Penne, while a lower reduction was seen for Elice (Table 6). The reduction of per capita consumption was calculated and is shown in Figure 5: the city with the greatest per capita reduction in consumption was Mosciano Sant’Angelo (−4.13 MWh/inhabitant); the one with the lowest reduction was Castilenti (−0.26 MWh/inhabitant). The per capita consumption in 2018 ranged from 20.1 MWh/inhabitant (Silvi) to 25.61 MWh/inhabitant (Castiglione Messer Raimondo).
From Figure 5 it is also possible to observe that the per capita consumption was slightly higher than the Italian average and particularly higher than the European one for the selected sectors [44]. These were characterized by a reduction from 2005 to 2018 of 2.1 MWh/inhabitant and 0.7 MWh/inhabitant, respectively. Differences were mainly due to the different methodology, with a slight overestimation seen in the presented model with respect to the international one. The lower EU value is related to a higher energy efficiency in terms of residential and transportation use, two sectors where Italy has older stock with respect to the European average for the time interval considered [45].
In parallel with consumption, it was possible to calculate the emissions for every city: the reduction was in the range from 23.3% to 30.5%, largely in line with the EU emissions target for 2020 (Table 7). The greatest reduction was detected in Penne, and the smallest in Elice. This trend is the result of both the national energy mix and actions promoted by municipality, national, and international strategies. The reduction trend was confirmed by the per capita emissions trend (Figure 6), which in 2018 ranged from 4.96 tCO2/inhabitant (Silvi) to 5.89 tCO2/inhabitant (Castiglione Messer Raimondo), slightly above the Italian and European average (4.4 tCO2/inhabitant and 3.3 tCO2/inhabitant, respectively). The Italian per capita emissions trend showed a higher reduction from 2005 to 2018 (1.9 tCO2/inhabitant), ranging from 6.3 tCO2/inhabitant to 4.4 tCO2/inhabitant. The lower value of European per capita emissions is surely related to the use of nuclear energy, which is completely absent in the Italian energy mix [44].
The city with the greatest per capita emissions reduction was Mosciano Sant’Angelo (−1.72 tCO2/inhabitant), while the one with the lowest reduction was Elice (−1.18 tCO2/inhabitant). The emission factors used to calculate the CO2 emissions (Table 4) followed the IPCC approach, which is less conservative compared to the LCA approach. In particular, the percentage increase in the emission values obtained with the LCA approach can be estimated at 24% [15], providing a more realistic estimation principally due to the different system boundaries that characterize the approaches.

4. Conclusions

The international commitment to energy savings and CO2 emission reduction is universally recognized, but it needs to be actuated by local entities, from the bottom up, following the principle of glocalization. The smallest administrative unit is the municipality, which has a political responsibility toward its citizens and can plan actions and interventions to achieve these goals. The Covenant of Mayors has this specific aim and has set a tool, called SEAP (Sustainable Energy Action Plans), for planning local mitigation action.
In this work, a methodology for energy and environmental planning in local areas has been proposed and validated, in order to help municipalities in the design and monitoring phases of SEAPs. The procedure developed starts from the availability of measured data by municipality, energy statistics, and engineering estimations. In this way, a model of energy consumption evaluation and CO2 emissions calculation has been realized, which covers the residential sector, the tertiary and commercial sectors, and transportation, both private and commercial. The collected data, indeed, have been used to precisely evaluate the primary energy consumption of the territory involved in a reference year, relating it to major sociological, demographic, and geographical parameters. Hence, CO2-related emissions can be calculated using specific emissions factors related to each energy carrier utilized in the municipality (electricity, natural gas, diesel, gasoline, LPG, biomass, etc.). A particular focus has been placed on the infrastructure of municipal competence, like public transport and the municipal fleet, public lighting of roads and common areas, and buildings owned by public entities (schools, government palaces, gyms, etc.). In fact, actions promoted directly by the public administration can have additional value in terms of raising social awareness. Moreover, the energy production (electrical and thermal) from renewable sources has been properly considered, thanks to precise municipal databases and yearly operation estimation.
The methodology has been applied to nine municipalities in inland and coastal areas of the Abruzzo region, with different values of population, population density, altitude, climate, and economy. These differences create a wide portfolio of case studies to ensure proper validation of the model developed. In order to assess the possible energy savings and CO2 emissions reduction of each single town, aiming to verify the achievement of the international goals, the procedure was applied to data from 2005 and 2018. The data were also compared to Italian and European average values, showing their good agreement and differences related to the model assumptions and the specific territory. An average value of 18 MWh/inhabitants and 3.9 tCO2/inhabitants was obtained in 2018 in the territory considered, very close to the national average, but still higher in terms of specific emissions than the European average (where the presence of nuclear energy plays a crucial role).
The results show a significant reduction in energy consumption in every municipality (from 5% to 15%) and related CO2 emissions saving (from 24% to 30%). The transportation sector is the main one responsible for the energy savings, particularly related to the introduction of liquid biofuels and strong innovation in terms of vehicles. Residential buildings play a crucial role, and, in recent years, public funding has pushed the sector towards important interventions in building efficiency (reduction of heat loss towards the external environment, boiler substitution, more efficient temperature control, improved windows and frames, and the use of renewable energy). In addition, the increasing use of renewable sources makes a great contribution to CO2 emissions reduction: solar energy is particularly important, both as a photovoltaic source for electrical energy production and in thermal form for building heating, but also via geothermal heat pumps and the use of biomass, particularly in inland and mountainous areas.
The results obtained confirm the right path undertaken by EU, entrusting local entities with responsibility for international commitments and global goals. Energy and environmental planning tools can support governments in the monitoring of targets and the revision of actions planned. The procedure to set up SEAPs is flexible and applies to quite different municipal characteristics. It also represents a starting point for a future step represented by SECAPs, integrating in the methodology other territorial and environmental aspects (mainly in terms of climate change adaptation, risk and vulnerability reduction, water scarcity, soil consumption, and other non-energy issues).

Author Contributions

Conceptualization, D.D.B., C.B., S.C. and R.C. (Roberto Cipollone); methodology, A.C., L.D.P., S.A. and R.C. (Roberto Carapellucci); software, A.C., S.S. and S.A.; validation, D.D.B., L.D.P. and S.S.; formal analysis, R.C. (Roberto Carapellucci), D.D.B. and R.C. (Roberto Cipollone); investigation, C.B., L.D.P., S.A. and S.S.; resources, C.B., R.C. (Roberto Cipollone), D.C. (Dario Ciamponi), D.C. (Dina Cardone), S.C. and D.D.B.; data curation, S.S., C.B., L.D.P. and S.A.; writing—original draft preparation, D.D.B., L.D.P., S.S. and S.A.; writing—review and editing, R.C. (Roberto Carapellucci), R.C. (Roberto Cipollone), D.D.B. and C.B.; visualization, L.D.P., S.A. and D.D.B.; supervision, R.C. (Roberto Cipollone), C.B., S.C. and R.C. (Roberto Carapellucci); project administration, D.C. (Dario Ciamponi), D.C. (Dina Cardone), S.C. and D.D.B.; funding acquisition, S.C., D.C. (Dario Ciamponi), D.C. (Dina Cardone), C.B., R.C. (Roberto Cipollone) and D.D.B. All authors have read and agreed to the published version of the manuscript.

Funding

This research received no external funding.

Institutional Review Board Statement

Not applicable.

Informed Consent Statement

Not applicable.

Acknowledgments

This work was completed in the framework of the JOINT-SECAP (Joint strategies for Climate Change Adaptation in coastal areas) project, within the EU Interreg Italy–Croatia cooperation program. The Abruzzo region is acknowledged for support and project coordination among the different municipalities. Each municipality is also acknowledged for data sharing.

Conflicts of Interest

The authors declare no conflict of interest.

Nomenclature

Symbols
ddistance (km)
Eelectrical energy (MWh)
Ėelectrical power (MW, kW)
Ffuel consumption (sales) (L)
FCSpecific fuel consumption (L/km)
Gquantity of goods—payload (ton)
heqnumber of operating hours (h)
Isolyearly solar irradiation to solar panel (kW/m2)
PopPopulation
QThermal energy (MWh)
Q ˙ Thermal power (MW, kW)
Ssurface, area (m2)
Subscripts
instinstalled
specspecific—per capita
surfspecific—per unit area
tottotal (regional scale)
Acronyms
BEIBaseline Emissions Inventory
CHPCombined Heat and Power
CoMCovenant of Mayors
EUEuropean Union
ECEuropean Commission
GHGGreenhouse Gases
GPPGreen Public Procurement
GWGlobal Warming
JRCJoint Research Center
LCALife Cycle Assessment
LEDLight Emitting Diode
LPGLiquefied Petroleum Gas
MEIMonitoring Emissions Inventory
PAPublic Administration
RESRenewable Energy Sources
SDSustainable Development
SDGSustainable Development Goal
SEAPSustainable Energy Action Plan
SECAPSustainable Energy and Climate Action Plan
TSOTransmission System Operator of electrical grid

Appendix A. Questionnaire Submitted to Municipality Reference Contact

In order to evaluate the specific data dependent on the municipality administration, a short questionnaire was submitted to the contact person of the municipality, often the mayor him/herself. It particularly concerns the competences of the municipality and eventual incentives for renewable sources and energy efficiency in different sectors. It was sent in table form (Table A1, Table A2, Table A3, Table A4 and Table A5) in order to facilitate its compilation. Some data requested were redundant, but this was done to match the data availability of each municipality.
Table A1. Data requested for municipality buildings.
Type of BuildingAddressElectric Consumption (kWh)Thermal Consumption (kWh or Sm3)
Gym
School
Table A2. Data requested for public lighting.
No. of BulbsBulb TypePower (kW)Energy Consumption (kWh)
Table A3. Data requested for public transport.
Vehicle TypeDistance (km)FuelFuel Consumption (L or €)
Bus Diesel
Car Petrol
Table A4. Data requested for public renewable energy plants.
Type of PlantInstalled Power (kW)Operation Start (Date)Yearly Operation Hours (h)Yearly Energy Production (kWh)
Photovoltaic
Biomass
Biogas
Hydro
CHP
Table A5. Data requested for incentives and other actions.
Type DescriptionNo. of People InvolvedYears
EconomicBoiler substitutionXXX2012–2014
GPP
….

References

  1. Gloor, M.; Sarmiento, J.L.; Gruber, N. What can be learned about carbon cycle climate feedbacks from the CO2 airborne fraction? Atmos. Chem. Phys. Discuss. 2010, 10, 7739–7751. [Google Scholar] [CrossRef] [Green Version]
  2. Fuss, S.; Lamb, W.F.; Callaghan, M.W.; Hilaire, J.; Creutzig, F.; Amann, T.; Beringer, T.; de Oliveira Garcia, W.; Hartmann, J.; Khanna, T.; et al. Negative emissions—Part 2: Costs, potentials and side effects. Environ. Res. Lett. 2018, 13, 063002. [Google Scholar] [CrossRef] [Green Version]
  3. Abbate, S.; Di Paolo, L.; Carapellucci, R.; Cipollone, R. Carbon uptake dynamics associated to the management of unused lands for urban CO2 planning. Renew. Energy 2021, 178, 946–959. [Google Scholar] [CrossRef]
  4. EU Commission Press Release—European Green Deal: Commission Proposes Transformation of EU Economy and Society to Meet Climate Ambitions, Brussels, 14 July 2021. Available online: https://ec.europa.eu/commission/presscorner/detail/en/IP_21_3541 (accessed on 16 September 2021).
  5. Transforming Our World: The 2030 Agenda for Sustainable Development; A/RES/70/1; United Nation: New York, NY, USA, 2015.
  6. Directive 2009/29/EC of the European Parliament and of the Council of 23 April 2009. Available online: https://eur-lex.europa.eu/LexUriServ/LexUriServ.do?uri=OJ:L:2009:140:0063:0087:en:PDF (accessed on 16 September 2021).
  7. Covenant Official Text. Available online: https://www.covenantofmayors.eu/index.php%3Foption%3Dcom_attachments%26task%3Ddownload%26id%3D11+&cd=2&hl=it&ct=clnk&gl=it (accessed on 16 September 2021).
  8. Schenone, C.; Delponte, I.; Pittaluga, I. The preparation of the Sustainable Energy Action Plan as a city-level tool for sustainability: The case of Genoa. J. Renew. Sustain. Energy 2015, 7, 033126. [Google Scholar] [CrossRef]
  9. Nuss-Girona, S.; Llausas, A.; Figueras, J.; Morera, S. The SEAP in the city of Girona, a crossroads between boldness and pragmatism. Local Environ. 2014, 21, 476–503. [Google Scholar] [CrossRef]
  10. Marquez-Ballesteros, M.-J.; Mora-López, L.; Lloret-Gallego, P.; Sumper, A.; Sidrach-De-Cardona, M. Measuring urban energy sustainability and its application to two Spanish cities: Malaga and Barcelona. Sustain. Cities Soc. 2019, 45, 335–347. [Google Scholar] [CrossRef]
  11. Qian, K.; Lv, T.; Yuan, Y. Integrated Energy System Planning Optimization Method and Case Analysis Based on Multiple Factors and A Three-Level Process. Sustainability 2021, 13, 7425. [Google Scholar] [CrossRef]
  12. Coelho, S.; Russo, M.; Oliveira, R.; Monteiro, A.; Lopes, M.; Borrego, C. Sustainable energy action plans at city level: A Portuguese experience and perception. J. Clean. Prod. 2018, 176, 1223–1230. [Google Scholar] [CrossRef] [Green Version]
  13. Theodoridou, I.; Mermigas, A.; Christodoulou, A.; Kanouras, S.; Kokkinidou, R. Towards climate change mitigation and adaptation in cities–the role of Greek Municipalities and Prefectures. Findings and outcomes from the EMPOWERING Project. In IOP Conference Series: Earth and Environmental Science; No. 1; IOP Publishing: Bristol, UK, 2020; Volume 410, p. 012008. Available online: https://www.researchgate.net/publication/338814507_Towards_climate_change_mitigation_and_adaptation_in_cities_-_the_role_of_Greek_Municipalities_and_Prefectures_Findings_and_outcomes_from_the_EMPOWERING_Project/fulltext/5e2ba029299bf152167b33fa/Towards-climate-change-mitigation-and-adaptation-in-cities-the-role-of-Greek-Municipalities-and-Prefectures-Findings-and-outcomes-from-the-EMPOWERING-Project.pdf (accessed on 16 September 2021).
  14. Fenton, P.; Gustafsson, S.; Ivner, J.; Palm, J. Sustainable Energy and Climate Strategies: Lessons from planning processes in five municipalities. J. Clean. Prod. 2015, 98, 213–221. [Google Scholar] [CrossRef] [Green Version]
  15. Cellura, M.; Cusenza, M.A.; Longo, S. Energy-related GHG emissions balances: IPCC versus LCA. Sci. Total. Environ. 2018, 628–629, 1328–1339. [Google Scholar] [CrossRef] [PubMed]
  16. Bernardo, G.; D’Alessandro, S. Societal implications of sustainable energy action plans: From energy modelling to stakeholder learning. J. Environ. Plan. Manag. 2019, 62, 399–423. [Google Scholar] [CrossRef]
  17. Palermo, V.; Bertoldi, P.; Apostolou, M.; Kona, A.; Rivas, S. Data on mitigation policies at local level within the Covenant of Mayors’ monitoring emission inventories. Data Brief 2020, 32, 106217. [Google Scholar] [CrossRef] [PubMed]
  18. Schenone, C.; Delponte, I. Renewable energy sources in local sustainable energy action PLANs (SEAPs): Analysis and outcomes. Energy Policy 2021, 156, 112475. [Google Scholar] [CrossRef]
  19. Pasimeni, M.R.; Valente, D.; Zurlini, G.; Petrosillo, I. The interplay between urban mitigation and adaptation strategies to face climate change in two European countries. Environ. Sci. Policy 2019, 95, 20–27. [Google Scholar] [CrossRef]
  20. Abbate, S.; di Paolo, L.; Carapellucci, R.; Cipollone, R. Urban context and neighbouring lands: How reforestation could have a role in the implementation of Sustainable Energy and Climate Action Plans. In Proceedings of the E3S Web Proceedings. Presented at Italian Congress of Thermal Machines, Virtual, Italy, 17 September 2021. [Google Scholar]
  21. Matak, N.; Krajačić, G. Assessment of mitigation measures contribution to CO2 reduction in sustainable energy action plan. Clean Technol. Environ. Policy 2019, 22, 2039–2052. [Google Scholar] [CrossRef]
  22. Cinocca, A.; Santini, F.; Cipollone, R. Monitoring methodologies and tools for the Sustainable Energy Action Plans to support the Public Administration. Energy Procedia 2018, 148, 758–765. [Google Scholar] [CrossRef]
  23. Cinocca, A.; Di Paolo, L.; Abbate, S.; Cipollone, R. Methodologies for Sustainable Energy Action Plan design and monitoring applied to the Municipality of Avezzano. In Proceedings of the E3S Web of Conferences, Abruzzo Region, Italy; 2020; Volume 197, p. 08013. [Google Scholar] [CrossRef]
  24. Official Website of “Covenant of Mayors”. Available online: https://www.eumayors.eu/ (accessed on 16 September 2021).
  25. Lombardi, M.; Pazienza, P.; Rana, R. The EU environmental-energy policy for urban areas: The Covenant of Mayors, the ELENA program and the role of ESCos. Energy Policy 2016, 93, 33–40. [Google Scholar] [CrossRef]
  26. Delponte, I.; Pittaluga, I.; Schenone, C. Monitoring and evaluation of Sustainable Energy Action Plan: Practice and perspective. Energy Policy 2017, 100, 9–17. [Google Scholar] [CrossRef]
  27. Boehnke, R.F.; Hoppe, T.; Brezet, H.; Blok, K. Good practices in local climate mitigation action by small and medium-sized cities; exploring meaning, implementation and linkage to actual lowering of carbon emissions in thirteen municipalities in The Netherlands. J. Clean. Prod. 2019, 207, 630–644. [Google Scholar] [CrossRef]
  28. Bertoldi, P.; Cayuela, D.B.; Monni, S.; de Raveschoot, R.P. Existing Methodologies and Tools for the Development and Implementation of SEAP; JRC EC: Ispra, Italy, 2010; Available online: https://core.ac.uk/download/pdf/38620582.pdf (accessed on 16 September 2021).
  29. ISPRA—Istituto Superiore per la Protezione e la Ricerca Ambientale. Analysis of European Road Transport Data. Available online: https://www.isprambiente.gov.it/files2020/pubblicazioni/stato-ambiente/annuario-2020/4_Trasporti_Finale_2019.pdf (accessed on 16 July 2021).
  30. MIT—Ministero delle Infrastrutture e dei Trasporti, Italian Ministry of Infrastructure and Transportation. National Account of Infrastructure and Transport. Available online: https://www.mit.gov.it/sites/default/files/media/pubblicazioni/2020-07/Libro%20Web%20CNIT%202018-2019_0.pdf (accessed on 25 July 2021).
  31. ENEA—Agenzia Nazionale per le Nuove Tecnologie, L’energia e lo Sviluppo Economico Sostenibile, Italian Agency of Energy, new Tecnologies and Sustainable Development. The Numbers of Energy. 2015. Available online: https://www.enea.it/it/seguici/pubblicazioni/pdf-volumi/raee-2015.pdf (accessed on 5 July 2021).
  32. ISTAT—Istituto Nazionale di Statistica, Italian Statistical Institute. Census 2011. Available online: https://www4.istat.it/en/population-and-housing-census/population-and-housing-2011 (accessed on 6 July 2021).
  33. ACI—Automobile Club d’Italia, Italian Automotive Club. Statistical yearbook. Available online: https://www.aci.it/laci/studi-e-ricerche/dati-e-statistiche/annuario-statistico.html (accessed on 15 July 2021).
  34. TERNA—Rete Elettrica Nazionale, Italian TSO. Statistical Yearbook. Available online: https://lightbox.terna.it/it/annuario-statistico-2018 (accessed on 16 September 2021).
  35. STATISTA. Available online: https://www.statista.com/statistics/930504/average-number-of-hours-of-pv-systems-utilization-in-italy/ (accessed on 2 September 2021).
  36. Covenant of Mayors guidelines for Climate and Energy for the presentation of monitoring, Developed by Covenant of Mayors & Mayors Adapt Offices, Joint Research Centre of the European Commission. July 2016.
  37. GSE—Gestore dei servizi energetici, Italian Energy Systems Manager. Energia nel settore Trasporti. 005-2018. Available online: https://www.gse.it/dati-e-scenari/statistiche (accessed on 5 July 2021).
  38. ISPRA—Istituto Superiore per la Protezione e la Ricerca Ambientale. Atmospheric Greenhouse Gas Emission Factors in the National Electricity Sector and in the Main Countries Europeans. Available online: https://www.isprambiente.gov.it/it/pubblicazioni/rapporti/fattori-di-emissione-atmosferica-di-gas-a-effetto-serra-nel-settore-elettrico-nazionale-e-nei-principali-paesi-europei.-edizione-2020 (accessed on 26 June 2021).
  39. ISTAT—Istituto Nazionale di Statistica. Data and Micro Data, Energy Sector—Household Energy Consumption. Available online: https://www.istat.it/it/dati-analisi-e-prodotti/microdati (accessed on 20 July 2021).
  40. Ministero Per Lo Sviluppo Economico, Italian Economic Development Ministry. The National Energy Situation in 2018–2019. Available online: https://dgsaie.mise.gov.it/situazione-energetica-nazionale (accessed on 17 July 2021).
  41. GSE. Italian Energy Systems Manager, “Atlaimpianti”. Available online: https://www.gse.it/dati-e-scenari/atlaimpianti (accessed on 29 July 2021).
  42. ARERA Autorità di Regolazione per Energia Reti e Ambiente. Delibera n° 52/2004. Available online: https://www.arera.it/it/docs/04/052-04.htm (accessed on 29 July 2021).
  43. Sarbu, I.; Sebarchievici, C. Solar Radiation. In Solar Heating and Cooling Systems; Elsevier Inc.: Amsterdam, The Netherlands, 2017; pp. 13–28. [Google Scholar] [CrossRef]
  44. IEA—World Energy Outlook 2020, October 2020. Available online: https://www.iea.org/reports/world-energy-outlook-2020 (accessed on 16 September 2021).
  45. Economidou, M.; Atanasiu, B.; Despret, C.; Maio, J.; Nolte, I.; Rapf, O.; Laustsen, J.; Ruyssevelt, P.; Staniaszek, D.; Strong, D.; et al. Europe’s Buildings Under the Microscope, A Country-by-Country Review of the Energy Performance of Buildings; Buildings Performance Institute Europe (BPIE): Brussels, Belgium, 2011. [Google Scholar]
Figure 1. Flowchart of SEAP process.
Energies 14 05932 g001
Figure 2. Area of study: nine municipalities in the provinces of Teramo and Pescara in the Abruzzo region.
Energies 14 05932 g002
Figure 3. Percent share of consumption (a,c) and emissions (b,d) for each municipality. In (c,d) the specific consumption and emissions in the municipality competences sector are reported.
Energies 14 05932 g003aEnergies 14 05932 g003b
Figure 4. Trend in renewable energy production for each city.
Energies 14 05932 g004
Figure 5. Comparison of per capita consumption between 2005 and 2018.
Energies 14 05932 g005
Figure 6. Comparison of per capita emissions between 2005 and 2018.
Energies 14 05932 g006
Table 1. Truck fleet in Abruzzo region (2018), grouped for payload range (i-th).
Truck’s Payload Gi (Tons)<2.52.5 ÷ 3.53.5 ÷ 7.57.5 ÷ 1212 ÷ 1414 ÷ 1616 ÷ 32>32
#trucki39.13543.1745.5153.3326217086.42448
Table 2. Conversion coefficient (MWh/L), lower heating value (kWh/kg) and density (kg/L) for each fuel considered in the model.
Conversion Coefficient (MWh/Lfuel)Lower Heating Value (kWh/kgfuel)Density (kgfuel/Lfuel)
Gasoline0.009112.20.75
Diesel0.009911.80.835
LPG0.006612.80.52
Table 3. Value of energy demand (Qsurf, MWh/m2), distributed by number of floors above ground and construction year, and differentiated by climatic zone (C or D).
kWh/m2Climatic Zone “D”—Mild Cold WeatherClimatic Zone “C”—Temperate Weather
1 Floor2 Floors3 Floors4+ Floors1 Floor2 Floors3 Floors4+ Floors
Before 1945451278193178361222154142
1946–1960344278193178275222154142
1961–1980335223186168268179149134
1981–1990335219175153268175140122
After 19911761139281141907365
Table 4. Specific emissions factors (tons of CO2/MWh).
CategoryEmission Factor (tco2/MWh)
Electricity0.281
Natural gas0.202
Liquid gas0.231
Diesel0.267
Gasoline0.249
Biomass0
Solar thermal0
Table 5. Geographical and social information on the nine municipalities.
MunicipalityPopulationExtension (km2)Altitude (m)# of BuildingsPopulation Density
(inhab./km2)
Climatic Zone# of Tertiary Employees
Castilenti14222427248160D164
Castiglione M. R.21603130673170D292
Elice169114259588118D238
Giulianova23,27828684372831C3614
Mosciano S. A.9230482272083190D1174
Penne11,769914382534129D1431
Pineto14,8863842551392C2101
Roseto25,6895355229485C3569
Silvi15,3932022541770C2468
Table 6. Consumption for every city (MWh) and reduction as a percentage.
MunicipalityMWh (2005)MWh (2018)Δ (%)
Castilenti3972.934,807.6−10.7%
Castiglione Messer Raimondo62,220.454,190.5−12.9%
Elice43,988.741,506.1−5.6%
Giulianova454,235.2415,124.7−8.6%
Mosciano S. Angelo188,744.6166,827.5−11.6%
Penne272,972.8230,293.6−15.6%
Pineto277,172.8254,260.9−8.3%
Roseto506,362.6456,823.6−9.8%
Silvi305,489.1259,006.2−15.2%
Table 7. Overall emissions for each municipality considered (tCO2) and reduction as a percentage.
MunicipalitytCO2 (2005)tCO2 (2018)Δ (%)
Castilenti9169.46537.3−28.7%
Castiglione Messer Raimondo14,323.810,082.5−29.6%
Elice10,151.57781.1−23.3%
Giulianova112,292.583,984.9−25.2%
Mosciano S. Angelo45,579.333,596.3−26.3%
Penne65,710.245,620.8−30.5%
Pineto68,239.751,749.6−24.1%
Roseto123,089.591,331.3−25.8%
Silvi75,643.252,863.8−30.1%
Publisher’s Note: MDPI stays neutral with regard to jurisdictional claims in published maps and institutional affiliations.

