Article

Endpoint Use Efficiency Comparison for AC and DC Power Distribution in Commercial Buildings

1
Department of Systems Engineering, Colorado State University, Fort Collins, CO 80523, USA
2
National Renewable Energy Laboratory, 15013 Denver West Parkway, Golden, CO 80401, USA
3
Lawrence Berkeley National Laboratory, One Cyclotron Road, Berkeley, CA 94720, USA
*
Author to whom correspondence should be addressed.
Energies 2021, 14(18), 5863; https://doi.org/10.3390/en14185863
Submission received: 31 July 2021 / Revised: 8 September 2021 / Accepted: 12 September 2021 / Published: 16 September 2021
(This article belongs to the Special Issue Modeling and Simulation of Power Systems and Power Electronics)

Abstract

:
Advances in power electronics and their use in Miscellaneous Electric Loads (MELs) in buildings have resulted in increased interest in using low-voltage direct current (DC) power distribution as a replacement for the standard alternating current (AC) power distribution in buildings. Both systems require an endpoint converter to convert the distribution system voltage to the MELs voltage requirements. This study focused on the efficiency of these endpoint converters by testing pairs of AC/DC and DC/DC power converters powering the same load profile. In contrast to prior studies, which estimated losses based on data sheet efficiency and rated loads, in this study, we used part load data derived from real-world time-series load measurements of MELs and experimentally characterized efficiency curves for all converters. The measurements performed for this study showed no systematic efficiency advantage for commercially available DC/DC endpoint converters relative to comparable, commercially available AC/DC endpoint converters. For the eight appliances analyzed with the pair of converters tested, in 50%, the weighted energy efficiency of the DC/DC converter was higher, while, for the other 50%, the AC/DC converter was. Additionally, the measurements indicated that the common assumption of using either data sheet efficiency values or efficiency at full load may result in substantial mis-estimates of the system efficiency.

1. Introduction

Since the “war of the currents” in the 19th century, alternating current (AC) has been the predominant method for electrical power transmission and distribution due to the ease of voltage conversion using transformers and the practical advantages of three-phase systems in electrical machines [1]. However, advances in power electronics have increased direct current (DC) voltage conversion efficiency and lowered its cost, increasing interest in DC distribution at all scales. In addition, because low-voltage DC power distribution (≤60 VDC in the United States (U.S.)) does not require all cable runs to be in conduit, it can potentially be implemented at a lower cost than AC distribution in commercial buildings.
Commercial buildings consume 35% of all electricity in the U.S. [2]. Commercial building loads include a large number of electronic devices that are classified as “miscellaneous electric loads” (MELs), i.e., loads that are not related to the building’s core functions—lighting or heating, ventilation, and air conditioning (HVAC). MELs are also known as plug and process loads (PPLs). In 2017, MELs represented 40% of the electrical load in commercial buildings in the U.S.; this is projected to increase to 49% by 2040 [3].
As the majority of MELs in commercial buildings are electronic, they operate internally on DC. When connected to an AC distribution system (DS), they require an AC/DC converter to provide power at the correct DC voltages. While a DC DS could theoretically avoid a converter between the DC DS and the MEL, in most cases the DC DS operates at a different voltage than the MEL. Therefore, most MELs still require a DC/DC converter when connected to a DC DS. We term this last voltage/power conversion stage, which exists in both systems, as the ‘endpoint conversion’. The focus of this study is to characterize the efficiency of commercially available DC/DC endpoint power converters relative to existing, standard, AC/DC converters supplied with most MELs.
Other elements of a building’s power system also impact the efficiency of the entire building, including the performance of lighting, HVAC, on-site generation and/or storage when coupled to each type of distribution system; variations in distribution system voltage for nascent DC systems; and losses related to power quality issues in either system [4,5,6,7,8]. These other loads and systems were not included in this study but could be similarly analyzed.
Although DC loads are not often designed to leverage the unique advantages of DC DS [9], one argument in favor of a DC DS over an equivalent AC DS is that the DC/DC conversion efficiency is typically thought to be higher than AC/DC conversion efficiency [10,11,12]. AC/DC converters require a rectifier followed by a capacitor to reduce the ripple on the internal DC bus. This bus voltage is then level-shifted using an additional stage of DC/DC conversion for the desired output voltage. In some cases, rectification and DC/DC conversion are combined in a single module. Rectification introduces additional losses relative to DC/DC converters, which do not require rectification, and this is one reason DC/DC converters are often considered to be fundamentally more efficient.
Few DC distributions systems have been built at scale. Therefore studies using varying inputs provide the only comparisons between the two distribution strategies. Some simulation studies indicate that a DC DS can be significantly more efficient than a traditional AC DS [13,14,15,16]. For example, in simulations considering U.S. offices ([17]), DC DS achieved a 9.9–18.5% in efficiency savings for zero net energy buildings serving small and medium-size offices provided the building had ample battery storage.
This simulation, however, assumed that MELs would be designed to connect directly to the DC bus, not requiring endpoint converters; currently few MELs of this type exist. Another simulation ([4]) reported that a residential DC DS, without on-site generation or storage, presented a 1.5–4.7% in efficiency improvement in comparison with a conventional AC DS. The simulation used load-packaged DC/DC converters to replace the AC/DC counterparts but did not report the efficiency for them.
Prior studies have been hampered by a lack of detailed data on the efficiency of converters and statistical data on the power levels of converter loads. For example, a study in Sweden analyzed a low voltage DC DS for offices and commercial facilities using operating voltage levels of 48, 120, 230, and 326 VDC by assuming that all converters operated at the rated power of the appliances [15]. The authors in [16] assumed that AC power converters had an efficiency rating of 90%, while DC converters had 95%, 97%, and 99.5%, based on a survey that considered a constant value for the efficiency of the converters when operating at different power levels. Nevertheless, the authors stated that DC/DC converters seldom achieved 95% efficiency in practice, and therefore concluded that the most relevant factor for improving DC DS efficiency relative to AC DS efficiency is to improve the efficiency of DC/DC converters through technology advancements.
Other studies suggest that DC DS might not exhibit better efficiency than AC DS. An investigation of a small residential DC DS found that when DC converters operate at part load their efficiency is significantly worse than when operating at full load [18]. The lower efficiency at partial load is mainly due to economic factors, including the use of low-quality electronic components [19] and a tendency to prioritize factors other than efficiency, such as size and cost, when manufacturing or procuring power supplies.
Some organizations and programs promote higher efficiency, such as Energy Star [20,21], Climate Savers [22,23], DOE level VI efficiency standards for wall adapters [24,25], and 80 PLUS [26,27]. The latter, for instance, certifies power supplies that achieve at least 80% efficiency in energy conversion at 20%, 50%, and 100% of rated load [28] and also offers higher tiers of certification (bronze, silver, gold, etc.) for higher efficiency levels. Additionally, although studies such as [29] state that efficiencies are better for high voltage DC (500 V), DC efficiencies at this voltage are similar to those of similar AC voltages, which are typically not used for comparisons in the literature.
For equivalent voltages, wiring conduction losses in building distribution systems have been found to be lower in a DC DS compared to an AC DS [30]. Low voltage DC systems require larger currents for the same power transfer. As copper losses are proportional to the square of the current, this can cause unacceptable losses if the DC voltage selected is too low for the load being served [15]. However, the same is true regarding voltage selection for AC loads. The majority of loads inside buildings do not require high voltage [16] and conduction losses are not generally the primary motivation for selecting a voltage level. Prior research has established that in well-designed systems, conduction losses are mostly negligible when compared to power converter losses [17,18,31]; we therefore do not consider wiring losses in the present analysis.
Other research focused on power flow modeling of AC, DC and hybrid distribution systems [32,33]. To further understand AC and DC distribution choices, this study focused specifically on the efficiency of commercially available AC/DC and DC/DC end-use converters for common MELs, considering common DC DS voltages: 24 and 48 VDC. The majority of the existing literature in this area used loss estimations based upon data sheet information and constant values for converter efficiency [34,35].
In contrast, this study performs all analyses using (a) time-series load data collected directly from deployed electronic devices commonly found in an office environment [36] and (b) the characterized efficiency for the full load range of each converter. The time series allows the measured converter efficiency to be weighted by actual load, producing more realistic estimations of converter efficiency. This is the key contribution of the present analysis. Section 2 explains the methods used in this study; Section 3, the results achieved; and Section 4 summarizes the lessons learned.

2. Methods

This study focused on the efficiency of endpoint power conversion, that is, the last voltage level conversion prior to power delivery to a MEL’s internal DC circuitry (see discussion in Section 2.5). The methods required for this study are:
i.
Characterize the efficiency of endpoint converters across their full load range.
ii.
Characterize realistic loads observed in office MELs by acquiring time-series load data.
iii.
Weight the converter efficiency by the observed load levels to create a weighted energy efficiency comparable between AC/DC and DC/DC test converters.
This approach is analogous to the weighted efficiency technique developed for comparing the performance of photovoltaic inverters adopted by the California Energy Commission [37,38]. Additionally, the study characterized a single available central AC/DC converter to understand how its efficiency compared with that of in-building, step-down transformers.
The central challenge in comparing endpoint efficiency is that most MELs are not available in versions that support both AC and DC power systems. Most are available only in an AC version that includes either an internal or external AC/DC converter. DC versions are uncommon, and when available, are often tailored for automotive applications (12 VDC), rather than the distribution voltages commonly utilized in commercial buildings [15]. To address this issue, converter testing for this study was conducted by using matched pairs of converters.
Each pair included a commercially available AC/DC and a DC/DC converter (hereafter test converters) with similar power ratings and the same voltage outputs. The power ratings and voltages were selected to reflect those seen in MELs utilized elsewhere in the study, primarily office equipment, such as laptops, monitors, and network equipment. Table 1 summarizes the identification and ratings of all units.
Each power converter was characterized in laboratory conditions using controlled loads (not the MEL itself), to construct efficiency curves across the full rated power range of the converter, primarily because, as noted in detail below, most MELs do not operate at the full rated load of their power supplies. Long duration appliance load recordings were then used to weigh the efficiency curves by a realistic mix of load levels to calculate the weighted energy efficiency for both AC/DC and DC/DC appliance configurations. The resulting weighted endpoint conversion efficiency can be compared within each pair of converters.
Selecting pairs of converters simulates the likely design process that would be used to convert a MEL from the common AC-input version to a DC-input version for use with a DC DS—i.e., the design engineer would select a DC/DC power converter that (a) accepts the correct input voltage provided by the DC DS, (b) produces the same outputs as the AC/DC converter, and (c) serves the same anticipated load as the AC/DC converter. It is important to note that the paired selections made by the study team do not optimize either the AC/DC or the DC/DC converter efficiency.
Instead, the AC/DC converter is ‘given’—i.e., was the exact converter, or a close duplicate of the converter, from a MEL included in the study—while the DC/DC converter was selected from common power supply vendors to have the same rated power and the same output voltages. In actual practice, a design engineer may select a DC/DC converter with higher or lower efficiency than the converter selected for this study. Therefore, for some power ratings, we test more than one matched pair to illustrate how performance may vary when selecting different DC/DC converters to replace an existing AC/DC converter.
The DC market is not yet as mature and well-established as the AC; most of the commercially available DC converters are limited to automotive 12/24 VDC applications. Therefore, the availability of DC converters was significantly lower than those that operate in AC. This market limitation is reflected in the number of manufacturers for our sampled DC converters and is, consequently, a limitation of this work (see Section 4.3).

2.1. Test Converters Characterization

This study focused on four types of MELs typically found in an office environment: laptops, desktops, monitors, and network appliances (e.g., switches and routers). Table 2 shows all monitored appliances together with their matched test converters. Some appliances were not linked to any test converter, as it was not possible to find converters with equivalent or similar power ratings. These appliances were not included in the endpoint efficiency comparison between AC and DC DS; however, their power profiles were considered in the grouped appliances’ operational power range analysis (Figure 1). The purpose of this analysis is to capture a realistic load range during operation.

2.2. Converter Types

In addition to input and output voltage, converters may also be classified by the number or range of acceptable input voltages and the number and capacity of output voltages. Converters generally fall into four classifications by input and output configuration: single or multiple input (SI or MI) and single or multiple output (SO or MO); a single-input, single-output unit is a ‘SISO’ converter. In practice, multiple input converters are rare but SISO and SIMO types are common. Of the 14 test converters purchased for this study, six were SISO and eight were SIMO converters.
Loads in commercial buildings vary substantially in the power rating and voltages used internally. Computer work stations and monitors, for instance, typically have SIMO internal power converters; common outputs are 3.3/5/12 VDC and 5/12/24 VDC. Laptops typically have SISO converters rated at 18–19.5 VDC; other voltages are created on the computer’s motherboard. To match this diversity of loads, the study utilized several configurations of commercially available test converters.
All the AC/DC converters were tested at 120 VAC, 60 Hz, the typical office supply voltage in the U.S., although many accept input voltages over 200 VAC. Most DC/DC test converters were tested at an input voltage of 24 VDC, which is the voltage standard in the Occupied Space Standard proposed by the EMerge Alliance [39]. However, for monitors, the study also included DC test converters rated at 48 VDC (representative of the Power over Ethernet standard [40]), allowing a comparison of endpoint efficiency between 120 VAC, 24 VDC, and 48 VDC for a subset of MELs.
Efficiency for SISO converters was characterized using controllable resistive load banks. Loads varied from no load to the converter’s rated power, in 10 load steps of approximately equal size. For SIMO converters, multiple scenarios with specific load levels were applied across the three output ports (scenarios are listed in Section 3). Since some SIMO converters had one output rated at 24 VDC, a higher voltage than the available resistive load banks, the study used BK Precision 8614 DC electronic load bank to load the 24 V port. All measurements were made using a Keysight PA2203A power analyzer (PA) for both input and output power on each port. The PA has an accuracy of 0.05% for voltage and current measurements and 0.1% for power measurements.
Efficiency at the ith load level of an AC/DC ( η A C i ) or DC/DC ( η D C i ) converter was calculated using Equations (1) and (2), which also define the relevant power terms for subsequent equations:
η AC i = P out ( DC ) i P in ( AC ) i
η DC i = P out ( DC ) i P in ( DC ) i

2.3. Power Monitoring

Load profiles used in the study were measured at 1 Hz on in-use office appliances. Measurements were made for approximately 2 months using WEMO™ smart plugs (Model F7C029V2, rated for 120 VAC/15 A). The smart plug has a steady-state accuracy of 0.05 W; however, its readings exhibit a time-constant-like delay when power levels change rapidly. The time constant was characterized by applying resistive load steps to the smart plugs and fitting the rising and decaying curves to a first-order transfer function ( 1 τ s + 1 ); fitting produced τ = 2.77 s.
The load profiles were then corrected by applying an approximate inverse transfer function using Matlab™ Simulink™. Once corrected, the loads were binned at 1 W intervals for all periods when the MELs were on (defined as load ≥ 1 W) to build load probability distributions for each MEL. Note that this correction substantially recovers the (typically short-duration) peak loads of the MELs that are otherwise attenuated in the smart plug recordings.

2.4. Endpoint Efficiency Weighted by Time Series Load Data

The efficiency of a power converter varies with the load, typically with lower efficiency at lower power levels. Therefore, to estimate the operational efficiency of the converter, it is necessary to weigh the converter’s efficiency by time series load data to compute the weighted energy efficiency of the converter. In general, there was insufficient access to each MEL’s converter to measure the DC output of internal converter(s) while monitoring equipment deployed in a non-laboratory office environment. Therefore, the DC output power was estimated using the conversion efficiency of the AC test converter, as in Equation (3).
P out ( DC ) i = P in i × η AC i
where i indicates the ith power bin, i = 1 … N, where N is the number of power bins for rated load of the converter.
This step translated the measured AC load from long-duration recordings to an estimate of DC output power consumed by the MEL. It also assured that the AC/DC efficiency was that of the chosen test converter, rather than the converter supplied with the MEL, which, in a few cases, may have higher or lower efficiency than the test converter. To estimate DC input power for DC/DC converters, the process was reversed (Equation (4)): The estimated output power calculated for each bin in Equation (3) was divided by the corresponding efficiency value of the DC/DC test converter to estimate the DC input power.
P in ( DC ) i = P out ( DC ) i η DC i
Time series load data provides the fraction of time ( γ i ) that a device operates at each load level bin, i, considering only times when the MEL load exceeded 1 W. Equations (5) and (6) were used to compute the weighted (or net) efficiency for the AC/DC and DC/DC test converters—i.e., comparable, weighted, endpoint use efficiency. Note that the binned power interval, i, varies from the lowest ‘on’ load bin to the converter’s rated power. In practice, the center of each load bin was utilized as the load for each bin. For example, γ 1 is the fraction of 1 Hz load samples where 1 W P in < 2 W, and the power value for the bin is P in 1 = 1.5 W. Similarly, the last bin, which ends with the converter’s rated power, has a value of P in N = Rated Power 0.5 W.
η net ( AC ) = i = 1 N P out ( AC ) i × γ i i = 1 N P in ( AC ) i × γ i
η net ( DC ) = i = 1 N P out ( DC ) i × γ i i = 1 N P in ( DC ) i × γ i

2.5. Context Summary

A typical layout for an AC and a DC distribution in commercial buildings is shown in Figure 2. In an AC building, on-site energy storage or generation, which are often DC internally, must be converted to AC by inverters. In a DC building, these sources are typically coupled to the DC bus via a DC/DC converter, for example, a maximum peak power tracker for PV or wind generation. This study did not compare the efficiency of coupling storage and generation to either type of distribution system.
Assuming the building is coupled to grid power, an AC DS in commercial buildings often has step-down transformers inside the building while the DC DS requires a central AC/DC converter that converts AC grid power to the DC DS voltage. (There are exceptions where AC systems may not have step-down transformers, or DC systems may require a DC/DC converter to couple the DC DS to a higher voltage DC bus.) Some limited published measurements of efficiency exist for step-down transformers [41,42], which are often substantially underloaded [43]. As the current study did not have access to in-building transformers to characterize, no measurements were performed in this area. In contrast, the study had access to one central AC/DC converter—a class of device for which there are few published measurements. Therefore, the central converter was measured, and the results are included below.
Therefore, the AC DS and DC DS architectures most often have analogous components. For grid connected buildings, the step-down transformer in the AC DS case fulfills the same purpose as the central AC/DC converter for the DC DS, while inverters coupling local generation and storage to the AC DS fulfill the same purpose as DC/DC converters for the DC DS. The scope of the study did not support measurement of all components of these two architectures, and comparisons do not include the performance of these components.
Rather, this paper focuses on the endpoint conversion efficiency: i.e., comparing the weighted efficiency of the AC/DC converter needed to connect a MEL to the AC DS, to the comparable DC/DC converter necessary to connect the same MEL to a DC DS. As noted earlier, prior studies have concluded that the endpoint conversion efficiency of DC DS exceeds that of an AC DS [10,11,12]. This study performed pairwise comparisons of commercially available converters to determine if this DC advantage exists in practice, and if so, how large the advantage is.

3. Results

3.1. Power Consumption Monitoring

Figure 1 and Table 3 summarize the load distribution for the 20 office appliances analyzed when on (i.e., power consumption ≥ 1 W). The data comprised three laptops, 13 monitors, two computer work stations, and two network appliances.
These data illustrate that MELs operate at substantially less than their rated load most of the time. In the measured data, monitors operated below 66.7% of their rated power 90% of the time, while laptops, desktops, and network appliances always operated below 32.3% of their rated power. These data showed that the typical operation is significantly below the rated power of the converter—i.e., the converters were oversized relative to the maximum power recorded while in use. This oversizing may be due to features in the appliances that are seldom utilized, design decisions, or product line requirements to use the same adapter for a range of products. As loads in a typical application are compressed into the lower end of the converter’s power rating, the lower 1 / 3 to 1 / 2 of the converter’s efficiency curve had a determinant impact on the weighted energy efficiency of these converters.

3.2. Converter Selection

Test converters were matched to appliances by power rating and output voltage(s), as shown in Table 2. In all cases, converters exactly matched the output voltage found in the appliance’s original internal or external converter. The match in power rating was less exact, due to poor commercial availability of both AC/DC and DC/DC converters, which precisely matched both the output voltage and output power ratings. The rated power of converters 3–6 matched the rated power of their linked appliances, while the rated power of the others were approximate matches.
Additionally, within each pair of test converters, both the power rating and output voltage(s) matched exactly. These controls assured that the test converters were representative of the converters in the test appliances and, more importantly, pairs of AC/DC and DC/DC converters were closely matched to assure that comparisons of endpoint efficiency were valid.

3.2.1. Single Input Single Output (SISO) Test Converters

Three pairs of test converters were SISO (converter pairs 1–2, 3–4, and 5–6), which were characterized across the full range of power using controllable load banks. Load recordings for these converters were taken from three laptops and one router (Figure 3). From Figure 1, the sampled MELs seldom operated above 33% of the rated power, and often operated below that level—at median loads of 13.3%, 7.0%, and 5.6% for laptops, desktops, and network appliances, respectively. As the efficiency of DC/DC converters was lower at low load levels, the DC/DC converter in each pair of SISO converters typically had lower weighted energy efficiency than the AC/DC converter.
Table 4 summarizes the data in Figure 3, focusing on the lower load range, at discrete fractions of rated power. In pair 1–2, the AC/DC converter efficiency exceeded that of the DC/DC converter at all loads. For pair 3–4, the DC/DC converter had lower efficiency below 10% load and higher efficiency above that load. Since the HP laptop load level was above 10% for 99.8% of the time, the DC weighted energy efficiency was better than the AC for this case.
For pair 5–6, the DC/DC converter has lower efficiency below 15% load—a load level that occurred 80.8% of the time to Microsoft laptop 1 and 82.4% for Microsoft laptop 2—and higher efficiency for the remainder of the load range, peaking at 35% load. However, since the laptops were loaded above 35% load for 0.7% and 0.4% of the time, respectively, the weighted energy efficiency of the DC/DC converter is lower than that of the AC/DC converter for these appliances.
Net delta efficiency is defined as the difference between the DC/DC weighted energy efficiency minus the AC/DC weighted energy efficiency. Only the HP laptop had a better performance in DC, contradicting the common argument that DC converters are more efficient than AC. For the other three devices (Microsoft laptops 1 and 2, and Netgear WNR2000 v3) the AC/DC converter was more efficient for the period analyzed, primarily because these devices had their highest frequency of operation at low power, exactly where the AC/DC test converters exhibited higher efficiency than the DC/DC units.
In contrast, had this analysis utilized only the efficiency at the rated power for all load levels, as is often done in the literature, the converters would yield substantially different results: the DC/DC converter would have higher efficiency than the AC/DC converter for three of the four appliances analyzed. This emphasizes the need to utilize recorded loading data when assessing the weighted energy (i.e., practical) efficiency of converters. It also suggests that more attention must be paid to the operational efficiency of DC/DC converters at realistic load levels.

3.2.2. Single Input Multiple Output (SIMO) Test Converters

Monitors, desktops, and some network appliances make use of SIMO AC/DC converters, typically as internal power supplies, to power different electronic circuits at different voltage levels. This section analyzed eight SIMO test converters rated at 70, 110, and 185 watts, all from the same manufacturer: Integrated Power Designs. The test converters rated at 70 and 110 W were representative of those used in computer monitors. For these power ratings, one AC/DC test converter rated at 120 VAC (input voltage) was paired with two DC/DC converters: one rated for 24 VDC input, the other 48 VDC input—two common DC distribution voltages proposed for commercial buildings [15,39].
The three output ports on each converter operated at 5, 12, and 24 VDC. The 185 W test converters were representative of power supplies for a network-attached storage device (Netgear RND-6C). The AC/DC version was rated for 120 VAC input; the DC/DC for 24 VDC. For this pair, the three output ports operate at 3.3, 5, and 12 VDC.
To perform efficiency tests with these converter models, load levels were defined based on the realistic load levels shown in Figure 1. There were five scenarios for each load level, in which each of the three output ports were loaded with different power values such that the sum of the total load in all ports remained the same for all scenarios. The efficiency was compared across these combinations of output load to determine if there was a significant change in the converter’s efficiency based on how the ports were loaded. As an example, for test converter 7, at 30% load, measurements for output power in the five scenarios had a mean of 20.2 W and a standard deviation of 0.32 W; for efficiency, the measurements resulted in 64.8% ± 0.81%.
For test converter 8, at the same load, the measurements for output power and efficiency were 20.3 W ± 0.29 W and 69.7% ± 0.80%, respectively. As the variations were below 2% of the mean for all SIMO converters, this indicated that most of the losses occur in the switching components of the power supply. Therefore, the efficiency and the output power for each load level was defined as the mean of the efficiency and the mean of output power, respectively, for the five loading scenarios. This methodology allowed SIMO converters to be analyzed using the same comparisons as those used for SISO converters, where we calculated the weighted energy efficiencies of the test converters based on their single efficiency curves and the matching appliance’s time series load data.
The manufacturer specified that a minimum load of 10% on output 1 (5 VDC or 3.3 VDC depending on the model) was required for the power supply to properly regulate the other outputs. To meet this requirement, port 1 was always ≥10% of rated power, and if the total load was below 10% of the rated power, only port 1 was loaded.

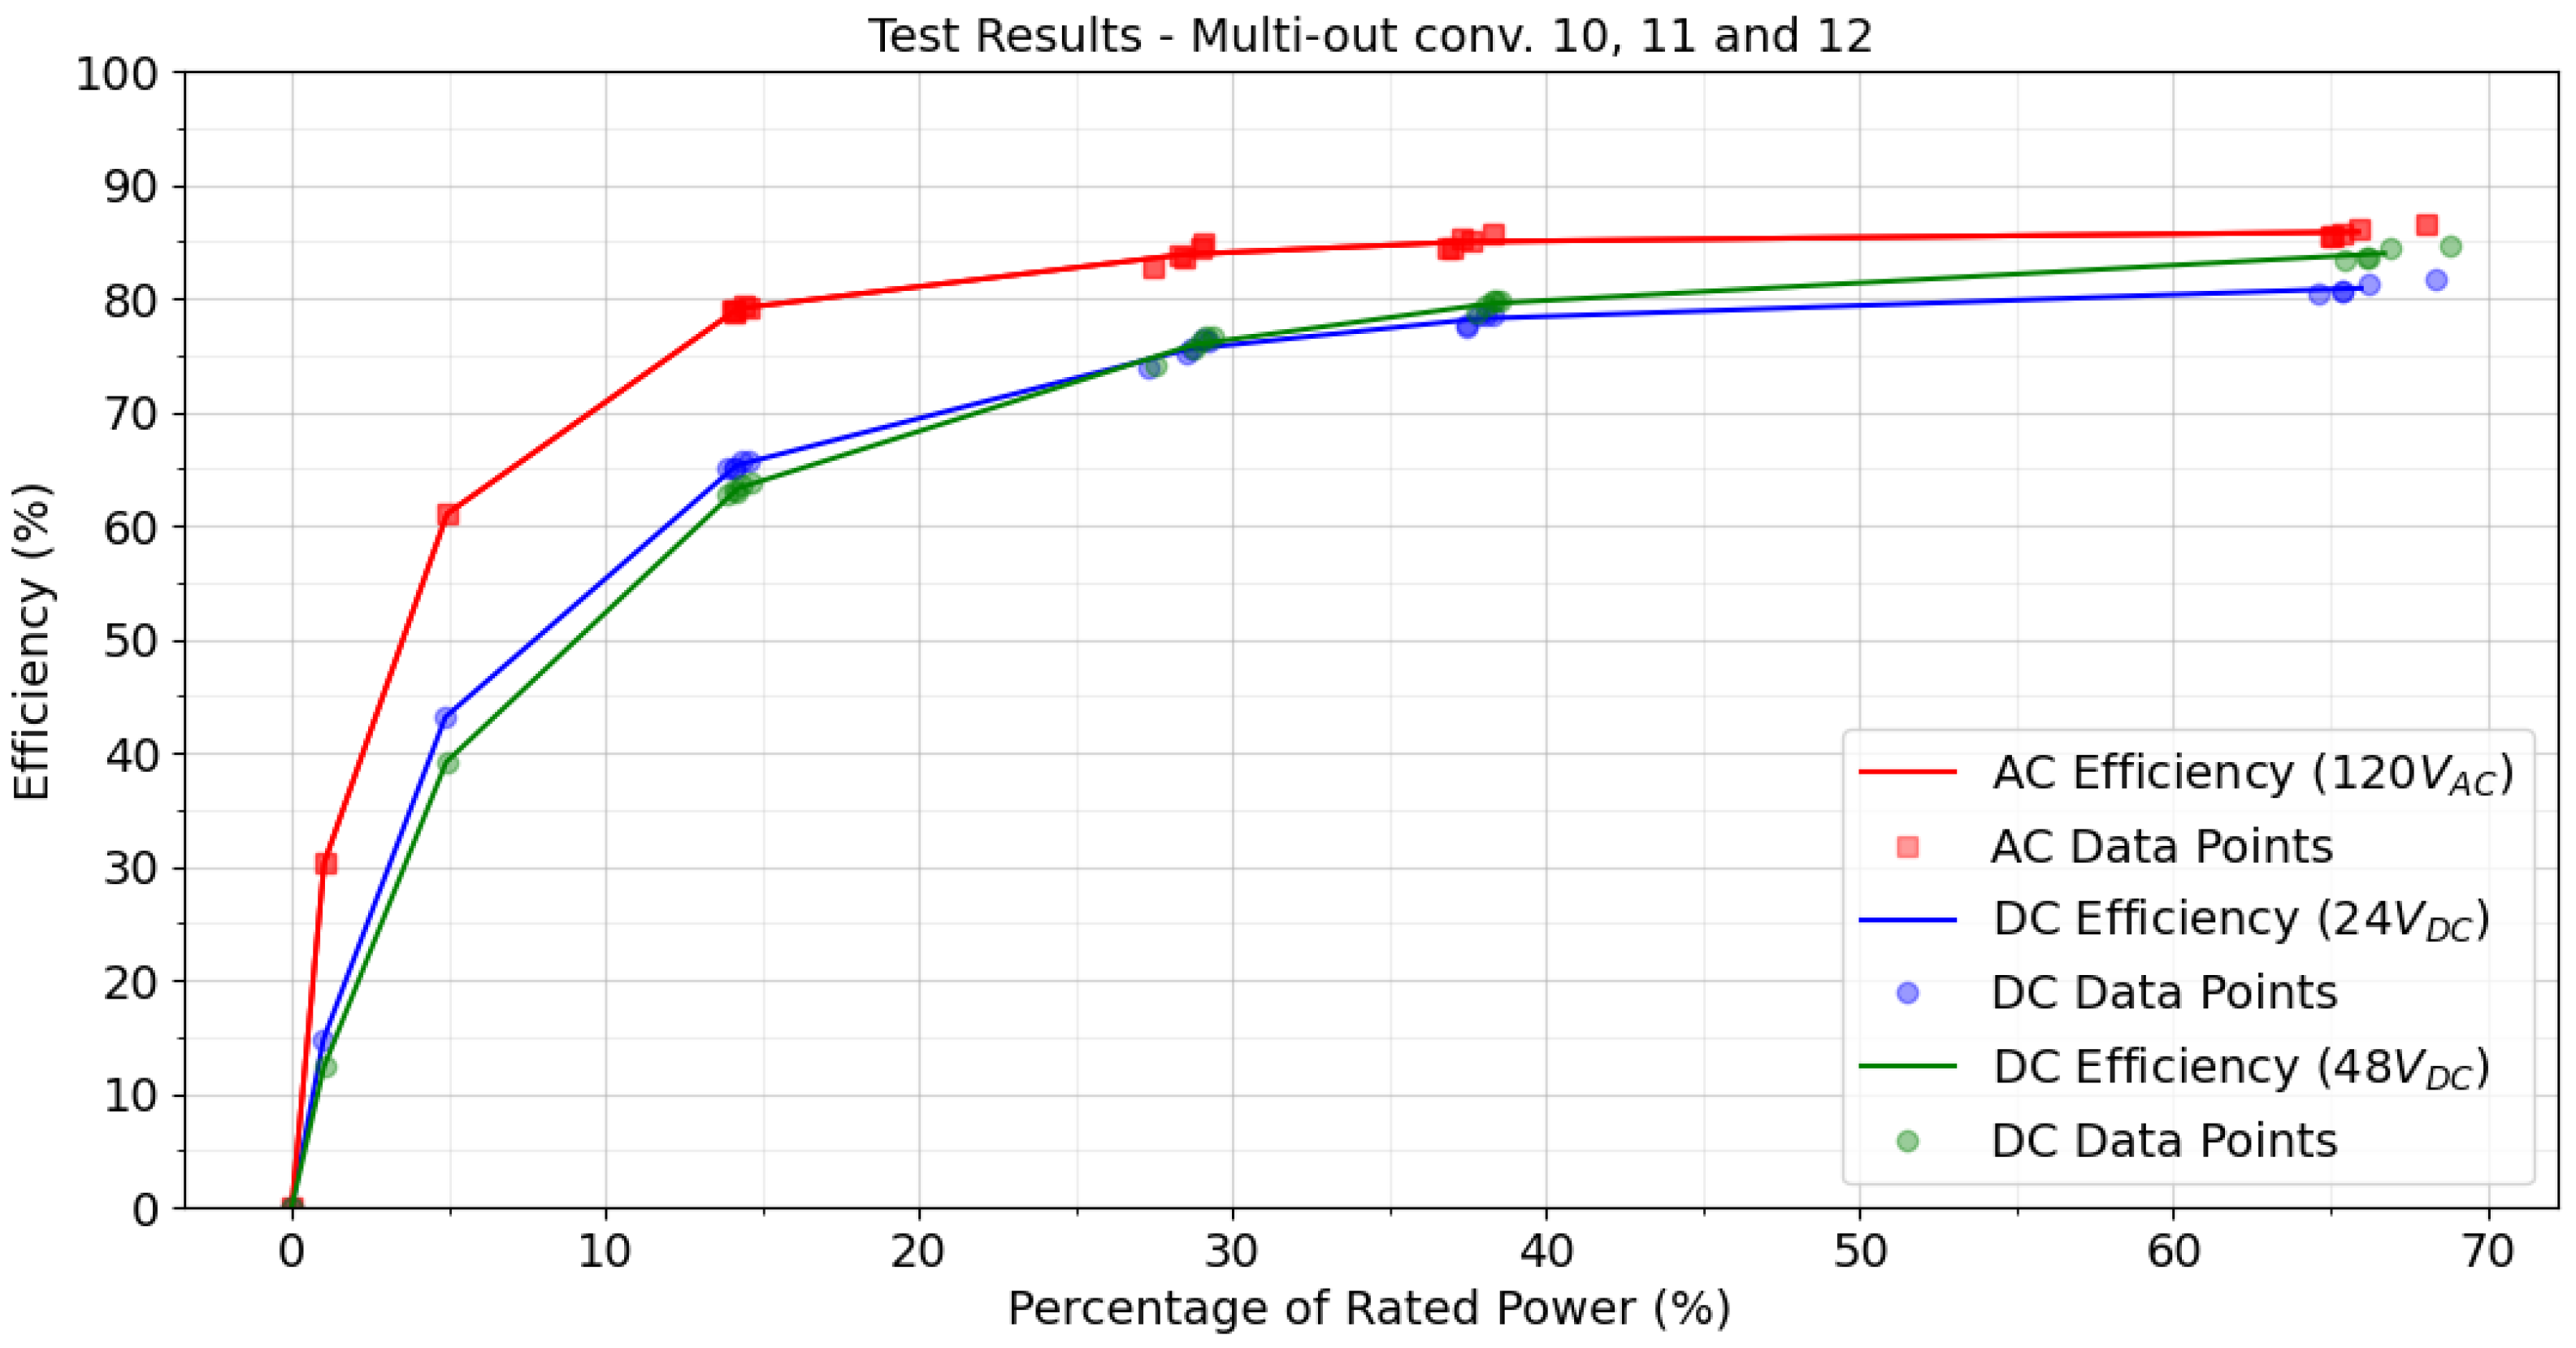
3.2.3. 70 W SIMO Test Converters

To illustrate this loading plan, Table 5 shows the test plan for the 70 W test converters. Max Power (W) is the maximum load that the resistive load banks could handle at the corresponding testing voltage; when not specified, the port was loaded with the BK Precision controllable load. The resulting efficiency curves for these converters are shown in Figure 4; the close grouping of data points indicates that changes in the output loading at one aggregate load level had little impact on the efficiency of the converter.
Both 70 W DC/DC converters (24 VDC and 48 VDC input) exhibited higher efficiency compared with the comparable AC/DC converter across the entire tested power range. When loaded above 1% of the rated power, the efficiency of the 48 V DC/DC converter exceeded that of the 24 V converter.
In Table 6, the delta efficiency peaks near 5% of rated power: +6.8% and +8.1% for 24 VDC and 48 VDC converters, respectively. The difference decreased to 2.0% and 4.7%, respectively, when the converters were loaded at 70% of rated power. Therefore, for these converters, the largest efficiency advantage for DC/DC versions falls at load levels often seen in MELs.
The weighted energy efficiency was simulated using time series load data of two computer monitors: an Acer model CB421HYK and a Phillips model 288P6L, both rated at 60 W. Figure 5 shows the results for this simulation, and Table 7 summarizes the net delta efficiency. Given the higher efficiency of the DC/DC test converters at all power levels, the weighted energy efficiency of the DC/DC converters was higher than that of the AC/DC converter. However, a substantial fraction of the appliance’s operating time was at load levels higher than the load levels where the DC/DC converters exhibited the highest efficiency advantage (5–15% of the rated power). The Acer monitor, for instance, operates outside this range 99.8% of the time; the Phillips Monitor, 32.0%.
The full load efficiencies for converters 7, 8, 9 were measured in a separate experiment, and they were equal to 76%, 76.3%, 80%, respectively. These values are close to the efficiency provided by the converters’ data sheet, which is estimated at 78% at full power for these three converter models. However, if we consider the weighted energy efficiency for the Acer Monitor, using converters 7, 8, and 9, it was 16.5%, 11.7%, and 14% lower than the efficiency of the converters at full-load, respectively. For the the Phillips Monitor, those values were 14.6%, 9.8%, and 12.2%, respectively.

3.2.4. 110 W SIMO Test Converters

The same procedure described for the 70 W SIMO test converters was followed for the 110 W SIMO converters. Figure 6 shows the efficiency curves for the test converters 10, 11, and 12. Further details are in the Supplemental Material: Table S1 shows the test plan, and Table S2 shows the delta efficiency, following the same methodology as above.
For the 110 W test converters, contrary to both the 70 W SIMO converters and data published in other studies, both DC/DC converters had significantly worse performance than of the comparable AC/DC converter. The biggest difference in efficiency occurred when loaded at 5% of rated capacity: −17.9% for the 24 VDC version and −21.8% for the 48 VDC. This difference decreased to −4.9% and −1.9% at loads of 70% of rated power.
The weighted energy efficiency simulation used the load data of a Dell monitor, model P2315Qp, rated at 90 W. Figure 7 shows the results of the simulation, and Table 8 shows the net delta efficiency for both DC input voltages. The weighted energy efficiency was 68.0% in 120 VAC, 48.0% in 24 VDC, and 33.5% in 48 VDC. The AC/DC weighted energy efficiency was significantly better than the DC/DC results, with net delta efficiencies ranging from −20 to −34.5% (see Table 8). The 48 VDC converter was less efficient than the 24 VDC at loads below approximately 30% of the rated power, but more efficient above.

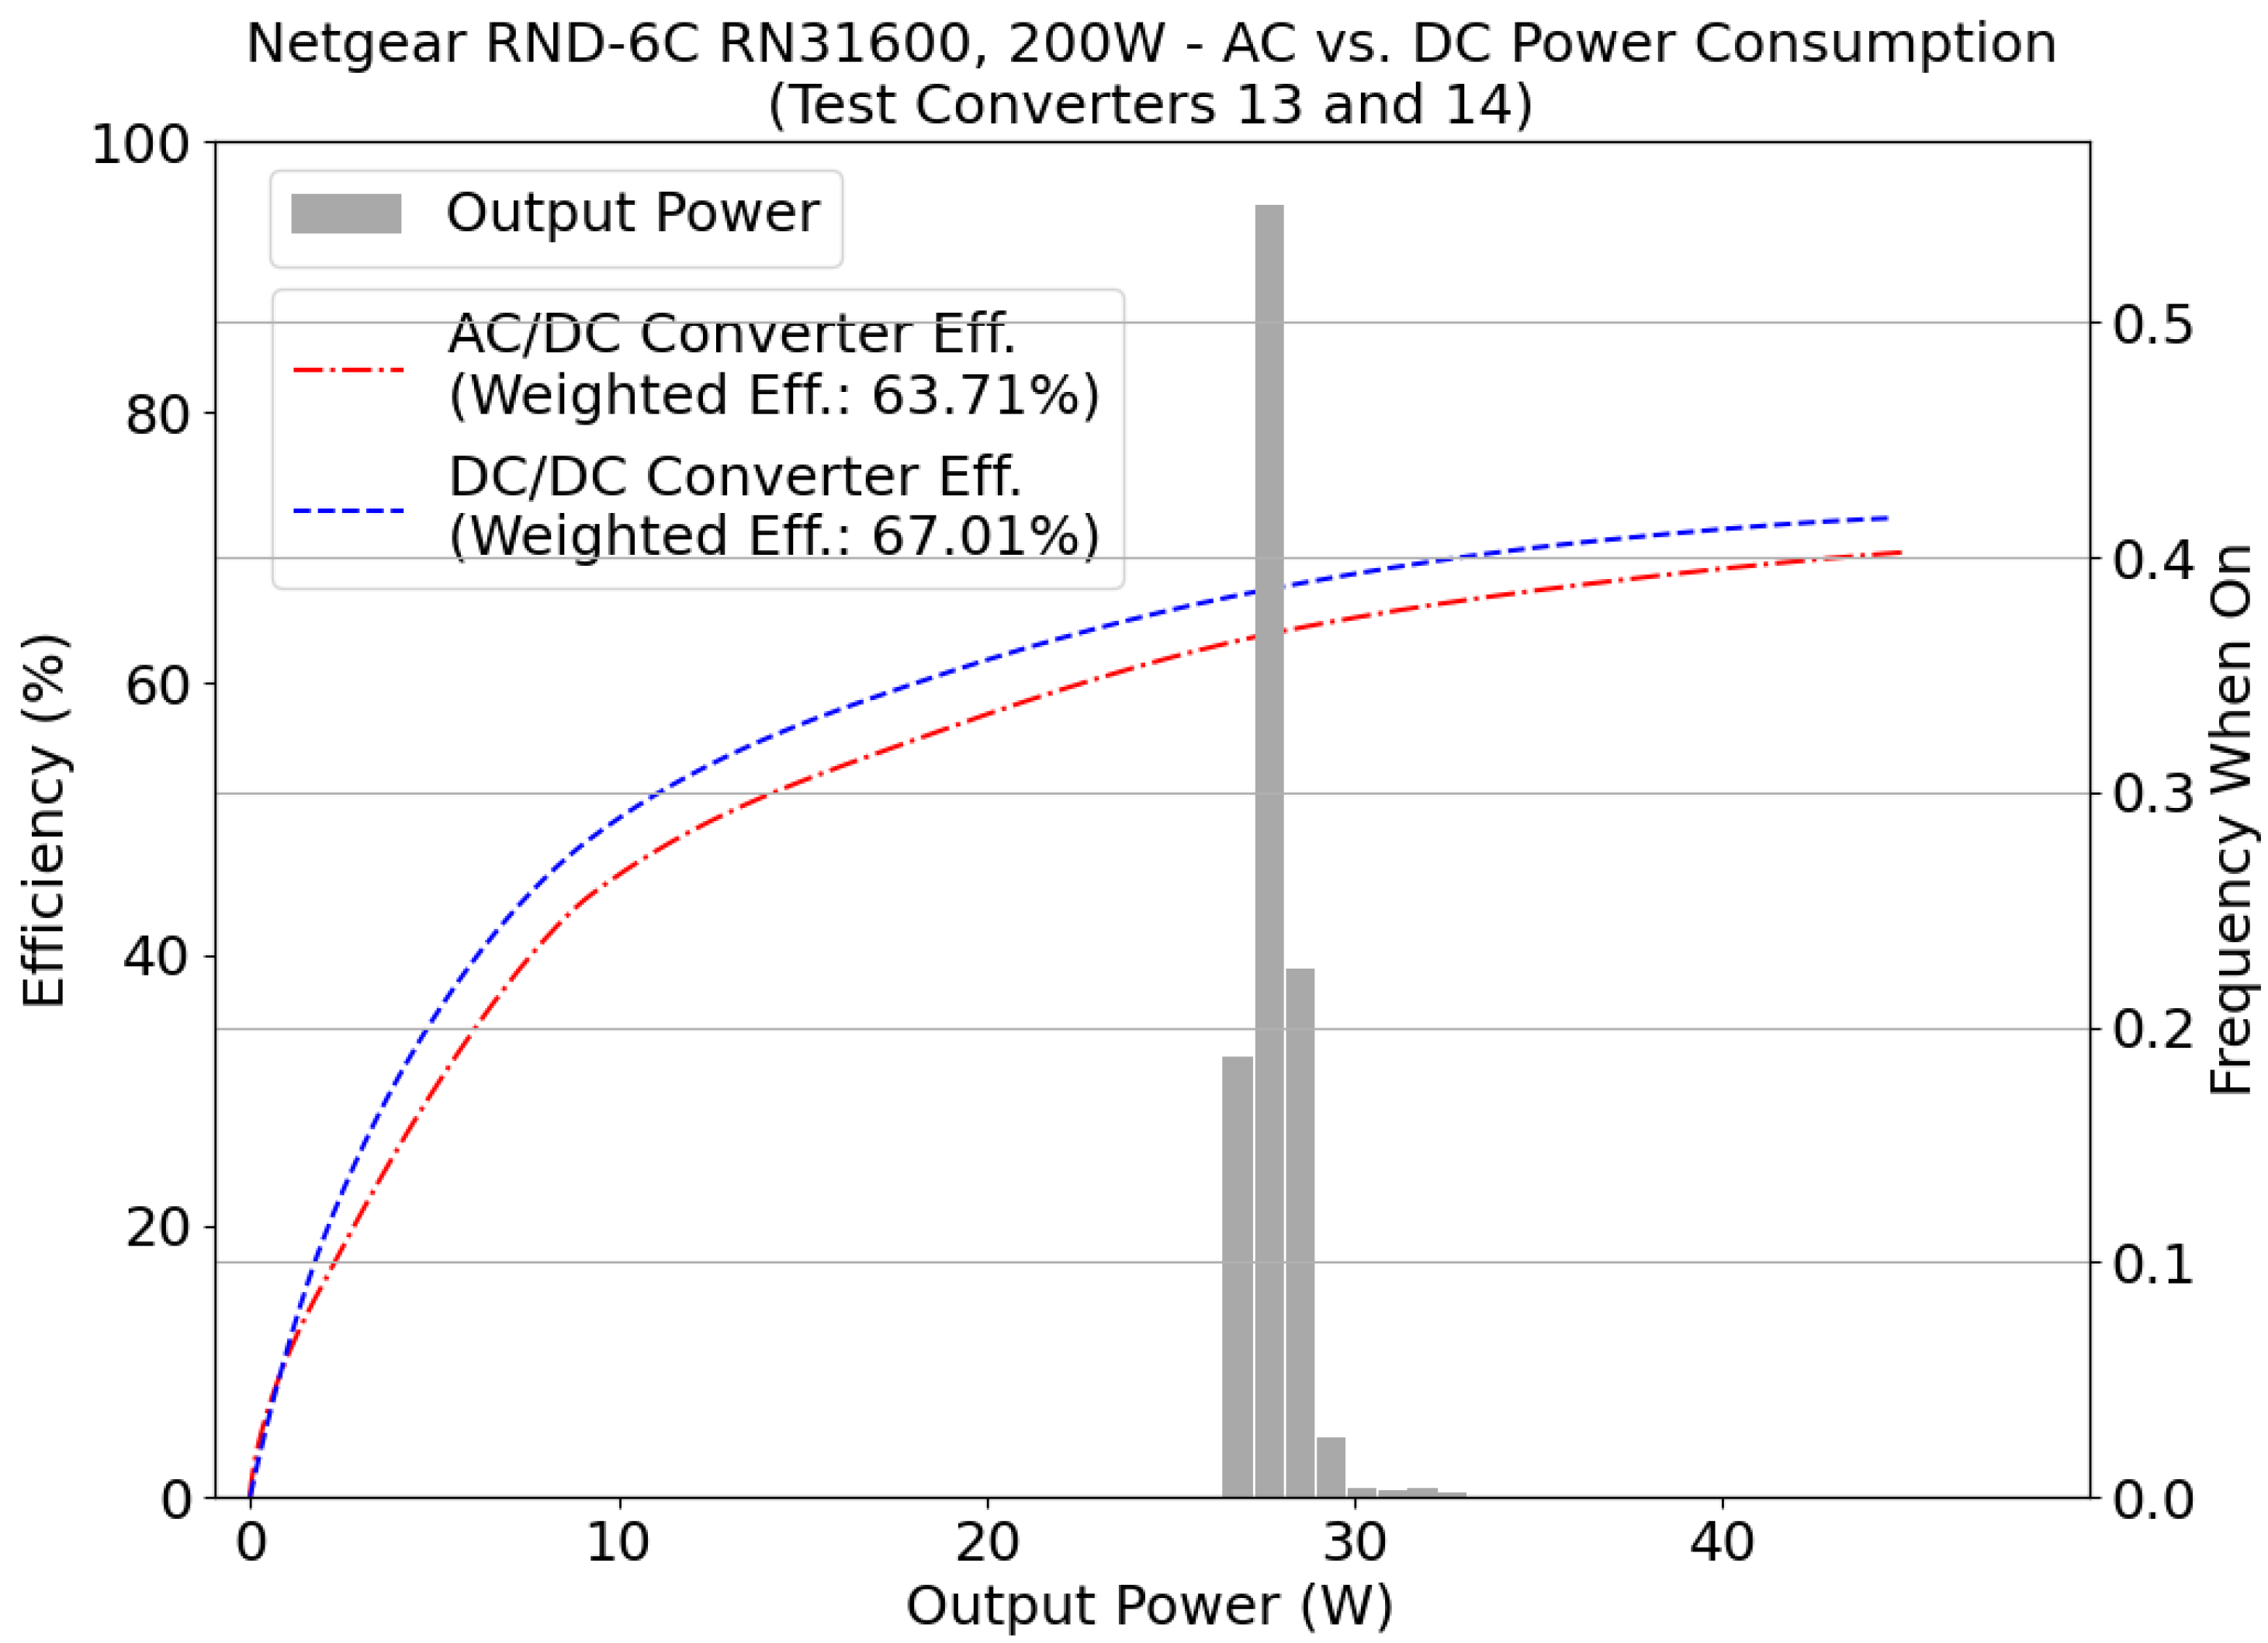
3.2.5. 185 W SIMO Test Converters

One pair of converters had a rated load of 185 W: an AC/DC converter at 120 VAC paired with one DC/DC converter with 24 VDC input. The converters’ efficiency curves are shown in Figure 8. Further testing details are given in Supplementary Material Table S3 for the test plan and Table S4 the weighted energy efficiencies at different load levels. As with the 70 W converters, the DC/DC test converter was more efficient than the AC/DC converter at all load levels. The largest difference (+4.1%) occurred at 5–10% of the rated load. Above 10% of the rated power, the difference in performance started to decrease, dropping to +2.5% when the converters were 25% loaded. This resulted in a positive net delta efficiency of 3.3%, as shown in Table 9.
Weighted energy efficiency was simulated using load profiles from a network storage device, Netgear RND-6C (200 W); Figure 9. The DC/DC converter exhibited a weighted energy efficiency of +3.3% relative to the AC/DC converter.

3.3. Observations in AC/DC Central Converter Efficiency

As indicated earlier, for many commercial buildings, some or all of the power routed to a DC DS would be provided by a central AC/DC converter (CC). Therefore, the study also analyzed a commercially available power hub often used for this purpose, which has a voltage input range of 90–305AC or 127–431DC. This device was tested operating at three supply voltages: 120 VAC, 208 VAC, and 380 VDC. The converter provides DC power via 16 output ports, rated at 100 W and 24 VDC each, and is currently sold primarily for powering LED lighting. The characterization of this device is described in the Supplementary Information, Section S6.
Figure 10 summarizes the efficiency curve for the three voltage input levels, with their respective uncertainties, and Table S6 in the Supplementary Material summarizes the same data. The CC exhibited the highest efficiency when operating at higher input voltages (208 VAC and 380 VDC), with efficiency typically above 90% for loads above 500 W.
According to the device’s data sheet, above 50% of total load (50% × 1600 W = 800 W), the power hub should have an efficiency above 95% efficiency when operated on a 380 VDC supply. However, the maximum efficiencies observed in this test were 92.6% [92.0% to 93.2%] at 208 VAC, and 93.4% [92.6% to 94.1%], for 380 VDC, both of which are statistically lower than the 95% peak efficiency stated in the data sheet.
The tests performed for the AC/DC central converter showed that the CC’s efficiency was comparable to the efficiency of converters in the MELs tested [44], with higher input voltages tested (208 VAC and 380 VDC) exhibiting slightly higher efficiencies than typical MELs converters. These efficiencies are comparable to the stated efficiencies for in-building step-down transformers [43], although test data for this type of transformer is sparse, and, as noted above, in-building transformers are frequently underloaded and operate below their peak efficiency.
The importance of this testing is that it highlights that neither the central nor endpoint power converters show a systematically superior efficiency to their AC DS counterparts. Tests of endpoint converters did not exhibit a consistent advantage for DC/DC endpoint converters over AC/DC endpoint converters and the single AC/DC central converter tested here (a) exhibited an efficiency comparable to in-building step-down transformers and (b) did not show a significant efficiency advantage over the endpoint converters. Therefore, for the devices tested here, the efficiency of CC (versus a step-down transformer) does not provide an efficiency advantage for DC DS versus the traditional AC DS.

4. Discussion

4.1. Interpretation of Test Converters Results

For the selection of the test converters measured in this study, weighted energy efficiency of DC/DC converters was not consistently superior to that of AC/DC converters, likely due to variations in the design and performance of individual converters. These results differ substantially from the common assumption found in the literature—namely that the efficiency of DC/DC converters is better than that of AC/DC converters. Further, due to the highly variable nature of efficiency curves for seemingly similar converter units, these data also showed that the appliance’s load profile is a key determinant of weighted energy efficiency and must be considered when comparing AC and DC distribution solutions.
To compare the endpoint efficiency, we considered four scenarios to analyze converter efficiency: (1) the maximum efficiency detected over the whole efficiency curve (peak efficiency); (2) the efficiency at the converter’s rated load; (3) the efficiency provided by the converter’s data sheet; and (4) the energy efficiency weighted by load. Scenarios 1, 2, and 3 are often used in literature, while Scenario 4 is the method utilized in this study. Table 10 summarizes each scenario for the eight loads simulated in this study.
Data sheets for 2 of the 14 test converters (test converters 3 and 5) were not available, and those efficiencies are omitted from the table. Due to load bank limitations, test converters 10–14 could not be tested over their full range of power, and, consequently, their peak efficiency and efficiency at full load are also missing from the table for these units.
Table 10 illustrates that the converters’ weighted energy efficiencies were substantially lower than the efficiencies provided by their data sheets. Only test converters 4 and 6, when linked to load profiles from the HP Laptop and Microsoft Laptop 1, respectively, had a performance above that stated in their data sheets. Overall, data sheet information was available for four scenarios for seven test converters. For 57% of these scenarios, the efficiencies provided in the data sheet were higher than the peak efficiency or the efficiency at full load measured here. Therefore, based on this limited sampling, a design engineer selecting a power converter from its data sheet has an approximately 50/50 chance of seeing performance as good as the data sheet’s stated efficiency.
If the endpoint efficiency comparison was made using either peak efficiency or efficiency at full load (Scenarios 1 and 2, respectively), five of six appliances would be considered to have a better performance in DC compared to AC. However, if we consider a comparison that uses the weighted energy efficiency (Scenario 4), only four of the eight appliances would be more efficient in DC. Additionally, differences in weighted energy efficiency also changed substantially when comparing Scenario 1 to 4 or Scenario 2 to 4. For the Acer Monitor, for instance, the AC-input weighted energy efficiency was 59.5%, while the peak and full load efficiency were both 76%.
Additional tests on converters with 12 VDC and similar input voltages were also completed and showed similar efficiency curves. These data are discussed in SI Section Table S4. To illustrate the analytic assumptions commonly utilized in the literature, a comparison to other studies is also included in Section 4.2.
Taking all data and simulations together, practitioners should be cautious about making broad assumptions regarding converter efficiency based upon power ratings or data sheet values, or making the assumption that appliance load profiles are at or near the rated load of converters. The values found for peak efficiency, efficiency at full load, and data sheet efficiency were close to each other for most converters, with variations within 3.5% for the sampled converters.
This indicates that the efficiency provided in the converters’ specification documents were measured at, or near, the load where they operate at their best performance. However, as shown here, MELs seldom operate at load levels near the converters’ peak efficiency. Therefore, when the endpoint efficiency comparison is made using efficiency data provided by any of these metrics (i.e., data sheet, peak efficiency, or efficiency at the rated load), the results are likely to be misleading.
Finally, combining these data with the efficiency of the single central converter unit tested here provides a cautionary note about whether existing buildings would benefit from providing DC DS circuits to power office MELs: If one considers a CC running at 208 VAC, powered on the secondary of a building distribution transformer, and operating at its peak efficiency (92.6% at 880 W), DC/DC converters powered by the CC’s outputs would need efficiencies that were consistently 8 percentage points higher than comparable AC/DC converters for the DC DS to have higher efficiency than the AC DS.
The measurements from this study indicated that this type of efficiency advantage is rare: only one converter—an HP laptop powered by SISO test converters 3 and 4—had a weighted DC/DC efficiency sufficient to offset losses in the CC. Additionally, if the CC is also underloaded—the likely case given common design practice—its efficiency falls below its peak efficiency. When loaded under 25% of its rated power, the CC’s conversion efficiency dropped as low as 89.3–90.5% for all three operational voltages (120 VAC, 208 VAC, 380 VDC).
Therefore, while by no means a comprehensive study, the measurements performed for this study indicate that wholesale provision of DC distribution systems in existing commercial buildings is unlikely to provide an efficiency advantage without either (a) substantial improvements in endpoint DC/DC converter efficiencies or (b) significant savings achieved by reducing conversion losses in other distribution equipment not typically present, such as connected PV or energy storage converters.

4.2. Example Comparison to Representative Efficiency Studies

As an illustration, we compare our analysis to that of a typical literature analysis of converter efficiency—as shown in Figure 4 of a study provided by Pang et al. [5]. In this analysis, the authors collected efficiency data on a range of power converters at different power ratings.
The data accumulated in this study disagree with the Pang et al. study for the following reasons: first, in Pang’s analysis, the efficiency of AC/DC and DC/DC converters tends to increase with the power rating. However, our study shows that the weighted efficiency of the converter depended on the appliance load profile and could vary substantially relative to the efficiency at the rated power. Comparing, for example, the Acer and the Phillips Monitors, both rated at 60 W and using the same AC test converter (Converter 7, rated at 70 W), the weighted efficiencies were 59.5% and 61.4%, respectively.
The Dell monitor (AC test converter 10, rated at 100 W) presented a weighted efficiency of 68.0%, which was significantly lower than the 80.5% presented by a Netgear router rated at 30 W; second, for our sampled test converters, no significant correlation was seen between the power ratings and efficiency at the rated power for the converters utilized in our experiments (30–185 W); and finally, contrary to Pang’s results, the study data did not show that the AC/DC and DC/DC converters’ efficiencies tended toward similar values as the power rating increased.
Another study [10] analyzed AC adapters operating at different voltage inputs (AC and DC). The operational efficiency was compared at 120 VAC and 240 VAC, with their peak values after the input rectification (169 VDC and 339 VDC, respectively). When operating in DC, the adapters presented better efficiencies. However, these tests were done in the same converter, operating either with AC or a DC input, despite the fact that they were not listed for DC applications. In practice, (a) the DC voltage levels considered are quite uncommon and hardly available in the market; (b) there are no standards supporting these voltages unless the 380 VDC level called by the EMerge Alliance Data/Telecom Center Standard [45]; (c) at commercial voltage levels, based on our sampled converters, this efficiency advantage does not happen often.

4.3. Limitations

While realistic, there are several limitations to the experimental work performed here. First, the analysis is limited to the selection of actual converters that we were able to obtain, characterize, and analyze. The study’s focus of physical devices limited the breadth of the analysis; purely simulation-based studies and studies using manufacturers’ product data can draw on a much wider body of information. However, as discussed in Section 4.1, such studies often lack complete information and may yield misleading results. The advantage of our approach is the depth of analysis possible when using full converter characterization data and realistic load levels.
As a wide range of DC/DC converters could not be tested, there exists some possibility that DC/DC converters exist that are higher efficiency than those tested here. We were able to test only a small number of manufacturers. While it is possible that the manufacturers tested are not representative of the current state of the art, other manufacturers’ products were not available for general commercial purchase. However, our review of available products suggests that a systematic improvement in DC/DC converter efficiency is unlikely unless regulatory or similar outside pressures eliminate lower-performing converters from the market. Indeed, we found no commercially available units with performance exceeding those purchased for testing.
Conversely, the AC/DC converters shipped with products today may also benefit from improved design. Given that the converters selected here did not have space or heat constraints common for internal SIMO converters, it is also possible that the DC/DC converters tested here were higher in efficiency than those that would be built into MELs. We, therefore, contend that the AC-to-DC replacement process simulated here was representative of what would happen under current market forces and product availability constraints. Nevertheless, future studies should analyze a broader selection of converter manufacturers and product lines if or when they become commercially available.
Finally, for nearly all MELs tested here, the loads were substantially below the rated load when operating. The study identified two primary reasons for this under-loading. First, since many MELs are part of larger product families, manufacturers may choose one converter to support a broad product family, and must select that converter for the products with the highest loads; this sizing methodology results in relative under-loading for some products. Second, many MELs have multiple operating modes—e.g., monitors have built-in USB hubs designed to power peripherals—which are seldom used but must be considered when sizing power circuitry.

5. Conclusions

This study considered endpoint conversion, which exists in both AC and DC distribution system architectures, using commercially available products for both AC/DC and DC/DC converters. Multiple studies [10,11,12] have indicted that, in theory, DC/DC converters should have superior efficiency than comparable AC/DC converters. However, the measurements performed here indicated that commercially available DC/DC converters did not exhibit systematically better efficiency that comparable AC/DC converters in practice, and any efficiency advantage was substantially reduced when weighted by realistic load profiles. For the eight appliances analyzed in this work with matching pairs of AC/DC and DC/DC converters, half presented higher weighted energy efficiency using the DC/DC converter, and half using AC/DC. These data suggest that either (a) DC/DC converters are not being designed with the same rigor as AC/DC converters, or with the same focus on maximum efficiency; or (b) prior theoretical evaluations of DC/DC converter architectures have not accounted for all losses inherent in economically viable designs.
For building power systems that include local generation and/or storage, there may be additional advantages to DC distribution that were not characterized in this study. However, considering the measurements performed here, any such advantage cannot rely on endpoint conversion for common low voltage loads to contribute an efficiency advantage—such an advantage is simply not seen in the measured efficiency, particularly when weighted by realistic load levels. We recommend further research to expand the analysis to other categories of load, to incorporate more converter samples (as they become commercially available for purchase), and to inform more comprehensive, simulation-based DC distribution efficiency studies.

Supplementary Materials

The following are available online at https://www.mdpi.com/article/10.3390/en14185863/s1, Endpoint Use Efficiency Comparison for AC and DC Power Distribution in Commercial Buildings.

Author Contributions

Conceptualization: A.S. and D.Z.; Methodology: A.S., D.Z. and G.D.; Software: A.S. and G.D.; Validation: A.S.; Formal Analysis: A.S. and D.Z.; Investigation: A.S.; Resources: D.Z., G.D. and D.G.; Data Curation: A.S.; Writing—Original Draft Preparation: A.S.; Writing—Review and Editing: D.Z. and S.F.; Visualization: A.S.; Supervision: D.Z. and G.D.; Project Administration: D.Z. and S.F.; Funding Acquisition: S.F. All authors have read and agreed to the published version of the manuscript.

Funding

Funding was provided by the United States Department of Energy (DOE) Assistant Secretary for Energy Efficiency and Renewable Energy (EERE) Building Technologies Office Emerging Technologies Program.

Acknowledgments

This work was authored in part by the National Renewable Energy Laboratory, operated by the Alliance for Sustainable Energy, LLC, for the U.S. Department of Energy (DOE) under Contract No. DE-AC36-08-GO28308, and by Lawrence Berkeley National Laboratory, operated for the DOE under Contract No. DE-AC02-05CH11231. Funding was provided by the DOE Assistant Secretary for Energy Efficiency and Renewable Energy Building Technologies Office Emerging Technologies Program. The views expressed in this article do not necessarily represent the views of the DOE or U.S. Government.

Conflicts of Interest

The authors declare no conflict of interest. The funders had no role in the design of the study; in the collection, analyses, or interpretation of data; in the writing of the manuscript, or in the decision to publish the results.

References

  1. Siraj, K.; Khan, H.A. DC distribution for residential power networks—A framework to analyze the impact of voltage levels on energy efficiency. Energy Rep. 2020, 6, 944–951. [Google Scholar] [CrossRef]
  2. Estimated, U.S. Energy Consumption in 2020: 92.9 Quads. 2020. Available online: https://flowcharts.llnl.gov/content/assets/docs/2020_United-States_Energy.pdf (accessed on 20 May 2021).
  3. Langner, R.; Trenbath, K. Integrating Smart Plug and Process Load Controls into Energy Management Information System Platforms: A Landscaping Study; Technical Report NREL/TP-5500-74080; National Renewable Energy Laboratory: Golden, CO, USA, 2019. [Google Scholar] [CrossRef] [Green Version]
  4. Seo, G.S.; Baek, J.; Choi, K.; Bae, H.; Cho, B. Modeling and analysis of DC distribution systems. In Proceedings of the 8th International Conference on Power Electronics-ECCE Asia, Jeju, Korea, 30 May–3 June 2011; pp. 223–227. [Google Scholar]
  5. Pang, H.; Lo, E.; Pong, B. DC electrical distribution systems in buildings. In Proceedings of the 2006 2nd International Conference on Power Electronics Systems and Applications, Hong Kong, China, 12–14 November 2006; pp. 115–119. [Google Scholar]
  6. Prabhala, V.A.; Baddipadiga, B.P.; Fajri, P.; Ferdowsi, M. An Overview of Direct Current Distribution System Architectures & Benefits. Energies 2018, 11, 2463. [Google Scholar]
  7. Mackay, L.; Blij, N.H.V.D.; Ramirez-Elizondo, L.; Bauer, P. Toward the universal DC distribution system. Electr. Power Components Syst. 2017, 45, 1032–1042. [Google Scholar] [CrossRef] [Green Version]
  8. Pratt, A.; Kumar, P.; Aldridge, T.V. Evaluation of 400 V DC distribution in telco and data centers to improve energy efficiency. In Proceedings of the 29th International Telecommunications Energy Conference (INTELEC 07), Rome, Italy, 30 September–4 October 2007; pp. 32–39. [Google Scholar]
  9. Gerber, D.L.; Liou, R.; Brown, R. Energy-saving opportunities of direct-DC loads in buildings. Appl. Energy 2019, 248, 274–287. [Google Scholar] [CrossRef] [Green Version]
  10. Lu, D.D.C.; Agelidis, V.G. Photovoltaic-battery-powered DC bus system for common portable electronic devices. IEEE Trans. Power Electron. 2009, 24, 849–855. [Google Scholar] [CrossRef]
  11. Rasheed, A.; Khan, S.; Gelani, H.E.; Dastgeer, F. AC vs. DC Home: An Efficiency Comparison. In Proceedings of the 2019 International Symposium on Recent Advances in Electrical Engineering (RAEE), Islamabad, Pakistan, 28–29 August 2019; Volume 4, pp. 1–6. [Google Scholar]
  12. Vossos, V.; Garbesi, K.; Shen, H. Energy savings from direct-DC in US residential buildings. Energy Build. 2014, 68, 223–231. [Google Scholar] [CrossRef]
  13. Azazi, H.; El-Kholy, E.; Mahmoud, S.; Shokralla, S. Review of passive and active circuits for power factor correction in single phase, low power AC-DC converters. In Proceedings of the 14th International Middle East Power Systems Conference (MEPCON’10), Cairo, Egypt, 19–21 December 2010; p. 217. [Google Scholar]
  14. Singh, B.; Singh, B.N.; Chandra, A.; Al-Haddad, K.; Pandey, A.; Kothari, D.P. A review of single-phase improved power quality AC-DC converters. IEEE Trans. Ind. Electron. 2003, 50, 962–981. [Google Scholar] [CrossRef] [Green Version]
  15. Sannino, A.; Postiglione, G.; Bollen, M.H.J. Feasibility of a DC Network for Commercial Facilities. In Proceedings of the Conference Record of the 2002 IEEE Industry Applications Conference. 37th IAS Annual Meeting (Cat. No.02CH37344), Pittsburgh, PA, USA, 13–18 October 2002; Volume 39, pp. 1499–1507. [Google Scholar] [CrossRef]
  16. Starke, M.; Tolbert, L.M.; Ozpineci, B. AC vs. DC distribution: A loss comparison. In Proceedings of the 2008 IEEE/PES Transmission and Distribution Conference and Exposition, Chicago, IL, USA, 21–24 April 2008; pp. 1–7. [Google Scholar]
  17. Gerber, D.L.; Vossos, V.; Feng, W.; Marnay, C.; Nordman, B.; Brown, R. A simulation-based efficiency comparison of AC and DC power distribution networks in commercial buildings. Appl. Energy 2018, 210, 1167–1187. [Google Scholar] [CrossRef] [Green Version]
  18. Engelen, K.; Shun, E.L.; Vermeyen, P.; Pardon, I.; D’hulst, R.; Driesen, J.; Belmans, R. The feasibility of small-scale residential DC distribution systems. In Proceedings of the 32nd Annual Conference on IEEE Industrial Electronics (IECON 2006), Paris, France, 6–10 November 2006; pp. 2618–2623. [Google Scholar]
  19. Calwell, C.; Mansoor, A. AC-DC server power supplies: Making the leap to higher efficiency. In Proceedings of the Twentieth Annual IEEE Applied Power Electronics Conference and Exposition (APEC 2005), Austin, TX, USA, 6–10 March 2005; Volume 1, pp. 155–158. [Google Scholar]
  20. What Is Energy Star. 2021. Available online: https://www.energystar.gov/about?s=footer&s=footer (accessed on 22 May 2021).
  21. Asensio, O.I.; Delmas, M.A. The effectiveness of US energy efficiency building labels. Nat. Energy 2017, 2, 1–9. [Google Scholar] [CrossRef]
  22. Working with Global Businesses to Drive the Transition to a Net-Zero Economy. 2021. Available online: https://wwf.panda.org/discover/our_focus/climate_and_energy_practice/what_we_do/climatebusiness/climate_business_network/? (accessed on 22 May 2021).
  23. Trifilova, A.; Bessant, J.; Jia, F.; Gosling, J. Sustainability-driven innovation and the Climate Savers’ programme: Experience of international companies in China. Corp. Gov. 2013, 13, 599–612. [Google Scholar] [CrossRef] [Green Version]
  24. Energy Efficiency Requirements by Levels. 2021. Available online: https://slpower.com/data/collateral/PW153KB_DS.pdf (accessed on 22 May 2021).
  25. Energy Conservation Program: Energy Conservation Standards for External Power Supplies. 2014. Available online: https://www.energy.gov/sites/prod/files/2014/02/f7/eps_ecs_final_rule.pdf (accessed on 22 May 2021).
  26. What Is 80 PLUS Certified? 2021. Available online: https://www.clearesult.com/80plus/program-details#program-details-table (accessed on 22 May 2021).
  27. Khan, F.H.; Geist, T.D.; Vairamohan, B.; Fortenbery, B.D.; Hubbard, E. Challenges and Solutions in Measuring Computer Power Supply Efficiency for 80 PLUS® Certification. In Proceedings of the 2009 Twenty-Fourth Annual IEEE Applied Power Electronics Conference and Exposition, Washington, DC, USA, 15–19 February 2009; pp. 2079–2085. [Google Scholar]
  28. Li, Q.; Lee, F.C.; Xu, M.; Wang, C. Light load efficiency improvement for PFC. In Proceedings of the 2009 IEEE Energy Conversion Congress and Exposition, San Jose, CA, USA, 20–24 September 2009; pp. 3755–3760. [Google Scholar]
  29. Rasmussen, N. AC vs. DC power distribution for data centers. Am. Power Convers. Tech. Rep. 2007, 63. Available online: https://www.google.com.hk/url?sa=t&rct=j&q=&esrc=s&source=web&cd=&ved=2ahUKEwj3zYf1g4PzAhWNu54KHSoRDoMQFnoECAQQAQ&url=https%3A%2F%2Fdownload.schneider-electric.com%2Ffiles%3Fp_enDocType%3DWhite%2BPaper%26p_File_Name%3DWP63R6.pdf%26p_Doc_Ref%3DSPD_SADE-5TNRLG_EN&usg=AOvVaw09s9iGVph3zYU8jRrf8tJu (accessed on 30 August 2021).
  30. Becker, D.J.; Sonnenberg, B. DC microgrids in buildings and data centers. In Proceedings of the 2011 IEEE 33rd International Telecommunications Energy Conference (INTELEC), Amsterdam, The Netherlands, 9–13 October 2011; pp. 1–7. [Google Scholar]
  31. Evans, V. Why Low Voltage Direct Current Grids? Master’s Thesis, Delft University of Technology, Delft, The Netherlands, 2013. [Google Scholar]
  32. Murari, K.; Padhy, N.P. A network-topology-based approach for the load-flow solution of AC–DC distribution system with distributed generations. IEEE Trans. Ind. Inform. 2018, 15, 1508–1520. [Google Scholar] [CrossRef]
  33. Ahmed, H.M.; Eltantawy, A.B.; Salama, M. A generalized approach to the load flow analysis of AC–DC hybrid distribution systems. IEEE Trans. Power Syst. 2017, 33, 2117–2127. [Google Scholar] [CrossRef]
  34. Opiyo, N.N. A comparison of DC-versus AC-based minigrids for cost-effective electrification of rural developing communities. Energy Rep. 2019, 5, 398–408. [Google Scholar] [CrossRef]
  35. Liu, Z.; Li, M. Research on energy efficiency of Dc distribution system. AASRI Procedia 2014, 7, 68–74. [Google Scholar] [CrossRef]
  36. Santos, A.; Duggan, G.P.; Young, P.; Frank, S.; Hughes, A.; Zimmerle, D. Harmonic cancellation within AC low voltage distribution for a realistic office environment. Int. J. Electr. Power Energy Syst. 2022, 134, 107325. [Google Scholar] [CrossRef]
  37. Newmiller, J.; Erdman, W.; Stein, J.S.; Gonzalez, S. Sandia Inverter Performance Test Protocol efficiency weighting alternatives. In Proceedings of the 2014 IEEE 40th Photovoltaic Specialist Conference (PVSC), Denver, CO, USA, 8–13 June 2014; pp. 0897–0900. [Google Scholar] [CrossRef]
  38. Bower, W.; Whitaker, C.; Erdman, W.; Behnke, M.; Fitzgerald, M. Performance Test Protocol for Evaluating Inverters Used in Grid-Connected Photovoltaic Systems; Sandia National Laboratories: Albuquerque, NM, USA, 2004. [Google Scholar]
  39. EMerge Alliance Occupied Space Standard FAQs. 2021. Available online: https://www.emergealliance.org/standards/occupied-space-2/standard-faqs/ (accessed on 25 November 2020).
  40. Mendelson, G. All You Need to Know about Power over Ethernet (PoE) and the IEEE 802.3 af Standard. Internet Cit. [Online] Jun. 2004. Available online: https://www.tymserve.us/documents/powerdsine/whitepapers/PoE_and_IEEE802_3af.pdf (accessed on 30 August 2021).
  41. Said, D.; Nor, K. Effects of harmonics on distribution transformers. In Proceedings of the 2008 Australasian Universities Power Engineering Conference, Sydney, NSW, Australia, 14–17 December 2008; pp. 1–5. [Google Scholar]
  42. Shareghi, M.; Phung, B.; Naderi, M.; Blackburn, T.; Ambikairajah, E. Effects of current and voltage harmonics on distribution transformer losses. In Proceedings of the 2012 IEEE International Conference on Condition Monitoring and Diagnosis, Bali, Indonesia, 23–27 September 2012; pp. 633–636. [Google Scholar]
  43. Korn, D.; Hinge, A.; Dagher, F.; Partridge, C. Transformers Efficiency: Unwinding the Technical Potential. In Proceedings of the 2000 ACEEE Summer Study on Energy Efficiency in Buildings; American Council for an Energy Efficient Economy: Washington, DC, USA, 2000; Volume 1, pp. 149–162. [Google Scholar]
  44. dos Santos, A.F.B. Device Characterization on Energy Design and Scoping Tool for DC Distribution Systems and a Study on Harmonics in AC/DC Converters in Low Voltage Distribution. Master’s Thesis, Colorado State University, Fort Collins, CO, USA, 2020. [Google Scholar]
  45. EMerge Alliance Data/Telecom Center Standard. 2021. Available online: https://www.emergealliance.org/standards/data-telecom/ (accessed on 8 September 2021).
Figure 1. Grouped appliances’ operational power range when on. Data were collected for approximately 2 months at 1 Hz resolution. Frequencies are represented by boxplots with 95% confidence interval whiskers, with the boxes represent the interquartile range between the 25th and 75th percentile, and the orange lines represent the medians. Data outside the confidence interval are represented by the circles. Table 3 provides the whisker and median values.
Energies 14 05863 g001
Figure 2. Typical (a) AC and (b) DC distribution for commercial buildings.
Energies 14 05863 g002
Figure 3. Weighted energy efficiency for SISO converters, assuming load profiles for: (a) HP Laptop, 90 W (b) Microsoft laptop 1, 90 W (c) Microsoft laptop 2, 90 W, and (d) Netgear WNR2000 v3. Efficiency curves for the test converters are represented by the dotted lines, and probability distribution of load for each MEL is represented by the histogram. Legend provide the weighted energy efficiency for each converter, over the period in which power was monitored (≈2 months).
Energies 14 05863 g003
Figure 4. AC and DC efficiency comparisons for 70 W SIMO power supplies for the test plan in Table 5. Converter 7 is the AC/DC converter (red line); the blue line shows converter 8, a DC/DC converter with 24 VDC input; and the green line is converter 9 with a 48 VDC input.
Energies 14 05863 g004
Figure 5. AC and DC weighted energy efficiencies for flat panel display screens: Acer CB421HYK (60 W) in (a,b) and for Phillips 288P6L (60 W) in (c,d). Simulations were done with 70 W SIMO test converters. Panels (a,c) show a comparison with DC test converter rated at 24 VDC and panels (b,d) at 48 VDC. Efficiency curves for the test converters are represented by the dotted lines, and the frequency when the appliance is on for each power bin is by the bar chart.
Energies 14 05863 g005aEnergies 14 05863 g005b
Figure 6. AC and DC efficiency comparisons for 110 W SIMO power supplies for the test plan in Table S1. The converter 10 is the AC/DC converter (red line); the blue line shows converter 11, a DC/DC converter with 24 VDC input; and the green line indicates converter 12 with a 48 VDC input.
Energies 14 05863 g006
Figure 7. AC/DC and DC/DC weighted energy efficiencies for a load profile from a Dell monitor, model P2415Qp, rated at 90 W. Simulations utilized efficiency data from 110 W SIMO test converters. Both panels utilize the same AC/DC converter. Panel (a) compares to a DC/DC converter with 24 VDC input; panel (b) with 48 VDC input. Formatted as in Figure 3.
Energies 14 05863 g007
Figure 8. Efficiency curves for Converters 13 and 14. Converter 13 is model REL-185-4001-CHCO, 185 W. Converter 14 is model DC2-185-4001-CH, 185 W, tested at 24 VDC.
Energies 14 05863 g008
Figure 9. AC and DC weighted energy efficiencies for Netgear RND-6C RN31600 (200 W). Simulations were done with 185 W SIMO test converters. The figure shows a comparison with DC test converter rated at 24 VDC. Formatted as in Figure 3.
Energies 14 05863 g009
Figure 10. CC Efficiency curves at 120 VAC, 208 VAC, and 380 VDC, with respective uncertainties. The outer chart summarizes the full test range. Inset chart focuses on the area with loads of 100 W or higher. The performance at 208 VAC and 380 VDC present similar efficiencies, while the efficiency at 120 VAC is lower.
Energies 14 05863 g010
Table 1. AC/DC and DC/DC test converters.
Converter IDBrandModelInput VoltageOutput Voltage (VDC)Rated Power (W)
Converter 1Mean WellIRM-30-24ST100–240 VAC2430
Converter 2Mean WellRSD-30G-249–36 VDC2430
Converter 3DELLDA90PE1-00100–240 VAC19.590
Converter 4BixPowerBX-DD90X-24 V24 VDC19.590
Converter 5EmaksA1749100–240 VAC1590
Converter 6BixPowerBX-DD90X-24 V24 VDC1590
Converter 7Integrated Power DesignsREL-70-4006-CHCO85–264 VAC5/24/1270
Converter 8Integrated Power DesignsDC2-70-4006-CHCO18–36 VDC5/24/1270
Converter 9Integrated Power DesignsDC4-70-4006-CHCO36–72 VDC5/24/1270
Converter 10Integrated Power DesignsGRN-110-4003-CHCO85–264 VAC5/24/12110
Converter 11Integrated Power DesignsDC2-110-4006-CHCO18–36 VDC5/24/12110
Converter 12Integrated Power DesignsDC4-110-4006-CHCO36–72 VDC5/24/12110
Converter 13Integrated Power DesignsREL-185-4001-CHCO85–264 VAC3.3/5/12185
Converter 14Integrated Power DesignsDC2-185-4001-CHCO18–36 VDC3.3/5/12185
Table 2. Appliances and their respective AC/DC and DC/DC test converters.
Smart Plug IDDeviceOutput Voltage (VDC)
Voltage (VDC)
Power
(W)
AC/DC Test
Converter
DC/DC Test
Converter
Smart Plug 1Netgear WNR2000 v31236Converter 1Converter 2
Smart Plug 2HP Laptop19.590Converter 3Converter 4
Smart Plug 3Microsoft Laptop 11590Converter 5Converter 6
Smart Plug 4Microsoft Laptop 21590
Smart Plug 5ViewSonic Monitor5/12/2436
Smart Plug 6HP Monitor E2325/12/2435
Smart Plug 7HP Monitor E2325/12/2435
Smart Plug 8HP Monitor E2325/12/2435
Smart Plug 9HP Monitor E2425/12/2438
Smart Plug 10Acer Monitor CB421HYK5/12/2460Converter 7Converter 8, 9
Smart Plug 11Dell Monitor P2415Qp5/12/2490Converter 10Converter 11, 12
Smart Plug 12HP Monitor E2325/12/2435
Smart Plug 13HP Monitor E2735/12/2442
Smart Plug 14HP Monitor E2735/12/2442
Smart Plug 15Apple Thunderbolt Display5/12/24250
Smart Plug 16Dell Monitor E2010Ht5/12/2426
Smart Plug 17Phillips Monitor 288P6L5/12/2460Converter 7Converter 8, 9
Smart Plug 18HP Z240 Tower Workstation3.3/5/12400
Smart Plug 19HP Z240 Tower Workstation3.3/5/12400
Smart Plug 20Netgear RND-6C/RN316003.3/5/12200Converter 13Converter 14
Table 3. Appliances’ converter power level distribution (% of rated load).
LaptopsMonitorsDesktopsNetwork Appliances
Minimum Value4.416.80.22.8
Lower Quartile1034.34.65.6
Median13.340.57.05.6
Mean18.239.87.312.9
Upper Quartile31.147.411.521.5
Maximum Value32.266.711.522.5
Table 4. Delta Efficiency (DC-AC) for pairs of test converters and AC and DC weighted energy efficiency for each appliance.
DeviceRated Power1%5%10%15%20%35%50%70%100%Weighted Energy Efficiency
NetgearEff. Conv. 9 (%)41.777.985.286.486.986.886.486.285.8AC80.5%
WNR2000Eff. Conv. 10 (%)8.451.179.182.083.385.085.485.685.5DC67.1%
v3Delta Eff (%)−33.3−26.8−6.1−4.4−3.6−1.8−1.0−0.7−0.3Net Delta−13.4%
Eff. Conv. 1 (%)43.873.274.176.179.885.286.386.986.5AC84.2%
HP LaptopEff. Conv. 2 (%)37.171.185.189.491.393.293.292.591.0DC92.8%
Delta Eff (%)−6.7−2.011.013.311.58.06.95.64.5Net Delta8.6%
MicrosoftEff. Conv. 3 (%)75.685.288.689.088.988.288.388.086.2AC88.8% */ 88.3% **
Laptop 1 *Eff. Conv. 4 (%)40.168.884.889.191.092.792.691.689.3DC88.3% */ 86.1% **
and 2 **Delta Eff (%)−35.5−16.4−3.80.22.04.54.33.63.1Net Delta−0.6% */ −2.3% **
Table 5. Test plan for 70 W multi-output converters.
Test Converters 7, 8 & 9Max
Power
(W)
Load (W)
Rated
Power (W)
70Scenario 1Scenario 2Scenario 3Scenario 4Scenario 5
1%Out 1 (5 V)24.890.7----
5%Out 1 (5 V)24.893.5----
Out 1 (5 V)24.897.07.47.47.98.4
15%Out 2 (24 V)-1.51.62.12.11.1
Out 3 (12 V)143.372.01.61.10.51.1
Out 1 (5 V)24.897.010.514.78.47.4
30%Out 2 (24 V)-7.05.34.210.53.2
Out 3 (12 V)143.377.05.32.12.110.5
Out 1 (5 V)24.897.014.08.411.29.8
40%Out 2 (24 V)-14.07.08.414.04.2
Out 3 (12 V)143.377.07.011.22.814.0
Out 1 (5 V)24.8920.014.714.77.49.8
70%Out 2 (24 V)-19.017.214.722.129.4
Out 3 (12 V)143.3710.017.219.619.69.8
Table 6. Delta Efficiency (DC-AC) for SIMO test converters rated at 70 W.
Rated Power (70 W)0%1%5%15%30%40%70%
AC Eff. Conv. 7, 120 VAC (%)0.09.031.653.664.868.873.7
DC Eff. Conv. 8, 24 VDC (%)0.212.538.458.869.772.875.8
DC Eff. Conv. 9, 48 VDC (%)0.012.439.760.471.175.578.5
Delta Eff. [Conv 8—7] (%)0.23.56.85.14.94.02.0
Delta Eff. [Conv 9—7] (%)0.03.48.16.86.36.74.7
Table 7. Delta Efficiency (DC-AC) for simulations with converters rated at 70 W.
Acer Monitor (60 W)Phillips Monitor (60 W)
AC59.5%61.4%
DC (24 V)64.6%66.5%
DC (48 V)66.0%67.8%
Net Delta (24 V)5.1%5.2%
Net Delta (48 V)6.5%6.5%
Table 8. Delta Efficiency (DC-AC) for simulation with converters rated at 110 W.
Test ConverterWeighted Energy Efficiency (%)Net Delta Efficiency (Δ%
AC68.0%
DC (24 V)48.0%−20.0%
DC (48 V)33.5%−34.5%
Table 9. Deltar Efficiency (DC-AC) for simulation with converters rated at 185 W.
Test ConverterWeighted Energy Efficiency (%)Net Delta Efficiency (Δ%)
AC63.7%
DC (24 V)67.0%+3.3%
Table 10. AC vs. DC endpoint efficiency comparison.
AC/DCDC/DCDelta Efficiencies
Smart
Plug ID
ApplianceTest
Conv.
Peak Eff.
(%)
Eff. at Full
Load (%)
Eff. in Data-Sheet (%)Wt. E. Eff. (%)Test
Conv.
Peak Eff.
(%)
Eff. at Full
Load (%)
Eff. in Data-Sheet (%)Wt. E. Eff. (%)Delta
Peak
Eff. (%)
Delta Eff.
at Full
Load (%)
Delta Eff.
Data Sheet
(%)
Delta
Net
Eff. (%)
SmartNetgearConv. 186.985.888.580.5Conv. 285.685.589.067.1−1.3−0.30.5−13.4
Plug 1WNR2000 v3
SmartHP LaptopConv. 386.986.5-84.2Conv. 493.291.0>88.092.86.34.5-8.6
Plug 2
SmartMicrosoftConv. 589.086.2-88.8Conv. 692.789.3>88.088.33.73.1-−0.6
Plug 3Laptop 1
SmartMicrosoftConv. 589.086.2-88.3Conv. 692.789.3>88.086.13.73.1-−2.3
Plug 4Laptop 2
SmartAcer MonitorConv. 776.076.078.059.5Conv. 876.476.378.064.60.40.30.05.1
Plug 10CB421HYKConv. 980.080.078.066.04.04.00.06.5
SmartDell MonitorConv. 10--85.068.0Conv. 11--82.048.0--−3.0−20.0
Plug 11P2415QpConv. 12--82.033.5--−3.0−34.5
SmartPhillipsConv. 776.076.078.061.4Conv. 876.476.378.066.50.40.30.05.2
Plug 17Monitor 288P6LConv. 980.080.078.067.84.04.00.06.5
SmartNetgear RND-Conv. 13--82.063.7Conv. 14--77.067.0
Plug 206C/RN31600--−5.03.3
Publisher’s Note: MDPI stays neutral with regard to jurisdictional claims in published maps and institutional affiliations.

