Article

High-Temperature Fluidized Bed Processing of Waste Electrical and Electronic Equipment (WEEE) as a Way to Recover Raw Materials

1
Faculty of Chemical Engineering and Technology, Cracow University of Technology, 31-155 Cracow, Poland
2
Faculty of Environmental and Power Engineering, Cracow University of Technology, 31-155 Cracow, Poland
*
Author to whom correspondence should be addressed.
Energies 2021, 14(18), 5639; https://doi.org/10.3390/en14185639
Submission received: 17 August 2021 / Revised: 3 September 2021 / Accepted: 3 September 2021 / Published: 8 September 2021
(This article belongs to the Special Issue Computational Thermal, Energy, and Environmental Engineering)

Abstract

:
This paper explores the effectiveness of metal recovery and values of gaseous emissions during thermal e-waste processing followed by magnetic separation. The thermal process of conversion of this kind of waste is difficult due to the uncertainty of the operation when compared to the processing of homogeneous materials. This is due to their complex and heterogeneous structure. The adoption of the fluidized bed reactor makes the process feasible, stabilizing it significantly and limiting emissions of harmful gases. Mobile cellphones were used as the raw input material of 450 g total mass. During the thermal transformation, the exhaust gases such as: CO, CO2, NOx, SO2, HCI, HBr, HCN, NH3, phenol, hydrocarbons, HF and COCI2 were analysed. The thermal treatment resulted in 333.6 g of solids in the fluidized bed. They were fragmented into grains smaller than 1 mm and 0.5 mm. The process of magnetic enrichment was used next on grains greater than 1 mm and smaller than 0.5 mm. The process was carried out using a neodymium magnet for particles >1 mm and a plate electromagnetic separator (powered by a three-phase current) together with a 1-disc tape-type separator, which was used for particles <1 mm. Such an approach resulted in the recovery of 81.9% of cobalt, 96.6% of iron and 99.2% of neodymium. The most efficient method of magnetic enriching (MS) proved to be the use of the electromagnetic plate separator.

Graphical Abstract

1. Introduction

The construction of the first printed circuit assembly by Paul Eisler in 1936, the invention of the first integrated circuit by Jack Kilby in 1958 and the introduction of the integrated circuit layout led to the fast development of digital technology and a rapid production growth and sale of electronic devices [1]. Most of these devices employ highly advanced printed circuit board assembly (PCBA). Because of the continuous economic growth, and emerging new products and technologies, the tendency to lower prices and for a shorter service life results in a considerable and continuous increase in electrical and electronic waste constituting a great challenge for the environment [2,3,4,5,6].
It is estimated that the electrical and electronic equipment in use these days represents the greatest increase in waste volume with an annual growth of 4% [7,8,9]; on a global scale this corresponds to 20 to 50 mil tons of waste [10,11,12,13]. Europe produces around 12 mil tons of electronic waste (WEEE), which equals around 23 kg per person, Europe’s population equals 505.7 mil [7].
A growing demand for metals used in the production of electronics is the reason for the fast depletion of natural resources as the electronic industry is a large consumer of precious metals as well as basic metals such as copper [9].
Therefore, the recycling of electrical and electronic waste, and the recovery of metals, is so important [9,14,15,16]. The waste contains heavy metals and organic compounds that may permanently contaminate the environment [17,18].
Because of the dangerous characteristics of e-waste and the increasing amount, it is necessary to organize its selective collection, neutralization and adequate disposal. Less than 40% of all e-waste in the countries of the European Union are being recycled, while the rest remains unsorted [19]. The Parliament of the European Union, in response to the growing problem of organizing this type of dangerous waste, took some normative steps in order to increase the protection of our health and the environment. The decisive act of the E.U. to regulate the WEEE waste in member states was the directive 2002/96/WE of the European Parliament and council issued on the 27 January 2003, an act which significantly limits the quantity of hazardous substances used in new electrical and electronic equipment. However, the use of hazardous substances such as lead, cadmium and mercury, etc., remains unresolved. The content of the dangerous components in e-waste constitutes a serious problem for waste management; moreover, recycling of the electrical and electronic equipment remains insufficient, leading to the forfeiture of valuable resources and invaluable losses for the economy. The new directive of the European Parliament and Council 2012/19/UE dated 4 July 2012 constitutes a supplement to the basic legislation of the EU in terms of waste management. The directive is addressed to the member states in order to limit WEEE; for them to recycle, implement alternative ways of recovery and to give an impulse to use it again. In March 2020, the European Commission additionally introduced a new action plan concerning a closed circuit economy. The key priority was the acceptance of limiting electrical and electronic waste. Specific goals were outlined such as “the right to repair”, the general prospect of reusing, the introduction of the universal charger and the introduction of the incentives to encourage recycling. In regard to e-waste, the directives generally promote fixing and reuse, prolonging the service life of equipment. In 2021, the European Parliament voted on a new plan of action concerning the closed circuit economy and demanding additional funds to achieve carbon dioxide neutrality, to balance the emissions free of any toxins into the environment and to be in a fully closed circuit before 2050. They insisted on more rigorous regulations concerning recycling and to establish the binding targets in regards to the use and consumption of materials prior to the year 2030 [19,20].
The fastest growing fraction of used electrical and electronic equipment comes from ICT and telecommunications equipment (category 3) such as cellphones, smartphones, tablets and personal computers because of their short service life. This type of equipment is usually replaced on average every 2 to 5 years due to malfunctions, outdated technology or the users desire for greater functionality [21,22,23]. According to EU statistics, in 2013 the total amount of all used ICT and telecommunications equipment represented 575 thousand tons, constituting around 17% of all WEEE collected. In most EU countries about 90% of the category 3 e-waste accumulated came from regular households [7,24]. Due to the wide range and diverse use of electronic equipment, the heterogenous composition of WEEE is difficult to define. All electronics contain a number of metals, and some other compounds, in different concentrations depending on the origin of the device [4,25,26,27,28].
Households in China are similarly equipped with electrical and electronic appliances as households are in Europe, which, in turn, will lead to similar per capita generation rates in WEEE. In Europe, WEEE collection is based on existing municipal structures. Additionally, retail and other take-back channels are in place. In China, the informal sector dominates WEEE collection, being more competitive and flexible. In Europe, manual dismantling as a first treatment step has been gradually replaced by the mechanical break up of appliances, followed by the sorting out of hazardous and valuable components. In China, large, formal dismantling capacities have been set up in recent years. Their dismantling practices follow similar principles as those in European plants; however, further processing is only partly implemented in Chinese recycling facilities. Specifically, metallurgical treatment of printed circuit boards is still non-existent in China [29].
In the case of cellphones, due to their heterogenous composition, plastics dominate with an average content of 49.28%mass ± 5.25%mass. The other significant group of materials in cellphones are PCBA (25.76%mass ± 3.75%mass), the cover case and screws (11.53%mass ± 4.88%mass), screen (9.13%mass ± 2.43%mass) and magnets (2.11%mass ± 0.61%mass) [30].
In addition, smartphones have a significantly greater screen content than mobile phones, and a comparable weight of PCBA and other parts, which are important for metal recycling and emissions of harmful gases [30].
WEEE consists of many elements such as casings or steel structure elements, which can easily be separated mechanically. The devices have complex characteristics as practically all of them contain printed circuit boards mechanically supporting the electrical components and the conductive tracks. Printed circuit boards fastened with electronic or electric elements such as resistors, capacitors or transistors, constitute a set of printed circuit assembly (PCA) or a set of printed board assembly (PCBA). A set of printed circuit boards represents around a total mass of 2% [31]. The content of the PCBA in electrical and electronic equipment varies significantly, e.g., their mass reaches up to 26% mass in cellphones, while coffee machines and hairdryers contain less than 1% mass [32]. The integrated electronic boards are composites made up of tightly connected components guaranteeing reliable operation. The disassembly of the individual components is a labour and energy intensive process (desoldering), which does not lead to the recovery of the elements that could be used again [33].
The PCBA contain precious metals (Au, Ag, Pt, Cu), non-ferrous metals (Sn, Ni, Cr, Zn, Sb, In, Ge), iron, silicon and some toxic ingredients such as Pb, Hg and Be [32]. Metals in PCBs and electronic elements are tightly connected with polymer. To strengthen them mechanically, and to enhance their properties, the polymer must be filled with some mineral material such as fiber glass, quarts or diatomaceous flour. The materials used for the production of printing circuits are epoxy-glass laminates or composite materials with a layer of either paper or glass felt [33,34].
Several researchers analysed the content of the PCBA in cellphones showing a metal content of 40%mass to 60%mass. The rest consisted of fiberglass and resins. Copper amounted to 34.49%mass, presenting the largest quantity. The remaining metals in PCBA are iron (10.57%mass), zinc (5.92%mass), tin (3.39%mass), nickel (2.63%mass), aluminium (0.26%mass) and silver (0.21%mass) [35,36].
The PCBA composition in cellphones makes them very attractive raw materials in the recycling industry. In the case of cell phone recycling, most of the effort concentrates on non-ferrous precious metals.
Because of the methods used in the technological process of recovery, they can be divided into pyrometallurgical (thermal), hydrometallurgical (chemical) or biohydrometallurgical (biological) [37]. All of the methods mentioned have their advantages and limitations that require further and more intense studies. The biohydrometallurgical methods have their flaws due to the microorganism’s interference in the technological processes. This drawback makes it difficult to apply them to the laboratory setting on an industrial scale [37,38]. Nevertheless, this very promising method in solving e-waste at the beginning of the 21st century takes on great importance.
Usually, the technological process of WEEE utilization consist of two or more stages and includes thermal processing as one of the stages. The thermal process can be carried out in various ways, such as combustion under oxidative conditions, gasification or pyrolysis. Pyrolysis has been tested as a thermal process after prior mechanical treatment [39]. On the other hand, combustion seems to be the most advantageous method for recovering valuable metallic raw materials contained in WEEE due to the simple and complete combustion of the organic parts of the PCA [40].
It is obvious that, on its own, the chosen kind of technology in the recovery of e-waste on an industrial scale will not be decisive because of the environmental impact of the technology selected and the economics which must be taken under consideration.
Currently, much attention is being paid to the processes of controlled waste incineration, which are the source of the emission of VOC, CO, NOx and hydrocarbons, as well as dioxins and furans.
Gas cleaning methods are commonly used such as scrubbers (removal of water-soluble acid components), post-combustion chambers (reduction of CO and VOC emissions), DeNOx installations (NOx emission reduction) or bag filters (PM, metals, dioxins emissions reduction). On the other hand, the purification of gases from furans and dioxins is based on the catalytic processes of oxidation of organic compounds and on catalytic dechlorination of organic compounds. Many installations use catalysts whose active ingredient is platinum. These catalysts are active at relatively low temperatures (300–600 °C). However, due to the high price of noble metals, cheaper, though less active, catalysts are also used, containing oxides of various metals, i.e., copper, nickel, chromium, vanadium and zinc [41]. Moreover, the formation of dioxins takes place at temperatures above 450 °C and drops significantly at temperatures above 850 °C; therefore, the temperature of the combustion process plays an important role [42].
This paper presents research on the thermal treatment of waste mobile phones in an oxidative environment in a fluidized bed reactor. The obtained solid products were subjected to magnetic separation processes in order to determine the separation and levels of recovery of metals after the thermal treatment.

2. Materials and Methods

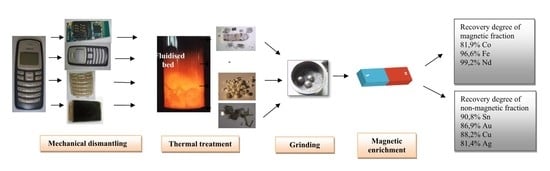
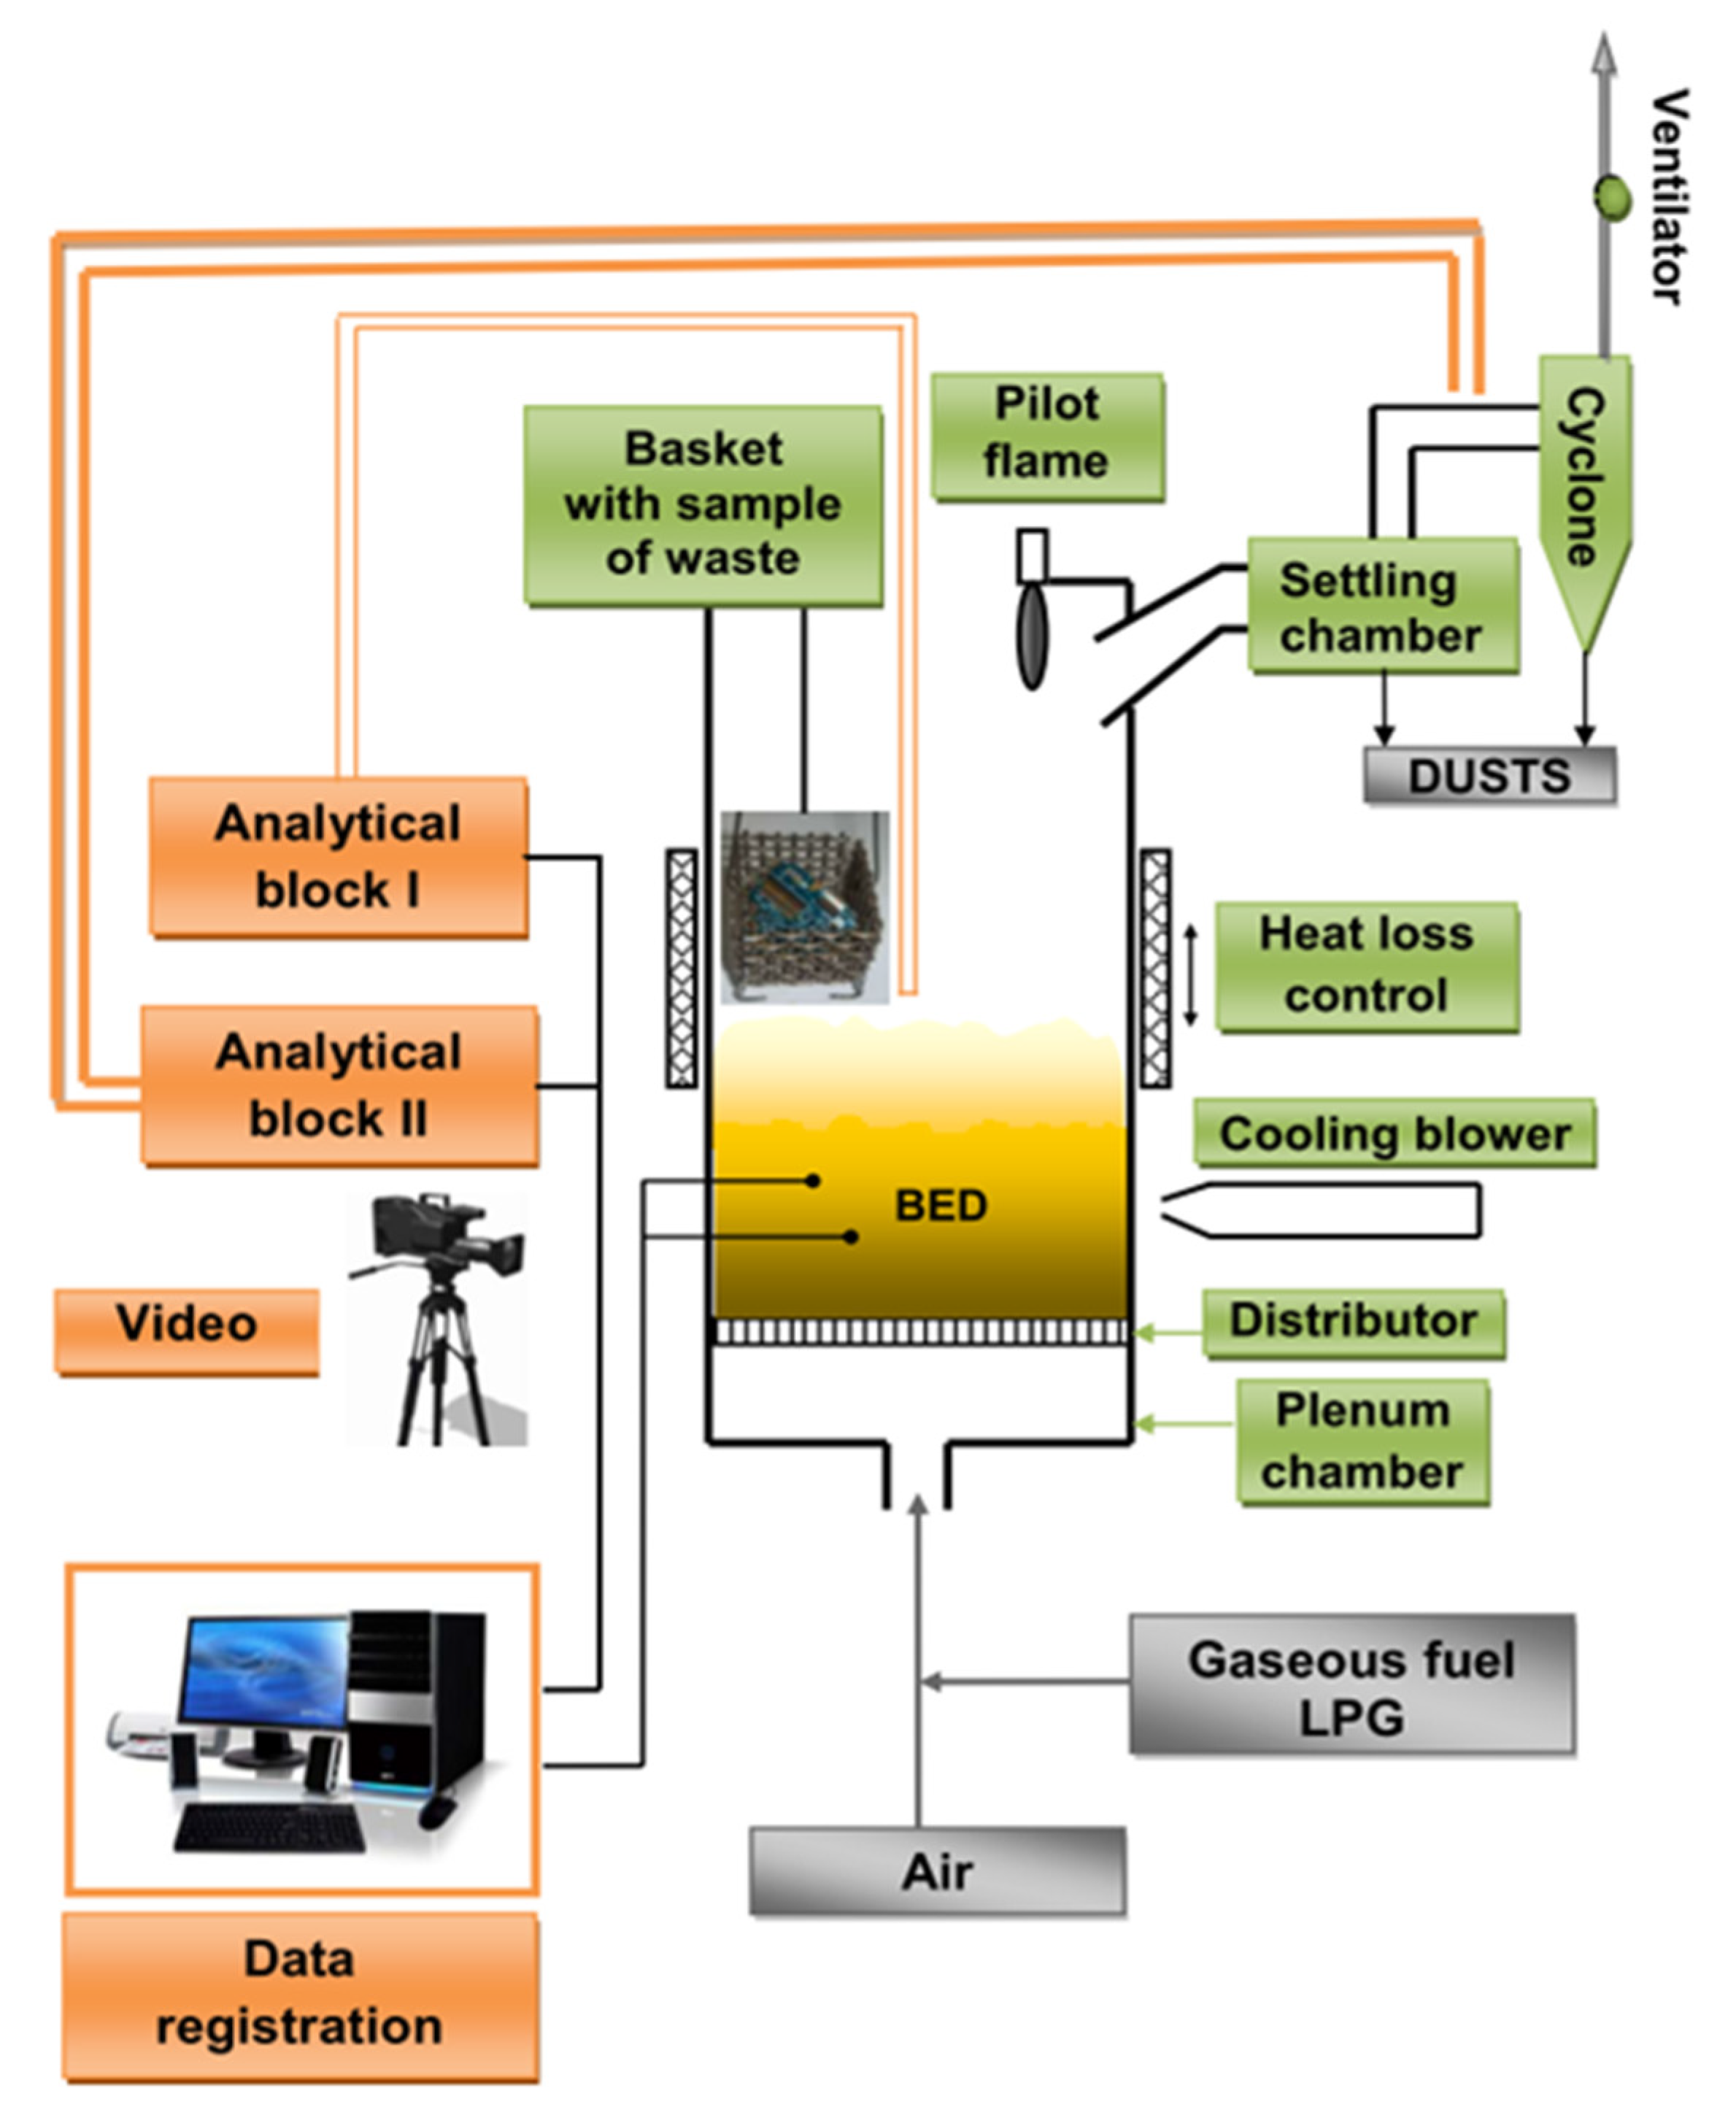
2.1. The Thermal Treatment Process

The thermal treatment process of mobile phone waste was conducted in a laboratory reactor (10 kW) with a chemically inert, bubbling fluidized bed (Figure 1). The fluidized bed is characterized by a homogeneous high temperature and a considerable turbulence of the solid phase and gas phase, providing constant contact of the oxidizer with the surface of the introduced samples. This contact is necessary for the proper thermal treatment of the combustible components contained within the samples. The laboratory fluidized bed reactor has a peripheral surface, which is a transparent quartz cylindrical tube with dimensions of 100 mm (outer diameter), 500 mm (height) and 2–3 mm (wall thickness). The quartz tube is located on a perforated plate made of chrome-nickel steel with a thickness of 1 mm and evenly spaced holes with diameters of 0.6 mm, the area of which constitutes 1.8% of the total surface of the distributor. The air and propane–butane gas are fed to the reactor through a distributor plate. This laboratory fluidized bed reactor was used previously on numerous studies on environmental aspects of waste combustion [40,43,44,45,46,47,48,49].
An additional element of the stand was a basket constructed from a heat-resistant mesh, periodically immersed in the fluidized bed, which was necessary to put the test samples in the bed and remove the non-combustible residue (Figure 1).
During the research, the assessment of the thermal treatment process was performed by measuring the composition of the exhaust gases and measuring the temperature inside the fluidized bed. The fluidized bed temperature was determined by two thermocouples, located at 20 mm and 50 mm above the distributor sieve. Measurements of the exhaust gas composition were performed using an analytical system that was divided into two blocks. In the first block, the exhaust gases were delivered through a heated probe directly from the under-bed area. This block consisted of the following analysers: ECOM SG Plus manufactured by ECOM GmbH (O2, CO, NO, NO2, SO2); PG250 manufactured by Horiba Instruments, Inc. (NOx, O2, CO, CO2, SO2). In the second analytical block, the exhaust gases were additionally delivered using the second heated probe, which was placed before the cyclone. In this block, measurements of substance concentration in the exhaust gases were carried out using the Vario Plus analyzer manufactured by MRU GmbH (Neckarsulm, Germany) (O2, CO, CO2, NO, NO2, SO2, CH4) and the DX4000 analyzer manufactured by Gasmet Inc.(Vantaa, Finland); this is an FT-IR analyzer with a heated gas cuvette, allowing the measurement of concentrations of a wide range of inorganic and organic compounds.
As the raw material, ten used mobile phones were utilised. Initially, the phones were mechanically disassembled, the batteries were separated and the resulting material was divided into smaller parts with a guillotine. The raw materials of three selected used mobile phones from Kit no. II, Kit no. I and Kit no. III, before and after mechanical dismantling, are presented in Table 1, and the samples used during testing are shown in Table 2 and Table 3.
The process of thermal treatment was carried out for a total mass of 450 g of used mobile phones which differed in composition and morphology, i.e., with regard to case, loudspeaker, display, keyboard and printed circuit board assembly. The characteristics of the thermal treatment are presented for the twenty tested samples that were comprised of the fragments of the three mobile phones. The mass of these samples ranged from 0.96 g to 6.00 g; the total mass was 66.76 g (Table 1, Table 2 and Table 3). The thermal treatment process was conducted in a sand bed with a mass of 413.6 g and a grain size of 0.300–0.385 mm. The bed was fluidized by air at a flow rate of 1.66 dm3 s−1 (20 °C, 1013 kPa), to which 0.030 dm3 s−1 (20 °C, 1013 kPa) LPG was added as fuel, allowing the maintenance of a constant processing temperature and conditions of treatment, as well as a constant value of air excess ratio of approx. 1.4.
The preliminary run, preceding the actual process of thermal treatment of MPhW samples, consisted of heating the fluidized bed reactor and the stabilization of its parameters. Thus, the following initial conditions were established: temperature of the fluidized bed at a height of 50 mm from the distributor (840–860 °C), concentration of oxygen (6.5%), CO2—10%vol and NOx—20 ppm. At start up, absence of the following compounds was noted in the exhaust gas: CO, VOCs, SO2, NH3, HCN, CH4, C2H6, C2H4, C2H2, C6H6, C10H8, as well as HCl, HBr and phenol. At this stage, combustion of propane–butane premixed with air prior to the introduction into the reactor was carried out.
Subsequently, waste samples were introduced to the fluidized bed at temperatures in the range 800–850 °C. Each sample was introduced into the reactor in a heat-resistant basket for three minutes (this was proven to be sufficient to decompose the organic content of the samples), the solid residue was then pulled out. Each time, the introduction of the sample resulted in temporary changes in the concentrations of individual components of the exhaust gas. After the burning of the combustible components contained in the individual sample, exhaust gas compositions returned to values almost identical to the initial values.

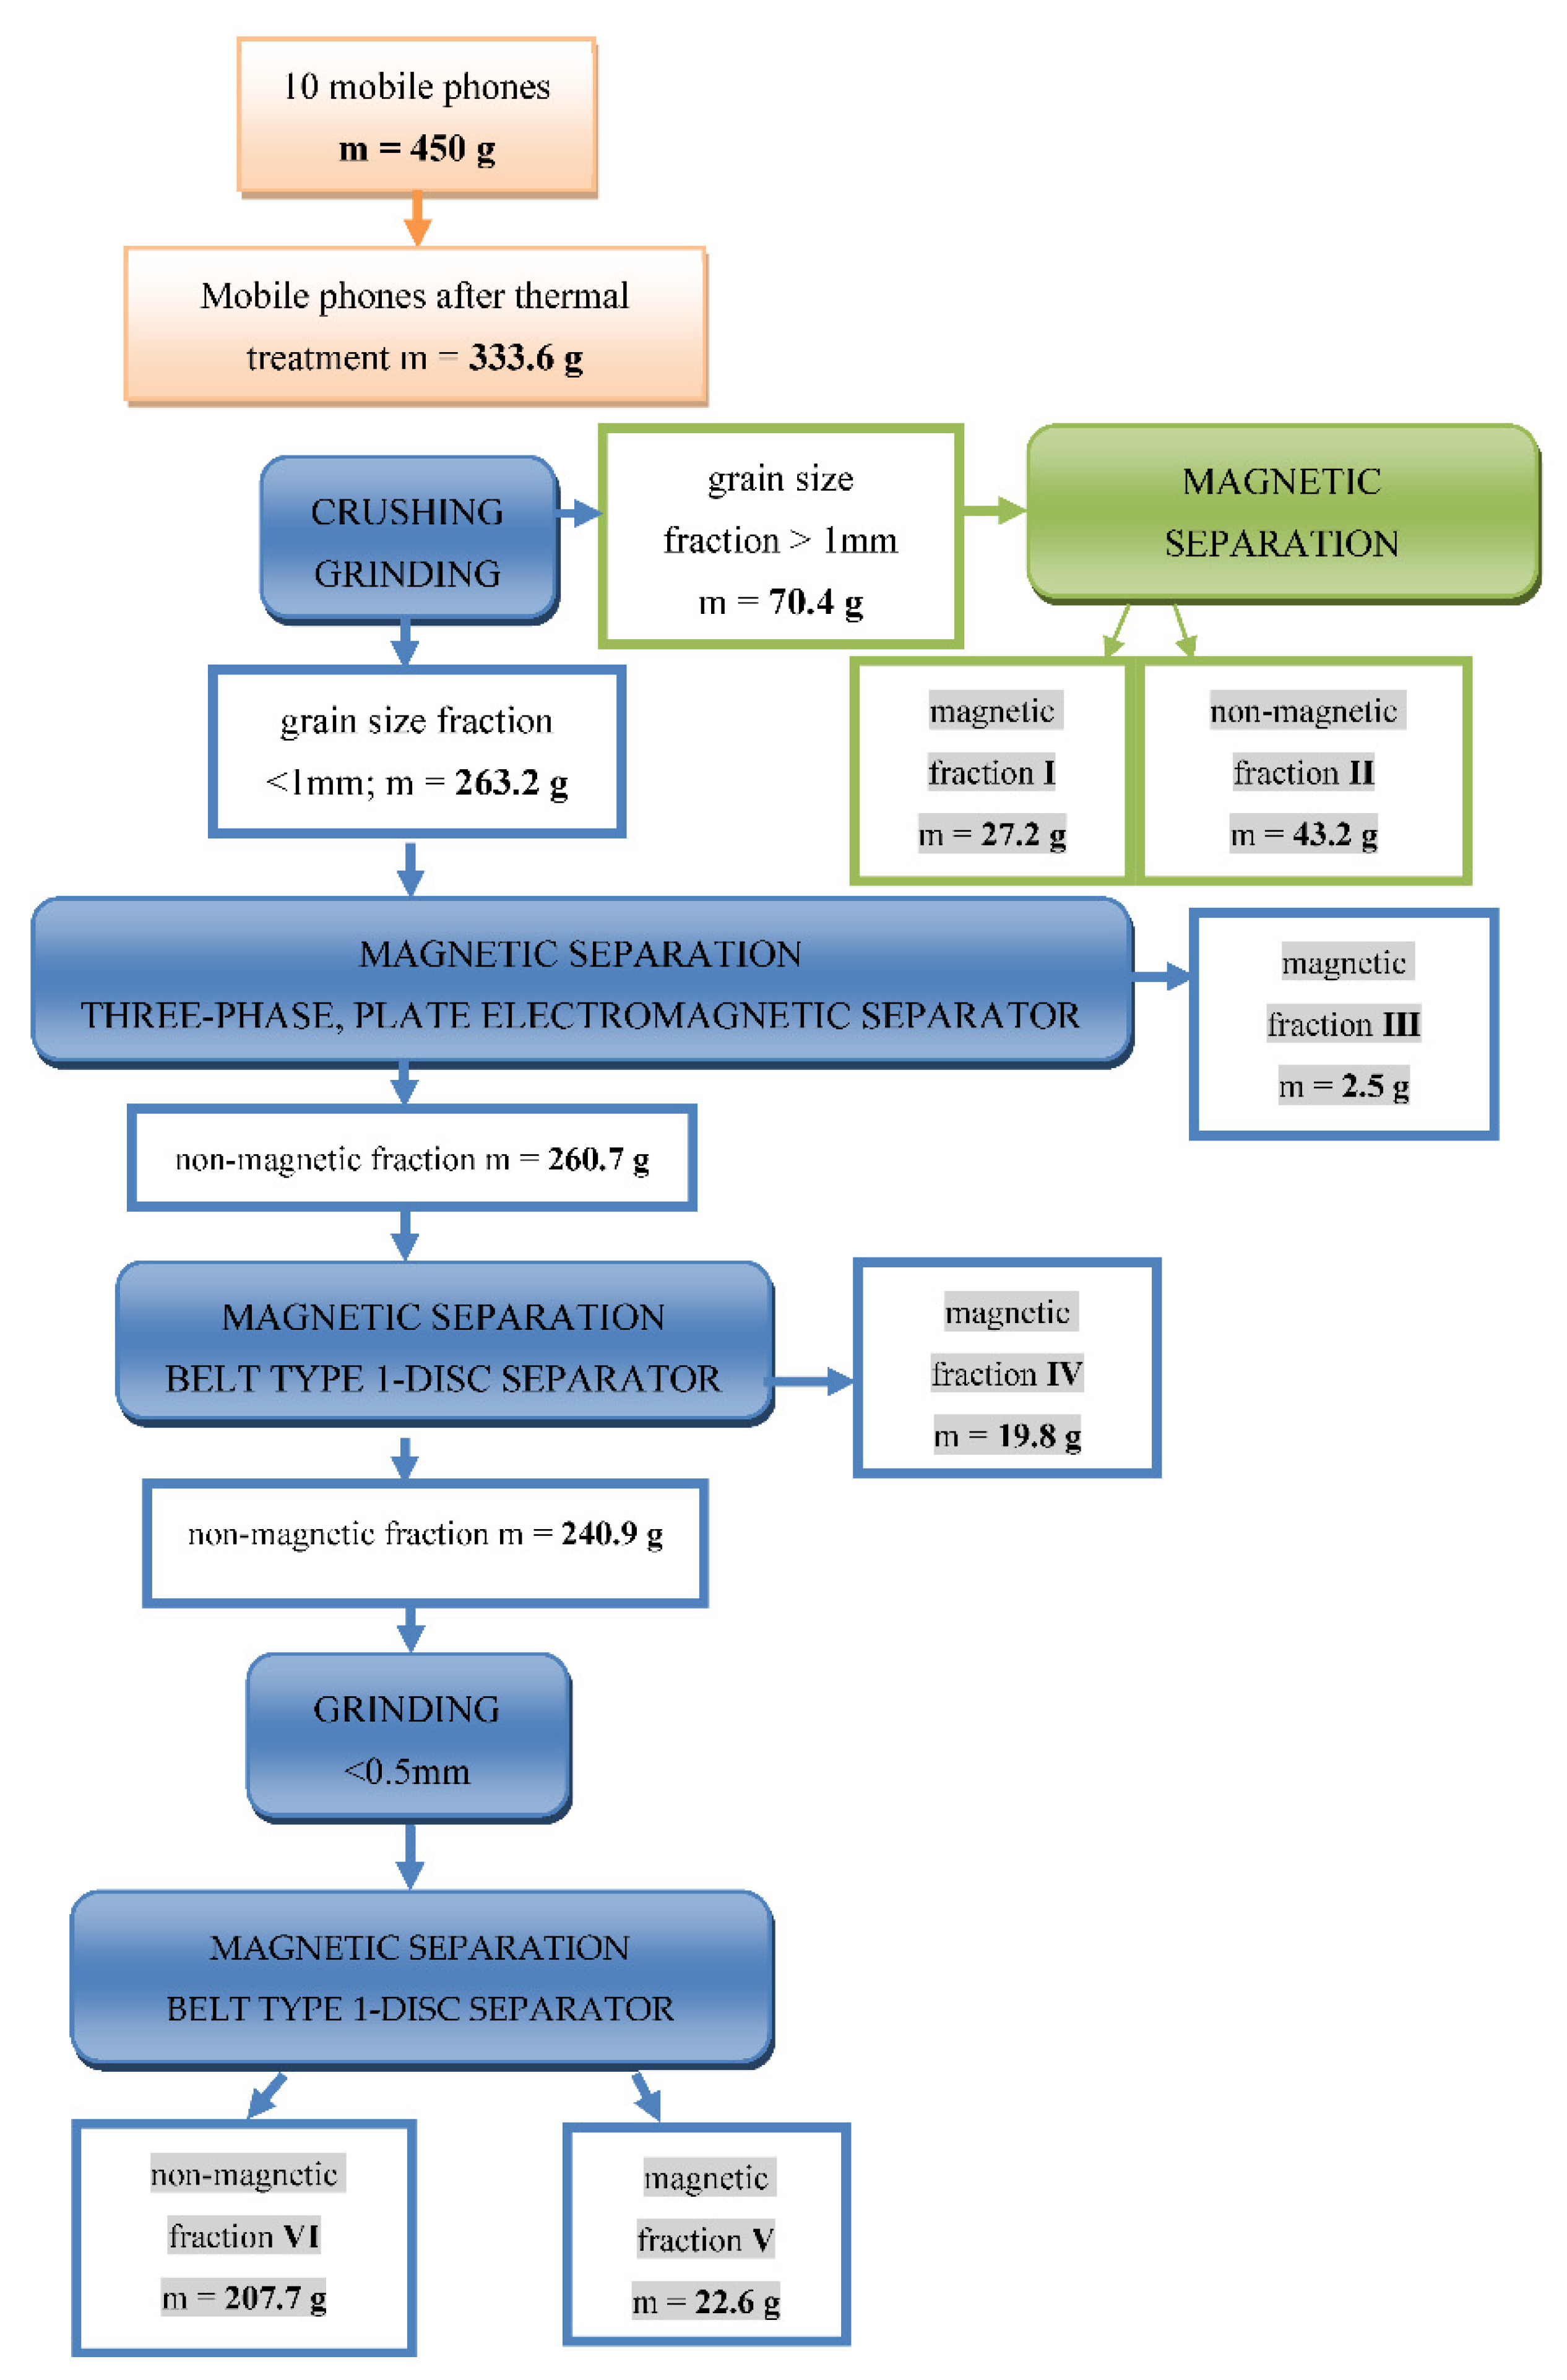
2.2. Magnetic Enrichment

After thermal treatment in the fluidized bed, solid products were subjected to the crumbling and grinding process, two fractions were obtained after sieving through a sieve, one with grain sizes of less than 1 mm, the other with grain sizes of more than 1 mm. Both materials were used in the separation process, the sample over 1 mm was separated using a neodymium magnet. The sample below 1 mm was subjected to two-stage separation. Initially, three-phase plate electromagnetic separators were used and the belt type 1-disc separator was then applied. After the separation processes of material with grain sizes below 1 mm, two magnetic and one non-magnetic fractions were obtained. The non-magnetic fraction below 1 mm was ground to below 0.5 mm and was again used in the separation process on the belt separator.
The first device used for the magnetic enrichment was a three-phase plate electromagnetic separator with three oscillating magnetic fields generated on the near-vertical positioned plate by three electric AC phases. This device was built using a flat plate made of transformer metal plates. In the trenches of the plate there were windings connected to the three-phase power supply producing three independent magnetic fields (similar to the stator of a three-phase engine). A magnetic field that changes in time and space has a waving character and moves horizontally along the plate at a definite speed while the material moves vertically from the top to the bottom of the plate due to gravity. Non-magnetic fractions only move vertically, but magnetic fractions move both vertically and horizontally. The advantage of this separator is the opportunity it presents for producing pure magnetic phases due to the character of the changing magnetic field. The tests were performed with an electric current of the windings of 80A.
The second device used was a belt type 1-disc separator to which the raw material is loaded through a hopper on a conveyor belt, which transports the material into the slit under a rotating disc. The magnetic particles are caught by the rotating disc and are thrown outside the operation range of the magnetic field.
The non-magnetic ingredient is directed below the surface of the plate, and it is thrown out of the moving conveyor belt and transferred to the container for non-magnetic products. The waste separation was performed with a 2A electric current flowing through the windings with a working gap of 2 mm. The scheme of magnetic enrichment of solid products after the thermal treatment of MPhW is presented in Figure 2.

3. Results and Discussion

The thermal treatment process in a fluidised bed reactor resulted in dynamic changes in the bed temperature as well as in the concentrations of O2, CO, VOCs, CO2, aliphatic and aromatic hydrocarbons (CH4, C2H6, C2H4, C2H2, C6H6, C10H8), HBr, HCl, SO2, NOx, HCN, NH3, C6H6O, COCl2 and HF in the exhaust gas, as shown in the ten charts shown in Figure 3 and Figure 4.
Depending on the weight, chemical composition and combustible content of the sample, various oxygen consumption values were observed at the beginning of the thermal decomposition of the sample (the minimum level of between 2.7% and 5.9%), and various values of the temporary increase in concentration of particular gases in the exhaust: CO to 3000–38,000 ppm; VOCs to 1200–7800 ppm; NOx to 25–240 ppm; SO2 to 30–200 ppm.
The largest decreases in O2 content were observed during the thermal treatment of each mobile phone case. For example, after the sample of the Kit no. I case (sample 6) was introduced into the fluidised bed, a temporary decrease in O2 to 2.7% followed, the largest temporary increase in VOCs was to 2100 ppm and for CO, the increase was to 11,000 ppm; there was also a significant increase in NOx (50 ppm) and SO2 (120 ppm).
When comparing the thermal treatment of the keypads from two mobile phones (samples 3 and 11), lower emissions of VOCs can be seen for the Kit no. II case (2100 ppm) than the Kit no. I case (2700 ppm)—this is certainly due to differences in the composition. The contents of the remaining gases in the exhaust are similar, but for the Kit no. II mobile phone they were slightly smaller and amounted to 3700 ppm for CO, 25 ppm for NOx and 20 ppm for SO2.
During the thermal treatment of three displays (samples 5, 13 and 16), similar values of exhaust gases concentration were observed, only in the case of the Kit no. I mobile phone (sample 5) could a higher concentration of VOCs be observed (2400 ppm), whereas the other samples (13 and 16) generated VOCs of up to 7800 ppm. Concentrations of other gases were at a similar level: O2, 5%; NOx, 25–30 ppm; SO2, 15–35 ppm.
Sample 7, which was a fragment of a loudspeaker, produced unusual results. Introducing it into the fluidised bed resulted in a slight temporary decrease in the O2 content in the exhaust gases to 4.5% and a temporary increase in VOCs to 2200 ppm and NOx to 120 ppm. However, no changes in temporary concentrations were observed for the remaining gases.
In the case of the mobile phone PCBAs, a relatively small, temporary decrease in O2 concentration was observed—this dropped to a minimum level of between 5.0% and 5.8%. Only for the plastic part (sample 2), was a decrease in O2 concentration to 4.0% observed. The maximum concentrations of the other gases generated during the thermal treatment of the PCBA from the mobile phones amounted to: VOCs—1500 ppm (samples 1, 2, 12, 19) and 4800 ppm (samples 10, 14); CO—3800 ppm (sample 1) and 10,000 ppm (samples 19, 20); NOx—50–100 ppm; SO2—20–90 ppm.
With regard to hydrocarbon emissions, as a result of the PCBA thermal treatment, temporary concentrations amounted to: 600–1650 ppm for methane; 100–400 ppm for ethane; 100–500 ppm for acetylene; 200–700 ppm for ethylene; 50–100 ppm for naphthalene (with the exception of sample 17 that amounted to 700 ppm); 200–500 ppm for benzene. In the case of displays and keypads, a smaller temporary increase in concentrations was obtained than with the PCBA samples—this amounted to: 550–800 ppm for methane; 60–130 ppm for ethane; 60–230 ppm for acetylene; 60–230 ppm for ethylene; 5–50 ppm for naphthalene (with the exception of sample 5, the Kit no. I display, which amounted to 500 ppm); 60–500 ppm for benzene. It was the thermal treatment of mobile phone cases that tended to produce the highest temporary increases in concentrates; these amounted to: 1000–1500 ppm for methane; 360–640 ppm for ethane; 400–650 ppm for acetylene; 550–750 ppm for ethylene; 240–280 ppm for naphthalene; 860–1200 ppm for benzene.
During the experiments on all samples, of all the analysed hydrocarbons, the largest emissions were observed for methane, and the maximum temporary increase in concentration, in the case of most samples, was in the range of 900–1850 ppm. The emission of the remaining hydrocarbons was primarily dependent on the chemical composition of the sample. No hydrocarbons with chains containing more than three carbon atoms were found in the exhaust gases.
Such compounds as ammonia, hydrogen cyanide, hydrogen chloride and hydrogen bromide were also analysed. It was observed that for most of the samples, HBr was not found in the exhaust gases (samples 1–5, 7–18) and no increases in HCl in the concentrations of 12 samples were observed (samples 1–7, 9, 11, 13, 16, 18).
From analysing the thermal treatment of mobile phone samples, it transpires that hydrogen bromide didn’t occur in the exhaust gases in the case of the Kit no. II mobile phone; however, slight temporary increases in the concentrations of HBr for the two samples of PCBAs coming from the Kit no. III mobile phone (samples 19 and 20) and for the Kit no. I mobile phone case (sample 6) were observed—these amounted to 50–125 ppm and 70 ppm, respectively. Increases in the temporary concentrations of HCl were only observed in the exhaust gases in the case of PCBAs from the Kit no. II (samples 8, 10, 12, 14) and Kit no. III mobile phones (samples 15, 17, 19, 20): these were in the range of 80–200 ppm.
From analysing the emissions of hydrogen cyanide results, it transpires that for all samples, except for the loudspeaker fragment (sample 7), a temporary increase in concentration in the range of 50–550 ppm was obtained. However, most samples subjected to thermal treatment showed an increase in HCN concentration not exceeding 250 ppm. Only seven samples demonstrated an increase in the ammonia concentration in the exhaust gases—these were in the range from 20 ppm to 70 ppm.
The results for phenol emissions show that its largest temporary concentration increased to between 500 and 750 ppm (samples 6 and 9, Kit no. I and Kit no. II mobile phone cases). For most samples, its concentration did not exceed 150 ppm.
The last graph shows changes in concentrations for phosgene and hydrogen fluoride. These results indicate the absence of HF in the exhaust gases, and the analytical signal obtained did not exceed the noise level. In the case of phosgene, slight increases in concentration to 15 ppm were obtained for samples 6, 9 and 11 (Kit no. I case and Kit no. II case and keypad), whereas for most samples, the obtained analytical signal did not exceed the noise level.
Based on the analysis results, the average values of exhaust gas concentrations and the emission coefficients of the following substances were calculated: CO; VOCs; aliphatic and aromatic hydrocarbons (CH4, C2H6, C2H4, C2H2, C6H6, C10H8); HBr; HCl; SO2; NOx; HCN; NH3; C6H6O. These figures are presented in Table 4, Table 5, Table 6 and Table 7.
The highest average emission coefficient, which determines the mass ratio of the pollutant to the mass of the waste introduced to the reactor, were obtained for carbon monoxide (136 mg g−1) and the total amount of volatile organic compounds (7.69 mg g−1).
Among the remaining carbon-containing components, i.e., aliphatic and aromatic hydrocarbons and phenol, the highest values of emission coefficient were obtained for benzene (2.76 mg g−1), naphthalene (1.22 mg g−1) and methane (1.09 mg g−1). For other hydrocarbons, the emission coefficients were less than 1 mg g−1, e.g., ethylene—0.85 mg g−1, phenol—0.91 mg g−1, ethane—0.47 mg g−1, acetylene—0.39 mg g−1.
The second group of components for which the quantitative coefficients were analysed was comprised of sulphur- and nitrogen-containing compounds, namely sulphur oxides, nitrogen oxides, hydrogen cyanide and ammonia, and compounds containing structural elements such as bromine and chlorine, namely hydrogen bromide and hydrogen chloride. It transpires that the highest average coefficient was obtained for SO2 and NOx, respectively, 1.00 mg g−1 and 0.99 mg g−1; whereas, for HCN and NH3, the average was much lower, respectively, 0.41 mg g−1 and 0.01 mg g−1. For HBr and HCl, similar average coefficients were observed with values of 0.10 mg g−1 and 0.26 mg g−1, respectively.
As a result of the thermal treatment process of MPhW in the fluidised bed, solid products with a total weight of 333.6 g were obtained, indicating a reduction in weight of 25.86%. The raw samples and solid products after thermal treatment and their individual reductions in weight are presented in Table 2 and Table 3. The obtained weight losses for 20 samples of waste mobile phones were very different, these ranged from 6.76% (sample 19), through to approx. 20–40% (samples 1, 2, 4, 5, 8, 10, 12, 14, 16, 17, 20) and up to 100% for samples 6, 9 and 18. The multi-stage process of the magnetic enrichment of the solid products, which was then performed, enabled obtaining the individual fractions of different masses, which are presented in Table 8.
From the material with a grain size of less than 1 mm, three magnetic fractions with a combined mass of 44.9 g, and a non-magnetic fraction with a mass of 207.7 g, were obtained after the separation process using a three-phase plate electromagnetic separator and a belt type 1-disc separator.
After a few repetitions of the grinding process a sample with a grain size of over 1 mm was also obtained, this had a mass of 70.4 g. After conducting the separation process through the use of a neodymium magnet for materials with a grain size greater than 1 mm, the magnetic fraction of 27.2 g and non-magnetic fraction of 43 g were obtained.
To determine the elementary composition of fractions, the selected chemical elements were analysed using the ICP-MS method (Table 9).
Based on the results, the enrichment balances for individual chemical elements, namely: copper, iron, neodymium, cobalt, molybdenum (Table 10) and aluminium, zinc, tin, gold and silver (Table 11) were calculated.
In order to determine the effectiveness of each of the separation processes, the following values were calculated: the yield of the fraction (γ); the metal content in the fraction (λ); the metal content in the feed (α); the enrichment factor (K); the yield of the metal (ε).
The yield of the fraction (γ) is the quotient of the particular fraction mass to the feed mass, expressed as a percentage. The metal content in the fraction (λ) is the ratio of the chemical element mass in the fraction to the total fraction mass, expressed as a percentage. The metal content in the feed (α) is the quotient of the chemical element mass in the feed to the total mass feed, expressed as a percentage.
The analysis showed that the largest content of ferromagnetic and paramagnetic elements, with the exception of neodymium, was in the material with a grain size more than 1 mm. In the magnetic fraction (I) obtained after the enrichment process using a neodymium magnet, the yield was 85.7% for iron, 70.8% for cobalt and 21.0% for molybdenum. However, in the non-magnetic fraction (II), the yield was 72.6% for zinc, 62.5% for molybdenum, 40.7% for copper and 39.0% for tin.
The separation of material with a grain size of less than 1 mm on the plate separator showed the highest yields in the magnetic fraction (III) for neodymium at 66.6%, for cobalt at 8.27% and for iron at 5.23%.
At the next stage of magnetic enrichment performed using the disc separator, a magnetic fraction (IV) was obtained, where the yield for neodymium was 31.3%, 5.2% for iron and 2.3% for cobalt. Furthermore, with further grinding to a grain size of less than 0.5 mm and the enrichment process using the disc separator, the expected results were not obtained.
The total yield of a 4-stage magnetic enrichment process for magnetic fractions, both for grain sizes of less than 1 mm and for grain sizes of more than 1 mm, was 82.0% for Co, 96.6% for Fe and 99.2% for Nd. The total obtained yields for non-magnetic fractions were 72.1% for Al, 74.1% for Mo, 81.4% for Ag, 85.2% for Zn, 86.9% for Au, 88.2% for Cu and 90.8% for Sn.
In addition, powder X-ray diffraction (XRD) analysis was conducted to determine the composition of crystalline phases, the results of which are presented in Table 12.
Powder X-ray diffraction (XRD) analysis showed the total separation of the neodymium as an alloy Fe14Nd2B, the content of which in the magnetic fraction after the plate separation amounted to 31.4%, and for Fe, the content was 57.3% (magnetic fraction I), Fe3O4 25.7% (magnetic fraction III) and CuFe 3% (magnetic fraction IV).
In addition, the received crystalline phases indicated the presence of cassiterite SnO2 in each fraction with a grain size of 1 mm, of which the content was in the range of 2.2% (magnetic fractions after disc separator, IV) to 5.7% (magnetic fraction after plate separator, III). Furthermore, in each fraction (<1 mm), apart from the magnetic fraction after the plate separator, the presence of quartz SiO2 in the range of 59.8% to 62.3% was detected.
The copper that was identified in the obtained fractions in the metallic form Cu (5.6% in fraction IV), Cu (46.5%, f. II), Cu with a mixture of Zn (23.9%, f. II), Cu with a mixture of Pb, Sn, Zn (11.3%, f. II), and also as oxides: cuprite Cu2O (from 8.9% f. IV to 29.4% f. VI), tenorite CuO (from 2.1% f. VI to 4.8% f. IV), Tl0.01Cu3.99 in the range of 5.1% (f. VI) to 6.7% (f. V) and CuGaTe2 (1.4%, f. V).

4. Conclusions

The thermal treatment of-MPhW in the fluidal reactor was carried out periodically, and through the burning of propane–butane gas in the air, it was possible to execute the process in autothermal conditions. It caused the loss of 25.9% of the input e-waste mass and the remaining incombustible residue formed a brittle material, which was subsequently subjected to the process of crushing, grinding and, finally, magnetic enrichment.
The magnetic enrichment of the grain size larger than 1 mm (using the neodymium magnet) and grain size smaller than 1 mm (using the three-phase plate electromagnetic separator and 1-disc tape-type separator) allowed for the recovery of 81.9% of cobalt, 96.6% of iron and 99.2% of neodymium from the magnetic fractions.
It can be concluded that, in order to effectively magnetically enrich these types of materials, grains of a size up to 1 mm are satisfactory and any additional grinding to obtain grains the size below 0.5 mm is not necessary. The best results in the process of magnetic enrichment of the chemical elements, especially of neodymium (precious rare earth), were achieved using the three-phase plate electromagnetic separator. The neodymium was separated in the form of an alloy, Fe14Nd2B (31.4%): it is one of the best materials in the production of permanent magnets.
The non-magnetic fraction obtained by means of magnetic enrichment contained 90.8% of tin, 86.9% of gold, 88.2% of copper and 81.4% of silver.
The magnetic separation using the neodymium magnet, the three-phase plate electromagnetic separator and 1-disc tape-type separator allowed for the separation of the ferromagnetic elements (Co, Fe, Nd) from the non-magnetic elements (Cu, Sn, Au, Ag) with high efficiency.
During the MPhW thermal treatment in oxidation conditions, different quantities of exhaust gasses were created depending on the chemical composition and the content of the combustible components in the MPhW (casing, screen, keyboard, PCBA).
The greatest temporary increase in CO and VOC could be observed during the treatment of the phone casings due to the plastics and the electronic elements.
Moreover, the temporary high CO and LZO concentrations during the thermal treatment of the casings was due to the fact that they, almost exclusively, are made from flammable materials.
The lowest gas emissions during the thermal treatment were generated by the keyboard and the phone screen.
In many instances, a high emission coefficient for CO was noted, reaching 351 mg g−1, and for the volatile organic compounds the coefficient of 23.7 mg g−1 was reached. The main reason was the small scale and the small size of the research installation, implying the lack of technological capabilities in achieving the minimal contact time in the bed. Increasing the size of the reactor and adequate combustion in the thermal or catalytic chamber would significantly reduce the CO and LZO emission concentrations. It has been observed that, from among organic compounds, the emission of benzene reached 9.64 mg g−1, phenol 4.39 mg g−1 and naphthalene 4.60 mg g−1, which may be related to the chemical characteristics of the individual samples. In the case of other organic compounds, the emission levels were much lower: 3.03 mg g−1 for ethylene, 2.39 mg g−1 for methane, up to 1.52 mg g−1 for acetylene and up to 1.49 mg g−1 for ethane. The obtained emission results of the particular organic compound indicate inadequate combustion, acknowledging the need for a secondary burning in a suitable chamber if such a process has to be performed on a large industrial scale. The highest average emission coefficient among avid components were observed: (0.99 g−1) for NOx and (1.00 mg g−1) for SO2, and 0.10 mg g−1 and 0.26 mg g−1 for HBr and HCI, respectively.
The combination of the thermal process using the fluidal reactor together with the magnetic enrichment fully confirms the correctness of the adopted method. The metal recovery results obtained and the pollution emission factors represent valuable data that may be useful in designing the WEEE thermal treatment installations.

Author Contributions

Conceptualization, A.K. and W.Ż.; methodology, A.K. and W.Ż.; validation, A.K., W.Ż. and J.W.; investigation, A.K. and J.W.; resources, A.K. and J.W.; data curation, W.Ż.; writing—original draft preparation, A.K.; writing—review and editing, J.W.; visualization, A.K. and J.W.; supervision, W.Ż. All authors have read and agreed to the published version of the manuscript.

Funding

This research received no external funding.

Conflicts of Interest

The authors declare no conflict of interest. The funders had no role in the design of the study; in the collection, analyses, or interpretation of data; in the writing of the manuscript, or in the decision to publish the results.

Abbreviations

MPhWmobile phone waste
PCAprinted circuit assembly
PCBAprinted circuit board assembly
VOCvolatile organic compound
WEEEwaste electrical and electronic equipment
0raw material after MPhW thermal treatment
Imagnetic fraction (>1 mm) after magnetic separation by neodymium magnet
IInon-magnetic fraction (>1 mm) after magnetic separation by neodymium magnet
IIImagnetic fraction (<1 mm) after enrichment by three-phase plate electromagnetic separator
IVmagnetic fraction (<1 mm) after enrichment by belt type 1-disc electromagnetic separator
Vmagnetic fraction (<0.5 mm) after enrichment by belt type 1-disc electromagnetic separator
VInon-magnetic fraction (<0.5 mm) after enrichment by belt type 1-disc electromagnetic separator
Greek symbols
γyield of the fraction; kgi/kg0, i {I,II,III,IV,V,VI}
∑γthe accumulated yield of the fractions; kg/kg0
λthe metal content in the fraction; kgMe,i/kgi
αthe metal content in the feed; kgMe,0/kg0
βthe metal content in the combined fractions; kgMe/kg
Kenrichment factor
εyield of the metal; kgMe,i/kg0
∑ εthe accumulated yield of the metal; kgMe/kg0

References

  1. Maragkos, K.G.; Hahladakis, J.N.; Gidarkos, E. Qualitative and quantitative determination of heavy metals in waste cellular phones. Waste Manag. 2013, 33, 1882–1889. [Google Scholar] [CrossRef] [PubMed]
  2. Balde, C.P.; Kuehr, R.; Blumenthal, K.; Gill, S.F.; Kern, M.; Micheli, P.; Magpantay, E.; Huisman, J. E-Waste Statistics: Guidelines on Classifications, Reporting and Indicators; United Nations University: Bonn, Germany, 2015; ISBN 978-92-8-084554-9. [Google Scholar]
  3. Khetriwal, D.S.; Kraeuchi, P.; Widmer, R. Producer responsibility for e-waste management: Key issues for consideration e learning from the Swiss experience. J. Environ. Manag. 2009, 90, 153–165. [Google Scholar] [CrossRef]
  4. Liu, W.; Chen, L.; Tian, J. Uncovering the Evolution of Lead In-Use Stocks in Lead-Acid Batteries and the Impact on Future Lead Metabolism in China. Environ. Sci. Technol. 2016, 50, 5412–5419. [Google Scholar] [CrossRef] [PubMed]
  5. Tanskanen, P. Management and recycling of electronic waste. Acta Mater. 2013, 61, 1001–1011. [Google Scholar] [CrossRef]
  6. Tuncuk, A.; Stazi, V.; Akcil, A.; Yazici, E.Y.; Deveci, H. Aqueous metal recovery techniques from e-scrap: Hydrometallurgy in recycling. Miner. Eng. 2012, 25, 28–37. [Google Scholar] [CrossRef]
  7. Bachér, J.; Mrotzek, A.; Wahlström, M. Mechanical pre-treatment of mobile phones and its effect on the Printed Circuit Assemblies (PCAs). Waste Manag. 2015, 45, 235–245. [Google Scholar] [CrossRef]
  8. Frost and Sullivan. European Waste Electrical and Electronics Equipment Recycling Market. 2013. Available online: http://www.endseurope.com/docs/131001c.pdf (accessed on 18 September 2020).
  9. Boldoczki, S.; Thorenz, A.; Tuma, A. The environmental impacts of preparation for reuse: A case study of WEEE reuse in Germany. J. Clean. Prod. 2019, 252, 119736. [Google Scholar] [CrossRef]
  10. Baldé, C.P.; Wang, F.; Kuehr, R.; Huisman, J. The Global e-Waste Monitor—2014; United Nations University, IAS–SCYCLE: Bonn, Germany, 2015. [Google Scholar]
  11. Batteiger, A.; Rotter, V.S. Material Implications of Rural Electrification—A Methodological Framework to Assess In-Use Stocks of Off-Grid Solar Products and EEE in Rural Households in Bangladesh. Recycling 2018, 3, 7. [Google Scholar] [CrossRef] [Green Version]
  12. Robinson, B.H. E-waste: An assessment of global production and environmental impacts. Sci. Total Environ. 2009, 408, 183–191. [Google Scholar] [CrossRef] [PubMed]
  13. UNEP. Call for Global Action on E-Waste—United Nations Environment Programme (UNEP). 2013. Available online: http://www.unep.org/Documents.Multilingual/Default.asp?ArticleID=5447&DocumentID=496&l=en (accessed on 20 August 2020).
  14. Glöser, S.; Soulier, M.; Espinoza, L.A.T. Dynamic Analysis of Global Copper Flows. Global Stocks, Postconsumer Material Flows, Recycling Indicators, and Uncertainty Evaluation. Environ. Sci. Technol. 2013, 47, 6564–6572. [Google Scholar] [CrossRef]
  15. Nikulski, J.; Ritthoff, M.; von Gries, N. The Potential and Limitations of Critical Raw Material Recycling: The Case of LED Lamps. Resources 2021, 10, 37. [Google Scholar] [CrossRef]
  16. Oguchi, M.; Sakanakura, H.; Terazono, A.; Takigami, H. Fate of metals contained in waste electrical and electronic equipment in a municipal waste treatment process. Waste Manag. 2012, 32, 96–103. [Google Scholar] [CrossRef]
  17. Kasper, A.C.; Bernardes, A.M.; Veit, H.M. Characterization and recovery of polymers from mobile phone scrap. Waste Manag. Res. 2011, 29, 714–726. [Google Scholar] [CrossRef]
  18. Kumar, A.; Dixit, G. A novel hybrid MCDM framework for WEEE recycling partner evaluation on the basis of green competencies. J. Clean. Prod. 2019, 241, 118017. [Google Scholar] [CrossRef]
  19. Directive 2002/96/EC of the European Parliament and of the Council of 27 January 2003 on Waste Electrical and Electronic Equipment. Available online: https://lexparency.org/eu/32002L0096/ (accessed on 4 July 2021).
  20. Directive 2012/19/EU of the European Parliament and of the Council of 4 July 2012 on Waste Electrical and Electronic Equipment (WEEE). Available online: https://eur-lex.europa.eu/legal-content/EN/TXT/PDF/?uri=CELEX:32012L0019&from=EN (accessed on 4 July 2021).
  21. Cui, J.; Forssberg, E. Mechanical recycling of waste electric and electronic equipment: A review. J. Hazard. Mater. 2003, 99, 243–263. [Google Scholar] [CrossRef]
  22. Rao, S.R. Recycling Metal. In Waste Management Series; Rao, S.R., Ed.; Vol. 7–Resources Recovery and Recycling from Metallurgical Wastes; Elsevier Science: Amsterdam, The Netherlands, 2006; Chapter 7. [Google Scholar]
  23. Xu, C.; Zhang, W.; He, W.; Li, G.; Huang, J. The situation of waste mobile phone management in developed countries and development status in China. Waste Manag. 2016, 58, 341–347. [Google Scholar] [CrossRef]
  24. Eurostat. Waste Statistics–Electrical and Electronic Equipment. 2016. Available online: http://ec.europa.eu/eurostat/statisticsexplained/index.php/Waste_statistics_electrical_and_electronic_equipment#EEE_put_on_the_market_and_WEEE_collected_and_treated_in_the_EU (accessed on 27 January 2020).
  25. Ismail, H.; Hanafiah, M.M. An overview of LCA application in WEEE management: Current practices, progress and challenges. J. Clean. Prod. 2019, 232, 79–93. [Google Scholar] [CrossRef]
  26. Khaliq, A.; Rhamdhani, M.A.; Brooks, G.; Masood, S. Metal Extraction Processes for Electronic Waste and Existing Industrial Routes: A Review and Australian Perspective. Resources 2014, 3, 152–179. [Google Scholar] [CrossRef] [Green Version]
  27. Kiddee, P.; Naidu, R.; Wong, M.H. Electronic waste management approaches: An overview. Waste Manag. 2013, 33, 1237–1250. [Google Scholar] [CrossRef]
  28. Kolias, K.; Hahladakis, J.N.; Gidarakos, E. Assessment of toxic metals in waste personal computers. Waste Manag. 2014, 34, 1480–1487. [Google Scholar] [CrossRef] [PubMed]
  29. Salhofer, S.; Steuer, B.; Ramusch, R.; Beigl, P. WEEE management in Europe and China–A comparison. Waste Manag. 2016, 57, 27–35. [Google Scholar] [CrossRef]
  30. Singh, N.; Duan, H.; Yin, F.; Song, Q.; Li, J. Characterizing the Materials Composition and Recovery Potential from Waste Mobile Phones: A Comparative Evaluation of Cellular and Smart Phones. ACS Sustain. Chem. Eng. 2018, 6, 13016–13024. [Google Scholar] [CrossRef]
  31. Widmer, R.; Oswald-Krapf, H.; Sinha-Khetriwal, D.; Schnellmann, M.; Böni, H. Global perspectives on e-waste. Environ. Impact Assess. Rev. 2005, 25, 436–458. [Google Scholar] [CrossRef]
  32. Kasper, A.C.; Berselli, G.B.T.; Freitas, B.D.; Tenório, J.A.S.; Bernardes, A.M. Printed wiring boards from mobile phones: Characterization and recycling of copper. Waste Manag. 2011, 31, 2536–2545. [Google Scholar] [CrossRef]
  33. Monneron-Enaud, B.; Wiche, O.; Schlömann, M. Biodismantling, a Novel Application of Bioleaching in Recycling of Electronic Wastes. Recycling 2020, 5, 22. [Google Scholar] [CrossRef]
  34. Murugan, R.V.; Bharat, S.; Deshpande, A.P.; Varughese, S.; Haridoss, P. Milling and separation of the multi-component printed circuit board materials and the analysis of elutriation based on a single particle model. Powder Technol. 2008, 183, 169–176. [Google Scholar] [CrossRef]
  35. Palmieri, R.; Bonifazi, G.; Serranti, S. Recycling-oriented characterization of plastic frames and printed circuit boards from mobile phones by electronic and chemical imaging. Waste Manag. 2014, 34, 2120–2130. [Google Scholar] [CrossRef] [PubMed]
  36. Yamane, L.H.; de Moraes, V.T.; Espinosa, D.C.R.; Ten’orio, J. Recycling of WEEE: Characterization of spent printed circuit boards from mobile phones and computers. Waste Manag. 2011, 31, 2553–2558. [Google Scholar] [CrossRef]
  37. Kaya, M. Electronic Waste and Printed Circuit Board Recycling Technologies; Springer: Berlin, Germany, 2019. [Google Scholar] [CrossRef]
  38. Rene, E.R.; Sethurajan, M.; Ponnusamy, V.K.; Kumar, G.; Dung, T.N.B.; Brindhadevi, K.; Pugazhendhi, A. Electronic waste generation, recycling and resource recovery: Technological perspectives and trends. J. Hazard. Mater. 2021, 416, 125664. [Google Scholar] [CrossRef]
  39. Rieger, T.; Oey, J.; Palchyk, V.; Hofmann, A.; Franke, M.; Hornung, A. Chemical Recycling of WEEE Plastics—Production of High Purity Monocyclic Aromatic Chemicals. Processes 2021, 9, 530. [Google Scholar] [CrossRef]
  40. Woynarowska, A.; Żelazny, S.; Żukowski, W. Thermal treatment of electronic waste in a fluidised bed and chemical digestion of solid products. Waste Manag. Res. 2016, 34, 605–618. [Google Scholar] [CrossRef] [PubMed]
  41. Schmidt-Szałkowski, K.; Szafran, M.; Bobryk, E.; Sentek, J. Chemical Technology-Inorganic Industry; Wydawnictwo Naukowe PWN: Warszawa, Poland, 2013. [Google Scholar]
  42. Cesaro, A.; Belgiorno, V.; Gorrasi, G.; Viscusi, G.; Vaccari, M.; Vinti, G.; Jandric, A.; Dias, M.I.; Hursthouse, A.; Salhofer, S. A relative risk assessment of the open burning of WEEE. Environ. Sci. Pollut. Res. 2019, 26, 11042–11052. [Google Scholar] [CrossRef] [Green Version]
  43. Berkowicz, G.; Majka, T.; Żukowski, W. The pyrolysis and combustion of polyoxymethylene in a fluidised bed with the possibility of incorporating CO2. Energy Convers. Manag. 2020, 214, 112888. [Google Scholar] [CrossRef]
  44. Żukowski, W.; Berkowicz, G. The combustion of polyolefins in inert and catalytic fluidised beds. J. Clean. Prod. 2019, 236, 117663. [Google Scholar] [CrossRef]
  45. Żukowski, W.; Berkowicz, G. The combustion of liquids and low-density solids in a cenospheric fluidised bed. Combust. Flame 2019, 206, 476–489. [Google Scholar] [CrossRef]
  46. Żukowski, W.; Berkowicz, G. Hydrogen production through the partial oxidation of methanol using N2O in a fluidised bed of an iron-chromium catalyst. Int. J. Hydrogen Energy 2017, 42, 28247–28253. [Google Scholar] [CrossRef]
  47. Olek, M.; Baron, J.; Żukowski, W. Thermal decomposition of selected chlorinated hydrocarbons during gas combustion in fluidized bed. Chem. Cent. J. 2013, 7, 2. [Google Scholar] [CrossRef] [Green Version]
  48. Olek, M.; Kandefer, S.; Kaniowski, W.; Żukowski, W.; Baron, J. Carbon shale combustion in the fluidized bed reactor. Pol. J. Chem. Technol. 2014, 16. [Google Scholar] [CrossRef] [Green Version]
  49. Żukowski, W.; Jankowski, D.; Baron, J.; Wrona, J. Combustion dynamics of polymer wastes in a bubbling fluidized bed. J. Clean. Prod. 2021, 320, 128807. [Google Scholar] [CrossRef]
Figure 1. Diagram of a laboratory fluidised bed reactor.
Energies 14 05639 g001
Figure 2. The scheme of the magnetic enrichment process of solid products after the combustion of used mobile phones.
Energies 14 05639 g002
Figure 3. Changes in the concentrations of aliphatic and aromatic hydrocarbons and O2, CO, CO2, VOCs in the exhaust gases generated during thermal treatment of mobile phone waste in a fluidised bed.
Energies 14 05639 g003
Figure 4. Changes in the concentrations of NOx, SO2, HCN, NH3, HBr, HCl, HF, C6H6O and COCl2 in the exhaust gases generated during thermal treatment of mobile phone waste in a fluidised bed.
Energies 14 05639 g004
Table 1. Selected mobile phone waste before and after mechanical dismantling.
Mobile Phone before Mechanical DismantlingMobile Phone after Mechanical Dismantling
Energies 14 05639 i001 Energies 14 05639 i002
kit no. I
Energies 14 05639 i003 Energies 14 05639 i004
kit no. II
Energies 14 05639 i005 Energies 14 05639 i006
kit no. III
Table 2. Samples of the mobile phone waste 1 to 11 before and after thermal treatment in the fluidised bed and their weight losses.
No.Sample before
Thermal Treatment
m0
(g)
Sample after
Thermal Treatment
m1
(g)
Weight Loss
(%)
1 Energies 14 05639 i0072.68 Energies 14 05639 i0081.8630.60
2 Energies 14 05639 i0094.24 Energies 14 05639 i0102.8233.50
3 Energies 14 05639 i0110.96 Energies 14 05639 i0120.3068.75
4 Energies 14 05639 i0134.95 Energies 14 05639 i0143.2434.54
5 Energies 14 05639 i0153.15 Energies 14 05639 i0162.3924.13
6 Energies 14 05639 i0173.06-0.00100
7 Energies 14 05639 i0182.18 Energies 14 05639 i0191.9510.55
8 Energies 14 05639 i0203.46 Energies 14 05639 i0212.1338.44
9 Energies 14 05639 i0222.30-0.00100
10 Energies 14 05639 i0233.54 Energies 14 05639 i0242.7223.16
11 Energies 14 05639 i0252.35 Energies 14 05639 i0260.6472.77
m0—mass of the sample before thermal treatment, m1—mass of the sample after thermal treatment.
Table 3. Samples of the mobile phone waste from 12 to 20 before and after thermal treatment in the fluidised bed and their weight losses.
No.Sample before Thermal Treatmentm0
(g)
Sample after Thermal Treatmentm1
(g)
Weight Loss
(%)
12 Energies 14 05639 i0274.13 Energies 14 05639 i0282.7832.69
13 Energies 14 05639 i0292.20 Energies 14 05639 i0300.5873.63
14 Energies 14 05639 i0313.29 Energies 14 05639 i0322.3827.66
15 Energies 14 05639 i0331.90 Energies 14 05639 i0341.7110.00
16 Energies 14 05639 i0354.69 Energies 14 05639 i0363.5424.52
17 Energies 14 05639 i0374.81 Energies 14 05639 i0383.4029.31
18 Energies 14 05639 i0392.14-0.00100
19 Energies 14 05639 i0404.73 Energies 14 05639 i0414.416.76
20 Energies 14 05639 i0426.00 Energies 14 05639 i0434.8419.33
m0—mass of the sample before thermal treatment, m1—mass of the sample after thermal treatment.
Table 4. Emission of CO, VOC, aliphatic and aromatic hydrocarbons and phenol in the exhaust gases obtained during thermal treatment of waste mobile phones in a fluidised bed.
No.Mass (g)Emission (mg)
SampleCOC6H6C6H6OC10H8CH4C2H6C2H2C2H4VOCs
12.682354.540.691.541.610.620.871.5911.46
24.243175.711.252.492.310.991.021.9915.76
30.963074.950.572.192.300.881.082.9214.89
44.953977.302.043.253.091.321.132.6020.73
53.162905.260.274.072.521.001.012.8116.94
63.0672423.513.410.45.054.402.223.0061.97
72.1814.00.320.100.170.050.000.000.040.68
83.463095.352.422.003.111.060.471.5015.91
92.3071120.310.69.674.753.442.213.6554.62
103.543276.704.482.323.841.570.451.6621.02
112.352551.410.030.253.520.320.361.157.04
124.134638.134.653.204.341.850.702.2925.16
132.212403.590.531.132.160.541.111.8910.95
143.293745.302.112.463.631.090.531.9417.06
151.902425.981.541.832.620.850.511.6514.98
164.692323.820.321.022.110.670.942.4611.34
174.815345.911.622.533.811.090.882.5018.34
182.1475020.62.6010.43.792.323.264.5547.52
194.736827.312.613.235.291.711.043.7624.95
206.006929.553.344.415.852.210.943.9530.25
66.76809315655.269.066.027.920.747.9442.7
Table 5. The emission factor of CO, VOCs, aliphatic and aromatic hydrocarbons and phenol in the exhaust gases obtained during thermal treatment of waste mobile phones in a fluidised bed.
No.Mass (g)Emission Coefficient (mg g−1)
SampleCOC6H6C6H6OC10H8CH4C2H6C2H2C2H4VOCs
12.6887.91.700.260.580.600.230.320.604.29
24.2474.81.350.290.590.550.230.240.473.72
30.963195.150.602.282.390.911.133.0315.5
44.9580.21.480.410.660.630.270.230.534.21
53.1691.91.670.091.290.800.320.320.895.38
63.062367.684.393.401.651.440.720.9820.3
72.186.410.150.050.080.020.000.000.020.32
83.4689.21.540.700.580.90.310.140.434.60
92.303098.824.604.202.071.490.961.5923.7
103.5492.31.891.260.651.090.440.130.475.93
112.351090.600.000.111.50.140.150.492.99
124.131121.971.120.771.050.450.170.556.08
132.211091.630.240.510.980.240.500.864.96
143.291141.610.640.751.110.330.160.595.19
151.901273.140.810.961.380.450.270.877.88
164.6949.40.810.070.220.450.140.200.532.42
174.811111.230.340.530.790.230.180.523.82
182.143519.641.224.851.771.081.522.1322.2
194.731441.550.550.681.120.360.220.795.27
206.001151.590.560.730.970.370.160.665.04
Average coefficient1362.760.911.221.090.470.390.857.69
Table 6. Emission of SO2, NOx, HCN, NH3, HBr and HCl in the exhaust gases obtained during thermal treatment of waste mobile phones in a fluidised bed.
No.Mass (g)Emission (mg)
SampleSO2NOxHCNNH3HBrHCl
12.682.063.391.150.000.000.00
24.241.823.200.840.000.000.00
30.962.411.641.160.000.000.00
44.951.443.911.360.000.000.00
53.163.310.740.700.000.000.00
63.063.031.251.830.002.390.00
72.180.074.670.000.000.000.00
83.462.923.451.020.120.002.58
92.304.950.421.160.000.000.00
103.543.103.730.980.240.003.45
112.350.020.020.340.000.000.00
124.134.594.901.420.250.003.33
132.212.460.460.650.000.000.00
143.293.124.091.150.130.002.03
151.901.471.960.860.000.001.27
164.691.610.620.540.000.000.00
174.813.814.911.190.080.001.86
182.146.006.133.410.000.000.00
194.735.67.731.720.182.622.8
206.005.515.131.210.144.432.46
66.7659.362.422.71.159.4419.8
Table 7. The emission factor of SO2, NOx, HCN, NH3, HBr and HCl in the exhaust gases obtained during thermal treatment of waste mobile phones in a fluidised bed.
No.Mass (g)Emission Coefficient (mg g−1)
SampleSO2NOxHCNNH3HBrHCl
12.680.771.270.430.000.000.00
24.240.430.760.200.000.000.00
30.962.511.711.210.000.000.00
44.950.290.790.280.000.000.00
53.161.050.230.220.000.000.00
63.060.990.410.600.000.780.00
72.180.032.140.000.000.000.00
83.460.841.000.290.040.000.74
92.302.150.180.500.000.000.00
103.540.881.050.280.070.000.97
112.350.010.010.140.000.000.00
124.131.111.190.340.060.000.81
132.211.120.210.290.000.000.00
143.290.951.240.350.040.000.62
151.900.771.030.450.000.000.67
164.690.340.130.120.000.000.00
174.810.791.020.250.020.000.39
182.142.812.871.590.000.000.00
194.731.181.630.360.040.550.59
206.000.920.850.200.020.740.41
Average coefficient1.000.990.410.010.100.26
Table 8. Received fractions after magnetic enrichment processes.
SeparationFractionGrain Size (mm)Mass (g)Picture
The sample after crumbling and separating with sieves>170.4 Energies 14 05639 i044
Neodymium magnetMagnetic
(I)
>127.2 Energies 14 05639 i045
Non-magnetic
(II)
>143.2 Energies 14 05639 i046
The sample after crumbling and separating with sieves< 1263.2 Energies 14 05639 i047
Plate separatorMagnetic
(III)
< 12.5 Energies 14 05639 i048
Disc separatorMagnetic
(IV)
< 119.8 Energies 14 05639 i049
Disc separatorMagnetic
(V)
<0.522.6 Energies 14 05639 i050
Non-magnetic
(VI)
<0.5207.7 Energies 14 05639 i051
Table 9. The contents of selected chemical elements in each fraction.
Chemical ElementChemical Element Content in Fraction (g)
0IIIIIIIVVVI
Cu79.4622.25832.3587.76 × 10−23.014.04837.71
Fe27.24723.3440.7641.4251.4160.1350.164
Al1.8051.83 × 10−26.81 × 10−21 × 10−60.230.2561.233
Sn1.620.1130.6313.23 × 10−33.22 × 10−21.18 × 10−30.839
Zn3.1230.1692.2687.4×10−20.1348.42 × 10−20.394
Nd0.5081.58 × 10−37.9 × 10−50.3380.1595.22 × 10−33.99 × 10⁻³
Au0.1972.32 × 10−36.47 × 10−38.76 × 10−41.53 × 10−27.19 × 10−30.164
Co0.2050.1453.32 × 10−21.69 × 10−24.71 × 10−31.29 × 10−33.8 × 10−3
Ag1.2 × 10−22.6 × 10−55.6 × 10−51.8 × 10−41.51 × 10−34.7 × 10−49.47 × 10−3
Mo1.9 × 10−23.89 × 10−31.16 × 10−24.6 × 10−43.1 × 10−41.4 × 10−42.15 × 10−3
Other element
(Si, O, etc.)
219.40114570590.56314.7918.06167.17
fraction mass 333.627.243.22.5019.822.6207.7
Table 10. The enrichment balance of the performed magnetic separation of copper, iron, neodymium, cobalt and molybdenum.
Cu, α = 24.6%
Fractionγ, %∑γ,%λ, %β = ∑(γ × λ)/∑γ, %K = β/αε = γ × λ/α, %∑ ε = K × ∑γ, %
I8.428.428.308.300.3372.842.84
II13.421.874.949.172.0040.743.6
III0.7722.63.1047.591.930.09843.7
IV6.1328.715.240.671.653.7947.4
V7.0035.717.936.211.475.0952.5
VI64.310018.224.601.0047.5100
Fe, α = 8.44%
Fractionγ,%∑γ,%λ, %β = ∑(γ × λ)/∑γ, %K = β/αε = γ × λ/α,%∑ ε = K × ∑γ, %
I8.428.4285.885.810.285.785.7
II13.421.81.7734.24.062.8088.5
III0.7722.657.035.04.155.2393.7
IV6.1328.77.1529.13.455.2098.9
V7.0035.70.59723.52.780.49599.4
VI64.31000.0798.441.000.602100
Nd, α = 0.16%
Fractionγ,%∑γ,%λ, %β = ∑(γ × λ)/∑γ,%K = β/αε = γ × λ/α,%∑ ε = K × ∑γ, %
I8.428.420.0060.0060.0370.3110.311
II13.421.80.00020.0020.0150.0160.327
III0.7722.613.50.4662.9666.666.9
IV6.1328.70.8030.5383.4231.398.2
V7.0035.70.0230.4372.781.0399.2
VI64.31000.0020.1571.000.786100
Co, α = 0.06%
Fractionγ,%∑γ,%λ, %β = ∑(γ × λ)/∑γ, %K = β/αε = γ × λ/α,%∑ ε = K × ∑γ, %
I8.428.420.5330.5338.4070.870.8
II13.421.80.0770.2533.9916.287.0
III0.7722.60.6760.2684.228.2595.2
IV6.1328.70.0240.2163.402.3097.5
V7.0035.70.0060.1742.750.63098.1
VI64.31000.0020.0631.001.85100
Mo, α = 0.006%
Fractionγ,%∑γ,%λ, %β = ∑(γ × λ)/∑γ, %K = β/αε = γ × λ/α,%∑ ε = K × ∑γ, %
I8.428.420.0140.0142.4921.021.0
II13.421.80.0270.0223.8362.583.5
III0.7722.60.0180.0223.812.4886.0
IV6.1328.70.0020.0183.051.6787.7
V7.0035.70.0010.0142.480.75588.4
VI64.31000.0010.0061.0011.6100
Table 11. The enrichment balance of the performed magnetic separation of aluminium, zinc, tin, gold and silver.
Al, α = 0.56%
Fractionγ, %∑γ, %λ, %β = ∑(γ × λ)/∑γ, %K = β/αε = γ × λ/α, %∑ ε = K × ∑γ, %
I8.428.420.0670.0670.1201.01.0
II13.421.80.1580.1230.2203.84.8
III0.7722.60.0000.1190.2120.0004.8
IV6.1328.71.160.3410.61112.717.5
V7.0035.71.130.4960.88814.231.7
VI64.31000.5940.5591.0068.3100
Zn, α = 0.97%
Fractionγ, %∑γ, %λ, %β = ∑ γ × λ/∑ γ, %K = β/αε = γ × λ/α, %∑ ε = K × ∑γ, %
I8.428.420.6210.6210.6435.415.41
II13.421.85.253,463.5872.678,0
III0.7722.62.963.443.562.3780.4
IV6.1328.70.6772.852.954.2984.7
V7.0035.70.3732.372.452.7087.4
VI64.31000.1900.9671.0012.6100
Sn, α = 0.50%
Fractionγ, %∑γ, %λ, %β = ∑ γ × λ/∑ γ, %K = β/αε = γ × λ/α, %∑ ε = K × ∑γ, %
I8.428.420.4150.4150.8296.986.98
II13.421.81.461.062.1139.045.9
III0.7722.60.1291.032.040.19946.1
IV6.1328.70.1630.8411.681.9948.1
V7.0035.70.0050.6771.350.07348.2
VI64.31000.4040.5011.0051.8100
Au, α = 0.06%
Fractionγ, %∑γ, %λ, %β = ∑ γ × λ/∑ γ, %K = β/αε = γ × λ/α, %∑ ε = K × ∑γ, %
I8.428.420.0090.0090.1401.181.18
II13.421.80.0150.0120.2063.304.48
III0.7722.60.0350.0130.2180.4474.93
IV6.1328.70.0770.0270.4437.8012.7
V7.0035.70.0320.0280.4593.6716.4
VI64.31000.0790.0611.0083.6100
Ag, α = 0.004%
Fractionγ, %∑γ, %λ, %β = ∑ γ × λ/∑ γ, %K = β/αε = γ × λ/α, %∑ ε = K × ∑γ, %
I8.428.420.00010.00010.0260.2220.222
II13.421.80.00010.00010.0320.4780.700
III0.7722.60.0070.00040.0991.542.24
IV6.1328.70.0080.00190.52712.915.1
V7.0035.70.0020.00190.5364.0119.1
VI64.31000.0050.00361.0080.9100
Table 12. Crystalline phases in particular fractions determined by X-ray diffraction.
FractionCrystalline Phase Identified
SiCuFeSnOthers
I-Cu—42.2%Fe—57.3%-W—0.5%
IISi—1.1%Cu—46.5%
Cu (Zn)—23.9%
Cu (Pb, Sn, Zn)—11.3%
--Al—13.6%
C—3.6%
III--Fe14Nd2B—31.4%
Fe3O4—25.7%
SnO2—5.7%Ni—37.2%
IVSiO2—62.3%Cu2O—8.9%
CuO—4.8%
Cu—5.6%
CuFe—3.0%SnO3Sr—2.7%
SnO22.2%
BaTiO3—10.6%
VSiO2—61.0%Cu2O—25.3%
Tl0.01Cu3.99 —6.7%
CuO—3.6%
CuGaTe2—1.4%
-SnO2—2.2%-
VISiO2—59.8%Cu2O—29.4%
Tl0.01Cu3.99 —5.1%
CuO—2.1%
-SnO2—3.5%-
Publisher’s Note: MDPI stays neutral with regard to jurisdictional claims in published maps and institutional affiliations.

