Article

The Selection of the Most Cost-Efficient Distributed Generation Type for a Combined Cooling Heat and Power System Used for Metropolitan Residential Customers

School of Electrical Engineering, Inha University, Incheon 22212, Korea
*
Author to whom correspondence should be addressed.
Energies 2021, 14(18), 5606; https://doi.org/10.3390/en14185606
Submission received: 30 June 2021 / Revised: 18 August 2021 / Accepted: 1 September 2021 / Published: 7 September 2021
(This article belongs to the Special Issue Machine Learning for Energy Systems 2021)

Abstract

:
Distributed generation (DG) using renewable energy sources is of widespread interest. For example, modern centralized conventional fossil fuel power generation commonly adds DG using renewable energy resources to the grid. Therefore, in these changes, it is necessary to optimize renewable energy systems to increase energy efficiency and reduce emissions. In previous studies, meta-heuristic algorithms were used to optimize DG location and capacity, but different types of DG systems and integrated energy hub conditions were not considered. Determining the most effective DG type for an integrated energy hub is critical. Accordingly, this study presented a methodology for selecting the most cost-efficient DG for metropolitan residential customers of energy hubs. In this paper, we model energy hubs for residential customers and the most cost-efficient DG type using MATLAB and HOMER software, considering microturbine (MT), photovoltaic (PV), wind turbine, and fuel cell (FC) power sources. For this purpose, the energy hub was modeled as a combined cooling heat and power (CCHP) system and selected a specific metropolitan area as a testbed (Atlanta, USA). For practical simulation, the total active power of the Atlanta community was measured by multiplying the average load profile data of residential houses collected by open energy information (OpenEI). The first case study showed that optimal-blast MTs without absorption chillers (AbCs) were the most cost-efficient compared to other optimal-blast DG systems without AbCs. Additional second case studies for optimal and full-blast MTs with AbCs were performed to verify the results for energy consumption, costs, and emissions savings. As a result, full-blast MTs with AbCs comprise the most cost-efficient DG type in the CCHP system for metropolitan residential customers, reducing energy consumption, cost, and emissions.

Graphical Abstract

1. Introduction

One of the best solutions for compensating for power losses and voltage drop due to load growth is to operate with the optimal allocation of distributed generation (DG) systems [1,2,3,4]. Not only DG increases energy efficiency, but it also provides environmental benefits with lower emissions compared to coal- or oil-based central thermal power generation [5,6]. Therefore, regulatory agencies in several countries have imposed strict environmental protection regulations to encourage the switch to green energy sources, and several countries are working to reduce their dependence on fossil fuels and increase their production of renewable energy. For example, the Ministry of Trade and Industry in the Republic of Korea established a policy to increase power generation from renewable energy sources to 20% total generation by 2030 [7]. For these reasons, the DG systems have recently started to be added to power grids with increasing worldwide penetration, and a typical example is a photovoltaic (PV) system. Over the past decade since 2000, solar power has grown at an average annual rate of 42%. On the other hand, installation costs are reduced by 70%, and prices in Q4 2020 are among the lowest in all market segments [8].
DG systems typically use renewable energy resources, including PV, wind turbines, and fuel cells (FCs). Renewable energy is highly volatile, and DG systems and related energy storage systems have the challenge caused by injecting power into the grid (e.g., reverse power flow) [9,10]. Additionally, there is a problem that adding DG increases grid complexity. Therefore, it is necessary to properly allocate DG to effectively utilize it, and studies are needed to greatly increase energy efficiency by an optimal DG in energy hubs [11,12,13]. Furthermore, studies should be conducted considering economic feasibility as well as reducing energy losses and emissions.
Many studies have analyzed DG system impacts on costs, emissions, reliability, and power quality, following several approaches:
  • Finding optimal energy consumption when including DG options using meta-heuristic algorithms (e.g., artificial bee colony, genetic algorithm (GA) and particle swarm optimization (PSO));
  • Various analysis software for DG systems in an integrated energy hub system (e.g., Engineering Equation Solver (EES) or HOMER), typically using case studies regarding energy consumption, cost savings, or emissions savings, and
  • Analyzing carbon dioxides (CO2) and nitrogen oxide (NOx) emission effects.
Regarding the first approach, many previous researchers have used meta-heuristic algorithms to study the optimal energy consumption of DG systems. For example, Abu-Mouti and El-Hawary used an artificial bee colony algorithm to determine optimal DG capacity and location to minimize power losses [14]. Abou El-Ela, Allam, and Shatlab used GAs to determine the optimal DG location and capacity [15]. They have been shown to have an impact for improving voltage profile improvement (VPI), spinning reserve increasing (SRI), power flow reduction (PFR), and line-loss reduction (LLR). Gomez-Gonzalez, López, and Jurado defined the optimal DG location and capacity for minimizing power loss and voltage profile through four simulations [16]. They used PSO and compared the convergence curves of the objective function and the number of convergences, proving that it is a better solution than achieved using GA. However, in the case of studies such as the first approach, there is a limitation that an integrated energy hub system cannot be considered. Moreover, there is also a limitation that it is difficult to analyze the impact of energy consumption, cost savings, and emissions savings by DG.
To solve the limitations of the first approach, studies on the second approach have been conducted by many researchers. For example, Alam and Gao simulated hybrid system costs, electricity production, and emissions using HOMER, and examined feasibility for PV, wind, and diesel hybrid systems [17]. They proposed a fuzzy logic power flow controller to provide sustainable power and simulation results verified that wind, PV, and FC hybrid power systems could be feasible solutions for standalone applications. Mirzaee, Zare, and Sadeghzadeh modeled energy efficiency for cogeneration systems, including gas turbines, absorption chillers (AbCs), boilers, and heat exchangers, using an EES software [18]. For this, the values of energy efficiency (EE), energy used (UE), and utility fuel ratio (UFR) were calculated and analyzed. Nine scenarios were considered, and they confirmed that double-effect AbCs were more optimal than single-effect AbCs.
Previous studies optimized combined heat and power (CHP) systems and proposed the energy hub concept for power flow, reliability, system optimization, investment evaluation, and application [19,20]. Energy hubs including CHP systems have also been modeled [21]. Continued DG developments for CHP systems have made increased urban electricity, water, and natural gas distribution network interconnectivity and complexity. For this reason, studies on energy hubs have been enhanced to studies involving the interconnectivity and complexity of networks. For example, Zhang, Karady, and Ariaratnam designed individual electric, water, and gas network models to analyze integrated system dispatch models [22]. CHP systems based on DG were also included in the distribution systems. They considered multiple factors, including capacity bounds, power factors, gas supply, ambient temperatures, and nodal water pressures, and their mutual effects on CHP-based DG systems and distribution networks’ operational performances for optimal CHP-based DG systems’ allocations. Li and Wang studied optimizing a renewable energy integrated combined cooling heat and power (CCHP) system [23]. They implemented a multi-objective (e.g., total annual cost, carbon dioxide emission, potential loss of energy supply) optimization model to characterize system reliability, system cost, and environmental sustainability. For these purposes, they considered the number of PV panels and wind turbines, the tilt angle of the PV panel, the height of the wind turbines, maximum fuel consumption, battery, and heat storage tanks as variables’ configuration. Kim, James and Crittenden used HOMER to simulate modern net-zero energy buildings with such CCHP, PV, and AbCs [24]. They presented considering hosting only the CCHP system or CCHP and PV systems in an office building, and confirmed improved energy efficiency and economic sensitivity for CCHP and PV systems.
Although studies of the first approach focused on meta-heuristic algorithms (e.g., artificial bee colony, GA, and PSO) to achieve optimal DG location and capacity, the energy hubs were not considered in these studies. Moreover, energy consumptions, cost savings, and emissions savings by DG were not analyzed. Studies on the second approach were supplemented by considering the energy hubs, but the most cost-efficient of DG was not investigated in the CHP system for metropolitan resident customers. Furthermore, energy consumption and emissions savings from using the CHP system with AbCs have not been investigated for metropolitan residential customers. For example, AbCs can convert waste heat to cooling water or air, maximizing energy usage efficiency.
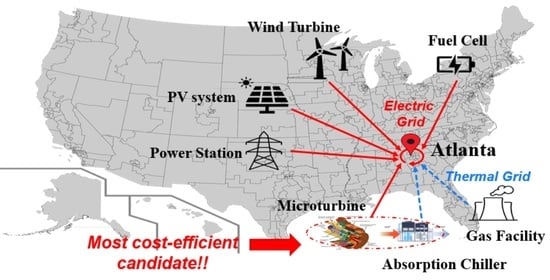
This paper developed an energy hub model for residential customers to determine the most cost-efficient DG type, considering PV, wind turbines, FCs, and microturbines (MTs) with AbCs. We selected a specific metropolitan area as a testbed (Atlanta, USA), and used MATLAB and HOMER to determine MTs with AbCs to be the most cost-effective candidate DG. Optimal scheduling for MTs and AbCs minimized DG and AbC life-cycle costs and electric and thermal energy purchasing costs from the external system. As an additional case study, electrical and thermal energy, costs, and emissions savings were compared by changing optimal DG operation modes (e.g., full or optimal-blast, with or without AbC in the CHP system, etc.).
The remainder of this paper is organized as follows. Section 2 presents the problem statement and Section 3 describes proposed mathematical DG and AbC models for energy systems. Section 4 performs case studies and Section 5 summarizes simulation results to verify the proposed methods. Finally, Section 6 and Section 7 discuss and conclude the paper.

2. Problem Statement

The objective of this study was to determine the most cost-efficient DG type for metropolitan residential customers and analyze subsequent energy consumption and emissions savings. Therefore, we investigated DG cost-efficiency for optimal or full-blast scenarios for PV, wind, FC, and MT either with or without AbCs. Figure 1 shows the considered electrical and heat energy hub hosting CHP-AbCs, PV, wind turbines, FCs, and converters. For this purpose, we modeled a CCHP system, central heat utility, MT, AbCs, PV, wind turbines, FCs, and converters, where the CCHP system could maximize energy efficiency using AbCs to provide cooling water or air from waste heat in summer. Peak hours during summer have the most expensive fuel generation, and the model can also provide additional heating and hot water from waste heat in winter.
We analyzed electrical and thermal energy, and emissions savings for each scenario, and determined that optimal scheduling MTs was the most cost-efficient DG type. We additionally studied the effect of AbCs on energy consumption, economics, and emissions, and the most efficient is full-blast MTs with AbCs. As a result, we examined optimal DG effects on CHP systems and presented a methodology to investigate the most cost-efficient DG.

3. Proposed Method

Energy system inputs and outputs for various DG types were modeled, including PV, wind turbines, FCs, and MTs with AbCs to convert waste heat into chilled air or water.

3.1. Combined Cooling Heat and Power System

CCHP systems usually generate heat and power simultaneously using an internal combustion engine, commonly located in a facility that requires both electrical and thermal energy. CHP systems can provide up to 20% fuel savings [25] compared to dual systems with segregated heat generation and production. Total CCHP generation can be expressed as [24]:
P e n e t r a t i o n   L e v e l = j t e s t b e d P P , j P p e a k
where
P P , j = power output for CCHP system j (kW or MW),
P p e a k = total peak power output for a testbed (kW or MW).

3.1.1. Microturbine

Equation (2) shows typical characteristics for the C65 Capstone MT generator used as an example CCHP system, linearized by least square:
P i = a i F i + b i ,
where
P i = power output (kW) for the ith MT,
F i = natural gas fuel input (L/hour) for the ith MT.
Figure 2 shows the first-order linearization of the input (natural gas fuel) and output (power) of MT using least-squares. For example, C65 MT burns 0.1155 $/m3 of natural gas, producing electrical power = 65 kW and a heat output = 119.57 kW (408,000 BTU/h) [26,27]. Detailed parameters for the MT are presented in the Appendix A.

3.1.2. Absorption Chillers

MTs with AbCs can use waste heat to generate cooling air or water. For example, cooling demand is dominant during summer, hence MTs with AbCs can significantly reduce the energy costs by converting waste heat to chilled air or water, avoiding purchasing energy for cooling demand from the external grid, which typically burns the most expensive fuel. In this study, we estimated AbC thermal output by multiplying loss coefficients. Performance coefficient = 0.75 and pipe loss coefficient = 0.9 [28] when recovering cooling air or water from MT waste heat. The CCHP does not require cooling energy from the grid when AbCs recover cooling air and water, reducing demand power (Pdemand) by:
P d e m a n d = P o r i P A b C .
where
P o r i = original electrical demand data for residential customers in kW,
P A b C = theoretical thermal output data able to be recovered by AbCs in kW.
These modified demand data are used as input for HOMER.

3.1.3. Fuel Cell

FCs are stacks of electrochemical cells that convert chemical energy from hydrogen fuel and oxidizer into electrical energy through redox reactions. They are often commercial and industrial applications operating around the clock and offering easy transportation with quiet and flexible operation. FCs can be aggregated in concert to react to grid demand. FCs can continuously produce electrical energy when fuel and oxygen are supplied, reducing grid congestion in areas (e.g., a densely populated area) where demand can fluctuate significantly. They are generally more efficient than thermal fossil fuel-burning power plants because FCs convert up to 60% chemical energy into electricity [29]. Detailed FC parameters are provided in the Appendix A and generation efficiency can be estimated as [17]:
n = n t n e n r
where
n , n t , n e , and n r = total, thermal, electric, and reaction efficiencies.

3.1.4. Wind Turbine

Wind turbine generators convert wind kinetic energy into mechanical power through a rotary shaft to produce electrical energy, and many previous studies have presented detailed models and principles [30,31]. The AC power generated by the wind turbine generator is transmitted to the AC bus, which is converted through an AC/DC converter located between AC and DC buses (e.g., wind turbine type 4). Detailed wind turbine and converter parameters are presented in the Appendix A. Wind turbine output can be expressed as [17]:
P m = 1 2 C p ( λ , β ) ρ A ν w i n d 2
where
P m = mechanical output power of the turbine,
C p = performance coefficient of the wind turbine,
λ = tip speed ratio of the blade tip speed to wind speed,
β = blade pitch angle (ο),
ρ = air density (kg/m3),
ν w i n d = wind speed (m/s).

3.1.5. Photovoltaic

PV systems comprise inverters and solar panels that generate electricity from solar energy. Photons fall on the solar panel and generate an electric current through the PV effect. Although each panel generates a relatively small amount of energy, many panels can be linked to generate significant total energy. A PV generates DC, which can be converted to AC using an inverter. Detailed PV module and converter parameters are presented in the Appendix A. Available PV cell, array, or module AC power after conversion can be estimated as [17]:
P a c = P d c , S T C η
where
P a c = AC power obtained,
P d c , S T C = rated DC power under standard test conditions,
η = conversion efficiency of the DC/AC converter.

3.2. Objective Function

This study uses the objective function that calculates the total annualized cost and the total net present cost (NPC) and ranks all the feasible DG configurations to find the most cost-efficient DG type. For this purpose, this study uses HOMER, the objective function of which is the minimization of the total NPC. The total NPC (CNPC,tot) is the sum of all present costs incurred by the system minus the revenues gained during its lifetime and it can be expressed as [32]:
C N P C , t o t = C c o s t , t o t C r e v e n u e
Additionally, the revenue includes residual values and grid sales revenues.
The total annualized cost (Cann,tot) is the annualized value of the NPC. The total annualized cost can be expressed as [32]:
C a n n , t o t = C R F ( i , R p r o j ) × C N P C , t o t
where
C N P C ,   t o t = the total net present cost ($),
i = the annual real discount rate (%),
R p r o j = the project lifetime (year),
C R F = a function of returning the capital recovery factor.
Costs include capital costs, replacement costs, OM costs, fuel costs, and it can be expressed as:
C e l e m e n t   =   i = 1 8760 j = 1 c a p i t a l C c a p i t a l ( P c a p i t a l ,   i , j ) + i = 1 8760 j = 1 O M C O M ( P O M ,   i , j )        + i = 1 8760 j = 1 r e p l a c e m e n t C r e p l a c e m e n t ( P r e p l a c e m e n t ,   i , j )        + i = 1 8760 j = 1 l i f e t i m e C l i f e t i m e ( P l i f e t i m e ,   i , j )        + i = 1 8760 j = 1 f u e l C f u e l ( P f u e l ,   i , j )

3.3. DG Modeling Using HOMER and MATLAB

HOMER software models microgrid system design [32]. For example, HOMER can estimate life-cycle costs for electric or thermal systems, including microgrid, CHP, DG, or energy storage systems, defined as the total cost of installing and operating over their life spans. Figure 3 shows the HOMER design process used in this study. HOMER examines all feasible microgrid configurations to minimize total NPC [33] and selects the most feasible solution at the lowest total cost. Thus, we optimally scheduled annual operations for various DG systems and AbCs in hourly intervals using HOMER. However, HOMER does not yet support AbCs, and Section 3.1.2 shows the process that models AbC effects on CCHP systems. The results from HOMER simulations were analyzed using MATLAB, as shown in Figure 3, and verified in subsequent case studies.

4. Case Study

This study presents the methodology for selecting the most cost-efficient DG type for metropolitan residential customers (e.g., Atlanta). For this purpose, we considered Atlanta USA as a testbed for case studies to analyze DG impacts on metropolitan residential customers. Capital, replacement, operating and maintenance costs (OM), lifetime, search space, fuel consumption, and emissions are factors to be considered to determine the most cost-efficient DG type. In the first scenario, which will be presented in the following section (e.g., Section 5.1), we present a case study for metropolitan residential customers to find the most cost-efficient DG type in the CCHP system. In the second scenario (e.g., Section 5.2), it is necessary to extend the first scenario results (e.g., Section 5.1). The first scenario results did not take into account how the DG was operated and the presence or absence of AbCs. These factors affect energy consumption, cost savings, and emission reduction and need to be considered. For this purpose, in Section 5.2, we compare the energy consumption, cost savings, and emissions reduction either with or without AbCs, and CCHP operational modes for full or optimal-blast scenarios. Moreover, to demonstrate these simulation results, the electric and thermal load profile data of the Atlanta area are applied as input to HOMER and MATLAB software. The detailed MT, FC, wind turbine, PV, and converter parameters are presented in the Appendix A.

4.1. Electric and Thermal Load Profile

Since loads (or demands) vary momentarily depending on customer needs, we collected load data at hourly intervals for metropolitan residential customers (e.g., Atlanta) from open energy information (OpenEI) in the Atlanta area in 2013 [34], summarized in Table 1. Figure 4 shows the electrical and thermal load profile for metropolitan residential customers in the Atlanta area [24], where 1 unit represents the electrical (4.13 kW, 1 August) and thermal (13.28 kW, 12 February) peaks. Cooling demand was dominant for the summer electric peak day, whereas heating demand was dominant for the winter thermal peak day. Load factors, for electric and thermal demands = 0.36 and 0.09, respectively, are defined as the ratio of average to maximum load over a given period.

4.2. Case Study Input Data

The first scenario optimally scheduled all DG systems without AbCs. Since the CCHP system in Atlanta was unavailable, we examined the Masonic Village in Elizabethtown, Pennsylvania, USA, which recently installed six 65 kW Capstone MTs in metropolitan residential facilities [35], and assumed the same MTs were available in Atlanta to identify the effect of AbCs for residential customers in a metropolitan area. For the feasibility of these simulation conditions, the energy use patterns (e.g., cooling, fans, heating, lighting, equipment, unknown) and load profiles of Masonic Village were investigated and compared to Atlanta for similarity. Since there is no energy observatory in Masonic Village, the data from the energy observatory in Harrisburg, which is closest to Masonic Village, were used. Figure 5 shows energy usage patterns like Figure 4a in Section 4.1, and Figure 6 and Figure 7 show that the annual electric and thermal demands of Atlanta and Masonic Village are similar.
The Masonic Village serves 1700 residents, hence the number of households ≈669 assuming 2.54 people per household [24,36]. We scaled the total active power for the Atlanta community by multiplying this number of households by the mean load profile data for metropolitan residential customers collected from OpenEI [34]. Load profile data have electrical peak = 2762 kW and thermal peak = 8884.94 kW, hence total penetration for the CCHP system comprising six 65 kW Capstone MTs for the proposed Atlanta area = 14.1% (65 kW × 6)/(4.13 kW × 669) from equation (1), corresponding to the recommended limit, or 15% peak load proposed in [37].
Table 2 shows cost input data for the simulation model to analyze the CCHP system’s economic impacts on energy generation costs. Georgia Power Company (GPC) on-peak hours = 2–7 p.m. June to September with total cost 203.217 $/MWh [38]. The remaining off-peak hours’ cost = 49.409 $/MWh [38]. Natural gas prices for electric power in Georgia = 0.1155 $/m3 in 2015 [26].
The second scenario assumed MTs operated constantly, referred to as a full-blast scenario, and compares the optimally operating MT effects. As a difference from the first scenario, the AbCs were added. Metropolitan residential customers do not need energy for cooling, which often overlaps peak hours, using the most expensive fuel when AbCs produce chilled water or air from waste heat. Thus, optimally scheduling the AbCs can reduce energy costs, and cooling loads can be met by recovering chilled air or water from waste heat within capacity limits. We also examined energy consumption, costs, and emissions savings between MTs with or without AbCs and optimal or full-blast during on or off-peak hours.

5. Simulation Results

5.1. Most Cost-Efficient DG in Optimal-Blast Operation without AbCs

This section compares and analyzes life-cycle costs to select the most cost-efficient DG candidates. The life-cycle cost is the sum of initial costs, i.e., design and manufacturing costs, and OM for operation, maintenance, and disposal. It is important to consider life-cycle costs when measuring facility economy and to ensure reliability, safety, preservation, and quality.
Table 3 shows life-cycle cost simulation results for the first scenario, which is the most cost-efficient DG for metropolitan residential customers. MTs have a life-cycle cost = $8.28 M, lower than all other DG systems, and hence were the best candidate without considering AbCs. Figure 8 shows life-cycle cost variations for each DG. MT is the most cost-efficient DG type of those considered, but the case without DG (denoted as No DG) has life-cycle cost = $8.25 M, $0.03 M less than including MT. Therefore, it is important to consider cost-efficient MT operation in conjunction with AbCs.
The C65 MT shows a total system efficiency LHV of 82% because it can produce both electrical and thermal energy during peak hours when it consumes expensive fuel to generate energy [39]. Figure 9a shows the total electrical output for 669 residential customers in Atlanta with six C65 MTs and optimal output simulation for electrical peak days (1 August 2013). Figure 9b includes C65 MT, and PV simulations, with peak PV output = 16 kW. Figure 9c includes M C65 MTs and DFC300 FC, the latter providing high quality and ultra-clean electrical power with 47% efficiency [40] and peak output = 65 kW.
Figure 10 shows the total thermal output for a candidate option for 669 residential customers in Atlanta, including 65 kW MTs, and optimal output simulation result for thermal peak day (12 February 2013). The 65 kW MTs continuously generate 119.57 kW (=408,000 BTU × 0.00029307107). PV and wind turbines have the same thermal output as the 65 kW MT, and FC does not operate on the day.

5.2. Energy Consumption Savings Using MTs with AbCs

This section expands the results from the previous Section 5.1 by adding the presence or absence scenarios of AbCs and DG operation modes for selecting the most cost-efficient DG candidate. For this purpose, AbCs were added to MTs, which will be used to validate the most cost-efficient DG type, and a full-blast or optimal-blast operation mode was considered. Figure 11 shows the total electrical output for candidate sources for 669 residential customers in Atlanta, with full-blast MTs (6 × 65 kW) and optimal output simulation for electrical peak day (1 August 2013). The AbCs recover 483.98 kW cooling air (=408,000 BTU × 6 × 0.75 × 0.90), and full-blast MTs generate the electrical output = 390 kW.
Figure 12 shows electric energy consumption from the grid under different conditions. Using or not using AbCs and CCHP operational modes can impact energy consumption, cost, and emissions savings. The simulation was performed for one year in hourly intervals with MTs supplying electrical and thermal (cooling or heating) demands as required. Full-blast MTs with or without AbCs can reduce annual electrical energy required from the grid by as much as 48.8% and 39.1%, respectively. Figure 13 shows thermal energy consumption from the grid under different conditions. Full-blast MTs with and without AbCs can reduce annual thermal energy supplied from the grid by 32.94% and 30.35%, respectively. Thus, full-blast MTs can greatly reduce electrical and thermal output energy consumption from the grid and are the most cost-efficient DG type for metropolitan residential customers.

5.2.1. Economic Impact

It is important to consider economic impacts to ensure reliability, safety, preservation, and quality when selecting the best DG type. Figure 14 shows that the full-blast MTs without AbCs have a more expensive life-cycle cost than the optimal-blast MTs without AbCs. The total cost of the full-blast MTs without AbCs increased by 4.49%, but the full-blast MTs with AbCs reduced by 3.78%. Table 4 shows that the life-cycle cost for the full-blast MTs with AbCs is $8.25 M, which is the lowest life-cycle cost. Heat to power ratio (Table 4) is the generated heat divided by electrical power, e.g., AbCs reduce the heat to power ratio because heat generation decreases and power output increases. The full-blast 390 kW MTs with AbCs have the lowest heat to power ratio of 1.1825, i.e., the most cost-efficient and minimal energy consumption model has the smallest heat to power ratio. Thus, including MTs with or without AbCs has a significant effect on life-cycle cost savings.

5.2.2. Environmental Impact

The CCHP systems are more energy-efficient, environmentally friendly, and cost-effective than conventional fossil fuel power generation plants. For example, power generation requires 2.77, 1.13, 3.45, and 179.50 L H2O/kWh for coal, gas-fired, nuclear, and hydroelectric sources [28,41]. In contrast, water evaporated by MTs = 0 L H2O/kWh [24].
The Appendix A includes emission coefficients for CO2, NOx, and SO2 used to estimate annual emission inputs for HOMER. Figure 15, Figure 16, Figure 17 and Figure 18 show annual emission savings for CO2, water, NOx, and SO2 = 14.1%, 48.6%, 46.5%, and 48.5% under full-blast MTs with AbCs.

6. Discussion

In this study, a case study was conducted to investigate the most cost-efficient DG type in an integrated energy hub model (e.g., the CCHP system) for metropolitan residential customers. For this purpose, we modeled various DG types and examined their impacts on the CCHP system including PV, wind turbines, FCs, and MTs with AbCs. We collected electrical and thermal load profile data for the Atlanta, USA area, and constructed a simulation model based on residential customers in Atlanta. After that, we optimally scheduled the annual operation of DG systems in hourly intervals using HOMER and determined the most cost-efficient DG type from the various feasible options by implementing MATLAB codes that read the HOMER simulation results and hence analyzed electrical and thermal energy and emissions savings effects.
Our simulation results suggest the following points. First, MTs have a life-cycle cost lower than all other DG systems and hence were the best candidate without considering AbCs. The indexes of Table 3 and Figure 8 show that MTs are the most cost-efficient compared to all other DG systems. Second, AbCs show a significant impact on energy efficiency, cost savings, and emission reduction. The indexes of Table 4 show that full-blast MTs with AbCs are the most cost-efficient. In Figure 12 and Figure 13, full-blast MTs with AbCs show the highest reduction in energy consumed from the grid. In Figure 15, Figure 16, Figure 17 and Figure 18, full-blast MTs with AbCs show the highest reduction in emissions. The reason is that when full-blast MTs with AbCs reduce the energy supplied from the grid and reuse waste heat through AbCs.
Most of the previous studies examined in the literature review section have used meta-heuristic algorithms to estimate the optimal DG location or capacity or to build an energy hub model that analyzes energy consumption, cost savings, or emissions savings. The previous studies also did not consider the conditions (e.g., electric and thermal load profile data should be changed by the use of AbCs for metropolitan residential customers). However, the methodology of this paper not only considers an overall energy hub model that includes the CCHP system with PV, wind turbines, FCs, or MTs with AbCs but also allows the selection of the most cost-efficient DG candidates for the conditions of the corresponding metropolis. This methodology can be also applied to other large cities or rural area models.

7. Conclusions

This study presented a methodology for selecting the most cost-efficient DG type for metropolitan residential customers that use CCHP systems. For this purpose, simulation models were constructed based on Atlanta‘s resident customers, and simulations were run using MATLAB and HOMER. We selected an objective function (e.g., Section 3.2) to find the most cost-efficient DG type and succeeded in analyzing energy consumption from the grid, cost savings, and emission reduction. The first scenario proposed in this paper demonstrated that MTs are the most cost-efficient type of DG for metropolitan residential customers. The second scenario advances the study of MTs, which was selected as the most cost-efficient DG type in the first scenario. For this purpose, the MTs were enhanced by adding AbCs, and as options, the two MT operation modes (e.g., optimal-blast or full-blast) were considered. The operation mode of the MT and the presence or absence of the AbCs show a significant impact on energy savings, cost savings, and emission reduction. In conclusion, this study proved that MTs are the most cost-efficient DG candidate for metropolitan residential customers in Atlanta, and full-blast MTs with AbCs were shown to be the most cost-efficient when considering AbCs. Moreover, this methodology can be applied to other regions, and the most cost-efficient DG candidates can be selected by considering the circumstances of each region (e.g., load profile, energy pattern, the number of residents, DGs, and emission parameters). In future studies, it will enhance the modeling of cost-efficient DG units for office or industrial consumers. Furthermore, we will add efficient storage systems for different types of consumers.

Author Contributions

Conceptualization, I.K. and J.P.; methodology, J.P.; validation, J.P. and H.J.; formal analysis, J.P.; investigation, H.J.; writing—original draft preparation, J.P.; writing—review and editing, I.K.; supervision, I.K.; All authors have read and agreed to the published version of the manuscript.

Funding

This work was supported by Inha University Research Grant.

Institutional Review Board Statement

Not applicable.

Informed Consent Statement

Not applicable.

Data Availability Statement

The datasets generated during the current study are available from the corresponding author upon reasonable request.

Conflicts of Interest

The authors declare no conflict of interest.

Abbreviations

AbCabsorption chiller
AC/DCalternative current and direct current
CHPcombined heat and power
CCHPcombined cooling heat and power
DGdistributed generation
EESengineering equation solver
FCfuel cell
GAgenetic algorithm
MTmicroturbine
OMoperation and maintenance cost
OpenEIopen energy information
PSOparticle swarm optimization
p.u.per unit
PVphotovoltaic
SOFCsolid oxide fuel cell
NPCnet present cost

Appendix A

Table A1. Microturbine parameters [26,27,35,42,43].
PropertyValue
ManufacturerCapstone C65
Electric capacity65 kW
Thermal output408,000 BTU/h = 119.57 kW
Capital ($/kW)2891 $/kW
Replacement ($/kW)2891 $/kW
OM ($/hour)0.612 ($/h)
Lifetime20 years
Search spaceUp to 6 C65 MTs (=390 kW)
FuelNatural gas = 0.1155 $/m3
Table A2. Microturbine electric efficiency LHV [44].
Capacity (kW)Efficiency (%)
6529
3024
1016
Table A3. Natural gas parameters [44].
PropertyValue
Heating value45 MJ/kg
Density0.79 kg/m3
Table A4. Microturbine consumption [44].
Output (kW)Consumption (m3/h)
6522.698
3012.658
106.329
Table A5. C65 microturbine fuel curve [44].
PropertyValue
Intercept coefficient0.0542 m3/h/rated kW
Intercept coefficient per 65 kW3.523 m3/h
Slope0.2964 m3/h/kW
Table A6. C65 microturbine emission [44,45,46,47].
EmissionValue
CO20.00478 g/m3
Hydrocarbon0.00035 g/m3
PM0 g/m3
SOx0.00020 g/m3
Fuel sulfur/PM0%
NOx0.00338 g/m3
Water0
Table A7. Fuel cell parameters for fuel cell [26,40,43].
PropertyValue
ManufacturerFuel Cell Energy (DFC300)
TypeMolten carbonate
Electric capacity300 kW
Thermal output236.80 kW (808,000 BTU/h)
Capital5650 $/kW
Replacement5650 $/kW
OM12 $/h
Lifetime20 y
Search space390 kW in 65 kW intervals
FuelNatural gas = 0.1155 $/m3
Table A8. DFC300 fuel cell efficiency [40].
Fuel ConsumptionEfficiency (%)
Natural gas at (930 Btu/ft3)39 ft3/min
Table A9. DFC300 fuel cell fuel curve [40].
PropertyValue
Intercept coefficient0
Slope0.2209 m3/h/kW
Table A10. DFC300 fuel cell emissions [40].
EmissionValue
CO20.00068 g/m3
Hydrocarbons0 g/m3
PM0.0000001 g/m3
SOx0.0000007 g/m3
Fuel sulfur/PM0%
NOx0.0000685 g/m3
Water0.325 g/kWh
Table A11. Wind turbine parameters [42,43,48].
PropertyValue
ManufacturerWES 80
Electric capacity80 kW
Capital1475 $/kW
Replacement1475 $/kW
OM3000 $/h
Lifetime20 y
Search spaceUp to 5 turbines (=400 kW)
EmissionsNegligible
LocationAtlanta, USA
Table A12. PV parameters [42,43].
PropertyValue
Electric capacity65–390 kW
Capital2400 $/kW
Replacement2400 $/kW
OM910 $/h
Cost estimationFor community application
Lifetime30 y
LocationAtlanta, USA
Table A13. Converter parameters [42,43,49].
PropertyValue
Electric capacity65–390 kW
Capital296.15 $/kW
Replacement296.15 $/kW
OM2132 $/h
Lifetime10 y
EmissionsNegligible
Table A14. Grid emissions (Georgia, USA) [50].
EmissionsValue (g/kWh)
CO2583
SO21.56
NOx0.42

References

  1. Mistry, K.D.; Roy, R. Enhancement of loading capacity of distribution system through distributed generator placement considering techno-economic benefits with load growth. Int. J. Electr. Power Energy Syst. 2014, 54, 505–515. [Google Scholar] [CrossRef]
  2. Borges, C.L.; Falcao, D.M. Optimal distributed generation allocation for reliability, losses, and voltage improvement. Int. J. Electr. Power Energy Syst. 2006, 28, 413–420. [Google Scholar] [CrossRef]
  3. Kashem, M.; Le, A.D.; Negnevitsky, M.; Ledwich, G. Distributed generation for minimization of power losses in distribution systems. In Proceedings of the IEEE Power Engineering Society General Meeting, Montreal, QC, Canada, 18–22 June 2006; p. 8. [Google Scholar]
  4. Kim, I. Optimal distributed generation allocation for reactive power control. IET Gener. Transm. Distrib. 2014, 11, 1549–1556. [Google Scholar] [CrossRef]
  5. Tsikalakis, A.; Hatziargyriou, N. Environmental benefits of distributed generation with and without emissions trading. Energy Policy 2007, 35, 3395–3409. [Google Scholar] [CrossRef]
  6. Qian, K.; Zhou, C.; Yuan, Y.; Shi, X.; Allan, M. Analysis of the environmental benefits of distributed generation. In Proceedings of the IEEE Power and Energy Society General Meeting-Conversion and Delivery of Electrical Energy in the 21st Century, Pittsburgh, PA, USA, 20–24 July 2008; pp. 1–5. [Google Scholar]
  7. Lee, D.; Bang, J. Legal Case Study About the Lawsuit to the Korea government’s 8th Basic Plan for Electricity Supply and Demand. In Proceedings of the Korean Radioactive Waste Society Conference, Daejeon, Korea, 1 November 2018; pp. 47–48. [Google Scholar]
  8. Solar Industry Research Data. Available online: https://www.seia.org/solar-industry-research-data (accessed on 1 June 2021).
  9. Kim, I. A case study on the effect of storage systems on a distribution network enhanced by high-capacity photovoltaic systems. J. Energy Storage 2017, 12, 121–131. [Google Scholar] [CrossRef]
  10. Kim, I. Optimal capacity of storage systems and photovoltaic systems able to control reactive power using the sensitivity analysis method. Energy 2018, 150, 642–652. [Google Scholar] [CrossRef]
  11. Kim, I. The Optimization of the Location and Capacity of Reactive Power Generation Units, Using a Hybrid Genetic Algorithm Incorporated by the Bus Impedance Power-Flow Calculation Method. Appl. Sci. 2020, 10, 1034. [Google Scholar] [CrossRef] [Green Version]
  12. Kim, B.; Rusetskii, N.; Jo, H.; Kim, I. The Optimal Allocation of Distributed Generators Considering Fault Current and Levelized Cost of Energy Using the Particle Swarm Optimization Method. Energies 2021, 14, 418. [Google Scholar] [CrossRef]
  13. Lee, D.; Son, S.; Kim, I. Optimal Allocation of Large-Capacity Distributed Generation with the Volt/Var Control Capability Using Particle Swarm Optimization. Energies 2021, 14, 3112. [Google Scholar] [CrossRef]
  14. Abu-Mouti, F.S.; El-Hawary, M. Optimal distributed generation allocation and sizing in distribution systems via artificial bee colony algorithm. IEEE Trans. Power Deliv. 2011, 26, 2090–2101. [Google Scholar] [CrossRef]
  15. Abou El-Ela, A.A.; Allam, S.M.; Shatla, M. Maximal optimal benefits of distributed generation using genetic algorithms. Electr. Power Syst. Res. 2010, 80, 86–877. [Google Scholar] [CrossRef]
  16. Gomez-Gonzalez, M.; López, A.; Jurado, F. Optimization of distributed generation systems using a new discrete PSO and OPF. Electr. Power Syst. Res. 2012, 84, 174–180. [Google Scholar] [CrossRef]
  17. Alam, M.S.; Gao, D.W. Modeling and analysis of a wind/PV/fuel cell hybrid power system in HOMER. In Proceedings of the 2nd IEEE Conference on Industrial Electronics and Applications, Harbin, China, 23–25 May 2007; pp. 1594–1599. [Google Scholar]
  18. Mirzaee, M.; Zare, R.; Sadeghzadeh, M.; Maddah, H.; Ahmadi, M.H.; Acıkkalp, E.; Chen, L. Thermodynamic analyses of different scenarios in a CCHP system with micro turbine–Absorption chiller, and heat exchanger. Energy Convers. Manag. 2019, 198, 111919. [Google Scholar] [CrossRef]
  19. Mohammadi, M.; Noorollahi, Y.; Mohammadi-Ivatloo, B.; Yousefi, H. Energy hub: From a model to a concept—A review. Renew. Sustain. Energy Rev. 2017, 80, 1512–1527. [Google Scholar] [CrossRef]
  20. Jo, H.; Park, J.; Kim, I. Environmentally Constrained Optimal Dispatch Method for Combined Cooling, Heating, and Power Systems Using Two-Stage Optimization. Energies 2021, 14, 4135. [Google Scholar] [CrossRef]
  21. Schulze, M.; Friedrich, L.; Gautschi, M. Modeling and optimization of renewables: Applying the energy hub approach. In Proceedings of the IEEE International Conference on Sustainable Energy Technologies, Singapore, 24–27 November 2008; pp. 83–88. [Google Scholar]
  22. Zhang, X.; Karady, G.G.; Ariaratnam, S.T. Optimal allocation of CHP-based distributed generation on urban energy distribution networks. IEEE Trans. Sustain. Energy 2013, 5, 246–253. [Google Scholar] [CrossRef]
  23. Li, G.; Wang, R.; Zhang, T.; Ming, M. Multi-objective optimal design of renewable energy integrated CCHP system using PICEA-g. Energies 2018, 11, 743. [Google Scholar] [CrossRef] [Green Version]
  24. Kim, I.; James, J.-A.; Crittenden, J. The case study of combined cooling heat and power and photovoltaic systems for building customers using HOMER software. Electr. Power Syst. Res. 2017, 143, 490–502. [Google Scholar] [CrossRef] [Green Version]
  25. What Is a CHP or a Combined Heat and Power System. Available online: https://www.energuide.be/en/questions-answers/what-is-a-chp-or-a-combined-heat-and-power-system/615/ (accessed on 1 January 2021).
  26. U.S. Energy Information Administration Natural Gas Annual 2015. Available online: https://www.eia.gov/naturalgas/annual/pdf/nga15.pdf (accessed on 1 January 2021).
  27. Capstone, Global Case Studies–United States–East. Tech. Rep. Available online: http://www.capstoneturbine.com/company/global/region.asp?region=35 (accessed on 1 January 2021).
  28. Frankland, J.H. A Model-Based Feasibility Study of Combined Heat and Power Systems for Use in Urban Environments. Master’s Thesis, Georgia Institute of Technology, Atlanta, GA, USA, 2013. [Google Scholar]
  29. Michalewicz, Z. Genetic Algorithms + Data Structures = Evolution Programs, 3rd rev. and extended ed.; Springer: New York, NY, USA, 1996. [Google Scholar]
  30. Abdin, E.S.; Xu, W. Control design and dynamic performance analysis of a wind turbine-induction generator unit. IEEE Trans. Energy Convers. 2000, 15, 91–96. [Google Scholar] [CrossRef]
  31. Delfino, B.; Fornari, F. Modeling and control of an integrated fuel cell-wind turbine system. In Proceedings of the IEEE Bologna Power Tech Conference Proceedings, Bologna, Italy, 23–26 June 2003; Volume 2, p. 6. [Google Scholar]
  32. HOMER Energy. Homer Pro Version 3.7 User Manual; Boulder, CO, USA, 2016; Volume 7. [Google Scholar]
  33. Lambert, T.; Gilman, P.; Lilienthal, P. Micropower system modeling with HOMER. Integr. Altern. Sources Energy 2006, 1, 379–385. [Google Scholar]
  34. Begovic, M.; Pregelj, A.; Rohatgj, A. Four-year performance assessment of the 342 kW PV system at Georgia Tech. In Proceedings of the Conference Record of the Twenty-Eighth IEEE Photovoltaic Specialists Conference (Cat. No. 00CH37036), Anchorage, AK, USA, 15–22 September 2000; pp. 1575–1578. [Google Scholar]
  35. Capstone, Masonic Village. Tech. Rep. Available online: https://www.capstoneturbine.com/company/global/region.asp?region=35 (accessed on 1 January 2014).
  36. Statista. Number of People per Household in the United States from 1960 to 2013. Available online: https://www.statista.com/statistics/183648/average-size-of-households-in-the-us/ (accessed on 1 January 2021).
  37. Sheehan, M.; Cleveland, T. Small Generator Interconnection Procedures Screens; Solar America Board for Codes and Standards Report; Solar ABCs: Cocoa, FL, USA, 2010. [Google Scholar]
  38. Time of Use—Residential Energy Only Schedule: TOU-REO-10; Georgia Power-Southern Company. Available online: https://marc-bourassa.com/wp/wp-content/uploads/2019/09/Georgia-Power-Nights-and-Weekends-Tariff-Sheet-2.20-tou-reo.pdf (accessed on 1 January 2016).
  39. C65 & C65-ICHP MicroTurbine Natural Gas; Capstone Turbine Corporation. Available online: http://large.stanford.edu/courses/2010/ph240/veltman2/docs/Capstoneinfo.pdf (accessed on 1 January 2021).
  40. Sovacool, B.K. Valuing the greenhouse gas emissions from nuclear power: A critical survey. Energy Policy 2008, 36, 2950–2963. [Google Scholar] [CrossRef]
  41. Gleick, P.H. Water and energy. Annu. Rev. Energy Environ. 1994, 19, 267–299. [Google Scholar] [CrossRef]
  42. Hashemi, R. A developed offline model for optimal operation of combined heating and cooling and power systems. IEEE Trans. Energy Convers. 2009, 24, 222–229. [Google Scholar] [CrossRef]
  43. Lazard. Lazard’s Levelized Cost of Energy Analysis 10.0. Available online: https://www.lazard.com/media/438038/levelized-cost-of-energy-v100.pdf (accessed on 15 December 2016).
  44. Derrow, K.; Tidball, R.; Wang, J.; Hampson, A. Catalog of CHP Technologies: Section 5. Technology Characterization-Microturbines; The US Environmental Protection Agency: Washington, DC, USA, 2015.
  45. Wang, K.P.; Yuryevich, J. Evolutionary-programming-based algorithm for environmentally-constrained economic dispatch. IEEE Trans. Power Syst. 1998, 13, 301–306. [Google Scholar] [CrossRef]
  46. Capstone Low Emissions MicroTurbine Techonology White Paper; Capstone Turbine Corporation: Los Angeles, CA, USA, 19 July 2000.
  47. Tang, W.; Wu, Q.; Saunders, J. Bacterial foraging algorithm for dynamic environments. In Proceedings of the IEEE International Conference on Evolutionary Computation, Vancouver, BC, Canada, 16–21 July 2006; pp. 1324–1330. [Google Scholar]
  48. Wind Energy Solutions. Available online: https://windenergysolutions.nl/turbines/windturbine-wes-80/ (accessed on 1 January 2009).
  49. SunShot Vision Study. U.S. Department of Energy, February 2012. Available online: https://www.energy.gov/sites/prod/files/SunShot%20Vision%20Study.pdf (accessed on 1 January 2021).
  50. eGRID. Available online: https://www.epa.gov/egrid/power-profiler#/ (accessed on 1 January 2021).
Figure 1. Considered residential community energy hub with electric power grid, thermal utility, PV, wind turbine, MT, AbC, and FC systems.
Energies 14 05606 g001
Figure 2. C65 microturbine fuel curve input-output characteristics.
Energies 14 05606 g002
Figure 3. Proposed CCHP system modeled by HOMER and MATLAB.
Energies 14 05606 g003
Figure 4. Example electrical and thermal load profiles for Atlanta, USA: (a) Instantaneous electric demand on an electrical peak day in hourly intervals; (b) Electric demand over one year; (c) Thermal demand on thermal peak day in hourly intervals; (d) Thermal demand over one year.
Energies 14 05606 g004aEnergies 14 05606 g004bEnergies 14 05606 g004c
Figure 5. Instantaneous electric demand on an electrical peak day in hourly intervals for Harrisburg, USA.
Energies 14 05606 g005
Figure 6. Comparison of electric demand over one year in Atlanta and Harrisburg, USA.
Energies 14 05606 g006
Figure 7. Comparison of thermal demand over one year in Atlanta and Harrisburg, USA.
Energies 14 05606 g007
Figure 8. Life-cycle cost variations without AbCs.
Energies 14 05606 g008
Figure 9. Electric output for optimal power for various candidate options on electrical peak day (scenario 1): (a) MT only electric output; 1 August 2013; (b) MT and PV electric output; 1 August 2013; (c) MT and FC electrical output; 1 August 2013.
Energies 14 05606 g009
Figure 10. Only MT thermal output; 12 February 2013 (scenario 1).
Energies 14 05606 g010
Figure 11. Electric output (full-blast power) and chilled air output (cooling demand) for Capstone MTs; 1 August 2013 (scenario 2).
Energies 14 05606 g011
Figure 12. Electrical energy consumption from the grid (scenario 2).
Energies 14 05606 g012
Figure 13. Thermal energy consumption from the boiler (scenario 2).
Energies 14 05606 g013
Figure 14. Total cost savings (Gas = 0.1155 $/m3; scenario 2).
Energies 14 05606 g014
Figure 15. CO2 emissions savings (scenario 2).
Energies 14 05606 g015
Figure 16. Water emissions savings (scenario 2).
Energies 14 05606 g016
Figure 17. NOx emissions savings (scenario 2).
Energies 14 05606 g017
Figure 18. SO2 emissions savings (scenario 2).
Energies 14 05606 g018
Table 1. Electric and thermal loads for metropolitan residential customers in Atlanta, USA.
TypeElectricalThermal
Peak (kW)DateAnnual Energy (MWh/y)Peak (kW)DateAnnual Energy (MWh/y)
Residential customers4.131 August 20131313.2812 February 201310
Table 2. Generation costs for metropolitan residential customers’ case study [26,38].
TypeModeCost
Generation cost for GeorgiaOn-peak hours203.217 $/MWh
Off-peak hours49.409 $/MWh
Natural gas price for electric power in Georgia 0.1155 $/m3
Table 3. Most cost-efficient DG without AbCs.
CombinationSize (kW)Life-Cycle Cost ($M, Not Annualized)Rank
No DG8.25
MT658.281
PV108.332
Wind808.413
FC3008.494
Table 4. MT life-cycle cost.
CombinationSize (kW)Life-Cycle Cost
($M, Not Annualized)
RankHeat to Power RatioRank
No MTs-8.57
Optimal-blast MTs without AbCs658.5821.83413
Full-blast MTs without AbCs3908.9531.65462
Full-blast MTs with AbCs3908.2511.18251
Publisher’s Note: MDPI stays neutral with regard to jurisdictional claims in published maps and institutional affiliations.

