
Railway Vehicle Energy Efficiency as a Key Factor in Creating Sustainable Transportation Systems


Abstract
:1. Introduction
2. Materials and Methods
2.1. Electrical Energy Measurement in Railway Vehicles
2.2. Factors Affecting Energy Consumption
2.3. Energy Consumption as a Tender Criterion
2.4. Energy Efficiency Improvement
2.5. Research Methods
3. Results
4. Discussion and Conclusions
Author Contributions
Funding
Institutional Review Board Statement
Informed Consent Statement
Data Availability Statement
Conflicts of Interest
References
- Atabani, A.E.; Badruddin, I.A.; Mekhilef, S.; Silitonga, A.S. A review on global fuel economy standards, labels and technologies in the transportation sector. Renew. Sustain. Energy Rev. 2011, 15, 4586–4610. [Google Scholar] [CrossRef]
- European Commission. Available online: https://ec.europa.eu/clima/policies/transport_en?fbclid=IwAR1CtI7lzweyqjvl0XTazm8BHZRyj9NTCTDf_xNCIEvG5ddd3jUQm0XBSRg (accessed on 13 June 2021).
- The Paris Agreement. 2015. Available online: https://unfccc.int/resource/docs/2015/cop21/eng/l09r01.pdf (accessed on 13 June 2021).
- IEA. 2018. Available online: https://www.iea.org/data-and-statistics/charts/energy-intensity-of-passenger-transport-modes-2018 (accessed on 13 June 2021).
- International Union of Railways-International Energy Agency. Railway Handbook 2015: Energy Consumption and CO2 Emission (2015); International Energy Agency (IEA): Paris, France, 2015. [Google Scholar]
- NS. 2017. Available online: https://www.ns.nl/en/about-ns/sustainability/climate-neutral/green-energy-for-train-bus-and-station.html#:~:text=In%202017%2C%20our%20trains%20in,the%20supply%20of%20this%20electricity (accessed on 13 June 2021).
- Litman, T. Evaluating rail transit benefits: A comment. Transp. Policy 2007, 14, 94–97. [Google Scholar] [CrossRef]
- Desa, U. 2018 Revision of World Urbanization Prospects; UN Department of Economic and Social Affairs: New York, NY, USA, 2019. [Google Scholar]
- Noga, A.; Jarzębowski, S.; Maciąg, P. Co-Productivity as a New Value Theory in Value Chain Analysis. Cent. Eur. Manag. J. 2020, 28, 52–65. [Google Scholar] [CrossRef]
- Zhang, F.; Graham, D.J.; Wong, M.S.C. Quantifying the substitutability and complementarity between high-speed rail and air transport. Transp. Res. Part A Policy Pract. 2018, 118, 191–215. [Google Scholar] [CrossRef] [Green Version]
- Railway Gazette. 2020. Available online: https://www.railwaygazette.com/news/trains-prioritised-over-planes-in-air-france-rescue-deal/56408.article (accessed on 13 June 2021).
- Klassen, R.D.; McLaughlin, C.P. The impact of environmental management on firm performance. Manag. Sci. 1996, 42, 1199–1214. [Google Scholar] [CrossRef]
- Kapetanovic, M.; van Oort, N.; Núñez, A.; Goverde, R.M. Sustainability of Railway Passenger Services–A Review of Aspects, Issues, Contributions and Challenges of Life Cycle Emissions. In Proceedings of the 8th International Conference on Railway Operations Modelling and Analysis (ICROMA), Norrköping, Sweden, 17–20 June 2019; pp. 17–20. [Google Scholar]
- Van der Spiegel, B. Railway energy measuring, managing and billing (April 2009). In Proceedings of the 6th International Conference on the European Energy Market, Leuven, Belgium, 27–29 May 2009; pp. 1–8. [Google Scholar]
- Tgaard, A.; Gulbrandsen, D.M.; Lysne, B.; Krogstad, G.H. Eress: A New Era for Railway Energy: Promoting efficiency, fairer billing with standards and onboard meters. IEEE Electrif. Mag. 2020, 8, 6–11. [Google Scholar] [CrossRef]
- Jakubowski, C.; Ciszewski, T.; Nowakowski, W.; Wojciechowski, J. Pomiar zużycia energii elektrycznej licznikami prądu stałego w wybranych zespołach trakcyjnych. TTS Tech. Transp. Szyn. 2016, 23, 306–309. [Google Scholar]
- Van der Spiegel, B.; Mondejar, J.A.R. Energy Metering of Trains: The European Experience. IEEE Electrif. Mag. 2020, 8, 70–78. [Google Scholar] [CrossRef]
- European Committee for Electrotechnical Standardization. Railway Applications—Energy Measurement on Board Trains; document 50463-2; European Committee for Electrotechnical Standardization: Brussels, Belgium, 2017. [Google Scholar]
- Railway Gazette. 2014. Available online: https://www.railwaygazette.com/infrastructure/energy-meters-support-traction-electricity-supply-contract/39207.article (accessed on 13 June 2021).
- Railtech. 2019. Available online: https://www.railtech.com/policy/2019/04/24/pkp-intercity-equips-trains-with-energy-meters/ (accessed on 13 June 2021).
- Railway Sector Declaration. 2020. Available online: https://www.cer.be/sites/default/files/publication/201110_EU%20railway%20sector%20declaration%20on%20traction%20energy%20metering%20and%20settlement.pdf (accessed on 13 June 2021).
- The Office of Rail Transport, Poland. 2018. Available online: https://utk.gov.pl/pl/aktualnosci/13841,Nie-ma-potrzeby-wymiany-licznikow-energii.html (accessed on 13 June 2021).
- Ren, J.; Zhang, Q.; Liu, F. Analysis of factors affecting traction energy consumption of electric multiple unit trains based on data mining. J. Clean. Prod. 2020, 262, 121374. [Google Scholar] [CrossRef]
- Garcia, A. High Speed, Energy Consumption and Emissions; International Union of Railways (UIC) Study and Research Group for Railway Energy and Emissions: Paris, France, 2010. [Google Scholar]
- Bartnik, W.; Ćwil, M. Continuous feedback as a key component of employee motivation improvement-a railway case study based on the placebo effect. In Proceedings of the 50th Hawaii International Conference on System Sciences, Hilton Waikoloa Village, HI, USA, 4–7 January 2017. [Google Scholar]
- Ćwil, M.; Bartnik, W. Supporting Energy Efficient Train Operation by Using Gamification to Motivate Train Drivers. In Intersections in Simulation and Gaming; Springer: Cham, Switzerland, 2016; pp. 239–253. [Google Scholar]
- Zsidisin, G.A.; Siferd, S.P. Environmental purchasing: A framework for theory development. Eur. J. Purch. Supply Manag. 2001, 7, 61–73. [Google Scholar] [CrossRef]
- Ahi, P.; Searcy, C. A comparative literature analysis of definitions for green and sustainable supply chain management. J. Clean. Prod. 2013, 52, 329–341. [Google Scholar] [CrossRef]
- Fahimnia, B.; Sarkis, J.; Davarzani, H. Green supply chain management: A review and bibliometric analysis. Int. J. Prod. Econ. 2015, 162, 101–114. [Google Scholar] [CrossRef]
- Sarkis, J.; Zhu, Q.; Lai, K.H. An organizational theoretic review of green supply chain management literature. Int. J. Prod. Econ. 2011, 130, 1–15. [Google Scholar] [CrossRef]
- Srivastava, S.K. Green supply-chain management: A state-of-the-art literature review. Int. J. Manag. Rev. 2007, 9, 53–80. [Google Scholar] [CrossRef]
- Seuring, S.; Müller, M. From a literature review to a conceptual framework for sustainable supply chain management. J. Clean. Prod. 2008, 16, 1699–1710. [Google Scholar] [CrossRef]
- Mentzer, J.T.; DeWitt, W.; Keebler, J.S.; Min, S.; Nix, N.W.; Smith, C.D.; Zacharia, Z.G. Defining supply chain management. J. Bus. Logist. 2001, 22, 1–25. [Google Scholar] [CrossRef]
- Stock, J.R.; Boyer, S.L. Developing a consensus definition of supply chain management: A qualitative study. Int. J. Phys. Distrib. Logist. Manag. 2009, 39, 690–711. [Google Scholar] [CrossRef]
- Beamon, B.M. Designing the green supply chain. Logist. Inf. Manag. 1999, 12, 332–342. [Google Scholar] [CrossRef] [Green Version]
- Sarkis, J. A strategic decision framework for green supply chain management. J. Clean. Prod. 2003, 11, 397–409. [Google Scholar] [CrossRef]
- Zhu, Q.; Sarkis, J. Relationships between operational practices and performance among early adopters of green supply chain management practices in Chinese manufacturing enterprises. J. Oper. Manag. 2004, 22, 265–289. [Google Scholar] [CrossRef]
- Rao, P.; Holt, D. Do green supply chains lead to competitiveness and economic performance? Int. J. Oper. Prod. Manag. 2005, 25, 898–916. [Google Scholar] [CrossRef]
- Large, R.O.; Thomsen, C.G. Drivers of green supply management performance: Evidence from Germany. J. Purch. Supply Manag. 2011, 17, 176–184. [Google Scholar] [CrossRef]
- Wang, Z.; Sarkis, J. Investigating the relationship of sustainable supply chain management with corporate financial performance. Int. J. Product. Perform. Manag. 2013, 62, 871–888. [Google Scholar] [CrossRef] [Green Version]
- Lee, S.Y. The effects of green supply chain management on the supplier’s performance through social capital accumulation. Supply Chain. Manag. Int. J. 2015, 20, 42–55. [Google Scholar] [CrossRef]
- Lee, S.Y.; Klassen, R.D. Drivers and enablers that foster environmental management capabilities in small-and medium-sized suppliers in supply chains. Prod. Oper. Manag. 2008, 17, 573–586. [Google Scholar] [CrossRef]
- Holt, D.; Ghobadian, A. An empirical study of green supply chain management practices amongst UK manufacturers. J. Manuf. Technol. Manag. 2009, 7, 933–956. [Google Scholar] [CrossRef]
- Ageron, B.; Gunasekaran, A.; Spalanzani, A. Sustainable supply management: An empirical study. Int. J. Prod. Econ. 2012, 140, 168–182. [Google Scholar] [CrossRef]
- Hoejmose, S.U.; Grosvold, J.; Millington, A. The effect of institutional pressure on cooperative and coercive ‘green’supply chain practices. J. Purch. Supply Manag. 2014, 20, 215–224. [Google Scholar] [CrossRef]
- Kuei, C.H.; Madu, C.N.; Chow, W.S.; Chen, Y. Determinants and associated performance improvement of green supply chain management in China. J. Clean. Prod. 2015, 95, 163–173. [Google Scholar] [CrossRef]
- Barringer, H.P.; Weber, D.P. Life cycle costing tutorial. In Proceedings of the Fifth International Conference on Process Plant Reliability, Houston, TX, USA, 2–4 October 1996; pp. 3-1–3-58. [Google Scholar]
- Arup. 2011. Available online: https://www.orr.gov.uk/sites/default/files/om/rvfm-arup-rolling-stock-mar2011.pdf (accessed on 13 June 2021).
- Siemens. Rhein Ruhr Xpress. Available online: https://docplayer.org/25509215-Rhein-ruhr-xpress-wie-neue-ausschreibungskonzepte-innovationen-im-fahrzeugkonzept-treiben.html?fbclid=IwAR1gg6q7lfZvNgXYHx13N0pCAcBMCQdlJ-G2RzQKFBz-V1D642f8a9qEHws (accessed on 13 June 2021).
- Jun, H.K.; Kim, J.H. Life cycle cost modeling for railway vehicle. In Proceedings of the 2007 International Conference on Electrical Machines and Systems (ICEMS), Seoul, Korea, 8–11 October 2007; pp. 1989–1994. [Google Scholar]
- Koleje Mazowieckie. 2017. Available online: https://www.mazowieckie.com.pl/pl/zakup-elektrycznych-zespolow-trakcyjnych-znak-mwz3-26-06-2017 (accessed on 13 June 2021).
- CENELEC EN. 50591:2019. Specification and Verification of Energy Consumption for Railway Rolling Stock. Available online: https://standards.iteh.ai/catalog/standards/clc/0c266a0c-d86e-46cd-b2bc-bcd70152a4fc/en-50591-2019 (accessed on 20 August 2021).
- Antonowicz, M.; Jarzębowski, S. Innovative Models of Supply Chain Management. Cent. Eur. Manag. J. 2018, 26, 2–15. [Google Scholar] [CrossRef]
- González-Gil, A.; Palacin, R.; Batty, P.; Powell, J.P. A systems approach to reduce urban rail energy consumption. Energy Convers. Manag. 2014, 80, 509–524. [Google Scholar] [CrossRef] [Green Version]
- Alfieri, L.; Battistelli, L.; Pagano, M. Energy efficiency strategies for railway application: Alternative solutions applied to a real case study. IET Electr. Syst. Transp. 2017, 8, 122–129. [Google Scholar] [CrossRef]
- Gunselmann, W. Technologies for increased energy efficiency in railway systems. In Proceedings of the 2005 European Conference on Power Electronics and Applications, Dresden, Germany, 11–14 September 2005; pp. 1–10. [Google Scholar]
- Douglas, H.; Roberts, C.; Hillmansen, S.; Schmid, F. An assessment of available measures to reduce traction energy use in railway networks. Energy Convers. Manag. 2015, 106, 1149–1165. [Google Scholar] [CrossRef]
- Hasterok, D.; Castro, R.; Landrat, M.; Pikoń, K.; Doepfert, M.; Morais, H. Polish Energy Transition 2040: Energy Mix Optimization Using Grey Wolf Optimizer. Energies 2021, 14, 501. [Google Scholar] [CrossRef]
- Miller, R.G., Jr. Beyond ANOVA: Basics of Applied Statistics; CRC Press: Boca Raton, FL, USA, 1997. [Google Scholar]
- Cohen, B.H.; Lea, R.B. Essentials of Statistics for the Social and Behavioral Sciences; John Wiley & Sons: Hoboken, NJ, USA, 2004; Volume 3. [Google Scholar]
- Wang, J.; Rakha, H.A. Electric train energy consumption modeling. Appl. Energy 2017, 193, 346–355. [Google Scholar] [CrossRef] [Green Version]


| Source | Procurement | Maintenance | Energy |
|---|---|---|---|
| Arup, 2011 | 31% | 44% | 25% |
| Siemens, 2016 | 34% | 29% | 37% |
| Train Type | Procurer | Purchase Costs | Maintenance Costs | Energy Costs | Other Criteria |
|---|---|---|---|---|---|
| ED160 | PKP Intercity S.A. | 40% | 30% | 30% | 0% |
| ED161 | PKP Intercity S.A. | 40% | 30% | 30% | 0% |
| Flirt 3 | ŁKA | 40% | 30% | 25% | 5% |
| 36 WE | ŁKA | 40% | 30% | 20% | 10% |
| Flirt 3 | KM | 20% | 25% | 13% | 39% |
| ED162 | PKP Intercity S.A. | 58% | 22% | 0% | 20% |
| ED250 | PKP Intercity S.A. | 60% | 40% | 0% | 0% |
| Train type | Frequency | Percent |
|---|---|---|
| 1 | 81,158 | 7.8 |
| 2 | 145,607 | 14.0 |
| 3 | 272,127 | 26.1 |
| 4 | 358,413 | 34.4 |
| 5 | 115,608 | 11.1 |
| 6 | 69,803 | 6.7 |
| Total | 1,042,716 | 100.0 |
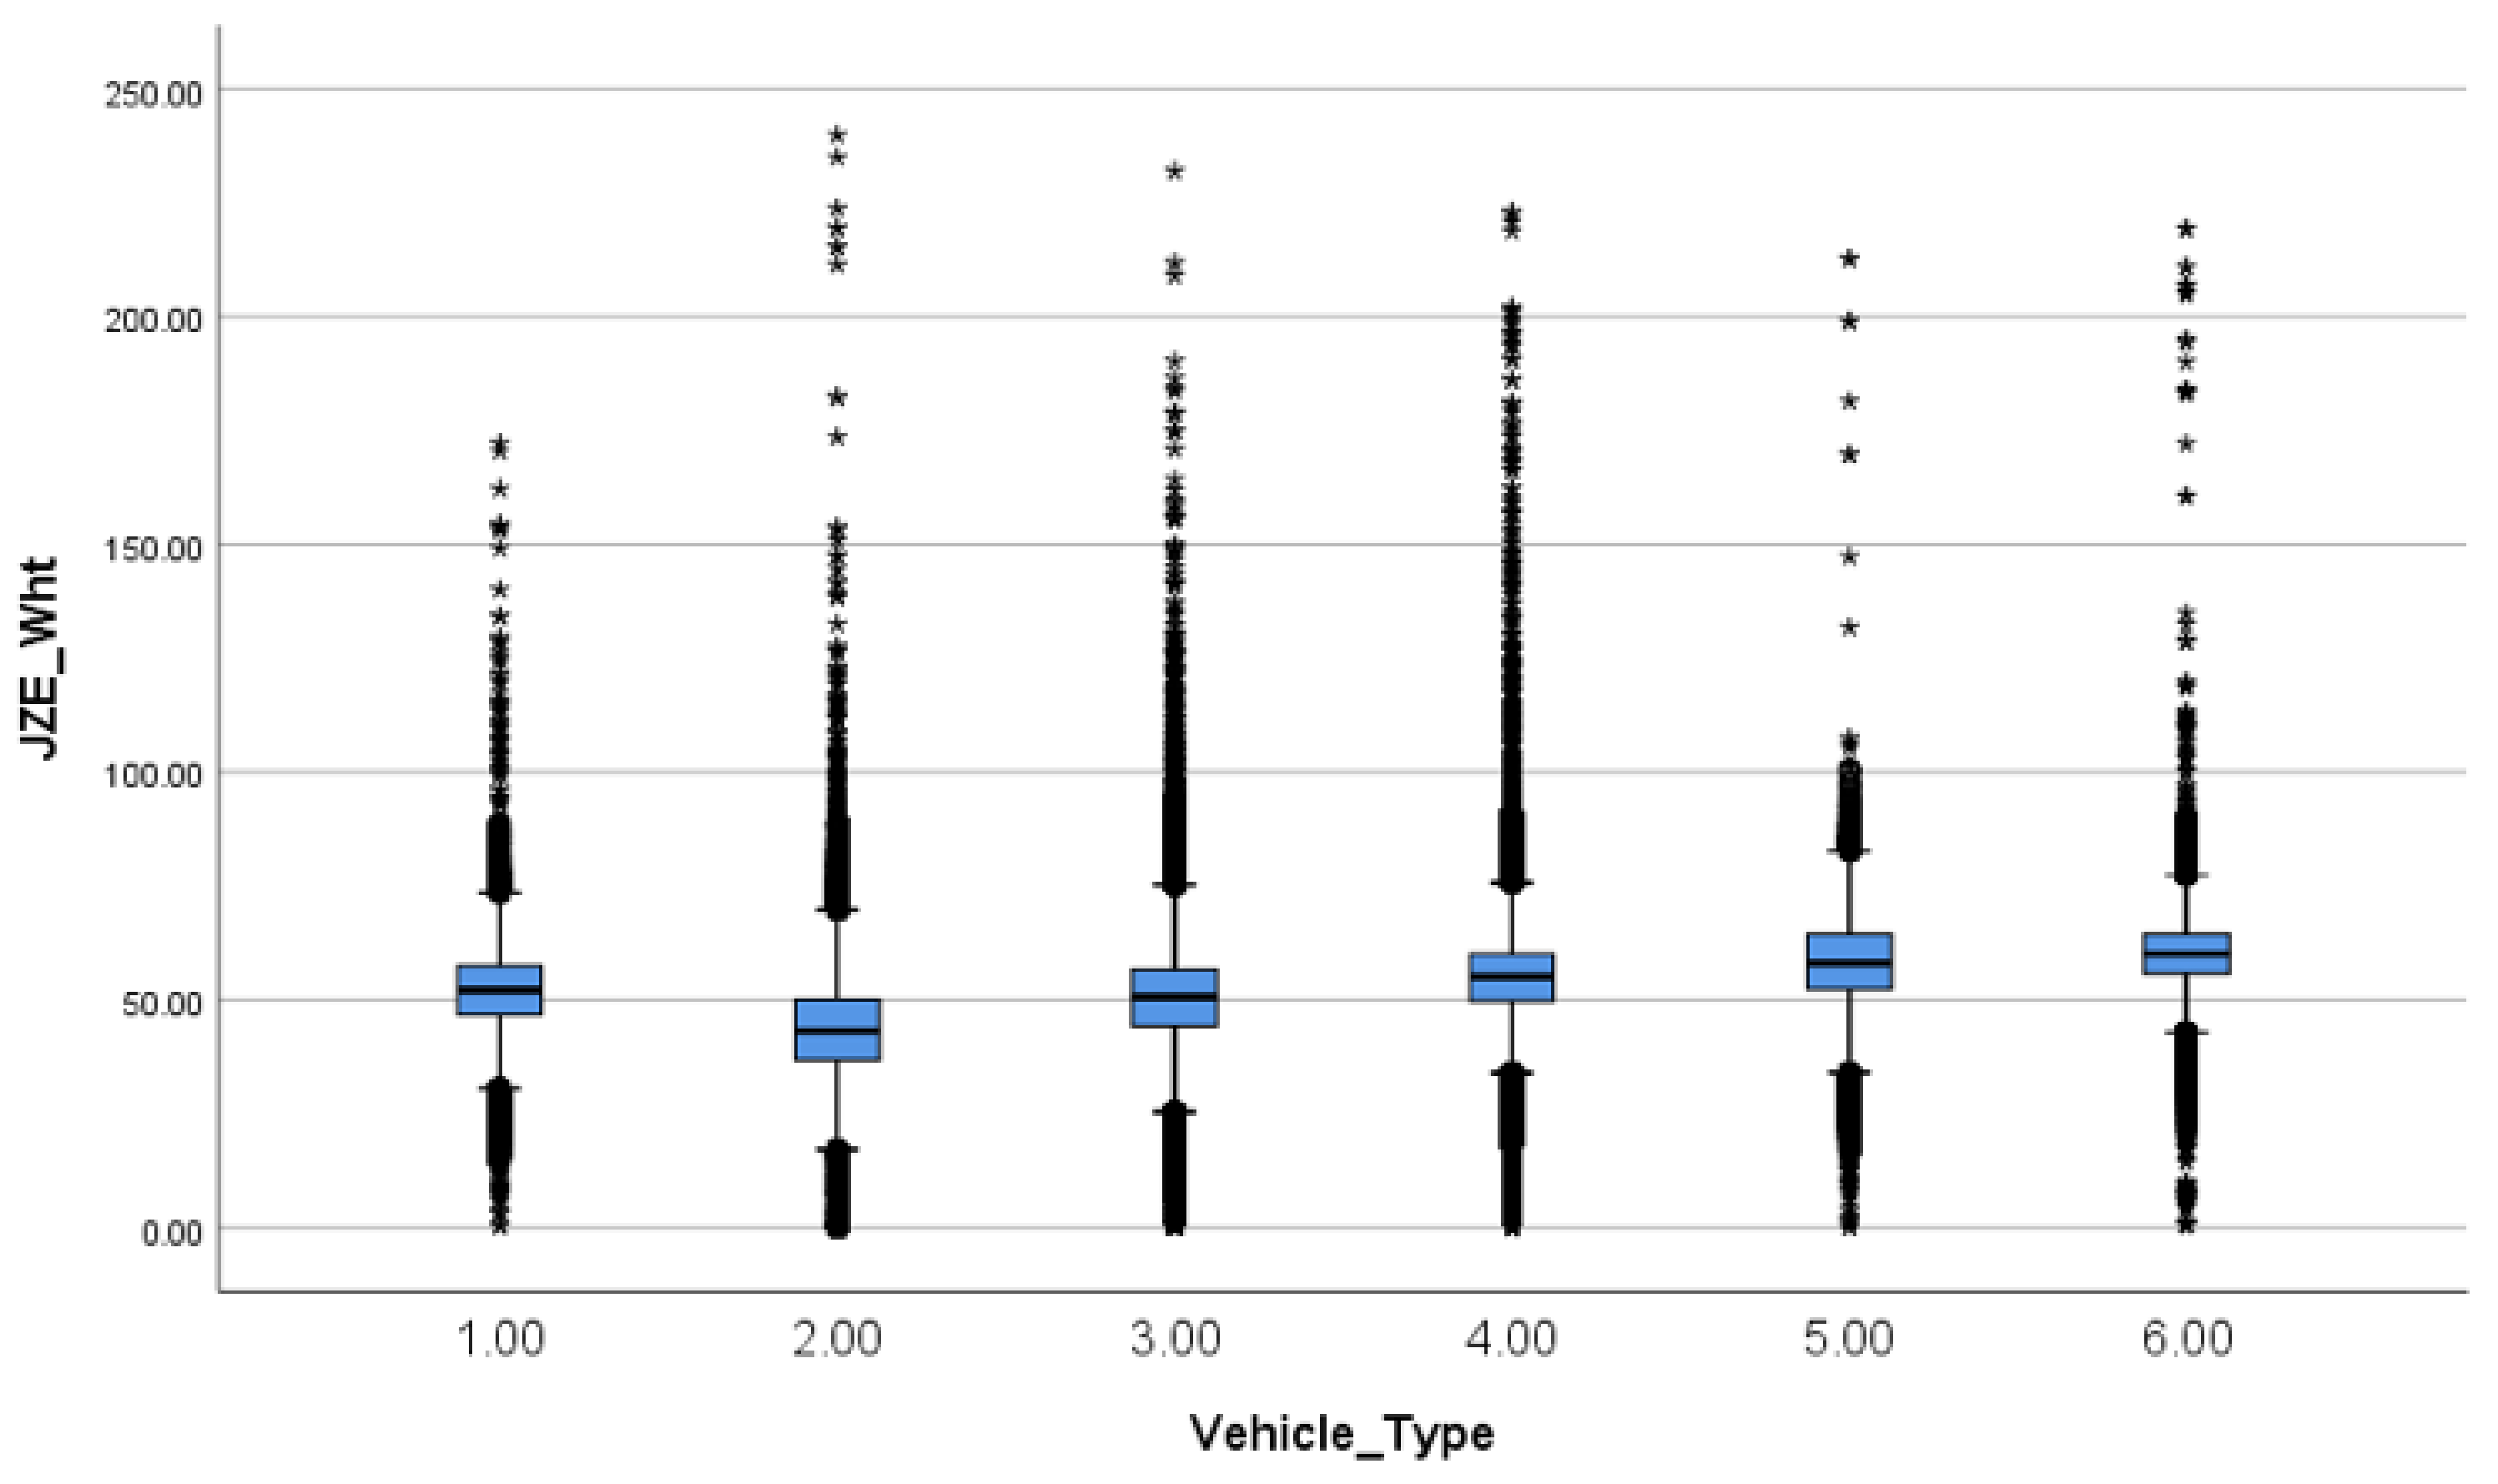
| JZE_Wh/tkm | Train Type | ||||||
|---|---|---|---|---|---|---|---|
| 1 | 2 | 3 | 4 | 5 | 6 | ||
| N | Valid | 81,158 | 145,607 | 272,127 | 358,413 | 115,608 | 69,803 |
| Missing | 0 | 0 | 0 | 0 | 0 | 0 | |
| Mean (M) | 51.7326 | 43.8621 | 50.3594 | 54.6107 | 57.9052 | 59.9948 | |
| Median | 52.1570 | 43.1412 | 50.6346 | 55.1813 | 58.0802 | 60.0966 | |
| Std. Deviation (SD) | 9.10781 | 10.21695 | 10.50929 | 9.08018 | 9.81526 | 7.98946 | |
| Skewness | −0.241 | 0.773 | 0.179 | −0.192 | −0.310 | 0.759 | |
| Minimum | 0.27 | 0.06 | 0.07 | 0.02 | 0.18 | 0.53 | |
| Maximum | 172.24 | 239.97 | 232.07 | 223.11 | 212.69 | 219.35 | |
| ANOVA | |||||
|---|---|---|---|---|---|
| JZE_Wht | |||||
| Sum of Squares | df | Mean Square | F | Sig. (p) | |
| Between Groups | 21,054,343.5 | 5 | 4,210,868.7 | 45,204.318 | 0.000 |
| Within Groups | 97,130,431.4 | 1,042,710 | 93.2 | ||
| Total | 118,184,774.9 | 1,042,715 | |||
| Robust Tests of Equality of Means | |||||
| JZE_Wht | |||||
| Statistic a | df1 | df2 | Sig. | ||
| Welch | 45,776.120 | 5 | 310,150.051 | 0.000 | |
| Multiple Comparisons | ||||||
|---|---|---|---|---|---|---|
| Dependent Variable: JZE_Wht | ||||||
| Games–Howell | ||||||
| (I) Vehicle_Type | (J) Vehicle_Type | Mean Difference (I-J) | Std. Error | Sig. (p) | 95% Confidence Interval (CI) | |
| Lower Bound | Upper Bound | |||||
| 1 | 2 | 7.87055 * | 0.04170 | 0.000 | 7.7517 | 7.9894 |
| 3 | 1.37323 * | 0.03779 | 0.000 | 1.2655 | 1.4809 | |
| 4 | −2.87808 * | 0.03539 | 0.000 | −2.9789 | −2.7772 | |
| 5 | −6.17257 * | 0.04307 | 0.000 | −6.2953 | −6.0498 | |
| 6 | −8.26216 * | 0.04401 | 0.000 | −8.3876 | −8.1368 | |
| 2 | 1 | −7.87055 * | 0.04170 | 0.000 | −7.9894 | −7.7517 |
| 3 | −6.49731 * | 0.03351 | 0.000 | −6.5928 | −6.4018 | |
| 4 | −10.74863 * | 0.03077 | 0.000 | −10.8363 | −10.6609 | |
| 5 | −14.04311 * | 0.03937 | 0.000 | −14.1553 | −13.9309 | |
| 6 | −16.13271 * | 0.04039 | 0.000 | −16.2478 | −16.0176 | |
| 3 | 1 | −1.37323 * | 0.03779 | 0.000 | −1.4809 | −1.2655 |
| 2 | 6.49731 * | 0.03351 | 0.000 | 6.4018 | 6.5928 | |
| 4 | −4.25131 * | 0.02522 | 0.000 | −4.3232 | −4.1795 | |
| 5 | −7.54580 * | 0.03520 | 0.000 | −7.6461 | −7.4455 | |
| 6 | −9.63540 * | 0.03634 | 0.000 | −9.7389 | −9.5318 | |
| 4 | 1 | 2.87808 * | 0.03539 | 0.000 | 2.7772 | 2.9789 |
| 2 | 10.74863 * | 0.03077 | 0.000 | 10.6609 | 10.8363 | |
| 3 | 4.25131 * | 0.02522 | 0.000 | 4.1795 | 4.3232 | |
| 5 | −3.29449 * | 0.03261 | 0.000 | −3.3874 | −3.2016 | |
| 6 | −5.38408 * | 0.03383 | 0.000 | −5.4805 | −5.2877 | |
| 5 | 1 | 6.17257 * | 0.04307 | 0.000 | 6.0498 | 6.2953 |
| 2 | 14.04311 * | 0.03937 | 0.000 | 13.9309 | 14.1553 | |
| 3 | 7.54580 * | 0.03520 | 0.000 | 7.4455 | 7.6461 | |
| 4 | 3.29449 * | 0.03261 | 0.000 | 3.2016 | 3.3874 | |
| 6 | −2.08960 * | 0.04181 | 0.000 | − 2.2087 | −1.9705 | |
| 6 | 1 | 8.26216 * | 0.04401 | 0.000 | 8.1368 | 8.3876 |
| 2 | 16.13271 * | 0.04039 | 0.000 | 16.0176 | 16.2478 | |
| 3 | 9.63540 * | 0.03634 | 0.000 | 9.5318 | 9.7389 | |
| 4 | 5.38408 * | 0.03383 | 0.000 | 5.2877 | 5.4805 | |
| 5 | 2.08960 * | 0.04181 | 0.000 | 1.9705 | 2.2087 | |
Publisher’s Note: MDPI stays neutral with regard to jurisdictional claims in published maps and institutional affiliations. |
© 2021 by the authors. Licensee MDPI, Basel, Switzerland. This article is an open access article distributed under the terms and conditions of the Creative Commons Attribution (CC BY) license (https://creativecommons.org/licenses/by/4.0/).
Share and Cite
Ćwil, M.; Bartnik, W.; Jarzębowski, S. Railway Vehicle Energy Efficiency as a Key Factor in Creating Sustainable Transportation Systems. Energies 2021, 14, 5211. https://doi.org/10.3390/en14165211
Ćwil M, Bartnik W, Jarzębowski S. Railway Vehicle Energy Efficiency as a Key Factor in Creating Sustainable Transportation Systems. Energies. 2021; 14(16):5211. https://doi.org/10.3390/en14165211
Chicago/Turabian StyleĆwil, Małgorzata, Witold Bartnik, and Sebastian Jarzębowski. 2021. "Railway Vehicle Energy Efficiency as a Key Factor in Creating Sustainable Transportation Systems" Energies 14, no. 16: 5211. https://doi.org/10.3390/en14165211