Article

Experimental Assessment of the Performance and Emissions of a Spark-Ignition Engine Using Waste-Derived Biofuels as Additives

1
MEtRICs, Department of Mechanical Engineering, Engineering School, Universidade do Minho, 4800-058 Guimarães, Portugal
2
Department of Mechanical Engineering, National University of East Timor, Dili, East Timor
3
MEtRICs, Department of Science and Technology of Biomass, Universidade Nova de Lisboa, 2825-149 Caparica, Portugal
*
Authors to whom correspondence should be addressed.
Energies 2021, 14(16), 5209; https://doi.org/10.3390/en14165209
Submission received: 29 June 2021 / Revised: 3 August 2021 / Accepted: 4 August 2021 / Published: 23 August 2021

Abstract

:
The use of biofuels for spark ignition engines is proposed to diversify fuel sources and reduce fossil fuel consumption, optimize engine performance, and reduce pollutant emissions. Additionally, when these biofuels are produced from low-grade wastes, they constitute valorisation pathways for these otherwise unprofitable wastes. In this study, ethanol and pyrolysis biogasoline made from low-grade wastes were evaluated as additives for commercial gasoline (RON95, RON98) in tests performed in a spark ignition engine. Binary fuel mixtures of ethanol + gasoline or biogasoline + gasoline with biofuel incorporation of 2% (w/w) to 10% (w/w) were evaluated and compared with ternary fuel mixtures of ethanol + biogasoline + gasoline with biofuel incorporation rates from 1% (w/w) to 5% (w/w). The fuel mix performance was assessed by determination of torque and power, fuel consumption and efficiency, and emissions (HC, CO, and NOx). An electronic control unit (ECU) was used to regulate the air–fuel ratio/lambda and the ignition advance for maximum brake torque (MBT), wide-open throttle (WOT)), and two torque loads for different engine speeds representative of typical driving. The additive incorporation up to 10% often improved efficiency and lowered emissions such as CO and HC relative to both straight gasolines, but NOx increased with the addition of a blend.

1. Introduction

Alternative fuels, especially biofuels such as ethanol, biodiesel, and pyrolysis bio-oil distillates (biogasoline or biodiesel) can be used in internal combustion (IC) engines when blended with fossil fuels (gasoline or diesel). In recent years, renewable energy resources have been widely proposed for the partial substitution of petroleum-based fuels. Various sources of raw materials can be optimized for biofuel production. Biofuels derived from vegetable oils, animal fat, and biomass waste are considered as alternative renewable fuels for use in IC engines. Because of the volatility in the crude oil market and supply, along with growing environmental concerns concerning greenhouse gases (GHGs), there has been a renewed interest in the use of biofuels as partial or integral substitutes for petroleum-based fuels in internal-combustion engines [1,2,3]. In addition, the European Commission [4] introduced the term “indirect land use change” (ILUC) to account for the consequences of the production of biofuels on land that could be used for crops. As a sustainability measure, the biofuels produced through ILUC will not be included in terms of renewable targets after 2030. Therefore, biofuels produced from wastes such as distillates from pyrolysis bio-oils can be utilized with advantages relating to policy, techno-economic consideration, and environmental reasons [2,5].
Pyrolysis biogasoline and ethanol are alternative fuels to gasoline, but normally they are used as additives rather than main fuels, except for ethanol, which is being used in Brazil in so-called “flex-fuel” engines [6]. On the other hand, these biofuels have a very low carbon footprint compared to fossil fuels because of their renewable nature and their short carbon cycle, therefore reducing fossil carbon dioxide (CO2) emissions [6]. For instance, a 5% reduction in the use of fossil gasoline in a car with a consumption of 5 L/100 km would translate into a reduction of around 6 g CO2/km.
Pyrolysis biogasoline has a complex composition including components with various functional groups, such as alcohols, hydrocarbons, acids, esters, furans, phenols, ketones, and the corresponding oligomers [7,8,9,10,11,12,13].
The physical and chemical properties of bio-oil, such as acidity, thermal stability, heating value, water content, density, viscosity, lubrication characteristics, and elemental composition, are essential to evaluate its potential energetic valorisation. These properties reflect the interactions of the different bio-oil components and are strongly influenced by the presence of oxygenated compounds [8]. The elemental composition of bio-oil (C, H, N, S, and O contents), determined after elimination of water by distillation, is an important parameter for the characterization of bio-oils and biofuels, because it enables estimation of the fuel’s high heating value (HHV), research octane number (RON), and air–fuel ratio (AFR) [10].
Ethanol is another renewable fuel that can be obtained by fermentation of sugar containing materials; for example, sugar-rich biomasses such as sugarcane, starch-rich materials such as corn, or various lignocellulosic materials including agro-industrial wastes. This biofuel is an oxygenate octane booster for gasoline, replacing lead, and it can help to reduce emissions of carbon monoxide (CO), unburned hydrocarbons (HC), and perhaps nitrogen oxides (NOx) (regulated emissions). Additionally, it contributes to the reduction of fossil greenhouse gas emissions, due to the CO2 captured during the biomass production cycle. Ethanol (C2H5OH) is a pure substance, so it has a single boiling temperature. The mixing of ethanol and gasoline (a hydrocarbon) results in an azeotropic effect in which the volatility or vapour pressure of the mixture is greater than the vapour pressure of the constituent components [14,15,16,17,18].
There are several properties of ethanol that affect its combustion characteristics and therefore affect engine performance and exhaust emissions. The major effect of the ethanol used as gasoline additive (in RON95 and RON98 gasoline) is to increase the octane number of the fuel mixture, which may improve engine performance. Its inherent oxygen content assists the combustion process in the cylinder, reduces exhaust emissions (especially CO and HC), and also improves the atomization of the fuel in the air. Ethanol has a higher octane number (117 RON) than commercial gasoline, which only ranges from 88 to 98 RON [19].
The addition of ethanol into unleaded gasoline can improve engine performance and decrease exhaust emissions; namely, CO and HC. For example, the work done in [20] found that the mixture of unleaded gasoline with ethanol tends to provide an average percentage increase in engine power, volumetric, engine efficiency, and fuel consumption of about 8.3%; 9.0%; 7%, and 5.7%, respectively. The authors also found that the addition of ethanol reduces specific fuel consumption, the air–fuel ratio, and the concentration of CO and HC emissions by 46.5% and 24.3%, respectively. In another experimental test [21], the results showed that the ethanol–gasoline mixture slightly increased torque and fuel consumption, while CO and HC emissions decreased 10–90% and 20–80%, respectively. They found that the NOx emission concentration was more dependent on the lambda, and not so much on the ethanol content of the fuel [21]. Other experimental tests [22] using alcohol fuels such as methanol and ethanol found that these improved engine performance and reduced exhaust emissions. In the use of methanol, the average percentage reduction in NOx, CO, and HC emissions was 49%, 22.6%, and 21.6%, respectively. In the use of ethanol, the emission reduction of NOx, CO, and HC was 47.6%, 21.3%, and 19.1%, respectively [22].
In the present work, binary and ternary mixtures of gasoline, biogasoline, and ethanol were evaluated as fuel mixtures for spark-ignition engines. There is very little in the literature regarding these ternary mixtures.
The biogasoline was produced from the distillation of pyrolysis bio-oils obtained from low-grade, used cooking oils. These oils are not suitable to be transformed into biodiesel through the normal transesterification process because of their acidity, water content, and various impurities added by the cooking process. However, there is a risk that the pyrolysis biogasoline may have a RON value significantly lower than gasoline. For that reason, the blending of this biofuel with other high-octane fuels, such as ethanol, might be advantageous.
On the other hand, since it is known that both ethanol and pyrolysis biogasoline contain elemental oxygen, there is interest in investigating the impact of these two oxygenated biofuels in the fuel mixture on engine performance (torque, power), efficiency, and emissions. To assess the performance of fuels and fuel blends, it is typical to perform tests comparing the performance and emissions of the various fuels towards maximum torque and power at given engine speeds (wide-open throttle conditions, WOT). However, in real-world conditions, the WOT setting is rarely used. Therefore, it seems useful to perform comparisons for a set of prescribed torque conditions corresponding to engine-performance conditions at typical cruise speeds.
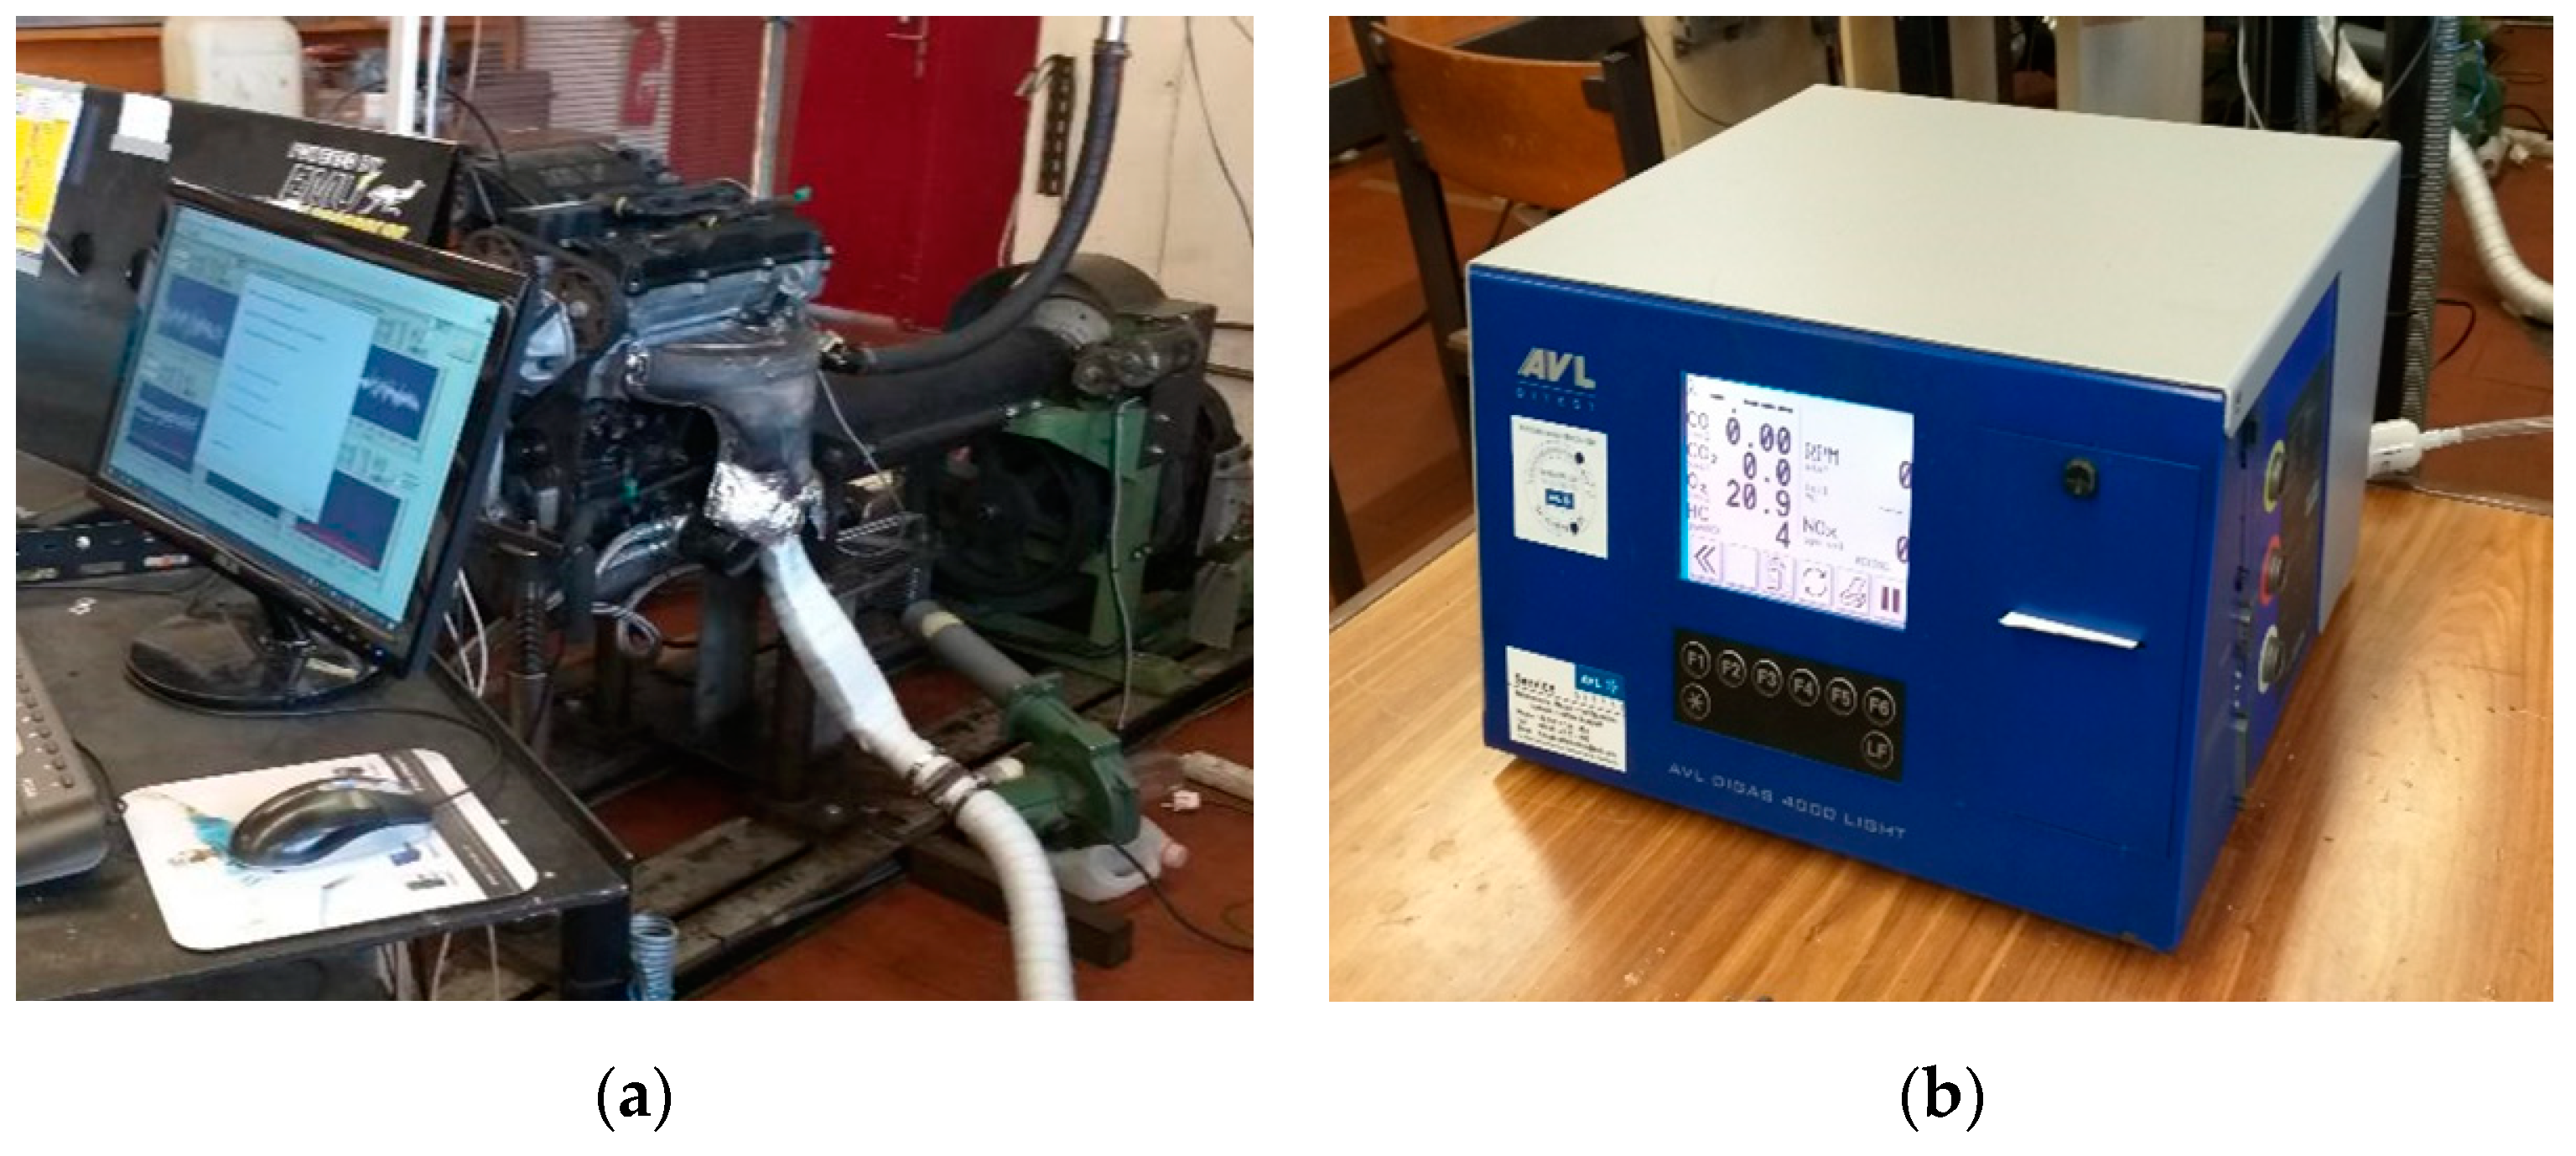
In the present work, experimental tests were run using seven different binary and ternary blends of four fuels, namely pyrolysis biogasoline made from low-grade waste biomass, ethanol, RON95 gasoline, and RON98 gasoline. These blends were tested in an SI engine connected to a brake dynamometer for wide-open throttle (WOT) and at two prescribed torque-load conditions. To reduce the number of variables (and since catalysts require it), the mixture was set at stoichiometric for all tests.
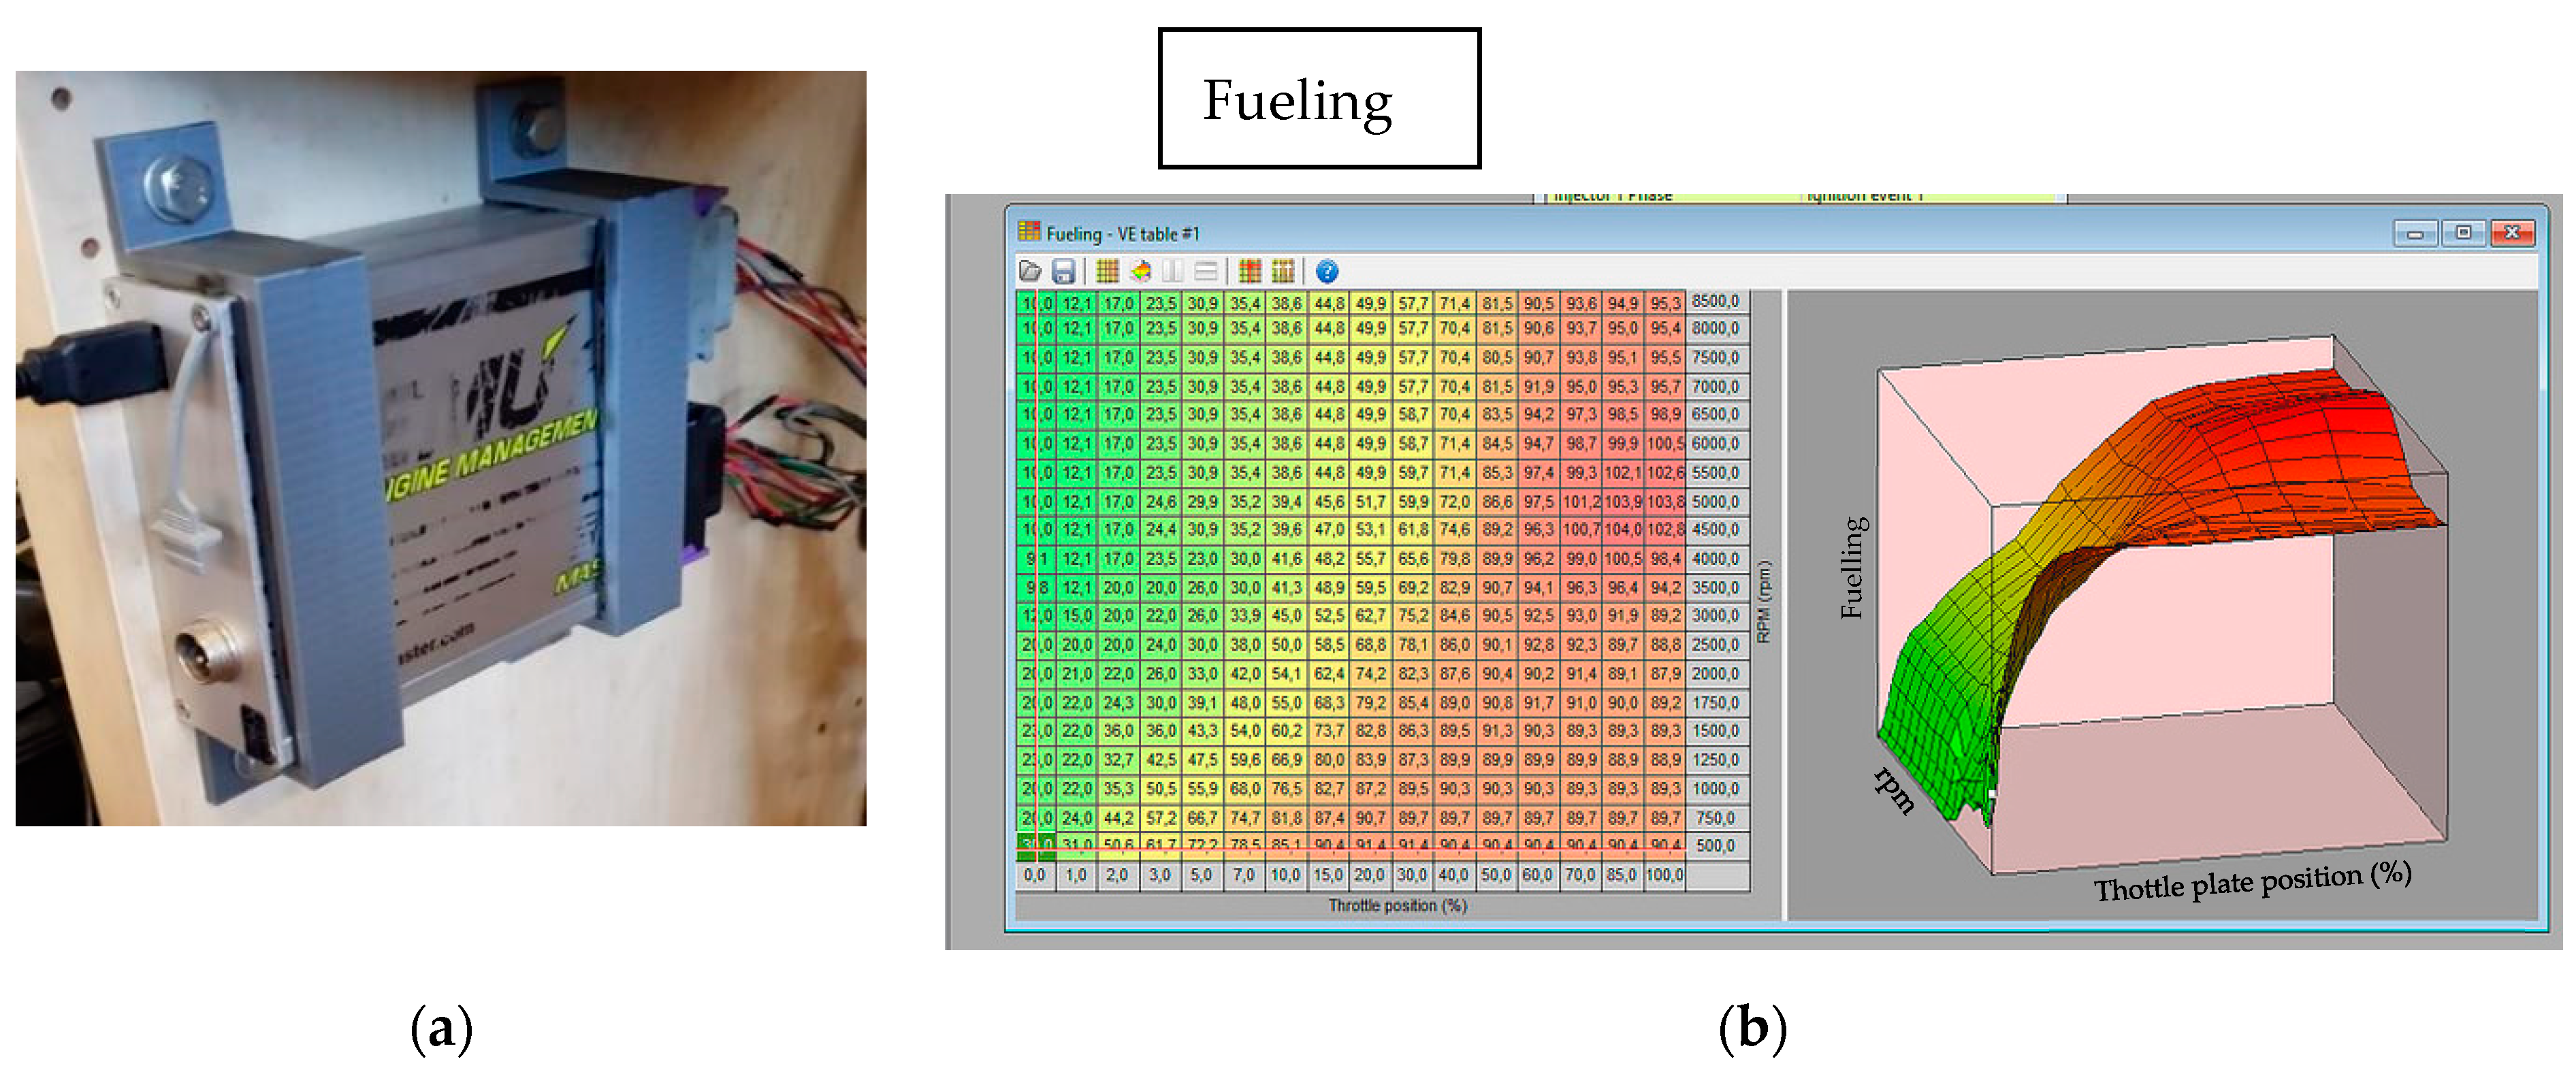
The experimental results were evaluated in terms of engine performance (torque and power), efficiency, and emissions (NOx, CO, unburned HC). The parameters used to ensure stoichiometry and to optimize engine performance and emissions were the fuelling map and the ignition-advance map, so that maximum brake torque (MBT) would be attained without knock onset.

2. Materials and Methods

2.1. Gasoline and Biofuel for Experimental Tests

RON95 and RON98 commercial gasoline were used as base fuels. Ethanol 99% v/v was provided by LabChem Company, Lisbon, Portugal. The biogasoline was produced at the Biomass Laboratory of the Department of Science and Technology of Biomass, Universidade Nova de Lisboa in Portugal by pyrolysis of used cooking oils, in a high-pressure stirred reactor (Parr Instrument Company, Moline, IL, USA, model 4520), at temperatures from 400 °C to 420 °C, using initial vacuum. The produced bio-oil was distilled to obtain more homogeneous fractions and eliminate water. The biogasoline fraction was the first to be collected, at temperatures from 30 °C to 195 °C. The composition and some of the properties of the fuels used in the engine tests are shown in Table 1.
The compositions of the fuel mixtures used in tests with a WOT load and in tests with a prescribed torque load (70 Nm and 50 Nm) are presented in Table 2 and Table 3, respectively, and expressed as mass percentage. For example, the G98 + BG1 + E1 blend contained 98% G (RON 95 gasoline), 1% BG (biogasoline) and 1% E (ethanol).
The settings and testing parameters used during the engine-performance and emissions tests with the various fuel blends are shown in Table 4.

2.2. Spark-Ignition Engine and Dynamometer

The engine-performance tests were performed on an atmospheric multipoint injection (MPI), 1.6 L, 4-cylinder spark-ignition engine from PSA (Peugeot/Citroën). This engine is usually used in small sports cars, such as the Peugeot 106 GTI, Citroën Saxo CUP, and Citroën C2, among others. This engine type was originally built in 1996 and was also installed in subsequent years in the following generations of these models. It is a relatively small and lightweight engine that shows excellent performance in these small and light cars.
The tests were performed in the Laboratory of Thermal Engines and Applied Thermodynamics (LaMoTA) of the Mechanical Engineering Department of the University of Minho (Figure 1). Detailed technical specifications of the PSA engine are shown in Table 5.
The engine was connected to an eddy current dynamometer (Telma AD61-55) through a drive shaft and coupling flanges, as shown in Figure 1a. The engine speed was controlled by the control unit of the dynamometer, which was developed in-house. The maximum engine speed was 6000 rpm for safety reasons. The torque was measured by the dynamometer through a 500 kgf Zemic B3G load cell with a combined error of ±0.02% of the full scale. Taking into account the geometric configuration of the load cell installation and the 4:1 transmission relation, this translated into a maximum error of ±0.1 Nm in the engine torque. A manual throttle was used to control the engine load as the control variable. The exhaust gas emissions were measured using a calibrated AVL gas analyser (DIGAS 4000 LIGHT model, Figure 1b) that could evaluate lambda (λ) and the concentrations of CO, CO2, O2, HC, and NOx. The emission measurement range and accuracy of the AVL gas analyzer can be seen in Table 6.
The engine was also equipped with various other sensors to measure oil and water temperature, fuel pressure, exhaust gas lambda, and engine knock.

2.3. Electronic Control and Measuring Apparatus for the Spark-Ignition Injection Engine Test

To enable the different fuels to be tested in the engine, it was necessary to use a programmable engine control unit (ECU Master EMU), enabling the fine-tuning of spark advance and fuel injection. During the test, two map tables were used to control volumetric efficiency and ignition advance. The volumetric efficiency map table is a function of the air throttle valve opening and closing to regulate the flow of air entering the cylinder in order to obtain a stoichiometric mixture of AFR or lambda 1, while the ignition advance map table shows the angle position of the crankshaft to the piston position at the top dead centre (TDC) during ignition [23,24]. The ECU is shown in Figure 2a, and one map for volumetric efficiency (fueling) is shown in Figure 2b. In the volumetric efficiency map table, there are three-dimensional maps consisting of air throttle position (%), constant crankshaft rotation speed (rpm), and constant load (acceleration pedal position or %).
The mass of fuel was continuously measured with an electronic weighing scale (Figure 3a). The fuel consumption was measured with a Kern FCB 12K0.1B precision weighing device with a ±0.1 g maximum error attached to a data-acquisition system. The fuel flowrate was estimated by obtaining the slope of the line fitted to the mass variation along the test duration through a linear regression, which is an effective way of reducing random error. The various parameters were acquired with a National Instruments CompactDAQ system and analysed through the LabVIEW software program and control board (Figure 3b).

2.4. Energy-Balance Calculations

An energy balance was performed during the tests to account for the amount of energy supplied by the fuel and how the engine used that energy. During fuel combustion, chemical energy is converted into thermal energy, and part of that heat is then converted into mechanical work. The remainder is lost through the cooling water and within the exhaust gases.
The thermal power supplied to the engine, Q ˙ f (in kW), is obtained through Equation (1) [12,19,25]:
Q ˙ f = m ˙ f × L H V f × 1000
where f is the fuel mass flow rate (g/s), and LHVf is the lower heating value of the fuel (in MJ/kg, thus the need to multiply by 1000 for unit coherence).
The engine brake power, b (in kW), is [12,19]:
W ˙ b = 2 × π × N × τ
where N is the engine speed (rev/s) and τ is the brake torque (N·m).
The air–fuel equivalence ratio, or lambda, for fuels (λtot) is calculated as follows [19,25,26,27]:
λ t o t = m ˙ f A F R S t × m ˙ a i r
where f (g/s) is the fuel mass flow rate, in this work measured by an electronic weighing scale; AFRSt is the stoichiometric air–fuel ratio (on a mass basis) for the fuel blend; and air is the intake air mass flow rate (g/s).
The brake-specific fuel consumption (BSFC) is the ratio between the mass flow rate of the fuel consumed by the engine (in g/h) and the power produced by the engine (in kW), and can be written as follows [19,25]:
BSFC ( g kWh ) = m ˙ f   / W ˙ b ,           m ˙ f = m ˙ f ( g / s ) × 3600
Nonetheless, since the different tests were performed with different fuels displaying different heating values, the BSFC concept was not suitable to compare the performance of the different fuel blends. Instead, the concept of energy efficiency, or brake thermal efficiency (ηth,) was used:
η t h , f b = W ˙ b Q ˙ f b
where Q ˙ f b is the thermal power supplied by the fuel blend to the engine. The higher heating value (HHV) and lower heating value (LHV) can be measured or calculated based on the composition of the fuel using the following equations [15,26,28]:
HHV   ( MJ / kg ) = 0.3491 × C + 1.1783 × H 0.0151 × N + 0.1005 × S 0.1034 × O 0.0211 × A
where C, H, S, O, and N are the weight percentage of carbon, hydrogen, sulphur, oxygen, and nitrogen; and A is the weight percent of ash in the fuel constituents. As the fuels used in the present work had negligible sulphur or ash, the previous equation can be simplified to:
HHV   ( MJ / kg ) = ( 338.2 × C + 1442.8 × ( H O / 8 ) ) × 0.001
The LHV is calculated as follows [28]:
LHV   ( MJ kg ) = HHV 218.3 × H %   ( wt % )
The LHV of the fuel blend, LHVfb, results from the weighted average of the LHV of each specific fuel, with the corresponding mass percentage in the fuel mixture (%m) being used as the weighting factor:
L H V f b = L H V G × % m G + L H V E × % m E + L H V B G × % m B G
Stoichiometric AFR/lambda were selected as targets during engine operation. Complete combustion reaction of each fuel (gasoline, ethanol, and pyrolysis biogasoline) with air was assumed for the calculations.
In general, the combustion reaction of a fuel and air can be written as follows:
C x H y O z + ( x + y 4 z 2 ) ( O 2 + 3.76   N 2 )   x   C O 2 + y 2   H 2 O + 3.76 ( x + y 4 z 2 )   N 2 + h e a t
The fuels considered for the calculations were those presented in Table 1. The properties of ethanol (C2H5OH) were those of the pure substance mixed with 1% water, while the properties of pyrolysis biogasoline and RON95 gasoline were specifically measured. RON95 is a commercial gasoline that typically is blended with around 5% ethanol, being often called E5. Because commercial gasoline contains ethanol, which also contains water (H2O), the hydrogen in commercial gasoline is increased slightly, and there is also oxygen content.
Based on the fuel elemental composition (Table 1), it was possible to calculate general molecular formulas for these fuels, namely CxH1.726xO0.012x for RON95 gasoline and CxH1.964xO0.029x for biogasoline. Considering the compositions of RON95 gasoline and biogasoline, as evaluated by chromatographic analysis [29,30], it was possible to estimate an average carbon number of 7 for RON95 gasoline and 9 for biogasoline. Therefore, the complete combustion of RON95 gasoline, biogasoline, and ethanol with air can be described by Equations (11)–(13), respectively:
C 7 H 13 + 10.3   ( O 2 + 3.76   N 2 )     7   C O 2 + 6.5   H 2 O + 38.5   N 2 + h e a t  
C 9 H 18 + 13.5   ( O 2 + 3.76   N 2 )     9   C O 2 + 9   H 2 O + 50.8   N 2 + h e a t  
C 2 H 7 O + 3   ( O 2 + 3.76   N 2 )     2   C O 2 + 3.5   H 2 O + 11.3   N 2 + h e a t  
After determining the molar mass percentage of each fuel, the AFR can be calculated using the following equation for each fuel with air [19]:
AFR = 11.44 C + 34.32 ( H O 8 ) + 4.29 S                     kg   o f   a i r kg   o f   f u e l
From the test data, the percentage of molecular mass composition of the elements that formed a fuel compound and the above equation were used to obtain the values of HHV, LHV, and AFR listed in Table 7.
AFR calculations were performed for fuel mixtures containing BG1, BG2, BG4, BG5, E1, E2, E4, E5, and E10.
To illustrate these calculations, an example is given for the calculation of the air–fuel ratio of fuel blends (AFRfb) for (BG2 + E2 + G96). As shown in Table 3, the fuel mixture symbol (BG2 + E2 + G96) shows that: BG2 = 2% biogasoline, E2 = 2% ethanol, and G96 = 96% gasoline.
For example, the air–fuel ratio of the fuel blend (AFRfb) for (BG2 + E2 + G96) blend is:
A F R f b = 0.02   ×   14.03 + 0.02   ×   8.99 + 0.96   ×   14.06 = 13.955
For the requirements of lambda or AFR, the stoichiometric target of the fuel combustion fuel blend in the ECU map and the mass of the exhaust gas flow rate is the total mass of fuel flow rate multiplied by the AFR. For all conditions within the engine map, the lambda (ratio AFRstoichiometric against AFRreal) target value was always 1, but the lower heating value changed with the mixture of the fuel supplied. Therefore, the AFR and LHV values for stoichiometry for pure fuels and fuel blends varied for each fuel; the values are listed in Table 8.
The calculation of the mass flow rate of air into the engine and the total mass flow rate of the combustion gases was required. The sum of the fuel and air mass flow rates entering the engine yielded the exhaust gas mass flow rate, m ˙ exh , leaving the engine, which can be written as:
m ˙ exh = m ˙ i n ,               and   m ˙ i n = m ˙ f + m ˙ a
The specific emission of a given pollutant i, spemission i (g/kWh), is defined as the ratio between the mass flow rate of the respective pollutant ( m ˙ i ) on an hourly basis (g/h) divided by the brake power of the engine (kW) [31,32,33]:
s p e m i s s i o n   i = m ˙ i [ g h ] W ˙ b [ kW ] = e c o n c   m   i × m ˙ exh [ g h ] W ˙ b [ kW ]
where e c o n c   m   i is the mass concentration of pollutant i.
However, the analyser measured volume concentrations of the emissions ( e c o n c   v ,   i ) in ppm or %. Therefore, Equation (16) above can be rewritten as:
s p e m i s s i o n = e c o n c   v ,       i × ( M e   c o n c ,   i M t o t   e x h   e   c o n c o r   ρ   i ρ t o t   e x h ) × ( m ˙ e x h W ˙ b )
where:
  • econc v, i is the volume concentration (ppm or percentage, divided by a correction factor: ppm × 10−6 and vol % × 10−2) of pollutant i;
  • Me conc, i is the molecular mass of emission concentration i (g/mol);
  • Mtot exh e conc is the total molecular masses of exhaust emission concentration (g/mol);
  • ρe conc,i is the density of emission gas i (kg/m3);
  • ρtot exh e conc is the total density of the exhaust emission concentration (kg/m3); and
  • exh is the exhaust gas emission mass flow rate (g/h).
Note that since the unit of exh is (g/s), a factor of 3600 is used to convert to (g/h).

3. Results and Discussion

3.1. Analysis of Engine Performance and Emissions at Various Engine Loads

The evaluation of the different fuel mixtures involved the determination of their effect on the performance of a spark-ignition engine by measuring its power, torque, and efficiency, as well as determining the associated exhaust emissions (CO, HC, and NOx) with the use of a brake dynamometer. As indicated above, the engine was tested with different biofuel blends at various engine speeds at maximum engine load (WOT) and at the two prescribed torque levels (50 Nm and 70 Nm) with a stoichiometric mixture and with the ignition adjusted to MBT or to avoid knock.

3.1.1. Performance and Emissions for Maximum Engine Load (WOT)

These series of tests were conducted on the engine for different blends of biogasoline and ethanol with RON95 and RON98 pump gasolines. The tests involved measuring the engine performance and exhaust emissions at the maximum engine load (WOT) for various engine speeds with a stoichiometric mixture and the ignition map set for MBT or knock onset. Each test had an approximate duration of 20 s after speed and engine load stabilization.
The results obtained with various biofuel blends with gasoline for the parameters (a) torque and ignition spark advance, (b) variation of power relative to the baseline fuel, and (c) efficiency are shown in Figure 4, plotted as a function of engine speed, ranging from 2000 to 6000 rpm with intervals of 500 rpm.
Figure 4a shows the torque and ignition-advance values for the engine at WOT and for the different fuel mixtures. It can be seen that the addition of ethanol and biogasoline, in small percentages relative to gasoline, generally had a positive effect on the improvement of the combustion characteristics of the engine. If we look at the overall lines (for all mixtures), there was a twin peak of torque around 3000 rpm and 5000 rpm, which was expected for an SI 4-valve engine. The maximum average torque was obtained by the G98 + BG1 + E1 mixture, followed by G98 + BG2, G96 + BG4, G96 + E4, and GS100 (straight pump RON98 gasoline), and the two lowest torques were found for G100 (straight pump RON95 gasoline) and G96 + BG2 + E2. More specifically, the average percent change in torque and power for the entire engine speed range using a mixture of ethanol and biogasoline as an additive compared to pure commercial G100 gasoline was as follows: GS100 = 0.5%; G96 + E4 = 1.5%; G98 + BG2 = 2.6%; G96 + BG4 = 1.7%; G98 + BG1 + E1 = 3.2%; and G96 + BG2 + E2 = 0%.
The ignition advance was set for conditions of MBT or to avoid knock. The G98 + BG2, G98 + BG1 + E1, and G96 + E4 mixtures allowed higher spark advance, while RON95 pump gasoline showed the lowest advance. The high-octane pump gasoline (RON98) was only slightly better than the RON95. This showed that the addition of ethanol and pyrolysis biogasoline generally allowed higher ignition advance, which promoted higher torque and power.
The differences in the power generated from each fuel mixture and the power produced by the baseline fuel (G100 gasoline, RON95) can be seen in Figure 4b, expressed as a percentual variation. The figure shows that the addition of ethanol and pyrolysis biogasoline to G100 gasoline (RON95) increased the average power compared to the power produced by G100 gasoline (RON95) and GS100 gasoline (RON98). This increase in power was due to the nature of ethanol, which increases RON in the fuel mixture, as well as oxygen content, and has a good combustion temperature. Meanwhile, when pyrolysis biogasoline was compared to the ethanol, it contained less oxygen and was more energy-dense, and seemed to provide a more balanced mixture.
Engine brake efficiency is shown in Figure 5 for the different fuel blends at WOT and with stoichiometric mixtures. The maximum efficiency occurred at engine speeds between 3000 and 4000 rpm, although some mixtures had a local maximum at higher engine speeds. A higher overall efficiency was obtained for the mixtures of gasoline with biogasoline and ethanol in smaller proportions, namely the G96 + BG2 + E2, G98 + BG1 + E1, and G98 + BG2 mixtures, while the high-octane RON98 pump gasoline (GS100) and G96 + BG4 showed lower efficiencies compared to the others. Straight pump RON95 gasoline (G100) displayed medium/low values for the various fuel blends. The average percent variations of efficiency using a mixture of ethanol and biogasoline as an additive compared to commercial gasoline RON95 (G100) were as follows: GS100 = −2.8%; G96 + E4 = −1.8%; G98 + BG2 = 4.2%; G96 + BG4 = −0.9%; G98 + BG1 + E1 = 5.7%; and G96 + BG2 + E2 = 1.9%.
The CO and HC emissions in exhaust gases depend on the quality of the combustion process that occurs in the combustion chamber. When incomplete combustion occurs, CO and HC emissions will increase. The stoichiometry of the combustion and homogeneity of the mixture (atomization) are factors that we tried to eliminate in these experiments, as the mixture was always stoichiometric, and the injections all occurred at the same crank angle.
When examining Figure 6a,b, it seems that the addition of ethanol to the fuel (G96 + E4, G96 + BG2 + E2, BG98 + BG1 + E1) reduced the emissions of CO and HC, whereas the addition of biogasoline (G96 + BG4, G98 + BG2) had the opposite effect. This increase of CO and HC emissions, reflecting an incomplete combustion for the mixtures with biogasoline, may be related to the presence of components with molecular weights significantly higher than the average molecular weight of gasoline. This characteristic may be attenuated in the biogasoline fraction by applying fractional distillation to limit codistillation of heavier components. In general, ethanol was the biofuel additive that showed a capacity to better improve the combustion characteristics and reduce CO and HC emissions. The average percent variations of CO/HC using a mixture of ethanol and biogasoline as an additive compared to commercial G100 gasoline were as follows: GS100 = −8%/−8%; G96 + E4 = −31%/−2%; G98 + BG2 = 77%/4%; G96 + BG4 = 184%/17%; G98 + BG1 + E1 = 9%/−22%; and G96 + BG2 + E2 = 5%/−8%.
The formation of nitrogen oxides (Figure 6c) was mainly influenced by the high temperatures of the combustion, due to the Zeldovich reaction [13]. The addition of ethanol to the fuel (G96 + E4, BG98 + BG1 + E1, G96 + BG2 + E2) increased NOx production, most likely because the combustion was slower (ethanol burns faster than gasoline) and the spark advance was increased (because of its higher octane number), leading to higher combustion pressures and temperatures. Mixtures with biogasoline (G98 + BG2, G96 + BG4) produced lower NOx, most likely because the combustion characteristics (lower combustion speed) of the biogasoline deteriorated the combustion of the pump gasoline, although G96 + BG4 was tested with a longer ignition advance. Figure 6 shows the results for NOx. In the case of G98 + BG2, there were substantial NOx oscillations depending on the engine speed. We are not sure why this happened, but since NOx is so dependent on mixture strength, we believe that these oscillations may have been related to that effect. In [21], the authors observed that NOx was mainly a function of lambda, not the ethanol percentage in the mixture.
The average percent variations of NOx using a mixture of ethanol and biogasoline as an additive compared to commercial RON95 gasoline (G100) were as follows: GS100 = −3.8%; G96 + E4 = 40%; G98 + BG2 = −33%; G96 + BG4 = −18%; G98 + BG1 + E1 = 17%; and G96 + BG2 + E2 = 14%.

3.1.2. Performance and Emissions for Two Prescribed Torque Conditions at Different Engine Speeds

The previous section reported tests in which the engine was at WOT, which is a condition seldom used in day-to-day driving, but the tests helped us to understand the way the different fuels behaved in the engine. However, it is also important to test the fuels at conditions similar to those found on the road. A possible approach would be to run the engine under the same road cycle with the different fuels, but this would require the engine to be in the car, and the car to be on a rolling road dynamometer capable of performing specific driving cycles, which was unavailable for these tests.
So, it was decided to perform a series of tests in which the engine speed and the engine load were kept constant at prescribed values that were the same for all the fuels. Four partial-load conditions, relevant to actual driving on the road or motorway, were selected: two torque conditions of 50 and 70 Nm and two engine speeds of 2000 and 2500 rpm (10 and 15 kW at 2000 rpm and 13 and 18 kW at 2500 rpm). In addition, the conditions for WOT were tested, achieving 135 and 137 kW for 2000 and 2500 rpm for the use of RON95 pump gasoline, respectively. Again, for each condition and for each fuel, the engine fueling was optimized for stoichiometry. In terms of ignition advance, all tests under each condition used similar advancing for the different fuels, as it would be too complicated to set a torque level and then optimize the engine in terms of torque output.
Different ethanol and biogasoline mixtures with RON95 (G100) and RON98 (GS100) pump gasoline were used (G90 + E10, GS90 + E10, G95 + BG5, G90 + BG5 + E5). Furthermore, a mixture of high-octane RON98 pump gasoline and ethanol was used (GS90 + E10), in order to compare it to the mixture of RON95 and ethanol (G90 + E10).
It is commonly established that RON98 high-octane pump gasoline allows for a better engine performance than RON95. However, the major difference between these commercial fuels is their influence in terms of knock onset, which is very important for the engine to produce high torque and power, but is of no significance when the engine runs at lower loads, the most frequent conditions of engine use in urban areas and on local roads. The specifications for pump gasoline enable maximum percentages of 5% and 10% of ethanol for RON95 and RON98 gasolines, respectively. So, as the ethanol has a much lower energy density (in volume, which is the way the user buys the fuel) than straight gasoline, a higher proportion of ethanol will give the fuel a lower heating value, and the engine will require a higher flow of fuel (in volume terms) to attain the same power. Therefore, it seems that for the same conditions without knock, the higher-octane RON98 pump gasoline would result in a higher fuel consumption (in volume) than for RON95, unless the better combustion and efficiency enabled by the addition of ethanol reduces the consumption.
Figure 7a,b show the resulting efficiencies for the two pump fuels (RON98 and RON95) and for the various blends, for two prescribed torque conditions (50 and 70 Nm) and for the two engine speeds (2000 and 2500 rpm). In addition, the same graphs show the values for the WOT conditions. In all cases, the fuels with ethanol (G90 + E10, GS90 + E10) yielded better efficiencies than the base fuels (RON98 and RON95). The addition of biofuel (G95 + BG5) to the RON95 also improved the efficiency in all the cases, but with lower improvements than for ethanol. The tests with addition of ethanol and biogasoline (G90 + BG5 + E5) were not conclusive. However, it was noticeable that the WOT tests of the mixture with ethanol and biogasoline produced more torque than any other mixture. Again, the tests using ethanol added to the pump gasoline showed higher efficiency than those for the base gasoline.
The results for CO and HC emissions can be seen in Figure 8a–d. The addition of ethanol to gasoline generally improved combustion and lowered the emissions of CO and HC. This effect was clear for the mixtures with 10% ethanol (G90E10, GS90E10), which showed emission values of about half of those measured for pump gasoline. In addition, the RON98 gasoline generally had lower emission values for all pollutants than RON95, reflecting the higher percentage of ethanol in its composition. Strangely, the addition of biogasoline (G95 + BG5) reduced the emission of CO and HC for all cases, but the mixture of biogasoline and ethanol (G90 + BG5 + E5) generally increased the emissions of these pollutants or had no effect.
In terms of NOx, Figure 8e,f show that the trend was not evident, as with previous emission results. Although the tests for WOT showed that the addition of ethanol (G90E10, GS90E10) yielded higher values for NOx, and the base RON95 gasoline had the lowest NOx emissions, which were expected, the results for the partial load (50 and 70 Nm torque) did not follow this trend. RON98 gasoloine seemed to produce more NOx than RON95, and the addition of biogasoline (G95 + BG5) had a small detrimental effect on those emissions. The addition of ethanol showed an increase in NOx when added to RON95 gasoline (from RON95 to G95 + E10), but that effect was not evident for RON98 (from RON98 to GS90 + E10).
NOx is mainly produced by the mechanism of the Zeldovich reaction [13], so it is mostly influenced by combustion temperature, but the oxygen content of the fuel also plays an important role. Therefore, ethanol addition to gasoline is expected to increase the level of NOx production through both effects (better combustion and existence of oxygen in the fuel). However, the higher latent heat of vaporization of the ethanol reduces the intake temperature of the mixture as it vaporizes, lowering the potential higher value for maximum temperature during combustion.
In terms of the effect of biogasoline addition to straight gasoline, we concluded that this biofuel may be used in moderate incorporation percentages without significant impacts on the fuel-combustion efficiency. When examining all the results (CO, HC, NOx, efficiency, and torque), the addition of biogasoline seemed to improve combustion, although at a lower level than with the addition of ethanol.
It can be inferred from these results that the use of biogasoline produced from pyrolysis of low-grade waste vegetable oils, as an additive to gasoline, is a viable solution for the valorization of this waste material.

4. Conclusions

This work evaluated the feasibility of using a biofuel additive for gasoline in spark-ignition engines. This biofuel, designated as biogasoline, is produced by the pyrolysis of used cooking vegetable oils that are not suitable to be converted to biodiesel through the normal transesterification process. The incorporation of such fuels avoids their disposal in landfills, providing value to an otherwise useless residue, and allows a decrease in fossil-fuel consumption and fossil CO2 emissions of around 24 g CO2/L for each percent of incorporation. We tested up to 10% incorporation, which translates to a reduction of around 240 g CO2/L.
Four different base fuels (pyrolysis biogasoline, ethanol, RON95 gasoline, and RON98 gasoline) were tested in seven different binary and ternary blends. The aim was to analyze whether the referred biogasoline could be used as a gasoline additive, enabling the use of a higher percentage of biofuel incorporation in transportation, as well as the detection of synergistic or antagonistic effects in ethanol supplementation. As the octane number of the biogasoline was expected to be lower than those of current gasolines (RON95 or RON98), the strategy of mixing biogasoline with ethanol was also adopted to maintain the RON value of the mixture at appropriate values.
The use of a mixture of ethanol and biogasoline as additives with a maximum incorporation of 10% generally improved efficiency and lowered emissions such as CO and HC relative to straight RON95 or RON98 gasolines. We can also say that the use of biogasoline allowed us to achieve a 10% biofuel incorporation rate while keeping the bioethanol concentration at 5%. This demonstrated the compatibility of these two biofuels as gasoline additives.
The tests were divided in WOT tests and partial-load tests, in which the torque was kept constant (at two prescribed levels, 50 and 70 Nm) for two different engine speeds (2000 and 2500 rpm). The WOT tests were performed from 2000 to 6000 rpm in steps of 500 rpm.
The tests for WOT allowed us to conclude that:
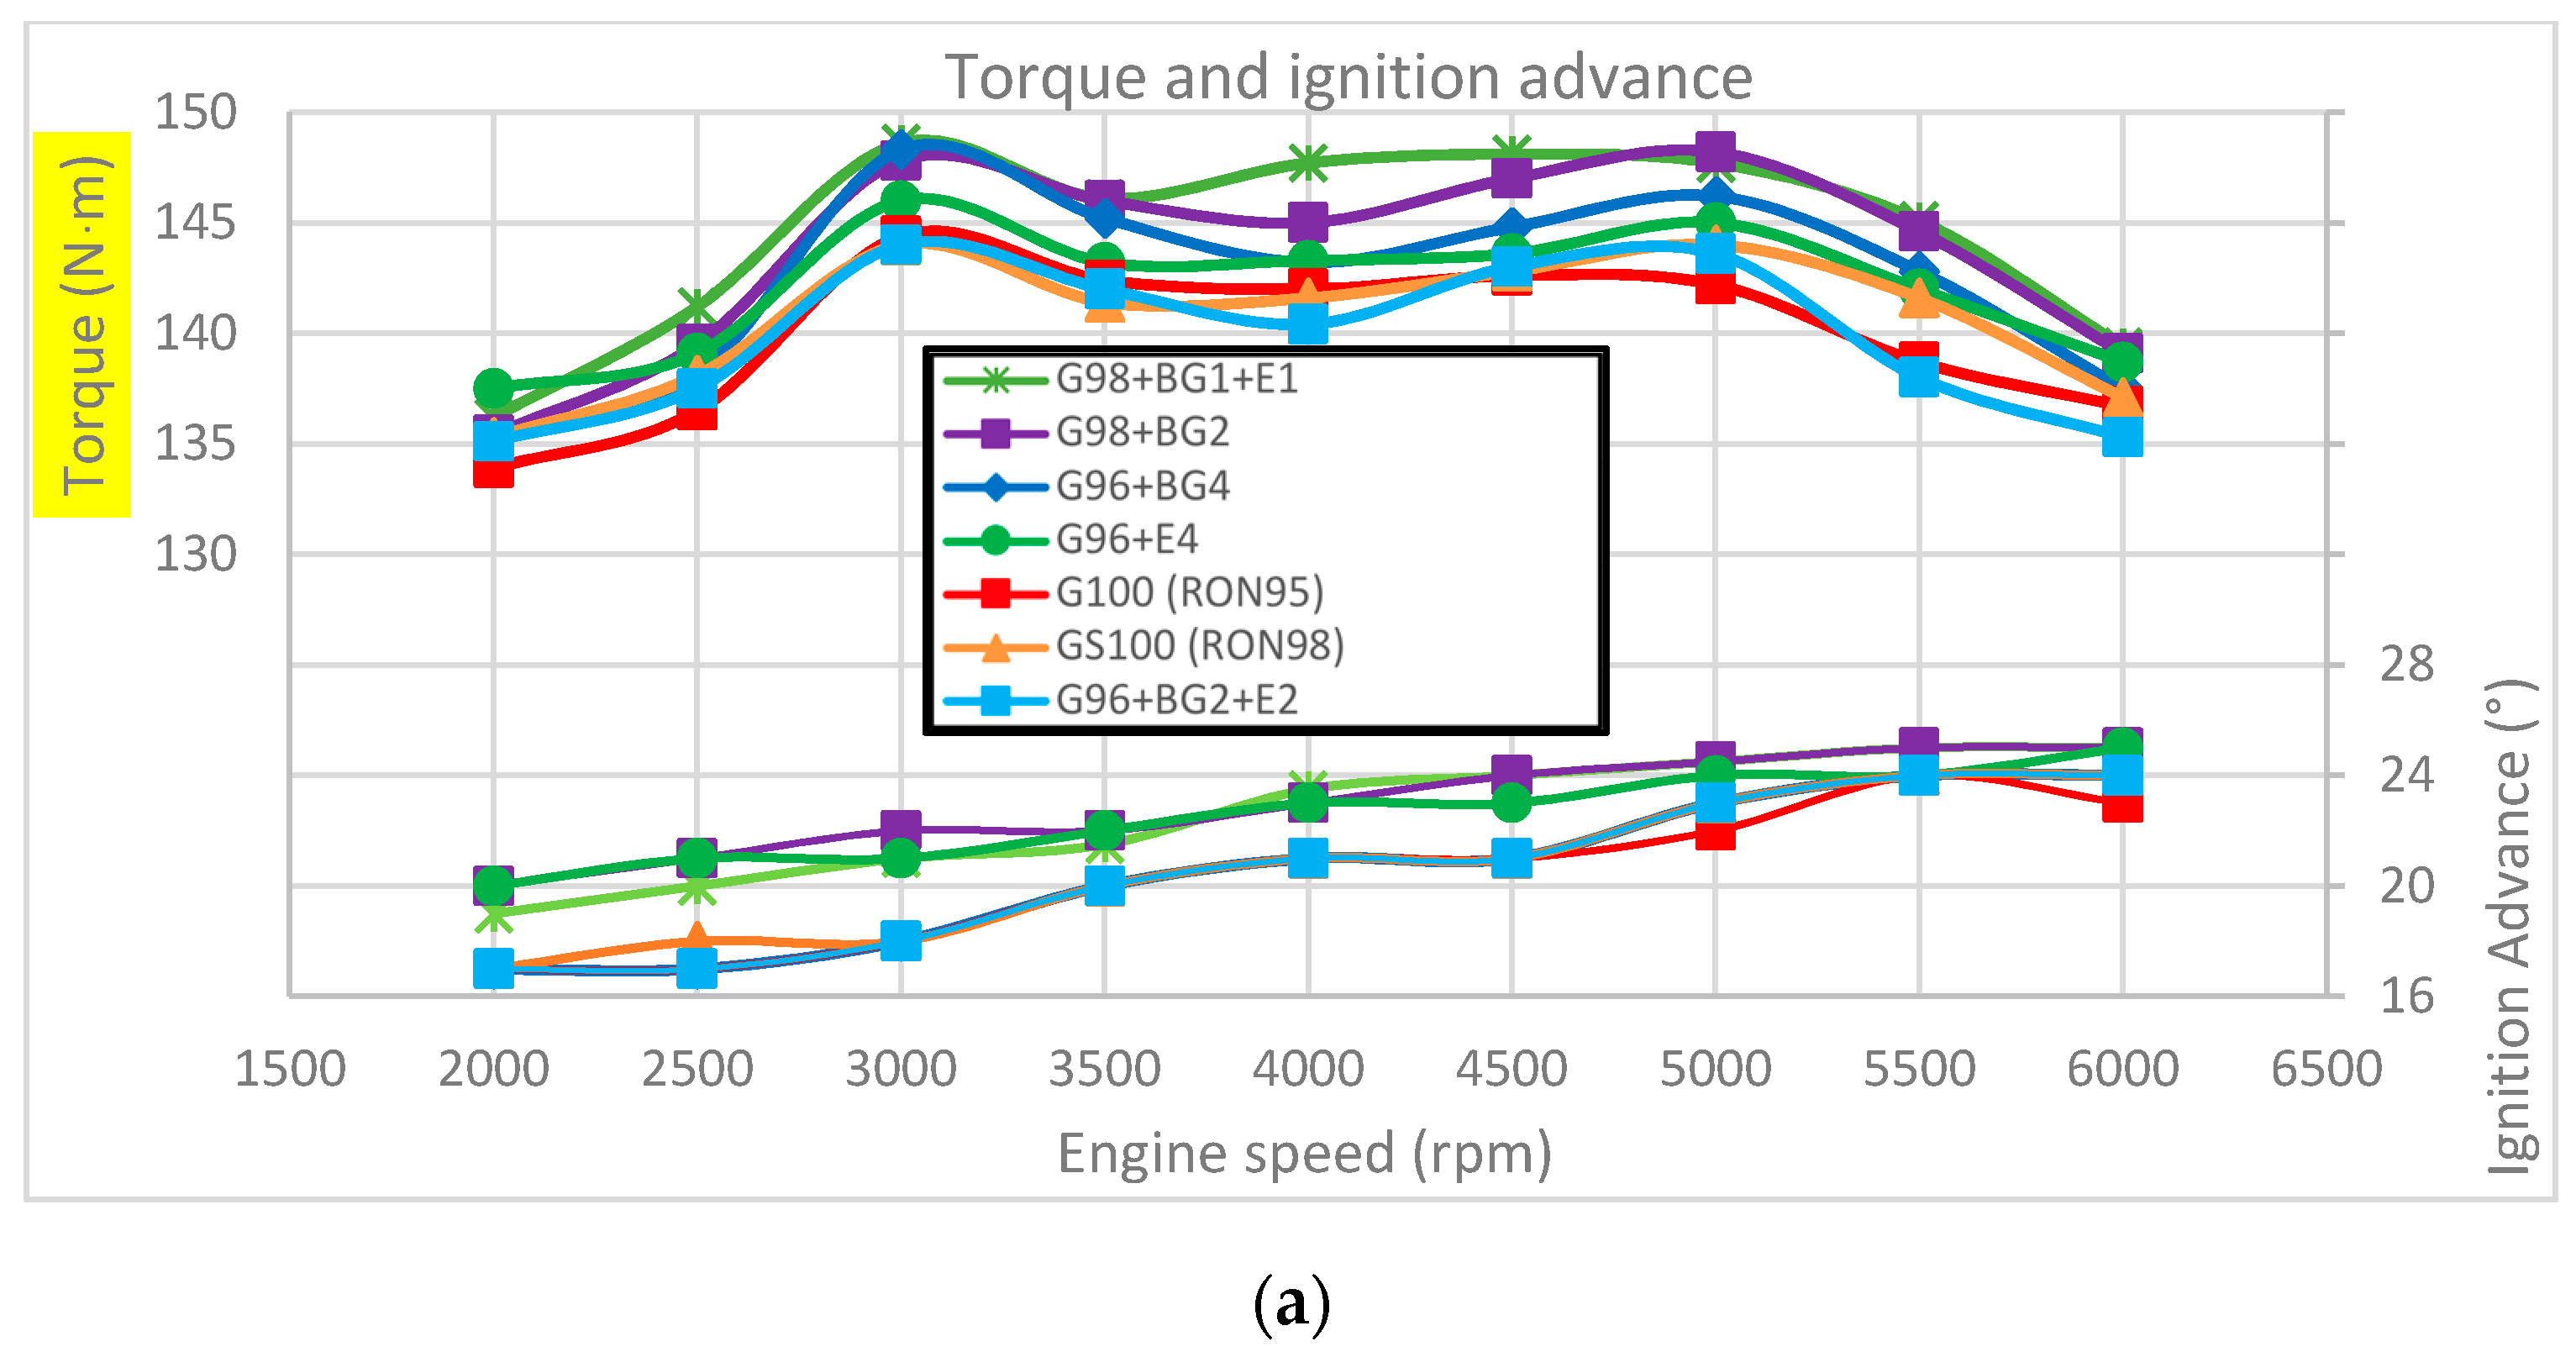
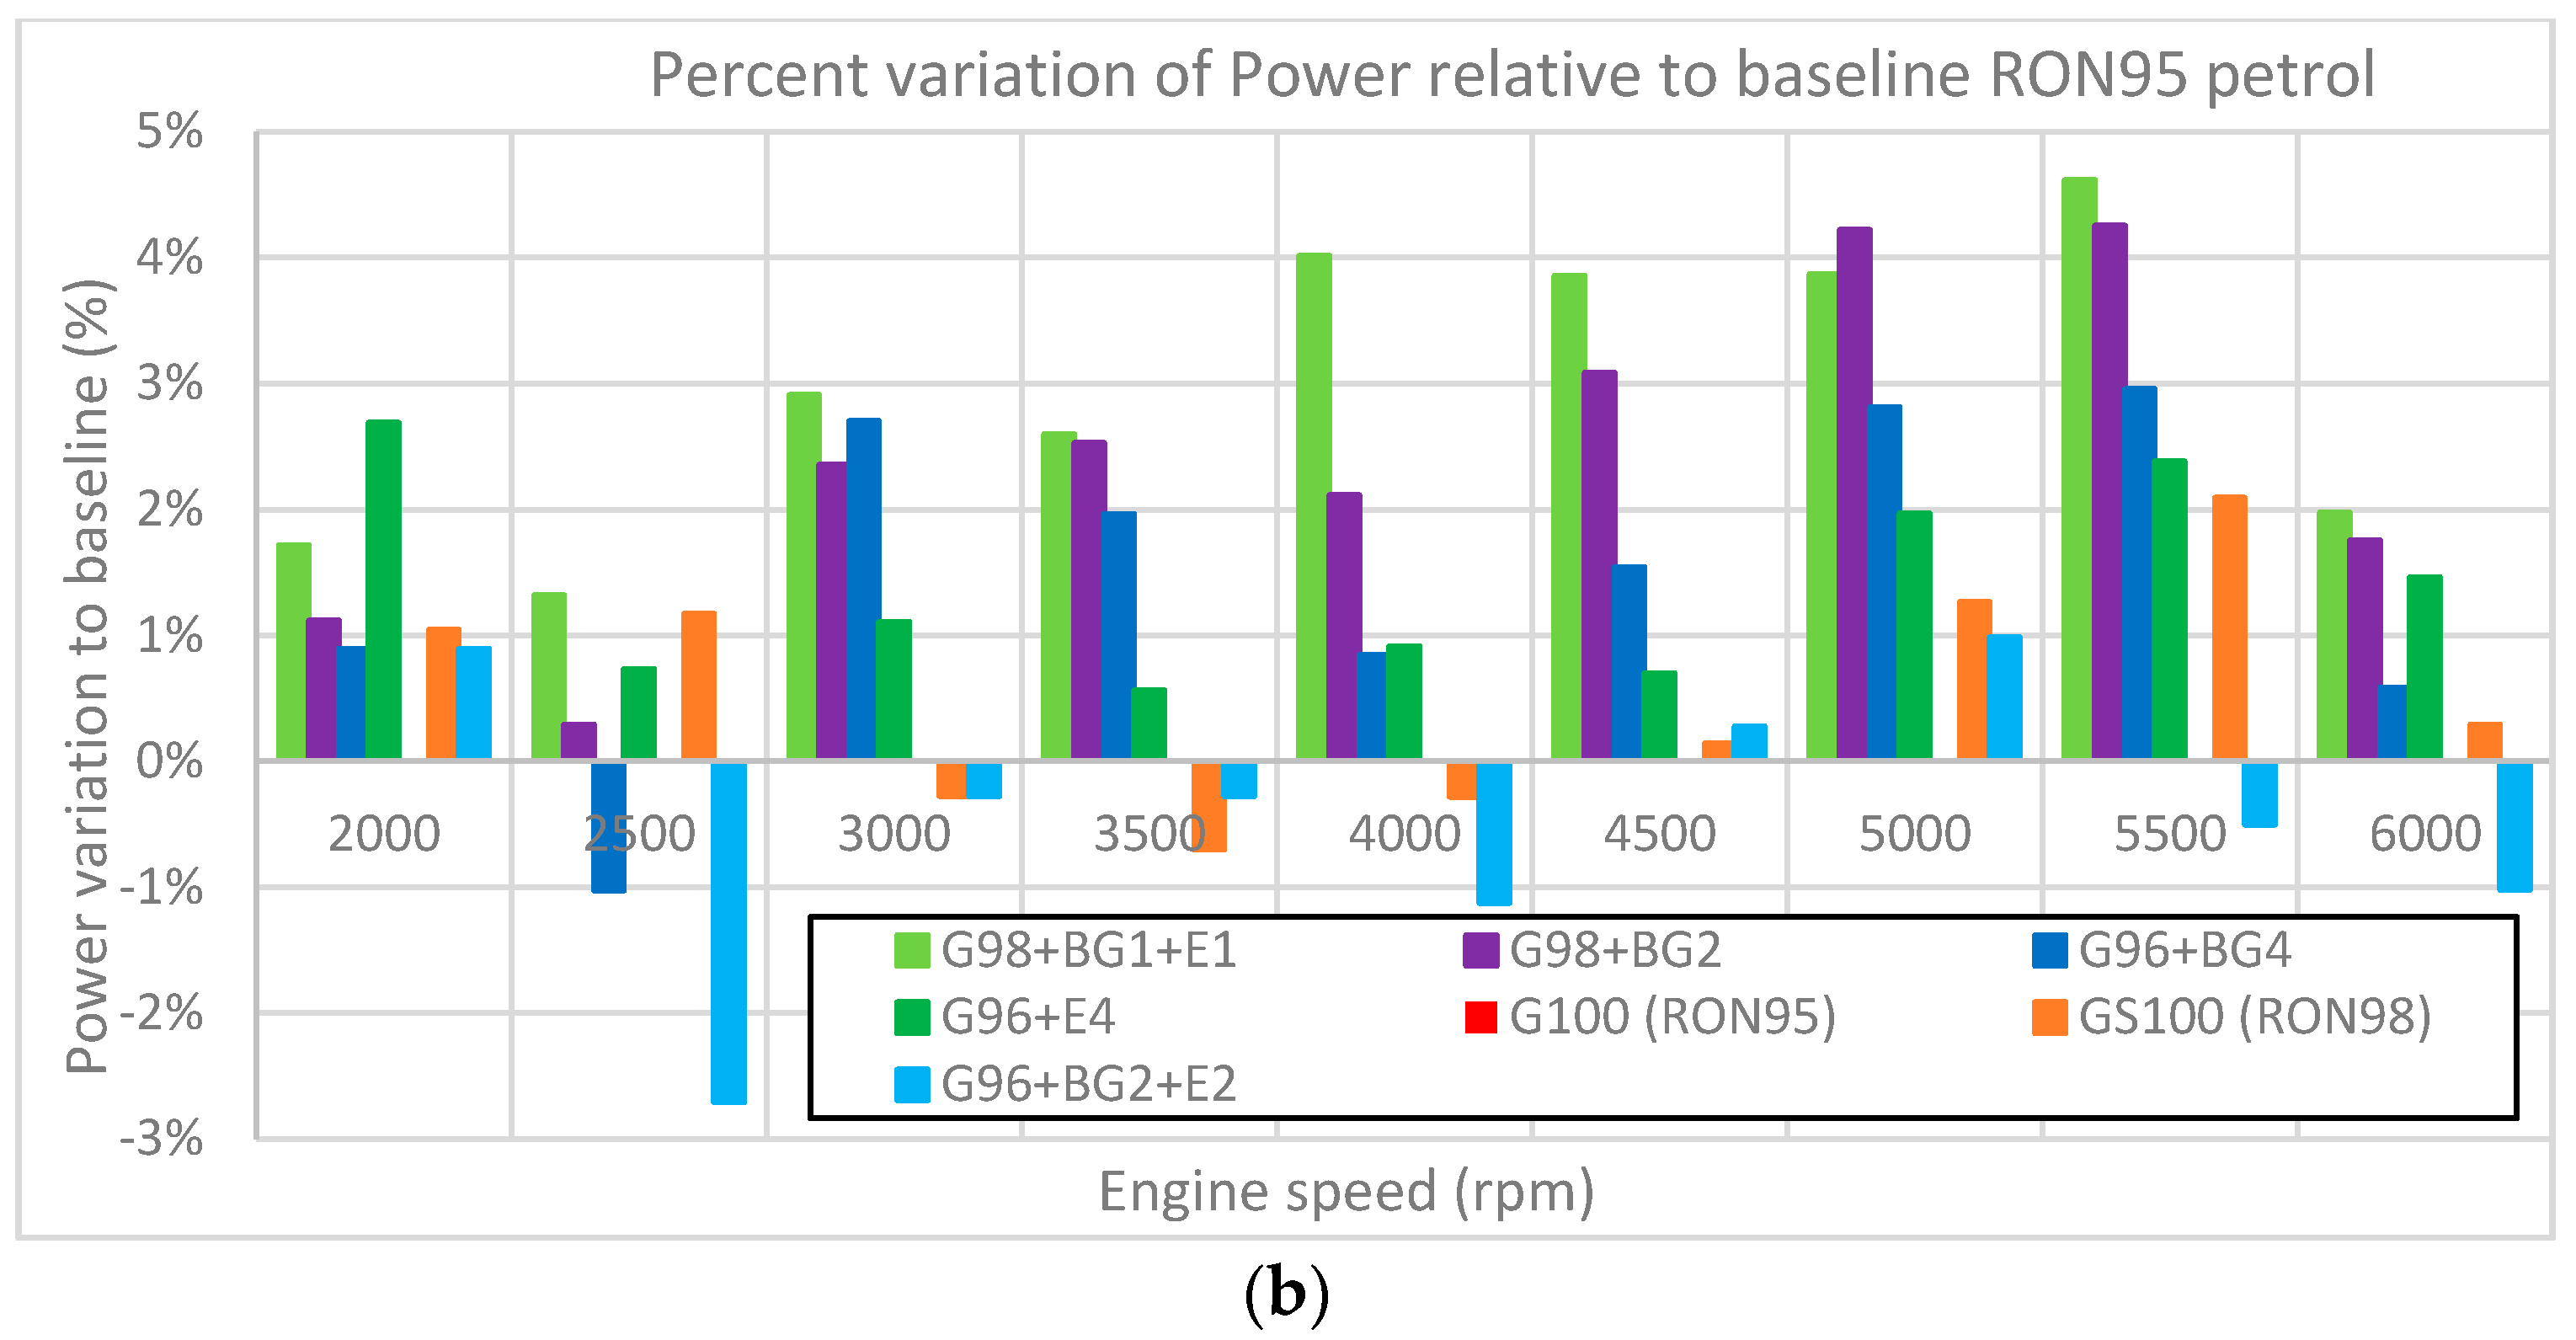
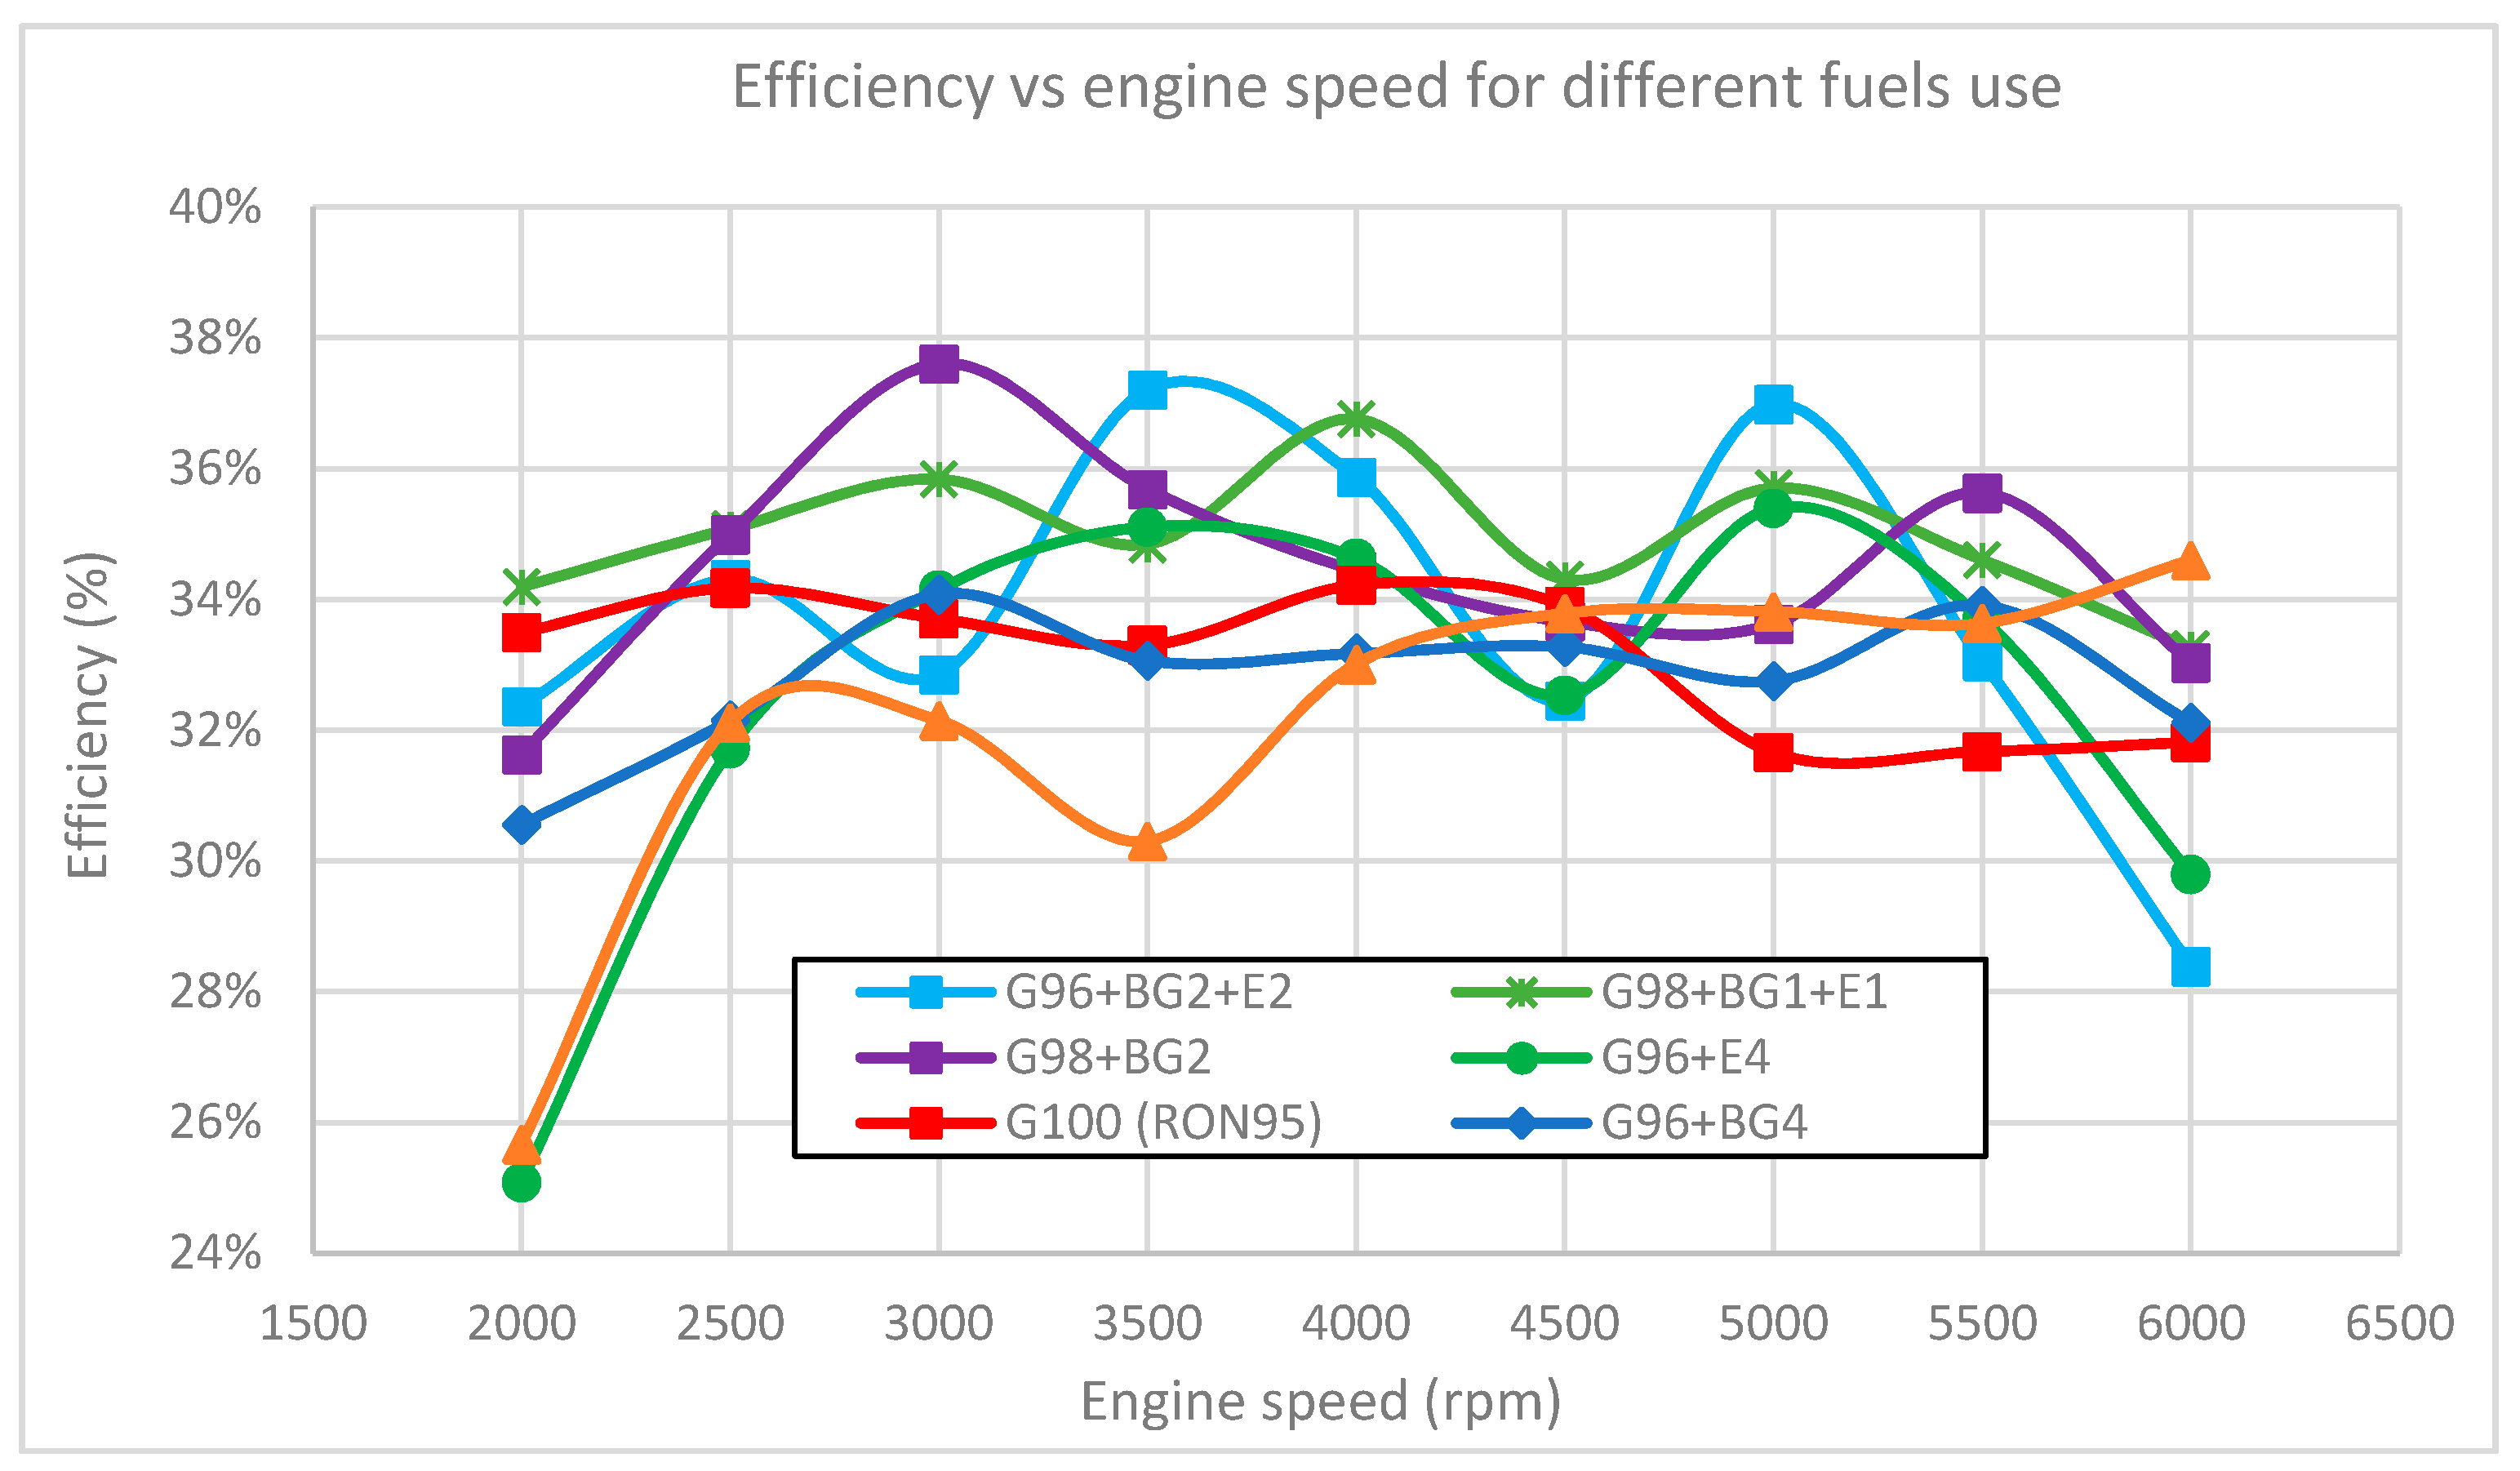
The addition of biogasoline and/or ethanol to gasoline increased torque, power, and efficiency. Specifically, the highest percentage increase in power relative to the baseline (commercial RON95 gasoline, G100) was obtained by the ternary and binary mixtures with the addition of biogasoline and ethanol to RON95 gasoline (G100); that is, G98 + BG1 + E1 and G98 + BG2, with an average percentage increase of 3.2% and 2.6%, respectively. Ternary mixtures tended to be among the highest-performing, with G98 + BG1 + E1 having an average 5.7% gain over the baseline.
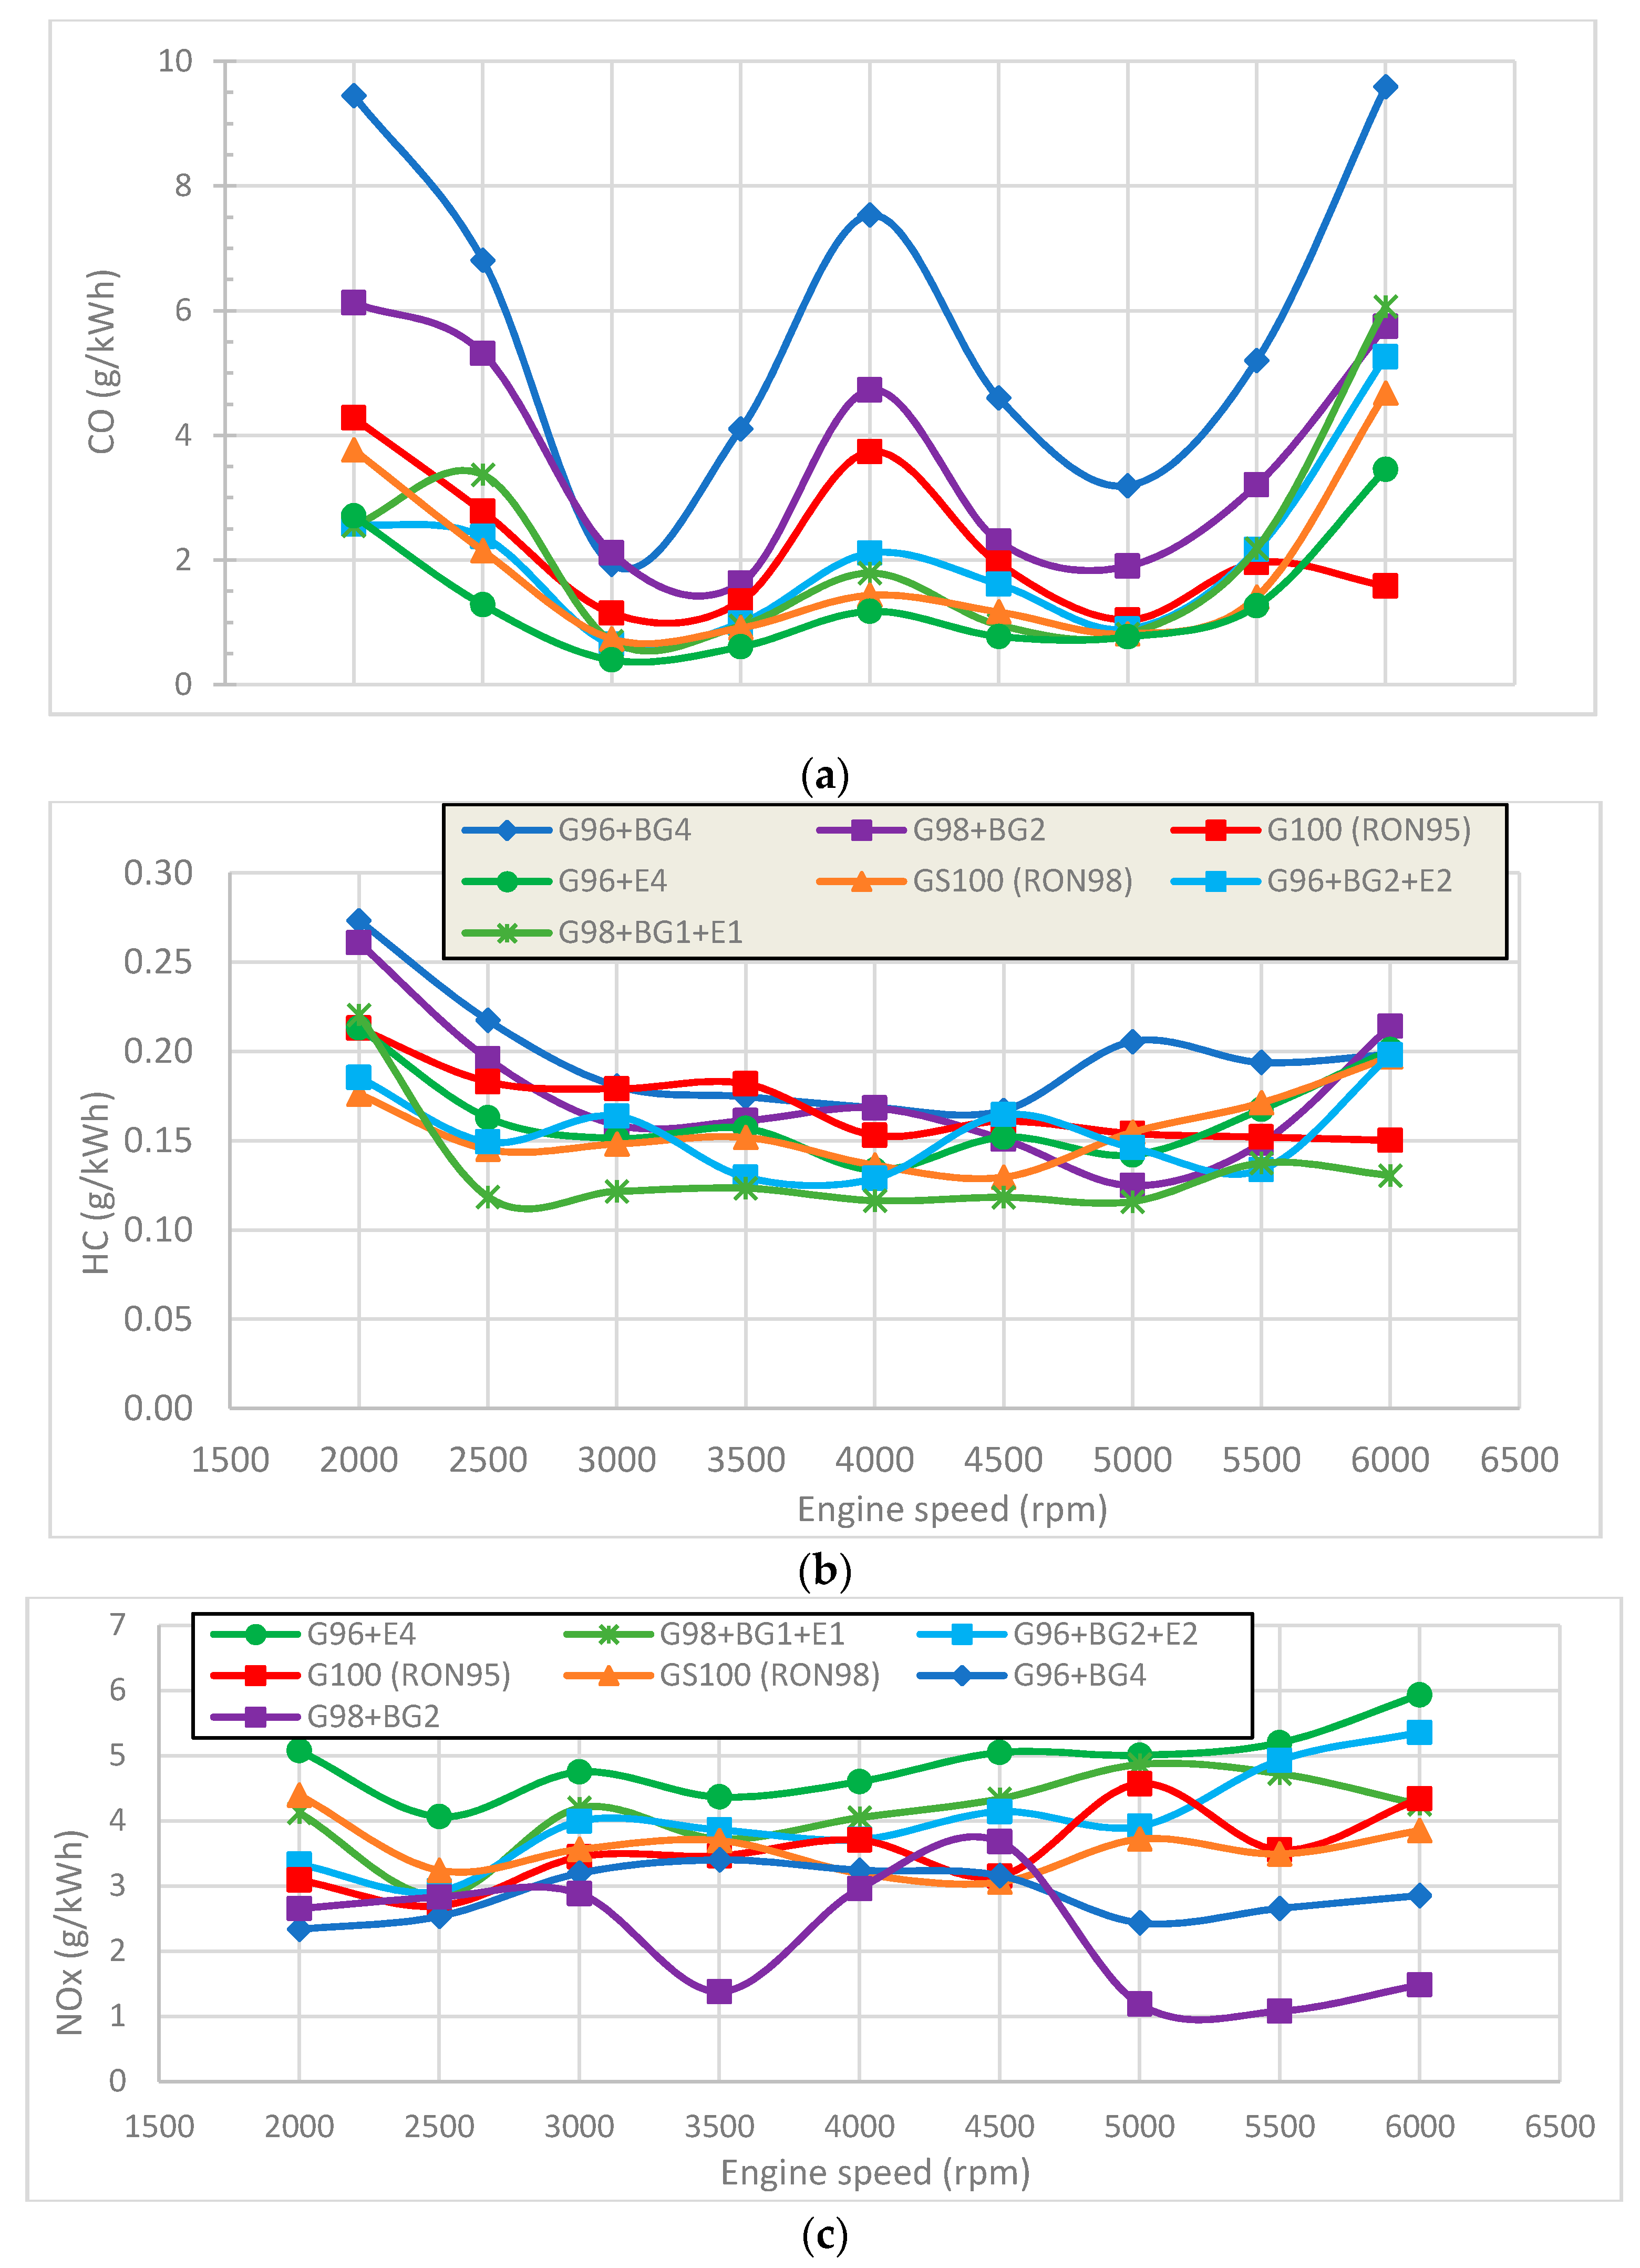
While the addition of ethanol reduced the emissions of CO and HC (G96 + E4 reduced CO by 31%), the addition of biogasoline increased them (G96 + BG4 displayed 184%/17% more CO/HC emissions than G100), indicating that further upgrading of this biofuel is needed to improve its combustion behavior. In terms of NOx, the emissions were increased when ethanol was used and reduced with the addition of biogasoline addition. This also seemed to indicate a more problematic combustion of the mixtures containing biogasoline, leading to slightly longer and cooler combustions.
The tests performed at prescribed (partial-load) torque allowed us to conclude that:
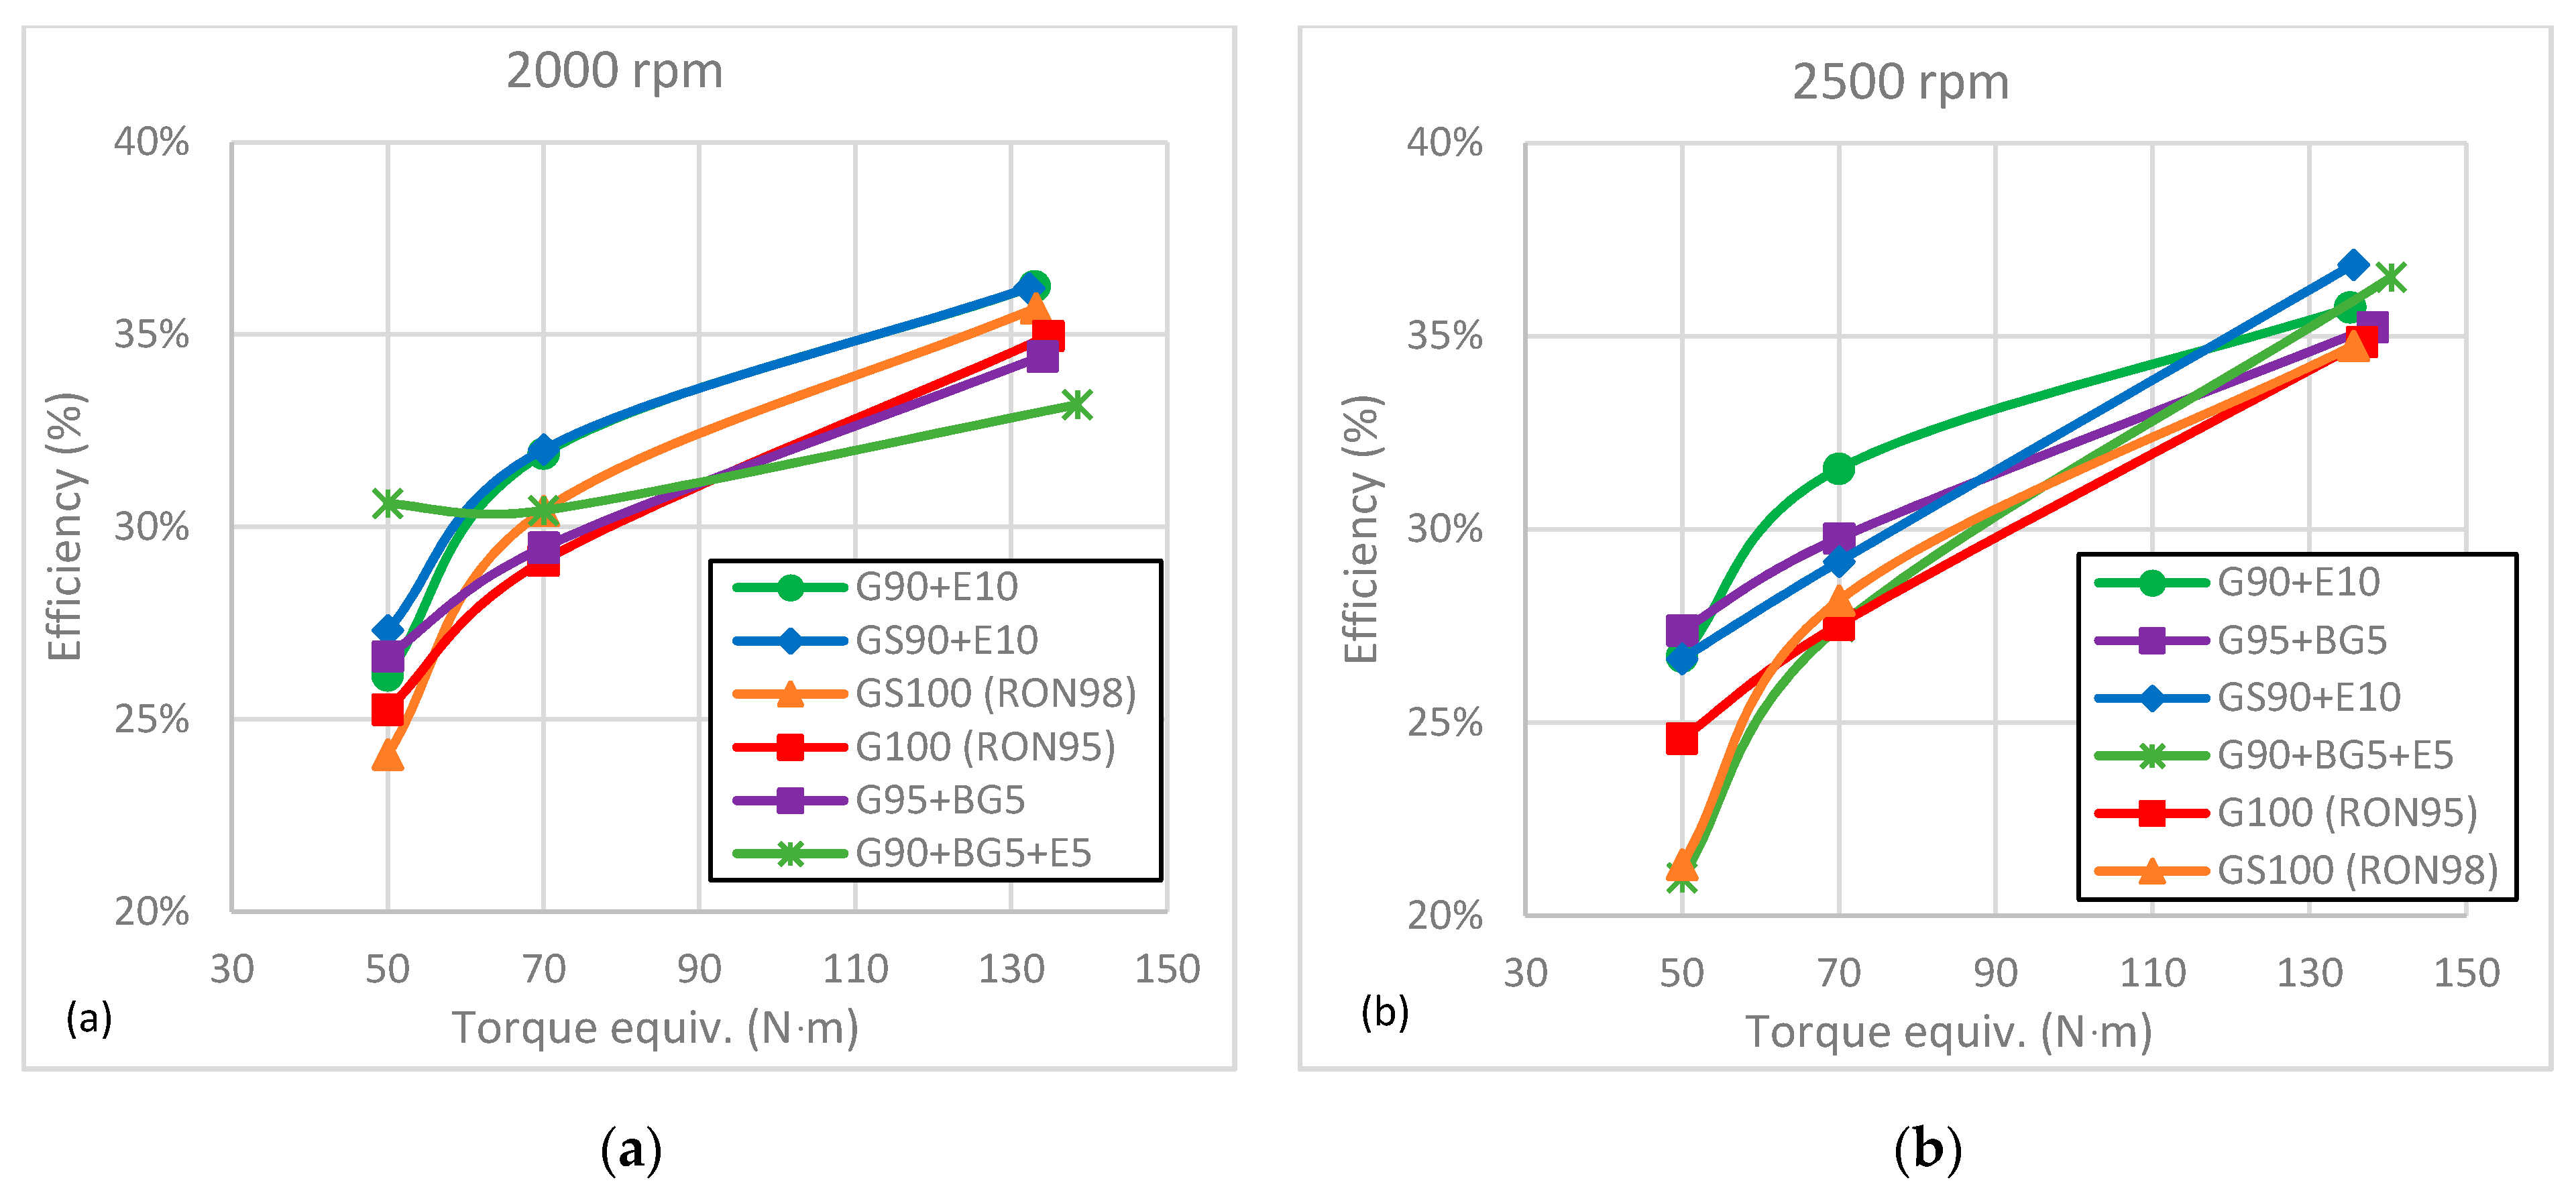
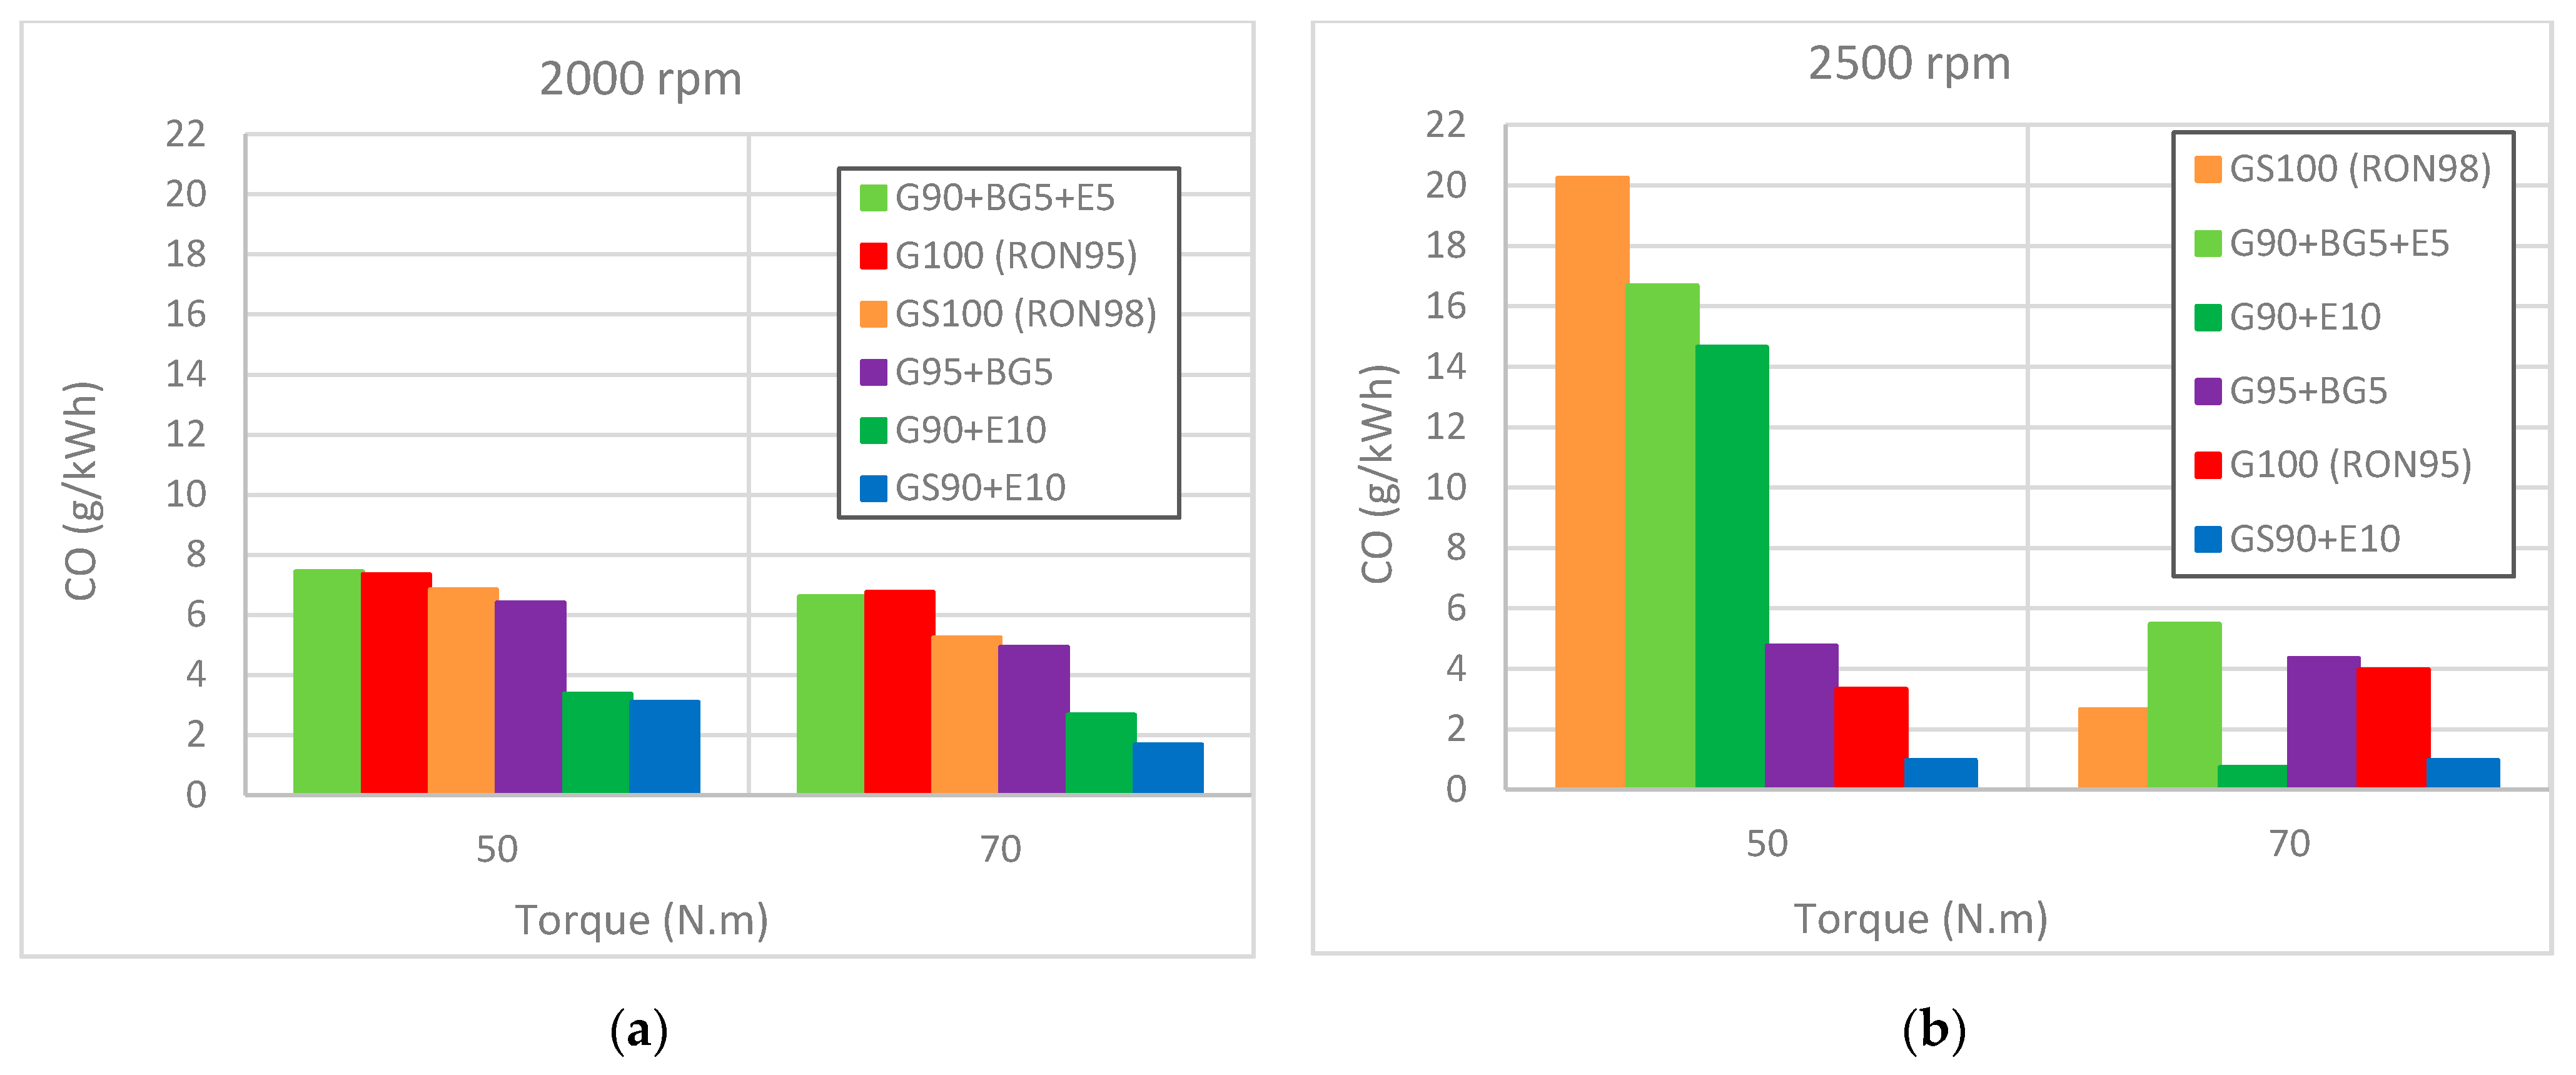
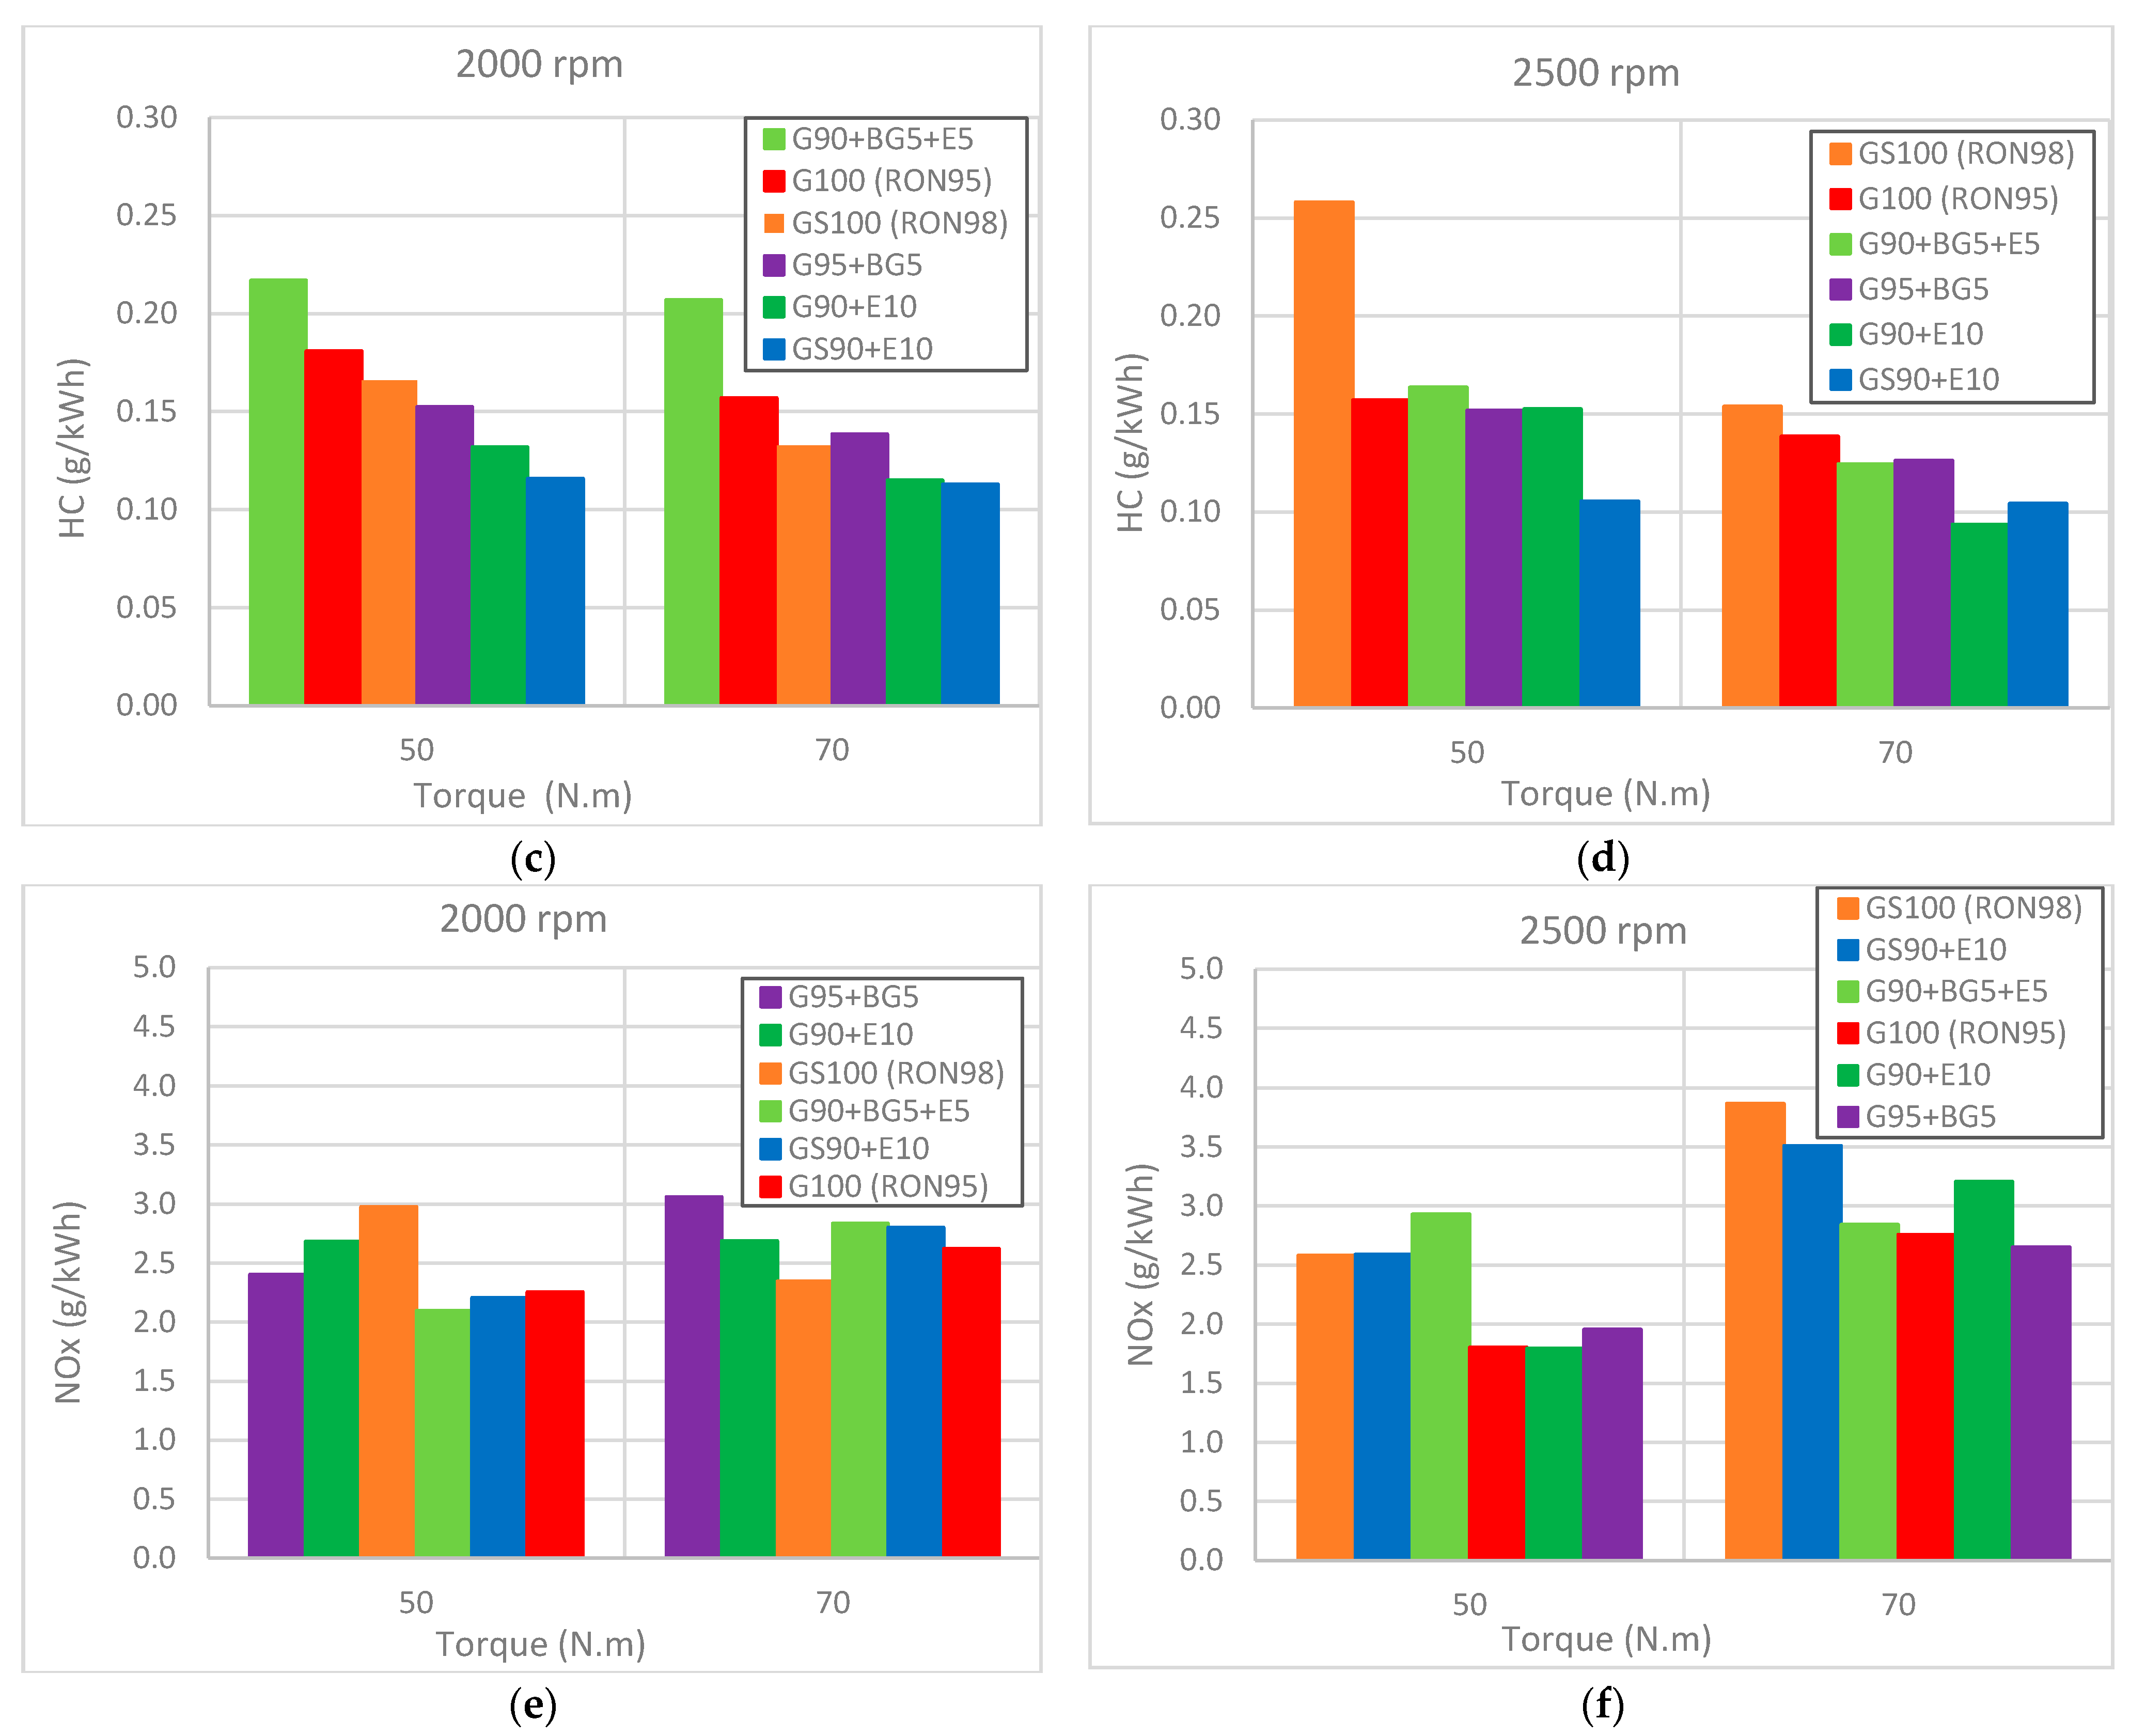
The addition of ethanol improved the efficiency of the engine at partial load (GS90 + E10 had a gain above 7%). The same, but to a lesser extent, occurred for biogasoline addition, suggesting a somewhat improved combustion with the use of these additives.
The maximum engine power and torque were obtained with G90 + BG5 + E5 at both speeds (2000 and 2500 rpm), with an average percentage increase of 0.9% for both tests. The lowest power was obtained by the GS90 + E10 and G90 + E10 mixtures, with −1% and −0.4%, respectively.
The addition of ethanol (G90 + E10 and GS90 + E10) generally reduced the emission of CO (up to 75%) and HC (up to 25%). However, the mixture with biogasoline and ethanol (G90 + BG5 + E5) generally increased the emissions of these pollutants. In terms of NOx, the data did not evidence any specific trend.
Overall, the results indicated that the use of biogasoline as an additive to gasoline was beneficial to the combustion, improving efficiency and decreasing HC and CO emissions, but at a lower level than with the use of ethanol. In terms of NOx emissions, the results were somehow inconclusive, with tests showing higher values than the base gasoline, and others displaying lower values. Although we had anticipated that the addition of biogasoline would require the addition of ethanol to maintain proper SI combustion, the data showed that there was no need for ethanol when a mixture of gasoline and biogasoline was used in this engine.
Therefore, the use of biogasoline produced from pyrolysis of low-grade vegetable oils, as an additive to pump gasoline, seems to be a viable option to diversify the available biofuels for gasoline replacement, and provides a useful application for this type of waste to avoid less-sustainable options such as landfill deposition.

Author Contributions

Conceptualization, J.M.; data curation, J.C., F.P.B., T.A. and J.M.; formal analysis: J.C. and J.M.; investigation: J.C. and L.D.; methodology: J.M. and J.C.; project administration: J.M.; resources, J.M.; supervision: J.M. and M.G. All authors have read and agreed to the published version of the manuscript.

Funding

This work was supported by FCT—Fundação para a Ciência e Tecnologia within the R&D Units, MEtRICs Project Scope: UIDP/04077/2020. Joaquim da Costa was supported through a PhD Grant from Fundo de Desenvolvimento Capital Humano of the Government of Timor Leste.

Acknowledgments

This work was supported by FCT—Fundação para a Ciência e Tecnologia within the R&D Units, MEtRICs Project Scope: UIDP/04077/2020. Joaquim da Costa was supported through a PhD Grant from Fundo de Desenvolvimento Capital Humano of the Government of Timor Leste.

Conflicts of Interest

The authors declare no conflict of interest.

References

  1. Roso, V.R.; Santos, N.D.S.A.; Alvarez, C.E.C.; Rodrigues Filho, F.A.; Pujatti, F.J.P.; Valle, R.M. Effects of mixture enleanment in combustion and emission parameters using a flex-fuel engine with ethanol and gasoline. Appl. Therm. Eng. 2019, 153, 463–472. [Google Scholar] [CrossRef]
  2. Gholizadeh, M.; Hu, X.; Liu, Q. A mini review of the specialties of the bio-oils produced from pyrolysis of 20 different biomasses. Renew. Sustain. Energy Rev. 2019, 114, 109313. [Google Scholar] [CrossRef]
  3. Fatih Demirbas, M.; Balat, M.; Balat, H. Biowastes-to-biofuels. Energy Convers. Manag. 2011, 52, 1815–1828. [Google Scholar] [CrossRef]
  4. European Commmission Commission Delegated Regulation Supplementing Regulation (EU) 2016/1628 of the European Parliament and of the Council with Regard to Technical and General Requirements Relating to Emission Limits and Type-Approval for Internal Combustion Engines for Non-R. 2016. Available online: https://eur-lex.europa.eu/legal-content/EN/TXT/PDF/?uri=CELEX:32016R1628&from=LV (accessed on 20 August 2021).
  5. Valeika, G.; Matijošius, J.; Górski, K.; Rimkus, A.; Smigins, R. A Study of Energy and Environmental Parameters of a Diesel Engine Running on Hydrogenated Vegetable Oil (HVO) with Addition of Biobutanol and Castor Oil. Energies 2021, 14, 3939. [Google Scholar] [CrossRef]
  6. Bertero, M.; De La Puente, G.; Sedran, U. Fuels from bio-oils: Bio-oil production from different residual sources, characterization and thermal conditioning. Fuel 2012, 95, 263–271. [Google Scholar] [CrossRef]
  7. Yang, H.; Yao, J.; Chen, G.; Ma, W.; Yan, B.; Qi, Y. Overview of upgrading of pyrolysis oil of biomass. Energy Procedia 2014, 61, 1306–1309. [Google Scholar] [CrossRef] [Green Version]
  8. Sarathy, S.M.; Farooq, A.; Kalghatgi, G.T. Recent progress in gasoline surrogate fuels. Prog. Energy Combust. Sci. 2018, 65, 67–108. [Google Scholar] [CrossRef]
  9. Krutof, A.; Hawboldt, K. Blends of pyrolysis oil, petroleum, and other bio-based fuels: A review. Renew. Sustain. Energy Rev. 2016, 59, 406–419. [Google Scholar] [CrossRef]
  10. Silva, R.V.S.; Pereira, V.B.; Stelzer, K.T.; Almeida, T.A.; Romeiro, G.A.; Azevedo, D.A. Comprehensive study of the liquid products from slow pyrolysis of crambe seeds: Bio-oil and organic compounds of the aqueous phase. Biomass Bioenergy 2019, 123, 78–88. [Google Scholar] [CrossRef]
  11. Kaewpengkrow, P.; Atong, D.; Sricharoenchaikul, V. Selective catalytic fast pyrolysis of Jatropha curcas residue with metal oxide impregnated activated carbon for upgrading bio-oil. Int. J. Hydrogen Energy 2017, 42, 18397–18409. [Google Scholar] [CrossRef]
  12. Arpa, O.; Yumrutas, R.; Alma, M.H. Effects of turpentine and gasoline-like fuel obtained from waste lubrication oil on engine performance and exhaust emission. Energy 2010, 35, 3603–3613. [Google Scholar] [CrossRef]
  13. Shirazi, S.A.; Abdollahipoor, B.; Windom, B.; Reardon, K.F.; Foust, T.D. Effects of blending C3-C4 alcohols on motor gasoline properties and performance of spark ignition engines: A review. Fuel Process. Technol. 2020, 197, 106194. [Google Scholar] [CrossRef]
  14. Murphy, F.; McDonnell, K.; Butler, E.; Devlin, G. The evaluation of viscosity and density of blends of Cyn-diesel pyrolysis fuel with conventional diesel fuel in relation to compliance with fuel specifications en 590:2009. Fuel 2012, 91, 112–118. [Google Scholar] [CrossRef] [Green Version]
  15. Zaharin, M.S.M.; Abdullah, N.R.; Masjuki, H.H.; Ali, O.M.; Najafi, G.; Yusaf, T. Evaluation on physicochemical properties of iso-butanol additives in ethanol-gasoline blend on performance and emission characteristics of a spark-ignition engine. Appl. Therm. Eng. 2018, 144, 960–971. [Google Scholar] [CrossRef]
  16. Mofijur, M.; Rasul, M.G.; Hyde, J.; Azad, A.K.; Mamat, R.; Bhuiya, M.M.K. Role of biofuel and their binary (diesel-biodiesel) and ternary (ethanol-biodiesel-diesel) blends on internal combustion engines emission reduction. Renew. Sustain. Energy Rev. 2016, 53, 265–278. [Google Scholar] [CrossRef] [Green Version]
  17. Schirmer, W.N.; Olanyk, L.Z.; Guedes, C.L.B.; Quessada, T.P.; Ribeiro, C.B.; Capanema, M.A. Effects of air/fuel ratio on gas emissions in a small spark-ignited non-road engine operating with different gasoline/ethanol blends. Environ. Sci. Pollut. Res. 2017, 24, 20354–20359. [Google Scholar] [CrossRef]
  18. Ribeiro, C.B.; Martins, K.G.; Gueri, M.V.D.; Pavanello, G.P.; Schirmer, W.N. Effect of anhydrous ethanol/gasoline blends on performance and exhaust emissions of spark-ignited non-road engines. Environ. Sci. Pollut. Res. 2018, 25, 24192–24200. [Google Scholar] [CrossRef] [Green Version]
  19. Martins, J. Motores de Combustão Interna, 4th ed.; Publindústria: Porto, Portugal, 2013. [Google Scholar]
  20. Al-Hasan, M. Effect of ethanol-unleaded gasoline blends on engine performance and exhaust emission. Energy Convers. Manag. 2003, 44, 1547–1561. [Google Scholar] [CrossRef]
  21. Hsieha, W.-D.; Chenb, R.-H.; Wub, T.-L. Engine performance and pollutant emission of an SI engine using ethanol–gasoline blended fuels. Atmos. Environ. 2002, 36, 403–410. [Google Scholar] [CrossRef]
  22. Balki, M.K.; Sayin, C.; Canakci, M. The effect of different alcohol fuels on the performance, emission and combustion characteristics of a gasoline engine. Fuel 2014, 115, 901–906. [Google Scholar] [CrossRef]
  23. Warguła, Ł.; Waluś, K.J.; Krawiec, P.; Polasik, J. Analysis of the Influence of Disturbance of Vacuum Stream Signal on Steering Process of the Spark-ignition Combustion Engine. Procedia Eng. 2017, 177, 399–404. [Google Scholar] [CrossRef]
  24. Warguła, Ł.; Waluś, K.J.; Krawiec, P.; Kukla, M. Research of the ignition advance angle characteristics on the example of a German GX 390 combustion engine. Autobusy Tech. Eksploat. Syst. Transp. 2017, 18, 1387–1391. [Google Scholar]
  25. Ferreira, V.P.; Martins, J.; Torres, E.A.; Pepe, I.M.; De Souza, J.M.S.R. Performance and emissions analysis of additional ethanol injection on a diesel engine powered with A blend of diesel-biodiesel. Energy Sustain. Dev. 2013, 17, 649–657. [Google Scholar] [CrossRef]
  26. Liu, J.; Yang, J.; Sun, P.; Gao, W.; Yang, C.; Fang, J. Compound combustion and pollutant emissions characteristics of a common-rail engine with ethanol homogeneous charge and polyoxymethylene dimethyl ethers injection. Appl. Energy 2019, 239, 1154–1162. [Google Scholar] [CrossRef]
  27. Wong, K.I.; Wong, P.K. Adaptive air-fuel ratio control of dual-injection engines under biofuel blends using extreme learning machine. Energy Convers. Manag. 2018, 165, 66–75. [Google Scholar] [CrossRef]
  28. Kan, T.; Strezov, V.; Evans, T.J. Lignocellulosic biomass pyrolysis: A review of product properties and effects of pyrolysis parameters. Renew. Sustain. Energy Rev. 2016, 57, 1126–1140. [Google Scholar] [CrossRef]
  29. Martins, J.; Costa, J.; Gonçalves, M.; Brito, F.P.; Durão, L. Performance of binary and ternary blends of gasoline, pyrogasoline and ethanol in spark ignition engines. Prog. Ind. Ecol. Int. J. 2021, 1, 1. [Google Scholar] [CrossRef]
  30. Naggar, A.Y.E.; Elkhateeb, A.; Altalhi, T.A.; El Nady, M.M.; Alhadhrami, A.; Ebiad, M.A.; Salem, A.A.; Elhardallou, S.B. Hydrocarbon compositions and physicochemical characteristics for the determination of gasoline quality: An implication from gas chromatographic fingerprints. Energy Sources Part A Recover. Util. Environ. Eff. 2017, 39, 1694–1699. [Google Scholar] [CrossRef]
  31. Mourad, M.; Mahmoud, K. Investigation into SI engine performance characteristics and emissions fuelled with ethanol/butanol-gasoline blends. Renew. Energy 2019, 143, 762–771. [Google Scholar] [CrossRef]
  32. de Oliveira, A.; de Morais, A.M.; Valente, O.S.; Sodré, J.R. Combustion, performance and emissions of a diesel power generator with direct injection of B7 and port injection of ethanol. J. Braz. Soc. Mech. Sci. Eng. 2017, 39, 1087–1096. [Google Scholar] [CrossRef]
  33. Ağbulut, Ü.; Sarıdemir, S.; Albayrak, S. Experimental investigation of combustion, performance and emission characteristics of a diesel engine fuelled with diesel–biodiesel–alcohol blends. J. Braz. Soc. Mech. Sci. Eng. 2019, 41. [Google Scholar] [CrossRef]
Figure 1. (a) Spark-ignition injection engine test on the dynamometer, and (b) emissions analyzer.
Energies 14 05209 g001
Figure 2. (a) Engine management unit (EMU/ECU), and (b) volumetric efficiency map.
Energies 14 05209 g002
Figure 3. Electronic weighing scale (a) and data acquisition (LabVIEW) (b).
Energies 14 05209 g003
Figure 4. Torque and ignition advance (a), and power (compared to G100) (b) as a function of engine speed for different fuels for maximum engine load (WOT).
Energies 14 05209 g004aEnergies 14 05209 g004b
Figure 5. Efficiency as a function of engine speed for different fuels at maximum engine load (WOT).
Energies 14 05209 g005
Figure 6. (a) Specific CO, (b) HC, and (c) NOx as a function of engine speed for different fuels at maximum engine load (WOT).
Energies 14 05209 g006
Figure 7. Efficiency as a function of torque load (prescribed torque/WOT) for (a) 2000 rpm and (b) 2500 rpm.
Energies 14 05209 g007
Figure 8. CO (a,b), HC (c,d), and NOx (e,f) as a function of torque load (prescribed torque) for 2000 rpm (a,c,e) and 2500 rpm (b,d,f).
Energies 14 05209 g008aEnergies 14 05209 g008b
Table 1. Composition and properties of the fuels tested.
Fuelsρ (kg/m3)Elementary Composition (% m/m)pH
CHNSO
RON95 gasoline75086.212.40.00.01.4-
RON98 gasoline75084.512.50.00.03.3-
Biogasoline85083.113.60.00.03.34.5
Ethanol 99%80051.514.20.00.038.8-
Table 2. Compositions of the various fuel mixtures used for the WOT-only tests.
TestName of the Fuel Blend Gasoline RON95 (G)Gasoline RON98 (GS)Biogasoline (BG)Ethanol (E)CO2 Reduction (gCO2/L)
1G100 (RON95)100% 0
2GS100 (RON98) 100% 0
3G98 + BG298% 2% 47.9
4G96 + BG496% 4% 95.7
5G98 + BG1 + E198% 1%1%47.9
6G96 + BG2 + E296% 2%2%95.7
7G96 + E496% 4%95.7
Table 3. Compositions of the various fuel mixtures used for the prescribed torque and WOT tests.
TestName of the Fuel MixtureGasoline RON95 (G)Gasoline RON98 (GS)Biogasoline (BG)Ethanol (E)CO2 Reduction (gCO2/L)
WOT, 70 Nm, 50 NmG100 (RON95)100% 0
GS100 (RON98) 100% 0
G90 + E1090% 10%239.3
GS90 + E10 90% 10%239.3
G95 + BG595% 5% 119.6
G90 + BG5 + E590% 5%5%239.3
Table 4. Test operating conditions for the WOT and prescribed torque-load tests.
Engine Speed: WOT2000, 2500, 3000, 3500, 4000, 4500, 5000, 5500, 6000 rpm
Engine speed: prescribed torque2000, 2500 rpm
Lambda map settingStoichiometric
Ignition map settingSet for MBT or knock onset
Engine loadWOT and prescribed torque (50 Nm and 70 Nm)
Table 5. Specifications of the PSA (Peugeot/Citroën) gasoline engine.
Model of EngineTU5JP4—Spark Ignition, Atmospheric
No. of cylinders4
Fuel delivery Multipoint injection (MPI)
Displacement (cm3)1587
Maximum power (kW/HP)88/118 at 6600 rpm
Maximum torque (N·m)145 at 6600 rpm
ValvetrainDOHC (dual overhead camshaft), 16 valves
Compression ratio10.8:1
Table 6. Emission measurement range of the AVL DIGAS 4000 LIGHT gas analyser.
EmissionMeasurement RangeResolution
CO0–10% vol.0.01% vol.
HC0–20,000 ppm1 ppm
NOx0–5000 ppm1 ppm
Lambda0–99990.001
Table 7. Heating values and air–fuel ratios for the fuel test.
FuelsHHV (MJ/kg)LHV (MJ/kg)AFR Stoich
RON95 gasoline46.844.114.06
RON98 gasoline46.043.313.82
Biogasoline47.144.214.03
Ethanol 99%27.925.08.99
Table 8. AFR for each fuel and fuel blend (for stoichiometric conditions).
Fuel BlendsAFR Fuel BlendLHV Fuel Blend
Pure Fuels
RON95 (G100)14.0644.1
RON98 (GS100)13.8243.3
Biogasoline (BG100)14.0344.2
Ethanol 99% (E100) 8.9925.0
WOT Tests
G96 + E413.8643.34
G98 + BG214.0644.10
G96 + BG414.0644.10
G98 + BG1 + E114.0143.91
G96 + BG2 + E213.9643.72
Prescribed Torque Tests
G90 + E1013.5542.19
GS90 + E1013.3441.47
G95 + BG514.0644.11
G90 + BG5 + E513.8143.15
Publisher’s Note: MDPI stays neutral with regard to jurisdictional claims in published maps and institutional affiliations.

